Cross-species analysis defines the conservation of anatomically segregated VMH neuron populations
- Department of Internal Medicine, University of Michigan, United States
- Oregon National Primate Research Center, United States
- Novo Nordisk Research Center, United States
- Department of Pediatrics, University of Michigan, United States
Abstract
The ventromedial hypothalamic nucleus (VMH) controls diverse behaviors and physiologic functions, suggesting the existence of multiple VMH neural subtypes with distinct functions. Combing translating ribosome affinity purification with RNA-sequencing (TRAP-seq) data with single-nucleus RNA-sequencing (snRNA-seq) data, we identified 24 mouse VMH neuron clusters. Further analysis, including snRNA-seq data from macaque tissue, defined a more tractable VMH parceling scheme consisting of six major genetically and anatomically differentiated VMH neuron classes with good cross-species conservation. In addition to two major ventrolateral classes, we identified three distinct classes of dorsomedial VMH neurons. Consistent with previously suggested unique roles for leptin receptor (Lepr)-expressing VMH neurons, Lepr expression marked a single dorsomedial class. We also identified a class of glutamatergic VMH neurons that resides in the tuberal region, anterolateral to the neuroanatomical core of the VMH. This atlas of conserved VMH neuron populations provides an unbiased starting point for the analysis of VMH circuitry and function.
Introduction
The ventromedial hypothalamic nucleus (VMH, which primarily contains glutamatergic neurons) plays important roles in a variety of metabolic responses and in the control of behaviors relevant to panic, reproduction, and aggression. The VMH contains several anatomic subdivisions, including the dorsomedial and central VMH (VMHDM and VMHC, respectively, which control autonomic outputs and behavioral responses to emergencies; Lindberg et al., 2013; Vander Tuig et al., 1982), and the ventrolateral VMH (VMHVL; known for roles in sexual and social behaviors; Hashikawa et al., 2017; Krause and Ingraham, 2017). The predominantly GABAergic tuberal region of the hypothalamus lies anterolateral to the core of the VMH.
Each VMH subdivision mediates a variety of outputs and thus presumably contains multiple functionally distinct cell types. For example, activating adult Nr5a1-expressing VMH neurons (which includes most cells in the VMHDM and VMHC) promotes panic-related behaviors, augments hepatic glucose output to increase blood glucose, and elevates energy expenditure (Meek et al., 2016, 201; Flak et al., 2020; Kunwar et al., 2015). In contrast, activating the subset of VMHDM cells that expresses leptin receptor (Lepr, which encodes the receptor for the adipose-derived, energy balance-controlling hormone, leptin; Chen et al., 1996; Tartaglia et al., 1995) promotes energy expenditure without altering these other parameters (Sabatini et al., 2021; Meek et al., 2013; Meek et al., 2016). Hence, each VMH subregion may contain multiple discrete neuron populations that mediate unique functions.
To date, most analyses of VMH function have utilized Nr5a1 or candidate markers that do not necessarily align with functionally and/or transcriptionally unique VMH cell types (Bingham et al., 2006). Thus, to understand VMH-controlled responses, we must use unbiased methods to define discrete subpopulations of VMH neurons, along with markers that permit their selective manipulation. Single-cell approaches (such as single-nucleus RNA-sequencing [snRNA-seq]) can identify neuronal populations in an unbiased manner and have previously suggested parceling schemes for neurons in many brain areas, including the VMH (Kim et al., 2019; Campbell et al., 2017; Habib et al., 2017). Many such analyses define large numbers of highly interrelated cell populations of unclear functional significance and conservation, however (Kim et al., 2019; Chen et al., 2017; Lam et al., 2017). Determining functions for dozens of cell populations that lie in the same anatomic region and which possess overlapping gene expression profiles (i.e., that do not contain unique marker genes) would represent a daunting task.
In the present study we use translating ribosome affinity purification with RNA-sequencing (TRAP-seq) in mice together with snRNA-seq of mouse and macaque VMH neurons to define transcriptionally unique, anatomically discrete, conserved, and genetically tractable classes of VMH neurons. These include a distinct Lepr-expressing VMH neuron class, along with a set of glutamatergic VMH neurons that resides in the tuberal region. These findings define a starting point for the comprehensive analysis of VMH circuitry and function.
Results
Combining snRNA-seq with Nr5a1-directed TRAP-seq defines mouse VMH neuron populations
To define neuronal populations within the mouse VMH in an unbiased manner, we microdissected the VMH of mice and subjected 10 individual tissue samples to snRNA-seq using the 10× Genomics platform (Figure 1A), collecting a total of 42,040 nuclei that passed quality control (Figure 1—figure supplement 1A–C). The recovered nuclei included all major CNS cell types (Figure 1—figure supplement 1, see Materials and methods for clustering and cell-type identification details), including 21,585 neurons that comprised 37 distinct neuronal populations (Figure 1B,C).
Figure 1 with 1 supplement see all

Identification of ventromedial hypothalamic nucleus (VMH) neurons from mice.
(A) Schematic of VMH isolation and single-cell sequencing protocol. (B) UMAP of 21,585 neuronal nuclei colored and labeled by cluster designation. (C) Expression profile of the top enriched genes for each cluster (colored on bottom), including GABAergic (Gad1) and glutamatergic (Slc17a6) markers. (D) Expression of Nr5a1 and Fezf1 in individual cells in UMAP space. (E) Nr5a1-Cre translating ribosome affinity purification with RNA-sequencing (TRAP-seq) overview. Nr5a1-Cre mice were crossed with ROSA26eGFP-L10a mice, resulting in VMH-restricted eGFP-L10a expression. Representative image shows GFP-IR (black) in a coronal section from these mice. (F) TRAP-seq revealed the enrichment of thousands of genes (including Nr5a1 and Fezf1) in these cells relative to non-TRAP material. (G) Expression profile of the top enriched genes from Nr5a1-Cre TRAP-seq across clusters; gray box indicates presumptive VMH cells. (H) Magnitude of the first principal component after performing principal components analysis for the genes enriched in Nr5a1-Cre TRAP-seq. (I) Venn diagram of genes enriched in Nr5a1-Cre TRAP-seq (TRAP enriched), in single-nucleus RNA-sequencing (snRNA-seq) VMH pseudo-TRAP (pseudo-TRAP enriched), or both (common). Number in parentheses refers to the number of genes in each category. (J) Histograms of expression level for genes by enrichment gene set in each dataset (Nr5a1-Cre TRAP-seq or snRNA-seq). (K) Mean scaled expression for each cluster for the top genes enriched in Nr5a1-Cre TRAP-seq.
Many adult VMH neurons express Nr5a1 (which encodes the transcription factor, SF1; Cheung et al., 2013) and/or Fezf1 (Kurrasch et al., 2007), whose detection was restricted to a confined cluster of neurons in UMAP space (Figure 1D). Although essentially all VMH neurons express Nr5a1 during development, only a subset of VMH cells express Nr5a1 and/or Fezf1 in adult animals (Cheung et al., 2013; Kurrasch et al., 2007). Furthermore, the inherent noise in snRNA-seq data risks false positives and negatives when using only one or two genes for cell-type identification. To ensure that we identified all VMH cell groups for our analysis, we performed TRAP-seq using Nr5a1-Cre;Rosa26eGFP-L10a mice, in which the early developmental expression of Nr5a1-Cre promotes the permanent expression of tagged ribosomes across the VMH (Figure 1E). TRAP-seq identified 4492 transcripts significantly enriched in cells marked by the developmental expression of Nr5a1, including Nr5a1 and Fezf1 (Figure 1F, Supplementary file 1). Applying this broader VMH-enriched transcriptome to our snRNA-seq clusters revealed six populations of neurons (clusters 6–11; corresponding to the populations with highest Nr5a1 and Fezf1 expression) that contain VMH neurons (Figure 1G,H). Importantly, Nr5a1-negative cells (clusters 6 and 7) were identified as VMH by their enrichment of Nr5a1-Cre TRAP-seq genes (Figure 1H), suggesting they were developmentally labeled by Nr5a1-Cre; these cells presumably reside in the VMHVL (which expresses Nr5a1 during development, but not in adulthood).
To compare TRAP-seq and snRNA-seq results, we performed ‘pseudo-TRAP’ on pseudobulk samples of our snRNA-seq data, aggregated by cell type (i.e., VMH clusters vs. non-VMH clusters; see Supplementary file 2 for enrichment results). While many genes were enriched in both datasets (1977), more were specific to one method (Figures 1I, 2354 genes specific to TRAP and 2828 specific to pseudo-TRAP). Notably, enrichment was largely a function of expression level: the genes that were enriched in both datasets were highly expressed in both, while the genes that were specific to TRAP or pseudo-TRAP were highly expressed in their enriched dataset, but expressed at lower levels in the other (Figure 1J). This suggests that the two methods may illuminate partially distinct aspects of the transcriptome—TRAP-seq for ribosome-associated genes and snRNA-seq for nuclear-enriched and nascent transcripts—and that their combined use provides a more comprehensive view of cellular state. Finally, many of the genes enriched in both datasets were limited to one or a few populations, highlighting the heterogeneity of gene expression across VMH cell types, even for prominent VMH marker genes (Figure 1K).
Figure 2 with 6 supplements see all
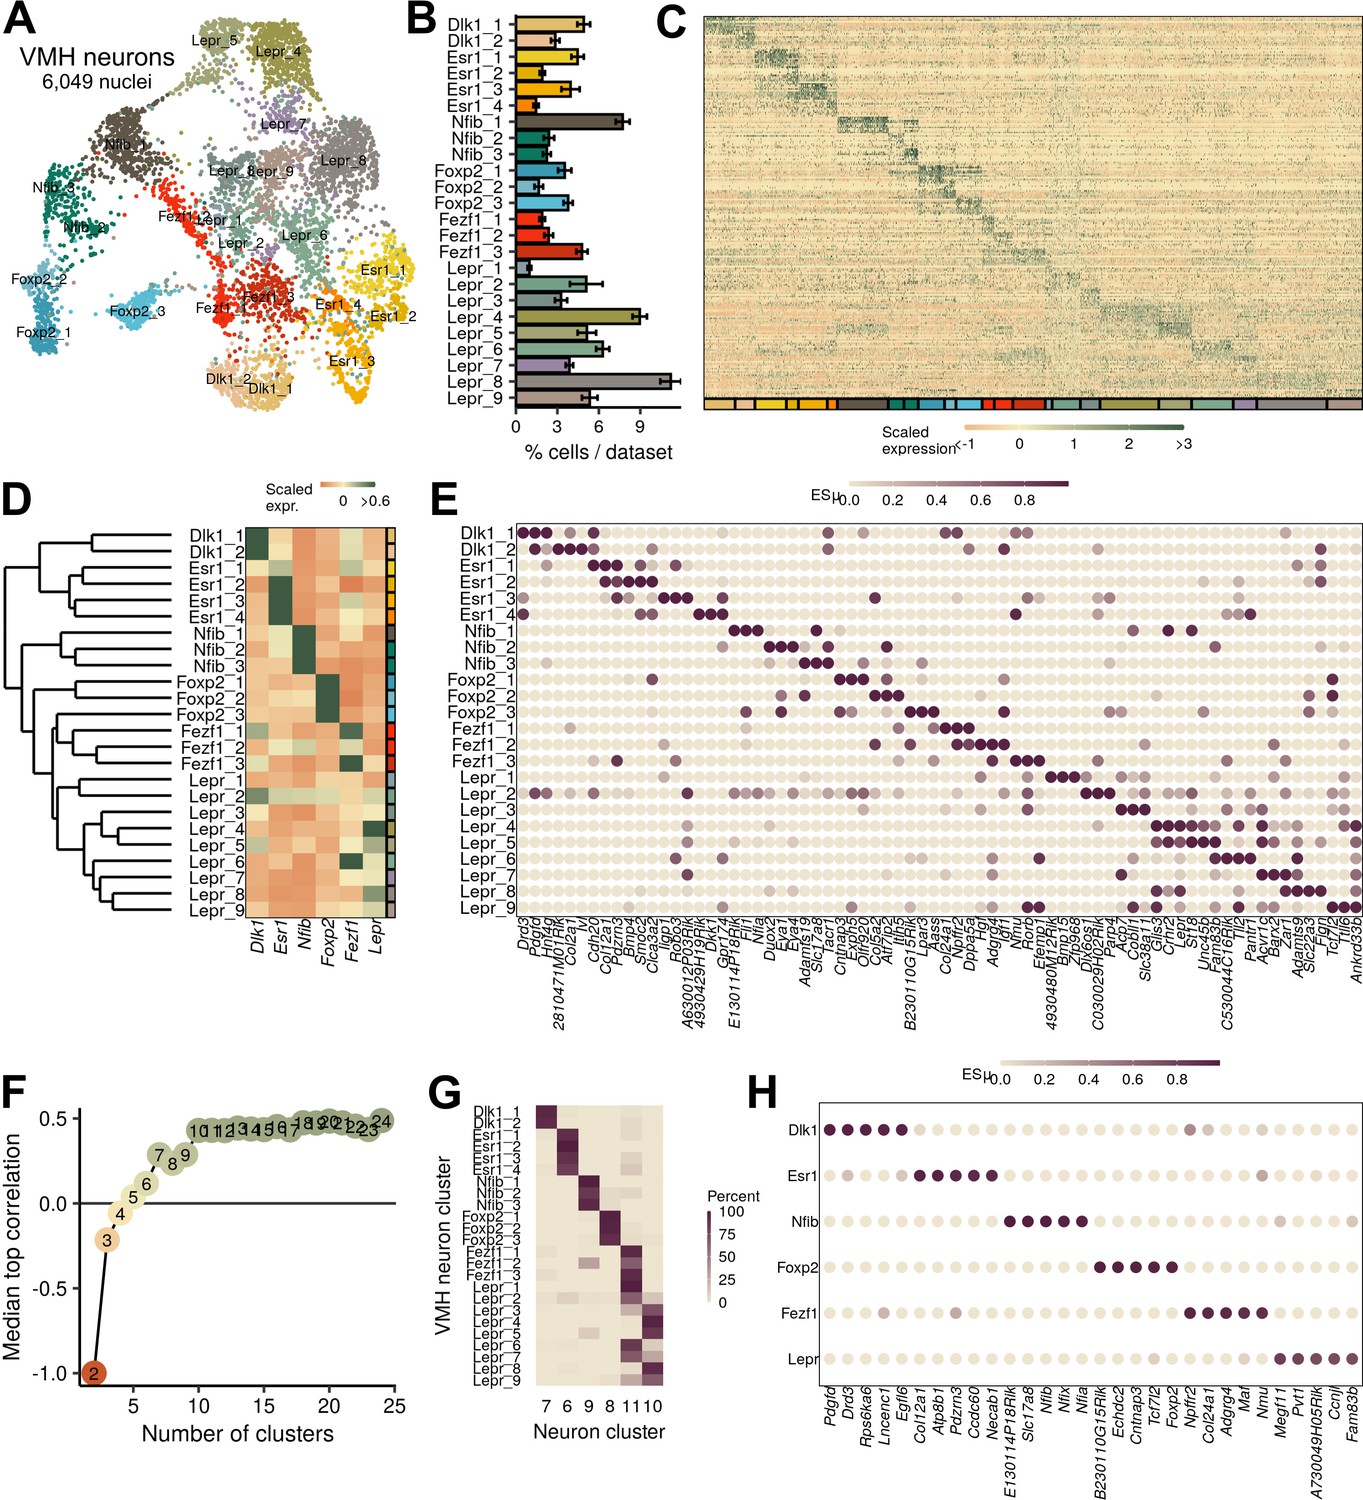
Ventromedial hypothalamic nucleus (VMH) neuronal populations can be grouped into six major classes.
(A) UMAP of 6049 VMH neurons colored and labeled by cluster designation. (B) Prevalence of clusters across samples, mean ± SEM. (C) Expression profile of the top enriched genes for each cluster. (D) Hierarchical clustering and mean expression of marker genes for each class of neurons. (E) ESµ for the top three marker genes for each population determined by CELLEX. (F) Median maximal pairwise expression correlation for each cut of the hierarchical tree resulting in 2–24 clusters. (G) Percent of cells in each VMH cluster that correspond to each neuronal cluster (from Figure 1). (H) ESµ for the top five marker genes for each major class determined by CELLEX.
Figure 3 with 1 supplement see all
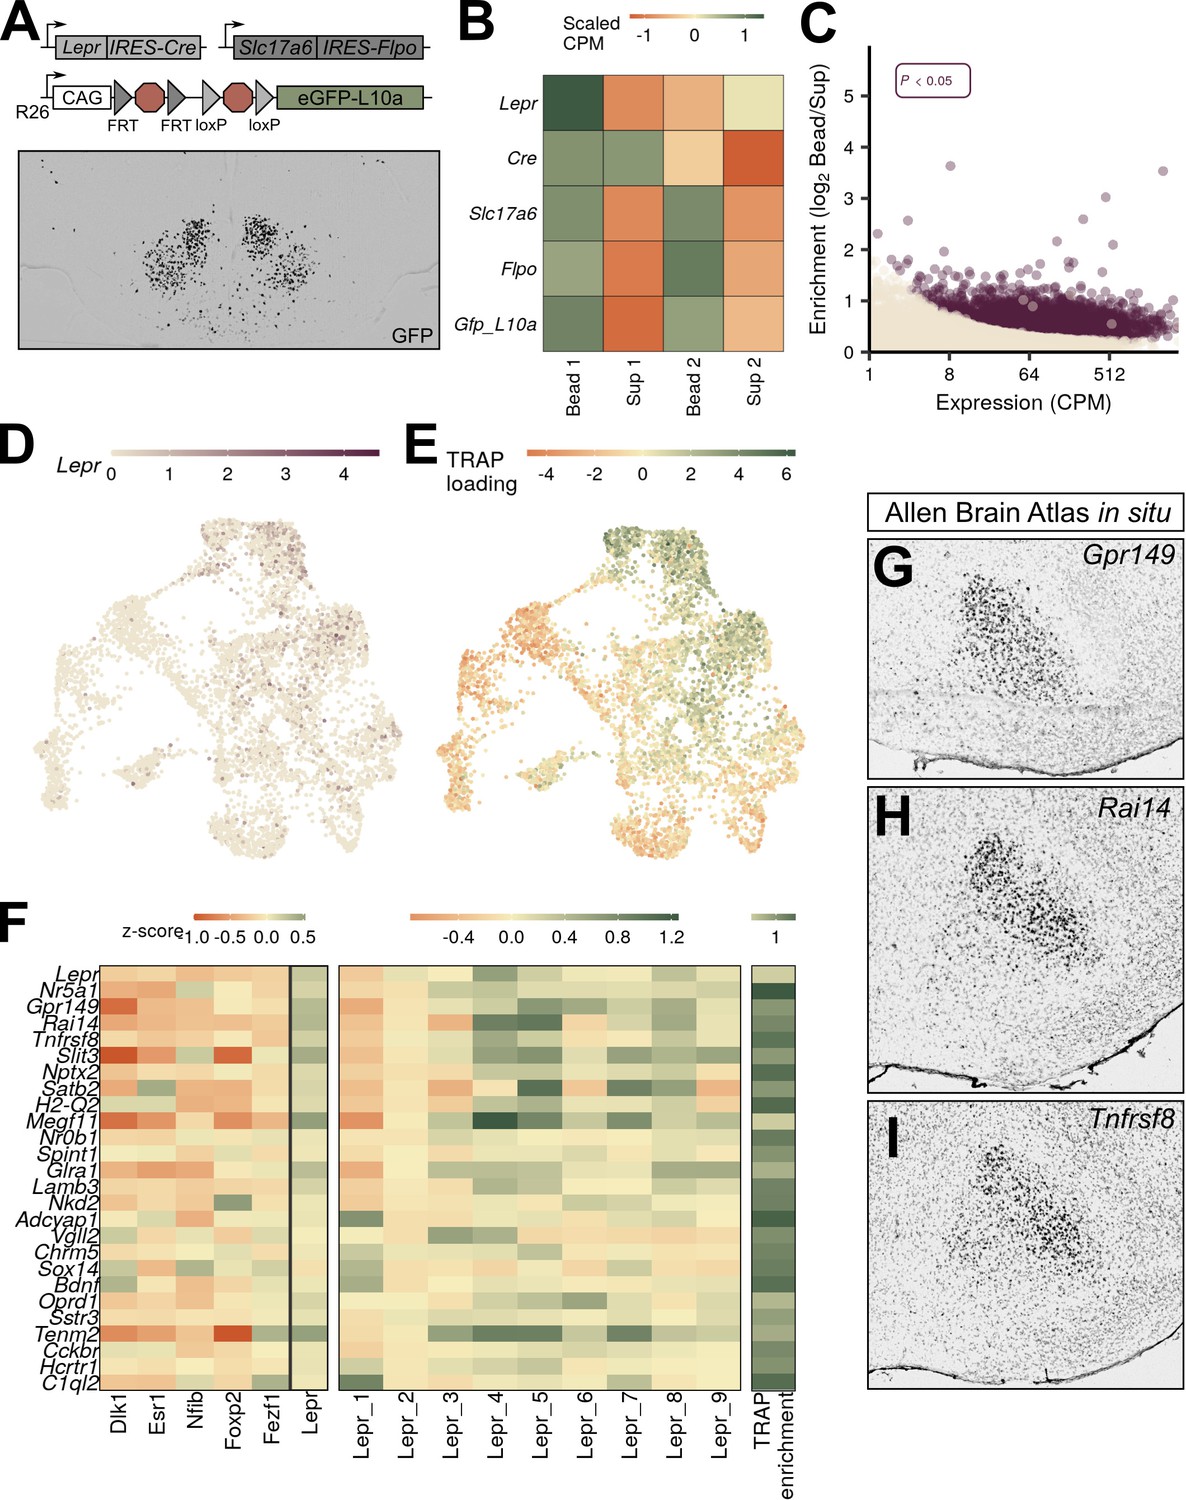
VMHLepr neurons represent a distinct class of ventromedial hypothalamic nucleus (VMH) neurons.
(A) Diagram of strategy to transcriptionally profile the VMHLepr neurons by crossing LeprCre and Slc17a6Flpo to a mouse line in which the ROSA26 (R26) locus contains a CAG-driven, Flp- and Cre-dependent eGFP:L10a allele (RCFLeGFP-L10a). (Below) A representative image of GFP-IR (black) expression in LeprCre;Slc17a6Flpo;RCFLeGFP-L10a (LeprSlc17a6-L10a) mice. (B) Scaled counts per million (CPM) for each gene in LeprSlc17a6-L10a mice. (C) Expression and enrichment of genes from LeprSlc17a6-L10a VMH pulldown. (D) Expression of Lepr in individual VMH neurons in UMAP space. (E) Magnitude of the first principal component after performing principal components analysis for the genes enriched in LeprSlc17a6-L10a VMH translating ribosome affinity purification with RNA-sequencing (TRAP-seq), projected into UMAP space. (F) Mean class expression (left), Lepr cluster expression (center), and LeprSlc17a6-L10a TRAP-seq enrichment (right) of the top genes unique to the VMHLepr population by both TRAP and pseudo-TRAP. (G–I) Sagittal Allen Brain Atlas in situ images for (G) Gpr149, (H) Rai14, and (I) Tnfrsf8; all probes shown in black.
To understand the landscape of mouse VMH neuron populations in more detail, we subjected the VMH neurons in clusters 6–11 (Figure 1H) to further clustering, which identified 24 transcriptionally defined neuronal populations (Figure 2A–C). The cell groups that we identified are largely consistent with a recently published VMHVL-focused single-cell RNA-seq study (Figure 2—figure supplement 1; Kim et al., 2019). While our study identified 24 clusters whose major markers were evenly distributed between the dorsomedial and ventrolateral compartments of the VMH, Kim et al. identified 31 clusters with a bias toward populations with VMHVL markers. Integrating the datasets (Figure 2—figure supplement 1) revealed their broad correspondence, with highly correlated expression profiles (Figure 2—figure supplement 1B) and shared marker genes (Figure 2—figure supplement 1D). The omission of Nfib-marked populations from the (Kim et al., 2019) analysis represented a notable difference between our analyses, however. In our reanalysis of their data, we found that Nfib-marked cells were present in their samples but were filtered out before the final VMH clustering (Figure 2—figure supplement 1). A previous scRNA-seq study of the neighboring ARC also mapped a neuron population marked by Nfib expression to the VMH, however (Campbell et al., 2017), and these cells correlated to our Nfib-marked VMH neuron populations (Figure 2—figure supplement 2).
A simplified parceling scheme defines anatomically distinct VMH neuron populations
Hierarchical clustering and marker gene analysis for our 24 mouse VMH neuron clusters using CELLEX (Timshel et al., 2020) revealed that many cell groups were highly related to other VMH neuron clusters (Figure 2D,E; Supplementary file 3). Furthermore, many of these populations share marker gene expression to an extent that renders it impossible to specifically manipulate single populations given current approaches that use a single gene for cell-type manipulation (e.g., Cre-based mouse models) (Figure 2D,E). To identify classes of genetically distinguishable cells, we cut the hierarchical tree at different levels and measured the maximum pairwise expression correlation to highlight the level at which few pairs of clusters exhibited highly correlated transcriptomes. We found that six classes represented the largest number of classes that retained minimal correlated expression (Figure 2F). To avoid confusion, we refer to these as VMH neuron classes, while referring to the cell groups of which each class is composed as clusters or subpopulations. The mean silhouette width (a measure of clustering robustness) for the various tree cuts also supported the use of six classes (Figure 2—figure supplement 3), and these six classes corresponded to the cluster designations from the broader neuron dataset (Figure 2G). Hence, a parceling scheme for mouse VMH neurons that contains six classes, each composed of highly similar subpopulations, captures the transcriptional patterns of the VMH. Importantly, this approach identified numerous specific marker genes (e.g., Dlk1, Esr1, Nfib, Foxp2, Fezf1, and Lepr) for each class of mouse VMH neurons (Figure 2D,H, Supplementary file 4), which should facilitate their manipulation and study.
Consistent with the distinct nature of these six VMH neuron classes and the utility of this parceling scheme, each class demonstrated a circumscribed anatomic distribution. As previously reported (Lee et al., 2014; Persson-Augner et al., 2014), Dlk1- and Esr1-expressing neurons (VMHDlk1 and VMHEsr1, respectively) map to the VMHVL. While Dlk1 is unique to a single class of VMH neurons, it is also expressed in neighboring hypothalamic neurons (Figure 2—figure supplement 4), complicating its utility for manipulating this population without using an intersectional approach. In contrast to these ventrolateral populations, Lepr-expressing cells lie within the core of the VMHDM (Elmquist et al., 1998) and the expression of marker genes for the Nfib-marked clusters (VMHNfib) resides in the most dorsomedial compartment of the VMHDM (Figure 2—figure supplement 5). Fezf1-marked populations (VMHFezf1) include cells with similarity to both ventrolateral VMHDlk1 and dorsomedial VMHLepr neurons, and many VMHFezf1 neurons lie in VMHC, in the transition between the dorsomedial and ventrolateral zones of the VMH. Markers for the Foxp2-expressing populations (VMHFoxp2) reside anterior and lateral to the core of the VMH, in the so-called tuberal region (Figure 2—figure supplement 6). Thus, the major VMH classes identified by our analysis each map to specific and distinct anatomic locations, consistent with their unique genetic signatures.
Lepr-directed TRAP-seq analysis of VMHLepr cells
Given that Lepr-expressing VMH neurons mediate only a subset of VMHDM functions, we were intrigued by the finding that unbiased snRNA-seq identified a distinct class of VMHDM cells marked by Lepr (VMHLepr neurons), consistent with a specialized role for Lepr-expressing VMH cells (Minokoshi et al., 1999; Toda et al., 2013; Noble et al., 2014; Gavini et al., 2016). The finding that Lepr-expressing VMH neurons map onto a single VMH neuron class also suggests a uniformity of function for these cells, which contrasts with the situation in other brain regions (such as the neighboring ARC, where multiple cell types with opposing functions [e.g., Agrp and Pomc cells] express Lepr; Campbell et al., 2017). We utilized TRAP-seq to assess the extent to which Lepr-expressing VMH neurons correspond to the VMHLepr clusters and to compare the genetic program of Lepr-expressing VMH neurons with gene expression in snRNA-seq-defined VMH neuron classes and subpopulations.
TRAP-seq analysis of microdissected VMH tissue from LeprCre;Rosa26eGFP-L10a animals (Leshan et al., 2006) resulted in the enrichment of transcripts from LeprCre neurons that lie in VMH-adjacent brain areas, including Agrp-, Ghrh-, Pomc-, and Nts-expressing cells from the ARC and lateral hypothalamic area (LHA) (Figure 3—figure supplement 1). To more closely restrict our TRAP-seq analysis to Lepr-expressing neurons that reside in the VMH, we used a recently developed mouse line that expresses eGFP-L10a only in cells that contain both Cre and Flp recombinases (Sabatini et al., 2021). Because VMH neurons contain vGLUT2 (encoded by Slc17a6), while most Lepr-expressing neurons in the neighboring ARC, dorsomedial hypothalamus (DMH), and LHA do not (Vong et al., 2011), we crossed an Slc17a6Flpo mouse line to LeprCre and RCFLeGFP-L10 to produce Slc17a6Flpo; LeprCre; RCFLeGFP-L10 (LeprSlc17a6-L10a) mice. In these mice, mediobasal hypothalamic eGFP-L10a was largely restricted to the VMH (Figure 3A; Sabatini et al., 2021).
We microdissected the VMH of LeprSlc17a6-L10a mice and performed TRAP-seq, identifying 3580 transcripts that were enriched in the TRAP material relative to the supernatant (Figure 3C, Supplementary file 5). Importantly, Lepr itself was not enriched, suggesting that we successfully purified ribosome-associated mRNA from Lepr-expressing VMH cells away from that derived from other Lepr-expressing populations (Figure 3B). We found that most non-VMH genes enriched in our conventional (LeprCre-only) TRAP-Seq (including Agrp, Nts, and Ghrh) were not enriched in this analysis (Figure 3—figure supplement 1). Pomc and Prlh remained somewhat enriched, however, suggesting that Lepr-expressing DMH Prlh cells are glutamatergic (Dodd et al., 2014), and consistent with the finding that some ARC Pomc cells express Slc17a6 (Jones et al., 2019).
As expected, we observed a high degree of concordance between snRNA-seq-defined gene expression in neurons of the VMHLepr cluster with gene expression in Lepr-expressing VMH neurons by TRAP-seq. We identified 3576 genes enriched in VMH-centered LeprSlc17a6 TRAP-seq material (Figure 3C), 1174 of which were also enriched in pseudo-TRAP analysis of the neurons assigned to the VMHLepr population (Supplementary file 6). Among the top enriched genes shared by these two methods were Gpr149, Rai14, and Tnfrsf8 (Figure 3F), which exhibit a similar VMHDM-centered expression pattern as Lepr (Figure 3G–I). As with the Nr5a1-Cre TRAP-seq, enrichment was largely a function of expression level: the genes that were enriched in both datasets were highly expressed in both, while the genes that were specific to TRAP or pseudo-TRAP were highly expressed in their enriched dataset, but more lowly expressed in the other. Notably, gene ontology (GO) analysis of the common genes revealed many terms related to synaptic function, while genes unique to TRAP-seq were enriched for ribosomal and mitochondrial function (data not shown).
We mapped enriched genes from LeprSlc17a6 TRAP-seq to the gene expression profiles of our snRNA-seq-defined VMH neuron populations (Figure 3F), revealing the bias of LeprSlc17a6 TRAP-seq gene expression toward VMHLepr neurons and the exclusion of markers from other VMHLepr cells from LeprSlc17a6 TRAP-seq-enriched genes. Thus, this analysis demonstrates that Lepr-expressing VMH neurons map specifically to VMHLepr cell clusters, suggesting that they represent a transcriptionally and functionally unique set of neurons.
Conservation of VMH neuronal populations across species
While many previous studies of VMH neuron function have suggested that this brain region contains neurons that could represent therapeutic targets to aid people with obesity, diabetes, and other diseases, most of these studies have been performed in mice (Hashikawa et al., 2017; Flak et al., 2020; Meek et al., 2013; Kim et al., 2012). We know little about the cross-species conservation of VMH cell populations, however. To assess the potential conservation of VMH neuron populations across species, we microdissected macaque (Macaca mulatta) VMH and performed snRNA-seq using the same techniques as for mouse VMH (Figure 4—figure supplement 1). A subset of macaque neurons expressed NR5A1 and/or FEZF1 and exhibited similar gene expression profiles to our mouse Nr5a1-Cre TRAP-seq enriched genes (Figure 4—figure supplement 2), suggesting that these cells represent the macaque VMH and indicating that the mouse and macaque VMH share similar global gene expression signatures.
Graph-based clustering of the macaque VMH neurons yielded seven populations with unique marker genes (with the partial exception of two related ESR1-expressing cell types) (Figure 4B–E). Most of these macaque populations, including populations marked by LEPR, FOXP2, NFIB, and ESR1 (VMHLEPR, VMHFOXP2, VMHNFIB, and VMHESR1, respectively), have presumptive orthologs in the mouse (Figure 4D, see Supplementary file 7 for a complete list of markers). While populations marked by DLK1 and FEZF1 were absent from this analysis, the macaque VMH contained a population marked by QRFPR expression (VMHQRFPR).
Figure 4 with 2 supplements see all
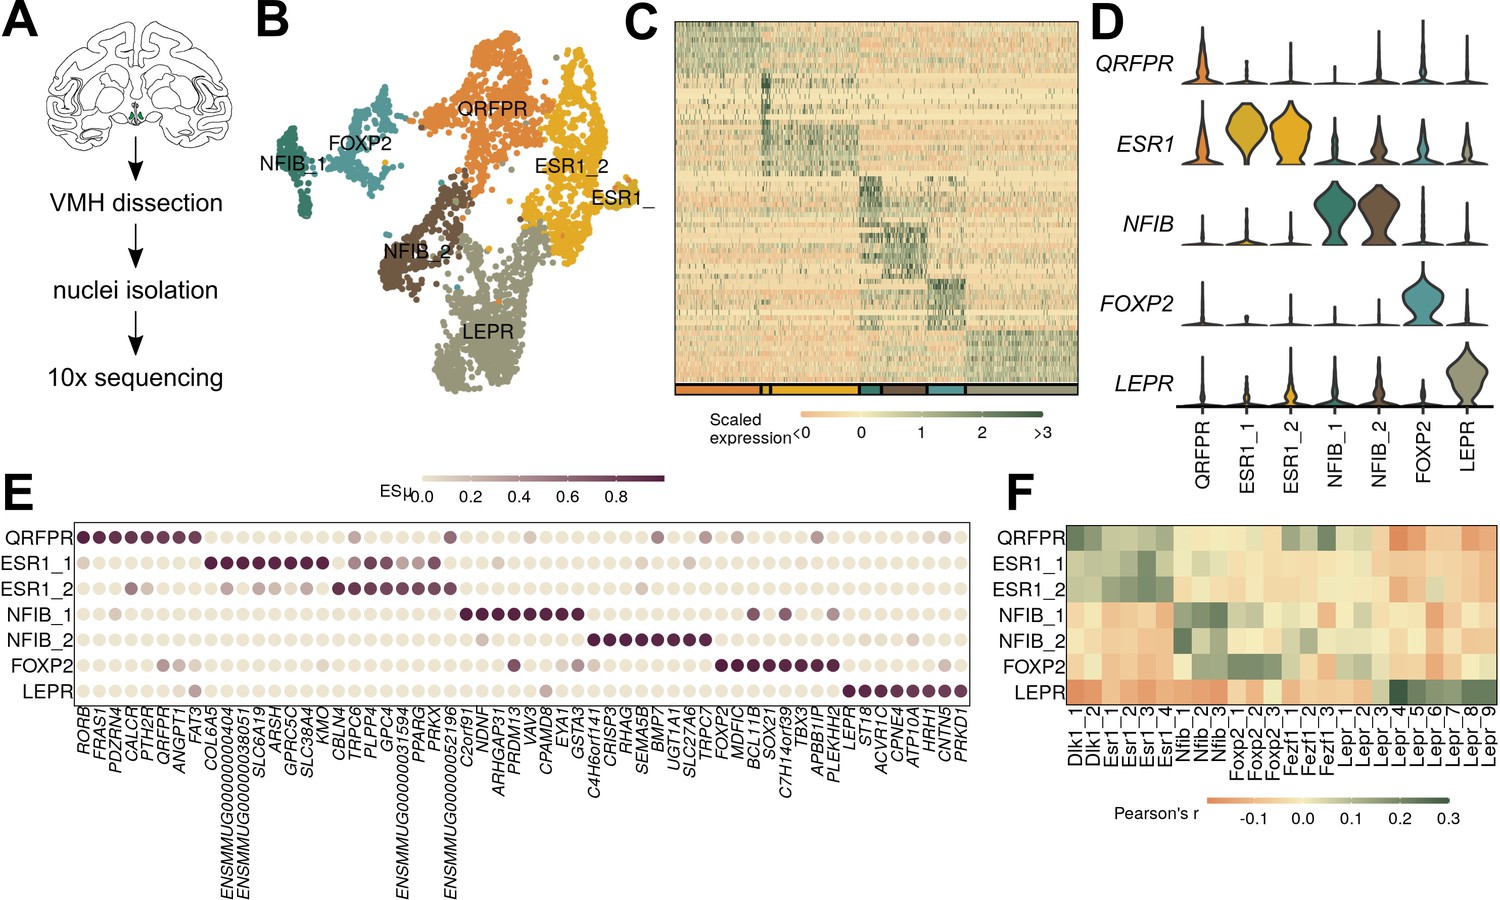
Macaque ventromedial hypothalamic nucleus (VMH) populations revealed by single-nucleus RNA-sequencing (snRNA-seq).
(A) Schematic of experimental process for macaque snRNA-seq. (B) UMAP of 3752 VMH neuronal nuclei colored and labeled by cluster designation. (C) Expression profile of the top enriched genes for each cluster. (D) Violin plot of normalized expression for marker genes for each VMH neuronal population. (E) ESµ for the top five marker genes for each cluster determined by CELLEX. (F) Pairwise scaled expression correlation (Pearson’s r) for each macaque and mouse VMH neuronal cluster.
To determine whether the macaque populations were orthologous to those from the mouse, we first compared expression of orthologous genes among mouse and macaque cell clusters. We found that all macaque populations had clear correlates in the mouse, which mapped according to their marker genes (as expected) (Figure 4F, Figure 5—figure supplement 1D). Notably, the macaque VMHQRFPR population correlated with clusters from both VMHDlk1 and VMHFezf1 classes in the mouse, suggesting that VMHQRFPR contains orthologs of the mouse VMHDlk1 and VMHFezf1 classes. Projecting the mouse or macaque cluster labels onto the other species using Seurat anchors (see Materials and methods for more details) yielded similar results (Figure 5—figure supplement 1). All major classes from mouse and macaque projected with high confidence onto the equivalent major classes of the other species, and the macaque VMHQRFPR population was represented by both mouse VMHDlk1 and VMHFezf1 cells (Figure 5—figure supplement 1A).
To generate an atlas of conserved mouse and macaque VMH populations, we integrated the mouse and macaque data and clustered the merged dataset using the Seurat canonical correlation analysis (CCA) framework (Figure 5A–B, see Materials and methods for more details). This analysis revealed populations of VMH neurons that each contained mouse and macaque cells in roughly equal proportions (Figure 5E). As predicted, neurons from the macaque VMHLEPR, VMHFOXP2, VMHNFIB, and VMHESR1 classes mapped directly with murine VMHLepr, VMHFoxp2, VMHNfib, and VMHEsr1 classes, respectively (Figure 5G). We examined the potential co-expression of conserved marker genes for VMHLEPR cells by in situ hybridization (ISH) for ACVR1C in the macaque hypothalamus (Figure 5—figure supplement 2), confirming ACVR1C is co-expressed with LEPR in the macaque VMHDM. We also examined the potential co-expression of SLC17A8 (which marks VMHNFIB) with LEPR. SLC17A8 identified a population of cells that lay at the medial extreme of the macaque VMHDM, corresponding to the most dorsomedial aspect of the rodent VMHDM, as for murine VMHNfib cells; these cells did not colocalize with LEPR-expressing cells (Figure 5—figure supplement 2).
Figure 5 with 2 supplements see all

Ventromedial hypothalamic nucleus (VMH) populations are conserved between mouse and macaque.
(A–B) Mouse and macaque single-nucleus RNA-sequencing (snRNA-seq) datasets were (A) merged using canonical correlation analysis and (B) projected onto UMAP space, colored here by species. (C) UMAP of VMH neuronal nuclei colored and labeled by cluster designation. (D) Mean scaled expression of marker genes across integrated clusters by species. (E) Proportion of cells in each cluster from the sample for each species (mean ± SEM). (F) Expression profile of the top enriched genes for each cluster. (G) Mapping of species-specific clusters onto the integrated clusters. (H) Species-specific ESµ for the top three marker genes for each integrated cluster determined by CELLEX.
This analysis also identified macaque populations that mapped with the murine VMHDlk1 and VMHFezf1 populations; these derived mainly from the macaque VMHQRFPR population (Figure 5G). Notably, FEZF1 and DLK1 were poorly enriched in the macaque VMHQRFPR population (Figure 5D), while mouse Qrfpr expression was biased toward the VMHEsr1 populations (Figure 5D). Despite differences in some marker genes, however, the orthologous macaque and mouse VMH neuron populations share dozens of other genes across species (Figure 5H, Supplementary file 8, Figure 5—figure supplement 1B), suggesting that the mouse and macaque cells in each group represent similar cell types. Gene ontology (GO) analysis of common marker genes (Source data 2, Source data 1) revealed that most of these mediate core neuronal functions, such as ion channel activity (Figure 5—figure supplement 1C). Thus, while some marker genes vary across species, the mouse VMH populations have close orthologs in the macaque VMH based upon their gene expression profiles.
Discussion
We combined TRAP- and snRNA-seq analysis of the VMH to identify 24 mouse neuronal populations with complex interrelations. These 24 populations represented six distinct cell classes that demonstrated unique anatomic distribution patterns. The main VMH classes were highly conserved between the mouse and the macaque in terms of gene expression profiles and anatomic distribution within the VMH. This atlas of conserved VMH neuron populations provides an unbiased and tractable starting point for the analysis of VMH circuitry and function.
Having many populations of VMH neurons with highly related gene expression profiles complicates the functional analysis of VMH cell types suggesting the importance of simplifying the map of these heterogeneous populations to permit their manipulation and study. By using hierarchical clustering, we were able to identify six maximally unrelated classes of VMH neurons with distinct gene expression signatures. These six discrete transcriptionally defined VMH neuronal classes demonstrated distinct anatomic distribution patterns (three located in the VMHDM, two in the VMHVL, and one in the tuberal region), revealing a transcriptional basis for the previously suggested functional architecture of the VMH.
Our VMH cell populations were similar to those previously described by Kim et al., although they more finely split the VMHVL populations than did we (presumably because their dissection bias toward the VMHVL yielded more VMHVL neurons) (Kim et al., 2019). We were able to more clearly distinguish among VMHDM cell types in our VMHDM-focused analysis, however, including by dividing the VMHDM neurons that they identified into two major classes (VMHLepr and VMHFezf1), as well as identifying a third VMHDM population (VMHNfib) absent from their analysis. Interestingly, the VMHNfib population was quite distinct from the more closely related VMHLepr and VMHFezf1 VMHDM cell types, suggesting a potentially divergent function for this most dorsomedial of the VMHDM populations.
Our mouse VMH cell types mapped clearly onto specific populations of macaque VMH neurons, revealing the utility of the mouse as a surrogate for the primate in terms of VMH cell types and, presumably, function. While the macaque single VMHQRFRP population mapped to two mouse classes (VMHFezf1 and VMHDlk1) by orthologous gene expression, these mouse classes are closely related to each other (transcriptionally and anatomically) and the macaque cells from VMHQRFRP segregate to distinct cell clusters defined by Dlk1 and Fezf1 in the mouse when we integrated and reclustered the mouse and macaque cell data. Also, while DLK1 is not specific to the macaque VMHQRFPR cells, the otherwise similar gene expression profiles of mouse and macaque cells that map to VMHDlk1 or VMHFezf1 populations suggest the conserved nature of these cell types across species.
While not all Lepr-expressing cell types track in the brain across species (e.g., preproglucagon [Gcg]-containing NTS neurons in the mouse express Lepr, rat NTS Gcg cells do not; Huo et al., 2008), mouse VMHLepr neurons map directly with macaque VMHLEPR neurons by all of the measures that we examined. The finding that Lepr/LEPR expression marks a unique and conserved cell type in rodent and primate is consistent with the notion that this class of VMH neuron mediates a discrete component of VMH function, as suggested by previous work in the mouse demonstrating roles for Lepr-expressing VMH neurons in the control of energy balance, but not glucose production or panic-like behaviors (Meek et al., 2013; Meek et al., 2016; Sabatini et al., 2021).
While the tuberal region contains more GABAergic than glutamatergic neurons, this region projects to similar target areas as does the core VMH and contains substantial numbers of neurons marked by Nr5a1-Cre activity. Hence, although VMHFoxp2 cells lie in the tuberal region, their glutamatergic nature, their marking by Nr5a1-Cre activity, and the finding that they are transcriptional most similar to other VMH populations mark VMHFoxp2 cells as VMH neurons. While few data exist to suggest the physiologic roles played by these cells, it will be interesting to manipulate VMHFoxp2 neurons to determine their function.
The identification of distinct transcriptionally defined VMH cell populations provides the opportunity to develop new tools that can be used to understand the nature and function of VMHDM cell types and their roles in metabolic control. The finding that the major VMH cell classes found in the mouse are present in the macaque supports the use of the mouse to study the metabolic functions of the VMH as a means to identify potential therapeutic targets for human disease. It will be important to use these findings to dissect functions for subtypes of VMH cells, which may represent targets for the therapy of diseases including obesity and diabetes.
Materials and methods
Animals
Mice were bred in the Unit for Laboratory Animal Medicine at the University of Michigan. These mice and the procedures performed were approved by the University of Michigan Committee on the Use and Care of Animals and in accordance with Association for the Assessment and Approval of Laboratory Animal Care (AAALAC) and National Institutes of Health (NIH) guidelines. Mice were provided with ad libitum access to food (Purina Lab Diet 5001) and water in temperature-controlled (25°C) rooms on a 12 hr light-dark cycle with daily health status checks.
Nr5a1-Cre (Jax: 012462) (Dhillon et al., 2006) and Foxp2IRES-Cre (Jax: 030541) (Rousso et al., 2016) mice were obtained from Jackson Laboratories. Rosa26 CAG-LSL-eGFP-L10a, LeprCre (Jax: 032457), Slc17a6Flpo, and RCFLeGFP-L10a mice have been described previously (Leshan et al., 2006; Krashes et al., 2014; Sabatini et al., 2021).
Nonhuman primate tissue was obtained from the Tissue Distribution Program at ONPRC. Animal care is in accordance with the recommendations described in the Guide for the Care and Use of Laboratory Animals of the NIH and animal facilities at the Oregon National Primate Research Center (ONPRC) are accredited by AAALAC.
Tissue prep, cDNA amplification, and library construction for 10× snRNA-seq
Request a detailed protocolMice were euthanized using isoflurane and decapitated, the brain was subsequently removed from the skull and sectioned into 1-mm-thick coronal slices using a brain matrix. The VMH was dissected out and flash frozen in liquid N2. Nuclei were isolated as previously described (Habib et al., 2017) with modifications as follows. On the day of the experiment, frozen VMH (from 2 to 3 mice) was homogenized in Lysis Buffer (EZ Prep Nuclei Kit, Sigma) with Protector RNAase Inhibitor (Sigma) and filtered through a 30 μm MACS strainer (Myltenti). Strained samples were centrifuged at 500 rcf × 5 min and pelleted nuclei were resuspended in wash buffer (10 mM Tris Buffer pH 8.0, 5 mM KCl, 12.5 mM MgCl2, 1% BSA with RNAse inhibitor). Nuclei were strained again and recentrifuged at 500 rcf × 5 min. Washed nuclei were resuspended in wash buffer with propidium iodide (Sigma) and stained nuclei underwent FACS sorting on a MoFlo Astrios Cell Sorter. Sorted nuclei were centrifuged at 100 rcf × 6 min and resuspended in wash buffer to obtain a concentration of 750–1200 nuclei/μL. RT mix was added to target ~10,000 nuclei recovered and loaded onto the 10× Chromium Controller chip. The Chromium Single Cell 3’ Library and Gel Bead Kit v3, Chromium Chip B Single Cell kit, and Chromium i7 Multiplex Kit were used for subsequent RT, cDNA amplification, and library preparation as instructed by the manufacturer. Libraries were sequenced on an Illumina HiSeq 4000 or NovaSeq 6000 (pair-ended with read lengths of 150 nt) to a depth of at least 50,000 reads/cell.
snRNA-seq data analysis
Request a detailed protocolCount tables were generated from the FASTQ files using cellranger and analyzed in R 3.6.3 using the Seurat three framework. Genes expressed in at least four cells in each sample and were not gene models (starting with ‘Gm’) or located on the mitochondrial genome were retained. Cells with at least 500 detected genes were retained. Doublets were detected using Scrublet (Wolock et al., 2019). For each 10× run, the expected number of doublets was predicted using a linear model given 10× data of the detected doublet rate and the number of cells. Then, each cell was given a doublet score with Scrublet and the n cells (corresponding to the expected number of doublets) with the top scores were removed.
The data was then normalized using scran (Lun et al., 2016) and centered and scaled for each dataset independently and genes that were called variable by both Seurat FindVariableFeatures and sctransform (Hafemeister and Satija, 2019) were input to principal component analysis (PCA). The top principal components (PCs) were retained at the ‘elbow’ of the scree plot (normally 15–30, depending on the dataset) and then used for dimension reduction using UMAP and clustering using the Seurat FindNeighbors and FindClusters functions. Both were optimized for maximizing cluster consistency by clustering over a variety of conditions: first, varying the number of neighbors from 10 to the square root of the number of cells while holding the resolution parameter in FindClusters at one and finding the clustering that maximized the mean silhouette score; then, this number of neighbors was held fixed while varying the resolution parameter in FindClusters from 0.2 upward in steps of 0.2 until a maximal mean silhouette score was found. Clusters were then hierarchically ordered based on their Euclidean distance in PC space and ordered based on their position in the tree.
Marker genes were found using the Seurat function FindAllMarkers for each sample with resulting p-values combined using the logitp function from the metap package or using CELLEX 1.0.0. Cluster names were chosen based on genes found in this unbiased marker gene search and known marker genes.
From the all-cell data, cell types were predicted using gene set enrichment analysis from the marker genes and a manually curated set of genes known to mark specific CNS cell types. From this, clusters that were highly enriched for markers from two (or more) distinct cell types were labeled as ‘doublets’ and those with no enrichment were labeled as ‘junk’, the remaining clusters were labeled based on their lone CNS cell type.
To predict VMH neurons from all neurons, we first found genes significantly enriched in the bead fraction in Nr5a1-Cre TRAP-seq (see below for details) and expressed above one count per million. The scaled count matrix containing these genes was then used as input to PCA. The magnitude of the first PC (loading) was then used to generate a VMH similarity score and the clusters that had a high Nr5a1-Cre TRAP loading were glutamatergic (express Slc17a6 and not Gad1 or Slc32a1 above the mean value), and expressed either Nr5a1 or Fezf1 above the mean value were included as presumptive VMH.
TRAP-seq analysis
Request a detailed protocolMice (LeprCre;ROSA26EGFP-L10a or LeprCre;Slc17a6FlpO;ROSA26EGFP-L10a) were euthanized and decapitated, the brain was subsequently removed from the skull and sectioned into 1-mm-thick coronal slices using a brain matrix. The VMH or hypothalamus was dissected and homogenized in lysis buffer. Between 15 and 20 mice were used for TRAP experiments. GFP-tagged ribosomes were immunoprecipitated and RNA isolated as previously described (Allison et al., 2018). RNA was subject to ribodepletion and the resultant mRNA was fragmented and copied into first strand cDNA. The products were purified and enriched by PCR to create the final cDNA library. Samples were sequenced on a 50-cycle single end run on a HiSeq 2500 (Illumina) according to manufacturer’s protocols.
FASTQ files were filtered using fastq_quality_filter from fastx_toolkit to remove reads with a phred score <20. Then reads were mapped using STAR with a custom genome containing the Ensembl reference and sequences and annotation for Cre and EGFP:L10a (and Flpo in the RCFL::eGFP-L10a dataset). Count tables were generated using the STAR --quantMode GeneCounts flag.
Count tables were analyzed in R 3.6.3 and were subject to quality control to ensure read adequate library size (20–30 million reads), enrichment of positive control genes (e.g., EGFP:L10a and/or Cre, Nr5a1), and appropriate sample similarity in both hierarchical clustering of Euclidean distance and TSNE/UMAP space (e.g., bead samples are more similar to one another than to any sup sample). All samples passed quality control. Enriched genes were determined using DESeq2 including an effect of sample pair in the model to account for pairing of the bead–sup samples (~pair + cells).
Integration with published data
Request a detailed protocolCount tables from Kim et al., 2019 were downloaded from https://data.mendeley.com/datasets/ypx3sw2f7c/3 and count tables from Campbell et al., 2017 were downloaded from https://www.ncbi.nlm.nih.gov/geo/query/acc.cgi?acc=GSE93374. Note: Only the 10× data from Kim et al. was used. The data was then preprocessed and clustered in the same way as above, though some samples were removed from the Kim et al. dataset for low mean read depth that confounded clustering (Samples 2018_0802, 2018_0803, 2018_0812_1, 2018_0812_2, and 2018_0812_3). For the Kim et al. dataset, cells were clustered as above (FindNeighbors then FindClusters), and neuron clusters were predicted using WGCNA to identify correlated gene expression modules. The modules contained dozens of genes that mapped clearly onto a small set of clusters in UMAP space and—based on known marker genes—corresponded to the most prevalent cell types in the brain (e.g., neurons, astrocytes, microglia, oligodendrocytes, etc.). For the Campbell et al. data, neurons were labeled in the metadata from the authors, so neuronal barcodes were simply selected based on their annotation. For both neuronal datasets, VMH neurons were predicted using the same procedure as above: clusters that were glutamatergic, Fezf1/Nr5a1-expressing, and similar to Nr5a1-Cre TRAP-seq. This corroborated the clusters called VMH in both datasets by the original authors, with the exception of the Nfib populations in the Kim et al. dataset that was not called VMH and therefore not assigned a cluster name; we refer to these cells as (Missing) in our integrated dataset.
To find shared populations across datasets, we took two approaches. First, variable genes were found for both datasets using the Seurat FindVariableFeatures function. Then, the pairwise Pearson’s correlation was found for the mean scaled expression in each cluster in each dataset for the set of genes called variable in both datasets. Additionally, we used the Seurat FindTransferAnchors and IntegrateData functions to generate a merged dataset that was then subjected to PCA, UMAP reduction, and clustering in the same way as above. These new clusters containing cells from both datasets were then manually named using marker genes from the original datasets (e.g., Dlk1, Esr1, Satb2, Lepr, Nfib, Foxp2, etc.).
Immunostaining
Request a detailed protocolAnimals were perfused with phosphate buffered saline (PBS) for 5 min followed by an additional 5 min of 10% formalin. Brains were then removed and post-fixed in 10% formalin for 24 hr at room temperature, before being moved to 30% sucrose for 24 hr for a minimum of 24 hr at room temperature. Brains were then sectioned as 30-μm-thick free-floating sections and stained. Sections were treated with blocking solution (PBS with 0.1% triton, 3% normal donkey serum; Fisher Scientific) for at least 1 hr. The sections were incubated overnight at room temperature in blocking solution containing primary antibodies. The following day, sections were washed and incubated with fluorescent secondary antibodies with species-specific Alexa Fluor-488 or -568 (Invitrogen, 1:250) to visualize proteins. Primary antibodies used include: GFP (1:1000, #1020, Aves Laboratories) and NFIA (1:500, #PA5-35936, Invitrogen). Images were collected on an Olympus BX51 microscope. Images were background-subtracted and enhanced by shrinking the range of brightness and contrast in ImageJ.
Macaque snRNA-seq
Request a detailed protocolWhole Rhesus macaque brains were obtained from the Tissue Distribution Program at ONPRC. Brains were centered within a chilled brain matrix (ASI Instruments, catalog # MBM-2000C) and 2 mm slices were obtained from rostral to caudal. Slices containing the hypothalamus were placed in saline and the PVH, ARC, VMH, and DMH were punched out and samples were placed in pre-chilled tubes on dry ice. Samples were stored at −80°C until shipment on dry ice. Nuclei were isolated from frozen macaque tissue as described above for mice.
The FASTQ files were mapped to the macaque genome (Mmul_10) using cellranger and count matrix files were analyzed in R using Seurat three as above, with the exception that gene models and genes mapping to the macaque mitochondrial genome were not removed. Macaque neurons were predicted using orthologs of mouse cell-type marker genes and macaque VMH neurons were identified using macaque orthologs of Nr5a1-Cre TRAP-seq enriched genes. Orthologs were identified using Ensembl and only 1:1 orthologs were retained.
Species integration
Request a detailed protocolThe mouse and macaque datasets were integrated in a similar way to integrating the Kim et al. and Campbell et al. mouse datasets. First, the macaque genes were renamed to their mouse orthologs and only 1:1 orthologs and genes expressed in both species were retained. Importantly, because our dataset was biased toward the dorsomedial VMH and the Kim et al. dataset was biased toward the ventrolateral VMH, we also included four randomly chosen samples from the Kim et al. data to get a more representative picture of shared VMH populations across species. The data was then preprocessed, normalized, and scaled in the same way as previously. The mouse and macaque data was then integrated using the Seurat FindTransferAnchors and IntegrateData functions and marker genes were found that were common across species by running FindAllMarkers for each species separately and then using the metap logitp function to find genes that are significantly enriched.
Macaque ISH
Request a detailed protocolWhole Rhesus macaque brains were obtained from the Tissue Distribution Program at ONPRC. Hypothalamic blocks fixed with 4% paraformaldehyde were incubated in glycerol prior to freezing with isopentane. Tissue was sectioned at 25 μm using a freezing stage sliding microtome and free-floating sections were stored in glycerol cryoprotectant at −20°C. Tissue was mounted on slides prior to ISH, which was performed using ACD Bio RNAScope reagents (Multiplex Fluorescent Detection Kit v2, 323100) for Acvr1c (ACD 591481), Slc17a8 (ACD 543821-c2), and Lepr (ACD 406371-C3). Negative and positive control probes were included in all runs. Slides were imaged on an Olympus VS110 Slidescanner and processed using Visiopharm software.
Statistical analysis
Request a detailed protocolAll data is displayed as mean ± SEM. All plotting and statistical analysis was performed using R 3.6.3. Specific statistical tests are listed in the figure legends.
Resource availability
Request a detailed protocolAll mouse strains will be made available upon reasonable request.
Code availability
Request a detailed protocolAll analysis code will be available at https://github.com/alanrupp/affinati-elife-2021 (Affinati et al., 2021, copy archived at swh:1:rev:d17662cffc0bcf7d20acd74c553f0e0e7f01654b).
Data availability
Sequencing data have been deposited in GEO under accession code GSE172207.
-
NCBI Gene Expression OmnibusID GSE172207. Cross-Species Analysis Defines the Conservation of Anatomically-Segregated VMH Neuron Populations.
References
-
SoftwareAffinati et al. eLife 2021, version swh:1:rev:d17662cffc0bcf7d20acd74c553f0e0e7f01654bSoftware Heritage.
-
A molecular census of arcuate hypothalamus and median eminence cell typesNature Neuroscience 20:484–496.https://doi.org/10.1038/nn.4495
-
Single-Cell RNA-Seq reveals hypothalamic cell diversityCell Reports 18:3227–3241.https://doi.org/10.1016/j.celrep.2017.03.004
-
Genetic labeling of steroidogenic factor-1 (SF-1) neurons in mice reveals ventromedial nucleus of the hypothalamus (VMH) circuitry beginning at neurogenesis and development of a separate non-SF-1 neuronal cluster in the ventrolateral VMHJournal of Comparative Neurology 521:1268–1288.https://doi.org/10.1002/cne.23226
-
Distributions of leptin receptor mRNA isoforms in the rat brainThe Journal of Comparative Neurology 395:535–547.https://doi.org/10.1002/(SICI)1096-9861(19980615)395:4<535::AID-CNE9>3.0.CO;2-2
-
Ventromedial hypothalamic nucleus neuronal subset regulates blood glucose independently of insulinJournal of Clinical Investigation 130:2943–2952.https://doi.org/10.1172/JCI134135
-
Massively parallel single-nucleus RNA-seq with DroNc-seqNature Methods 14:955–958.https://doi.org/10.1038/nmeth.4407
-
Esr1+ cells in the ventromedial hypothalamus control female aggressionNature Neuroscience 20:1580–1590.https://doi.org/10.1038/nn.4644
-
FOXO1 in the ventromedial hypothalamus regulates energy balanceJournal of Clinical Investigation 122:2578–2589.https://doi.org/10.1172/JCI62848
-
BookOrigins and Functions of the Ventrolateral VMH: A Complex Neuronal Cluster Orchestrating Sex Differences in Metabolism and Behavior.”In: Mauvais-Jarvis F, editors. Sex and Gender Factors Affecting Metabolic Homeostasis, Diabetes and Obesity. Cham: Springer International Publishing. pp. 199–213.https://doi.org/10.1007/978-3-319-70178-3_10
-
Oxytocin in the ventromedial hypothalamic nucleus reduces feeding and acutely increases energy expenditureAmerican Journal of Physiology-Regulatory, Integrative and Comparative Physiology 307:R737–R745.https://doi.org/10.1152/ajpregu.00118.2014
Article and author information
Author details
Funding
National Institutes of Health (dk056731)
- Martin G Myers
Novo Nordisk
- Martin G Myers
National Institutes of Health (P30 DK020572)
- Martin G Myers
National Institutes of Health (DK122660)
- Alison H Affinati
National Institutes of Health (DK123115)
- Paul Kievit
National Institutes of Health (P51 OD-11092)
- Paul Kievit
American Diabetes Association (1-19-PDF-09)
- Paul V Sabatini
The funders had no role in study design, data collection and interpretation, or the decision to submit the work for publication.
Acknowledgements
We thank Randy Seeley, Lotte Bjerre Knudsen, Kevin Grove, Mads Tang-Christensen, Christine Bjørn Jensen, and members of the Myers and Olson labs for helpful discussions. Research support was provided by the Michigan Diabetes Research Center (NIH P30 DK020572, including the Molecular Genetics, Microscopy, and Animal Studies Cores), the Marilyn H Vincent Foundation (to MGM), Novo Nordisk A/S (to MGM), ADA 1–19-PDF-099 (to PVS), and NIH DK122660 (to AHA). NHP data was supported by National Institutes of Health Grant P51 OD-11092 for operation of the Oregon National Primate Research Center and DK123115 (PK).
Ethics
Animal experimentation: All mice used in this study were maintained in accordance with University of Michigan Institutional Animal Care and Use Committee (IACUC), Association for the Assessment and Approval of Laboratory Animal Care (AAALAC) and National Institutes of Health (NIH) guidelines under protocol number PRO00007438 (PI Myers). Nonhuman primate tissue was obtained post-mortem from the Tissue Distribution Program at ONPRC. Animal care is in accordance with the recommendations described in the Guide for the Care and Use of Laboratory Animals of the National Institutes of Health and animal facilities at the Oregon National Primate Research Center (ONPRC) are accredited by the American Association for Accreditation of Laboratory Animal Care International. ONPRC does not provide protocol numbers for security reasons.
Copyright
© 2021, Affinati et al.
This article is distributed under the terms of the Creative Commons Attribution License, which permits unrestricted use and redistribution provided that the original author and source are credited.
Metrics
-
- 3,125
- views
-
- 369
- downloads
-
- 45
- citations
Views, downloads and citations are aggregated across all versions of this paper published by eLife.
Citations by DOI
-
- 45
- citations for umbrella DOI https://doi.org/10.7554/eLife.69065
Download links
A two-part list of links to download the article, or parts of the article, in various formats.
Downloads (link to download the article as PDF)
Open citations (links to open the citations from this article in various online reference manager services)
Cite this article (links to download the citations from this article in formats compatible with various reference manager tools)
Cross-species analysis defines the conservation of anatomically segregated VMH neuron populations
eLife 10:e69065.
https://doi.org/10.7554/eLife.69065


