Cross-species analysis defines the conservation of anatomically segregated VMH neuron populations
- Department of Internal Medicine, University of Michigan, United States
- Oregon National Primate Research Center, United States
- Novo Nordisk Research Center, United States
- Department of Pediatrics, University of Michigan, United States
Figures
Figure 1 with 1 supplement

Identification of ventromedial hypothalamic nucleus (VMH) neurons from mice.
(A) Schematic of VMH isolation and single-cell sequencing protocol. (B) UMAP of 21,585 neuronal nuclei colored and labeled by cluster designation. (C) Expression profile of the top enriched genes for each cluster (colored on bottom), including GABAergic (Gad1) and glutamatergic (Slc17a6) markers. (D) Expression of Nr5a1 and Fezf1 in individual cells in UMAP space. (E) Nr5a1-Cre translating ribosome affinity purification with RNA-sequencing (TRAP-seq) overview. Nr5a1-Cre mice were crossed with ROSA26eGFP-L10a mice, resulting in VMH-restricted eGFP-L10a expression. Representative image shows GFP-IR (black) in a coronal section from these mice. (F) TRAP-seq revealed the enrichment of thousands of genes (including Nr5a1 and Fezf1) in these cells relative to non-TRAP material. (G) Expression profile of the top enriched genes from Nr5a1-Cre TRAP-seq across clusters; gray box indicates presumptive VMH cells. (H) Magnitude of the first principal component after performing principal components analysis for the genes enriched in Nr5a1-Cre TRAP-seq. (I) Venn diagram of genes enriched in Nr5a1-Cre TRAP-seq (TRAP enriched), in single-nucleus RNA-sequencing (snRNA-seq) VMH pseudo-TRAP (pseudo-TRAP enriched), or both (common). Number in parentheses refers to the number of genes in each category. (J) Histograms of expression level for genes by enrichment gene set in each dataset (Nr5a1-Cre TRAP-seq or snRNA-seq). (K) Mean scaled expression for each cluster for the top genes enriched in Nr5a1-Cre TRAP-seq.
Figure 1—figure supplement 1
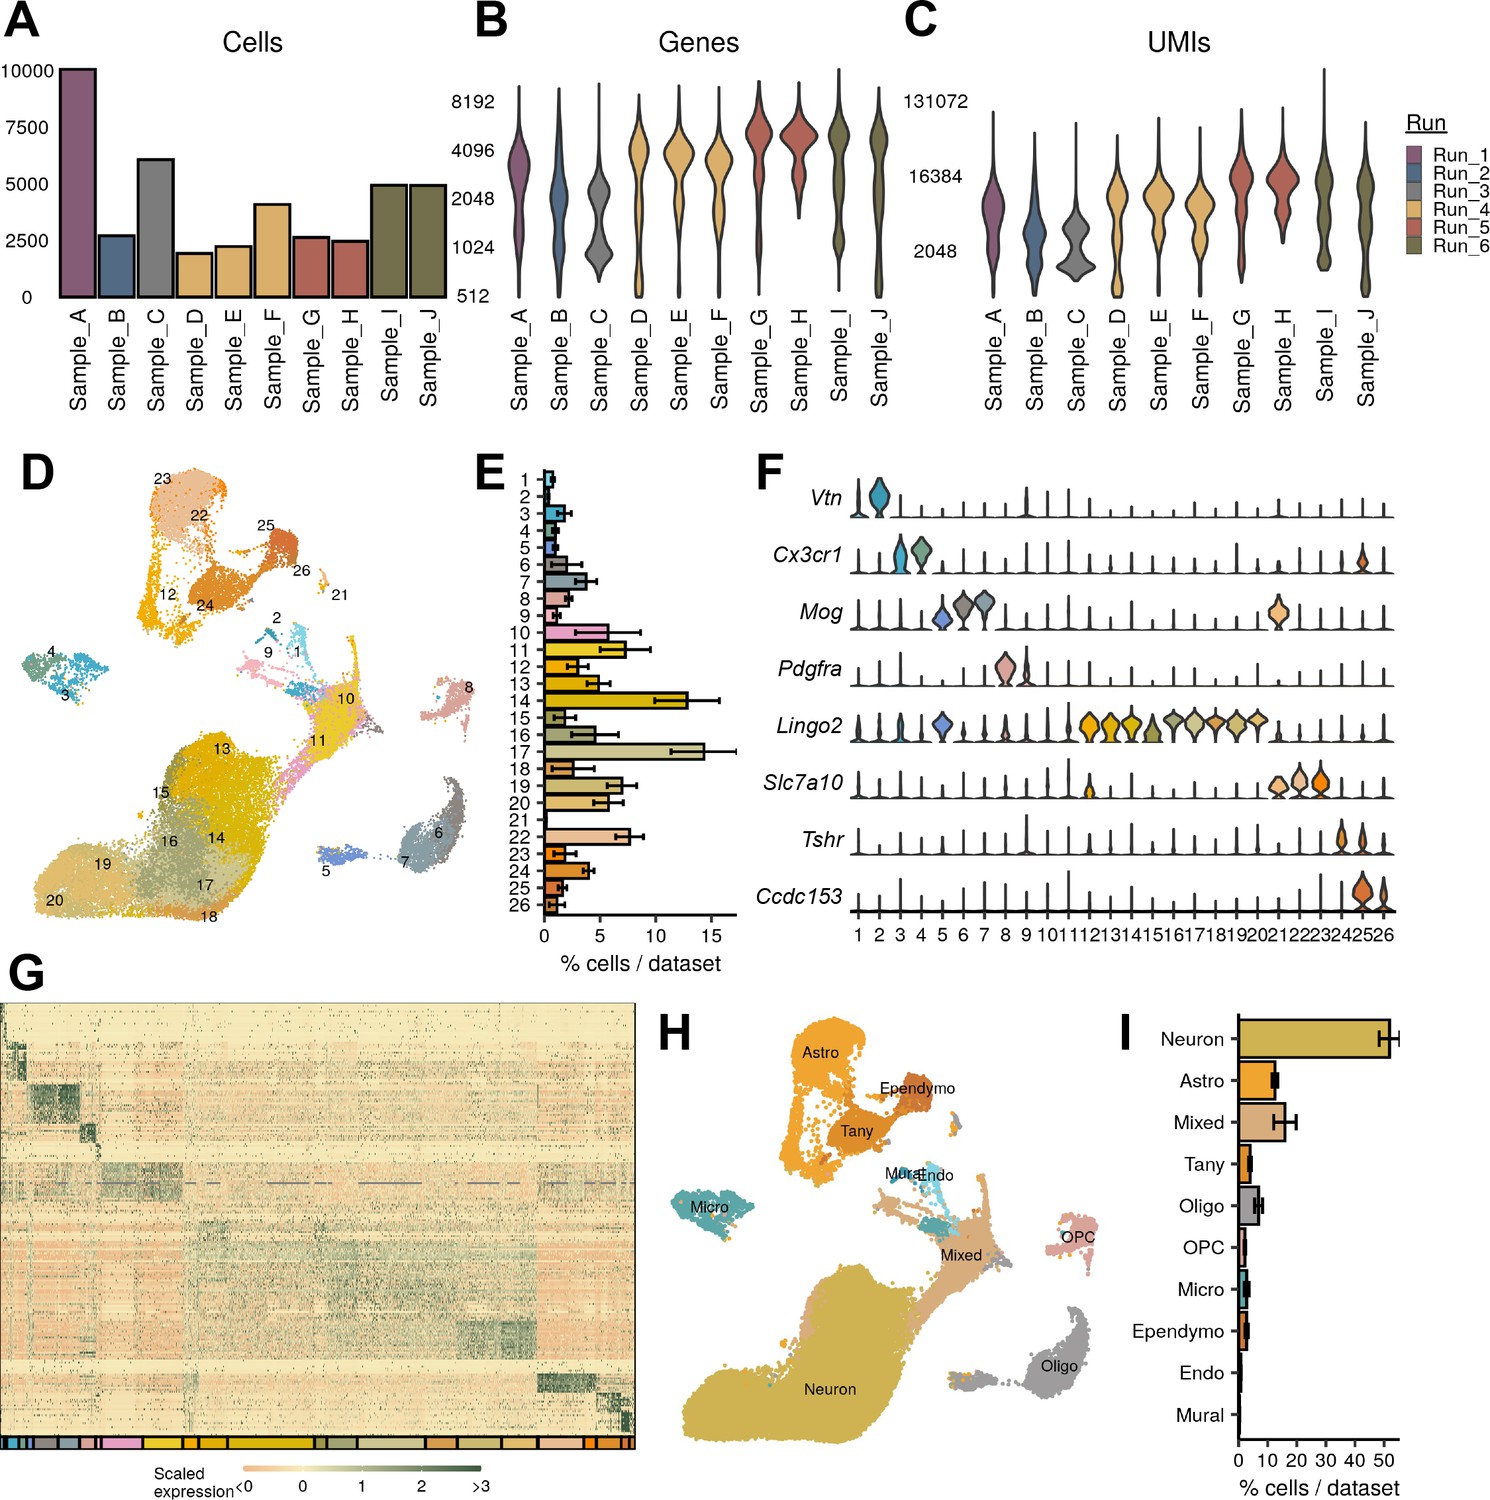
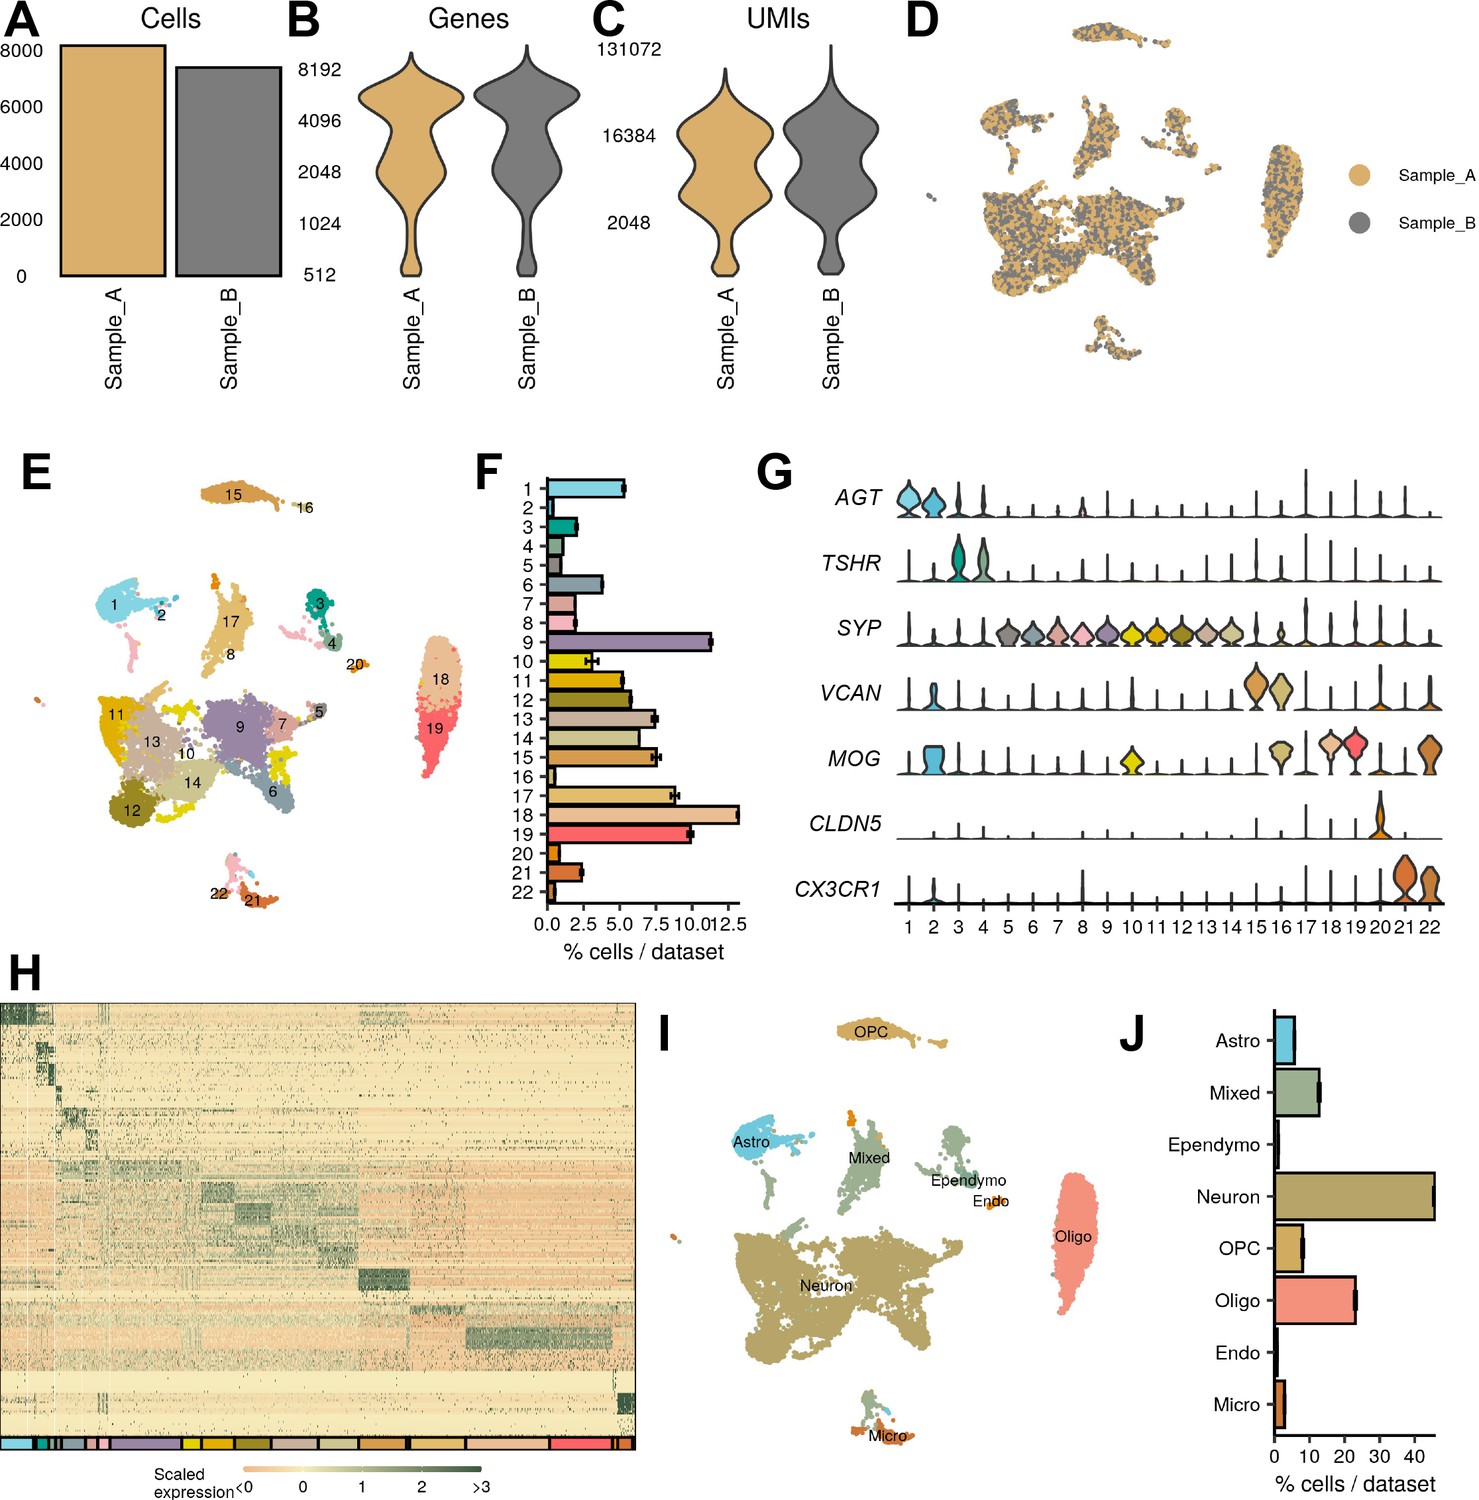
Mouse single-nucleus RNA-sequencing (snRNA-seq) identifies major CNS classes.
(A–C) The number of (A) cells, (B) genes, and (C) UMIs detected per sample used in this study after quality control. (D) UMAP of all 42,040 cells, colored by cluster. (E) Average percent of cells in each cluster across all samples. (F) Representative marker genes for each of the major CNS cell types. (G) Expression profile of top enriched genes for each cluster. (H) UMAP representation of cell-type classification. (I) Quantification of cell classes per sample.
Figure 2 with 6 supplements
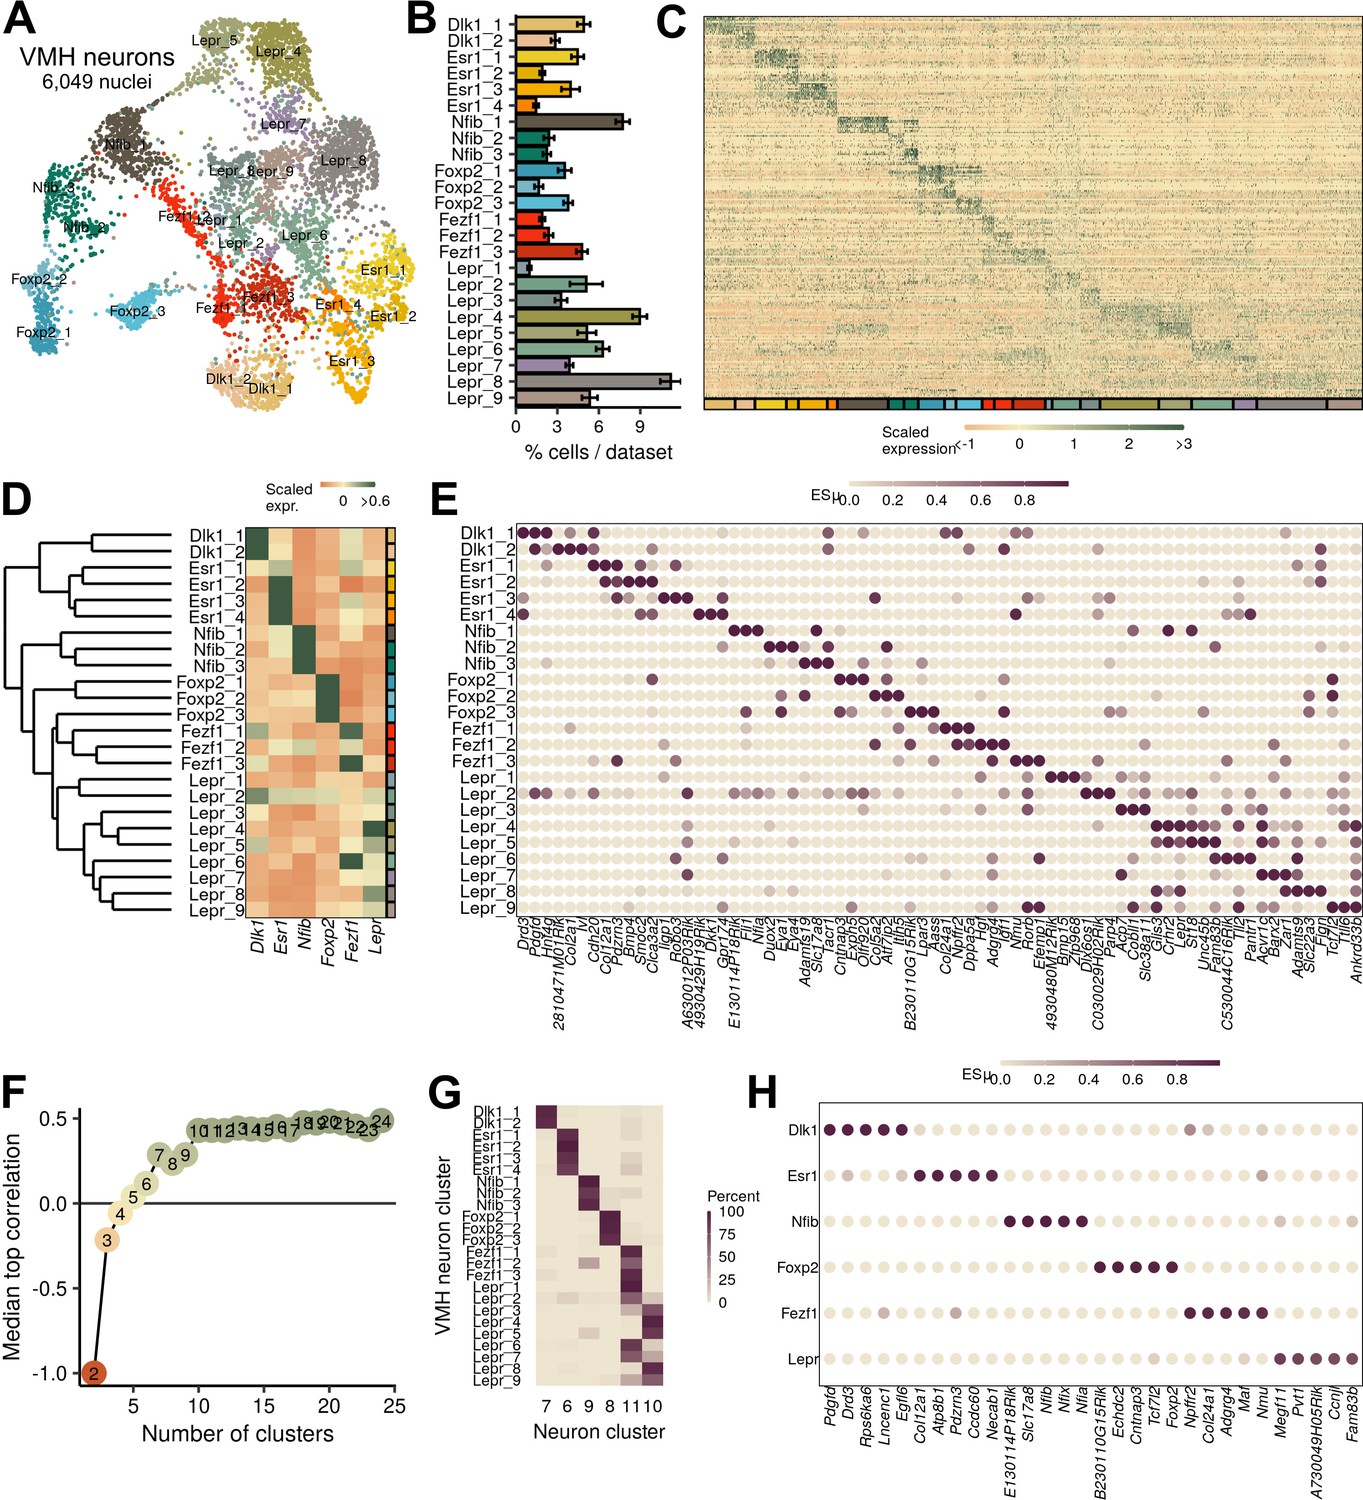
Ventromedial hypothalamic nucleus (VMH) neuronal populations can be grouped into six major classes.
(A) UMAP of 6049 VMH neurons colored and labeled by cluster designation. (B) Prevalence of clusters across samples, mean ± SEM. (C) Expression profile of the top enriched genes for each cluster. (D) Hierarchical clustering and mean expression of marker genes for each class of neurons. (E) ESµ for the top three marker genes for each population determined by CELLEX. (F) Median maximal pairwise expression correlation for each cut of the hierarchical tree resulting in 2–24 clusters. (G) Percent of cells in each VMH cluster that correspond to each neuronal cluster (from Figure 1). (H) ESµ for the top five marker genes for each major class determined by CELLEX.
Figure 2—figure supplement 1
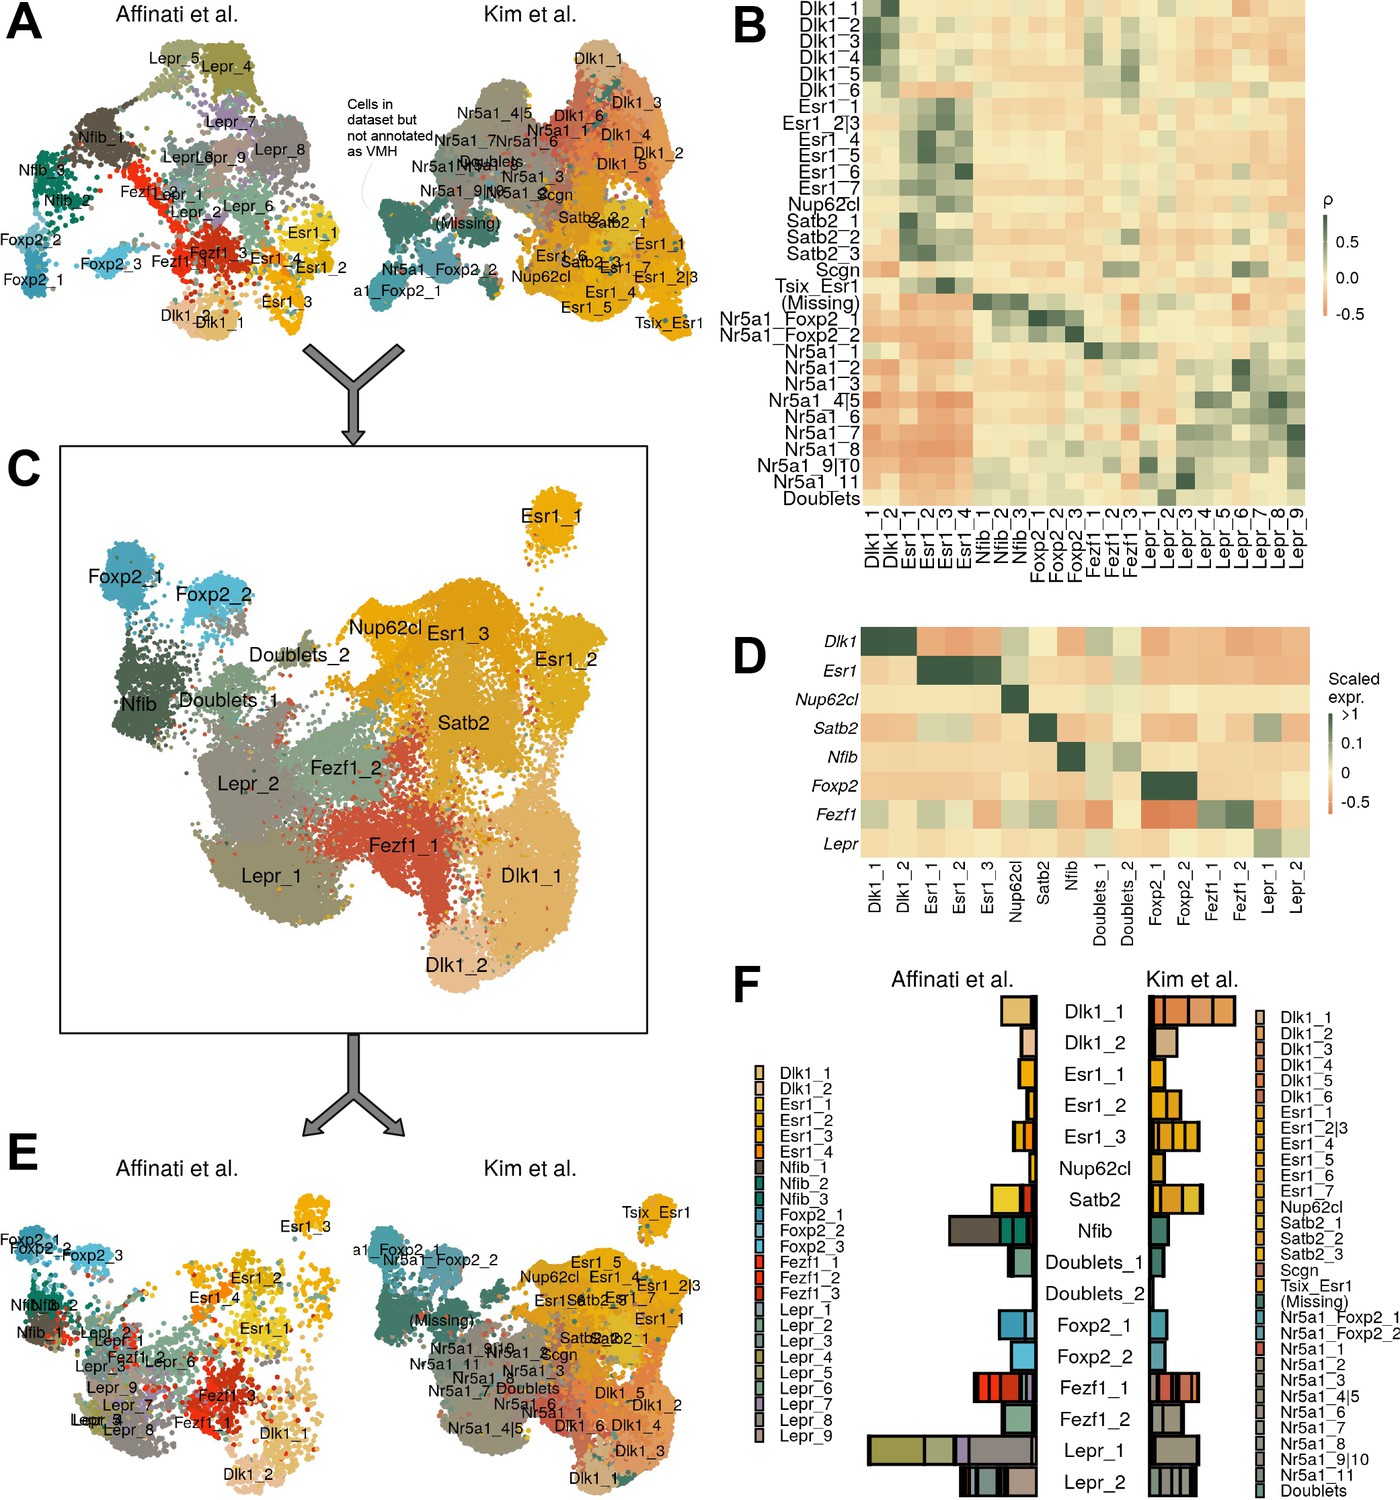
Comparison with ventromedial hypothalamic nucleus (VMH) data from Kim et al.
(A) UMAP of each dataset separately. Cells labeled ‘(Missing)’ were present in the dataset but were excluded from final VMH clustering. (B) Pairwise expression correlation of variable genes for each cluster in each dataset. (C) UMAP of canonical correlation analysis (CCA)-integrated data, colored by cluster. (D) Mean scaled expression of marker genes for each cluster. (E) UMAP of integrated data, by dataset of origin. (F) Breakdown of cluster designation from original dataset and integrated dataset.
Figure 2—figure supplement 2
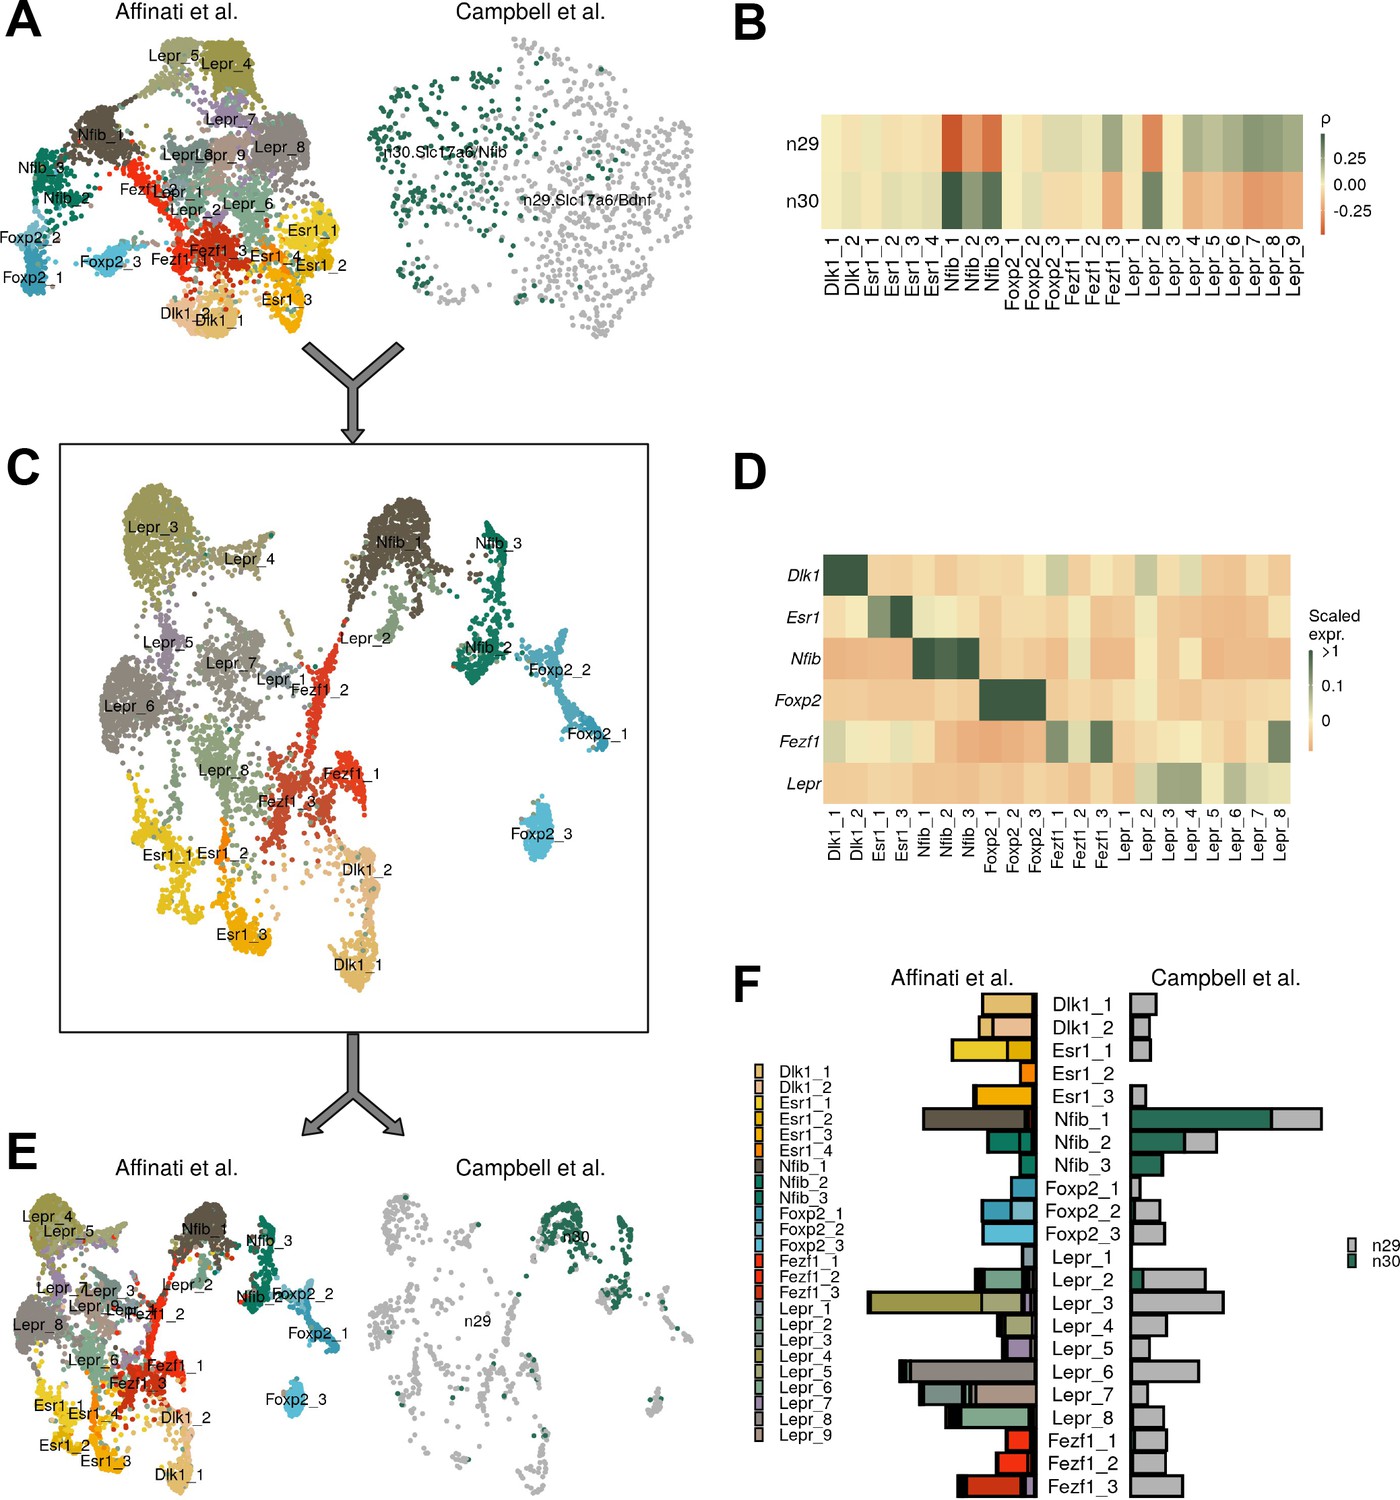
Comparison of data with ventromedial hypothalamic nucleus (VMH) data from Campbell et al.
(A) UMAP of each dataset separately. (B) Pairwise expression correlation of variable genes for each cluster in each dataset. (C) UMAP of canonical correlation analysis (CCA)-integrated data, colored by cluster. (D) Mean scaled expression of marker genes for each cluster. (E) UMAP of integrated data, by dataset of origin. (F) Breakdown of cluster designation from original dataset and integrated dataset.
Figure 2—figure supplement 3
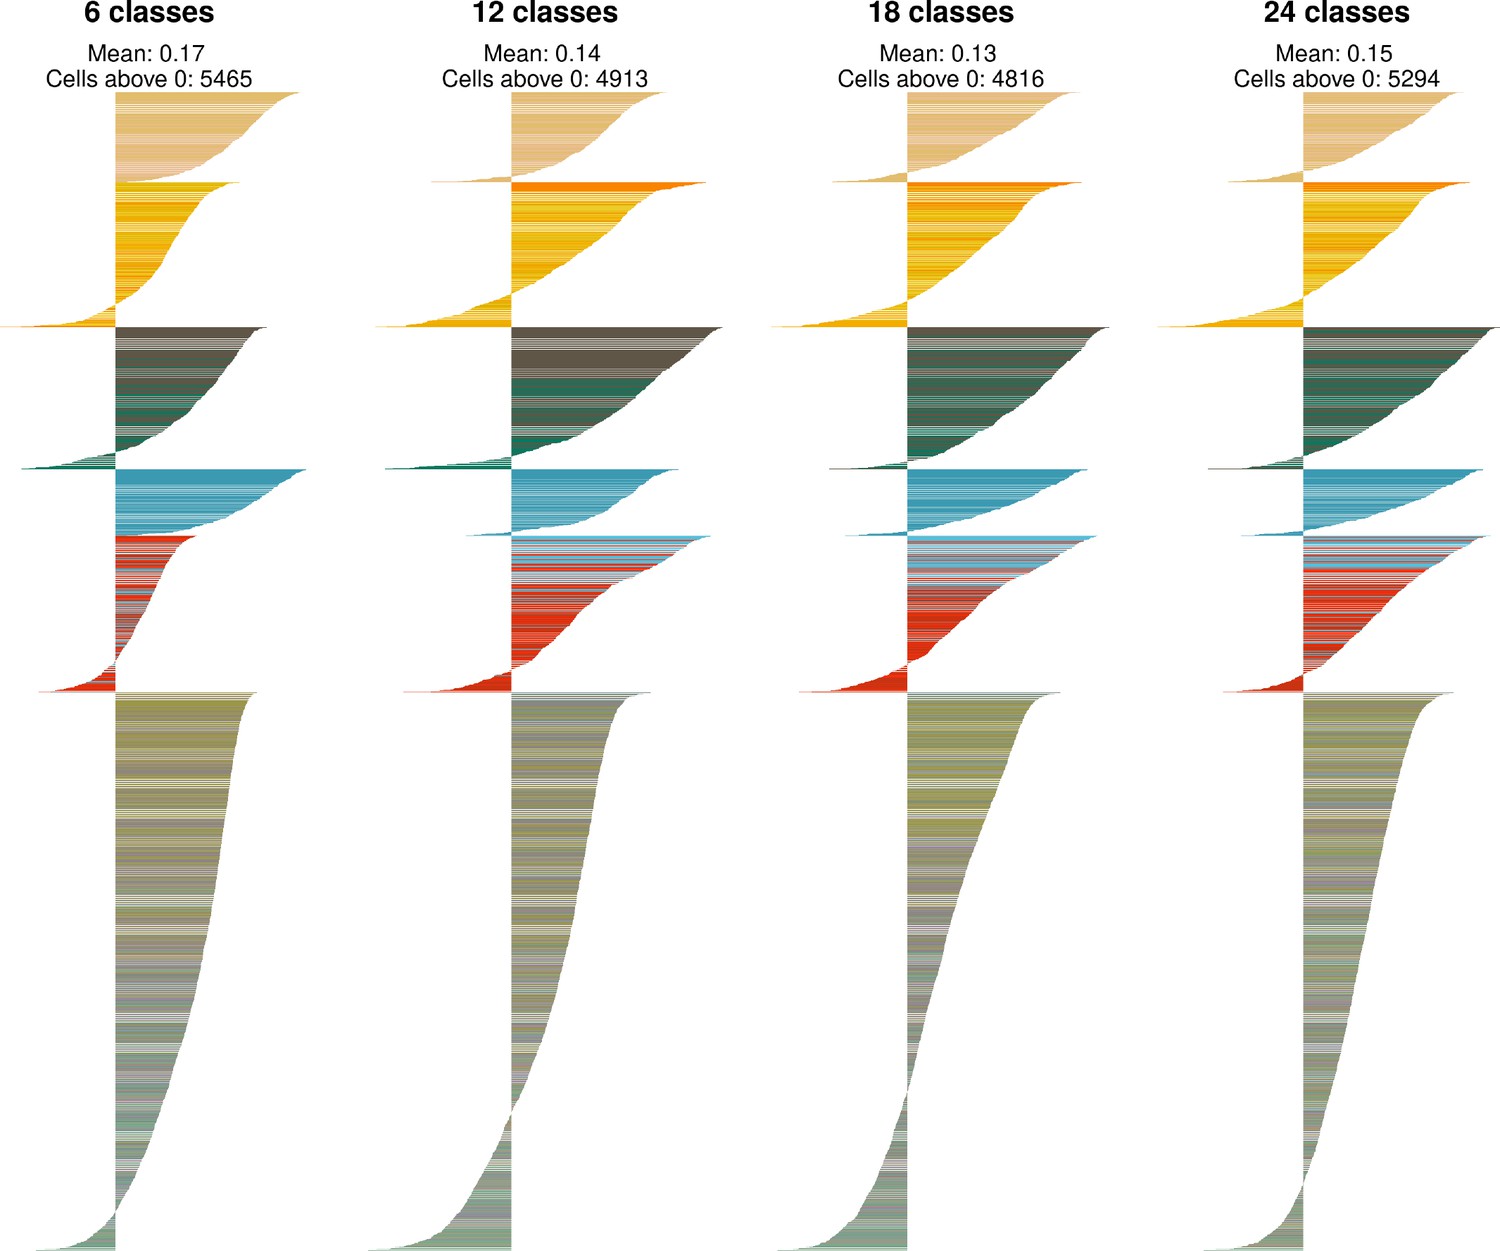
Identification of ventromedial hypothalamic nucleus (VMH) neuronal ‘classes’.
The silhouette width for each cell for each level of VMH neuron classification. The mean silhouette width and the number of cells with a silhouette width greater than 0 are noted above the plot. Cells are colored by their cluster color in Figure 2A.
Figure 2—figure supplement 4
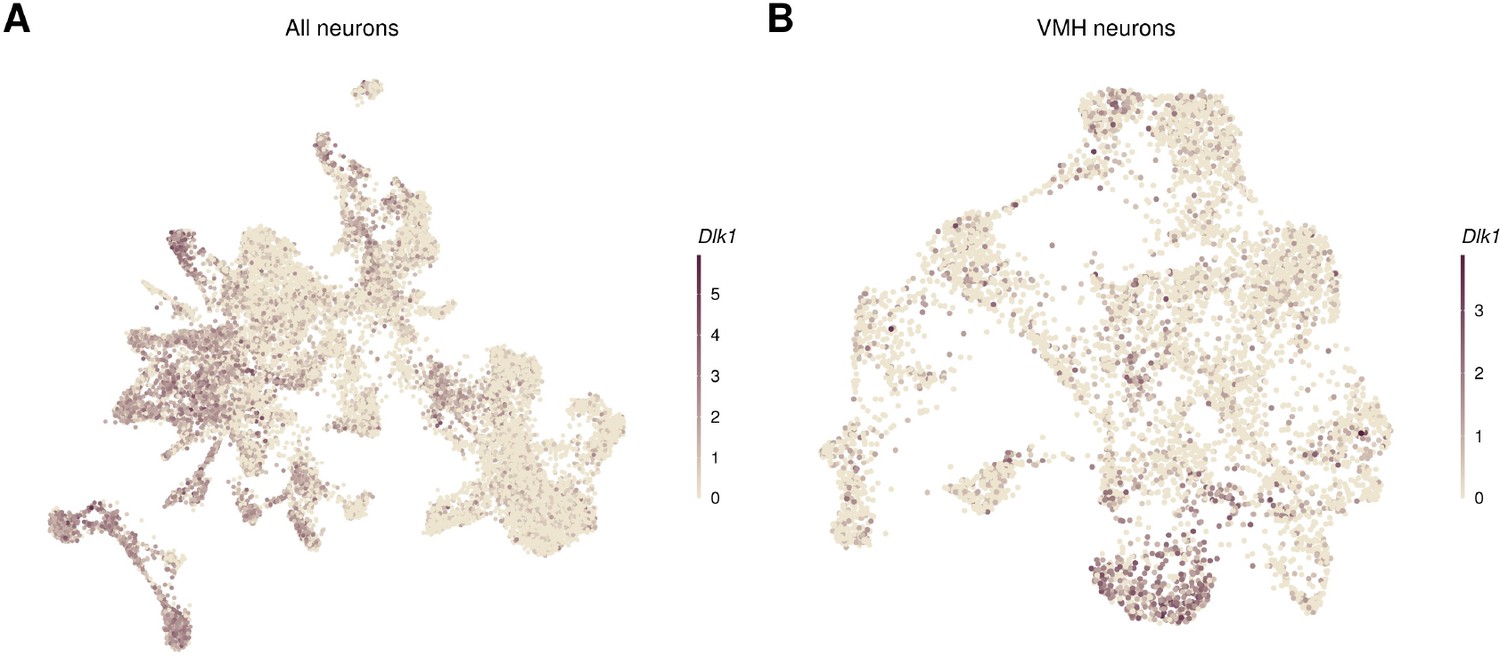
Dlk1 is expressed in neurons adjacent to the ventromedial hypothalamic nucleus (VMH).
Dlk1 expression in the UMAP of (A) all neurons (with the VMH neurons outlined) and (B) VMH neurons.
Figure 2—figure supplement 5
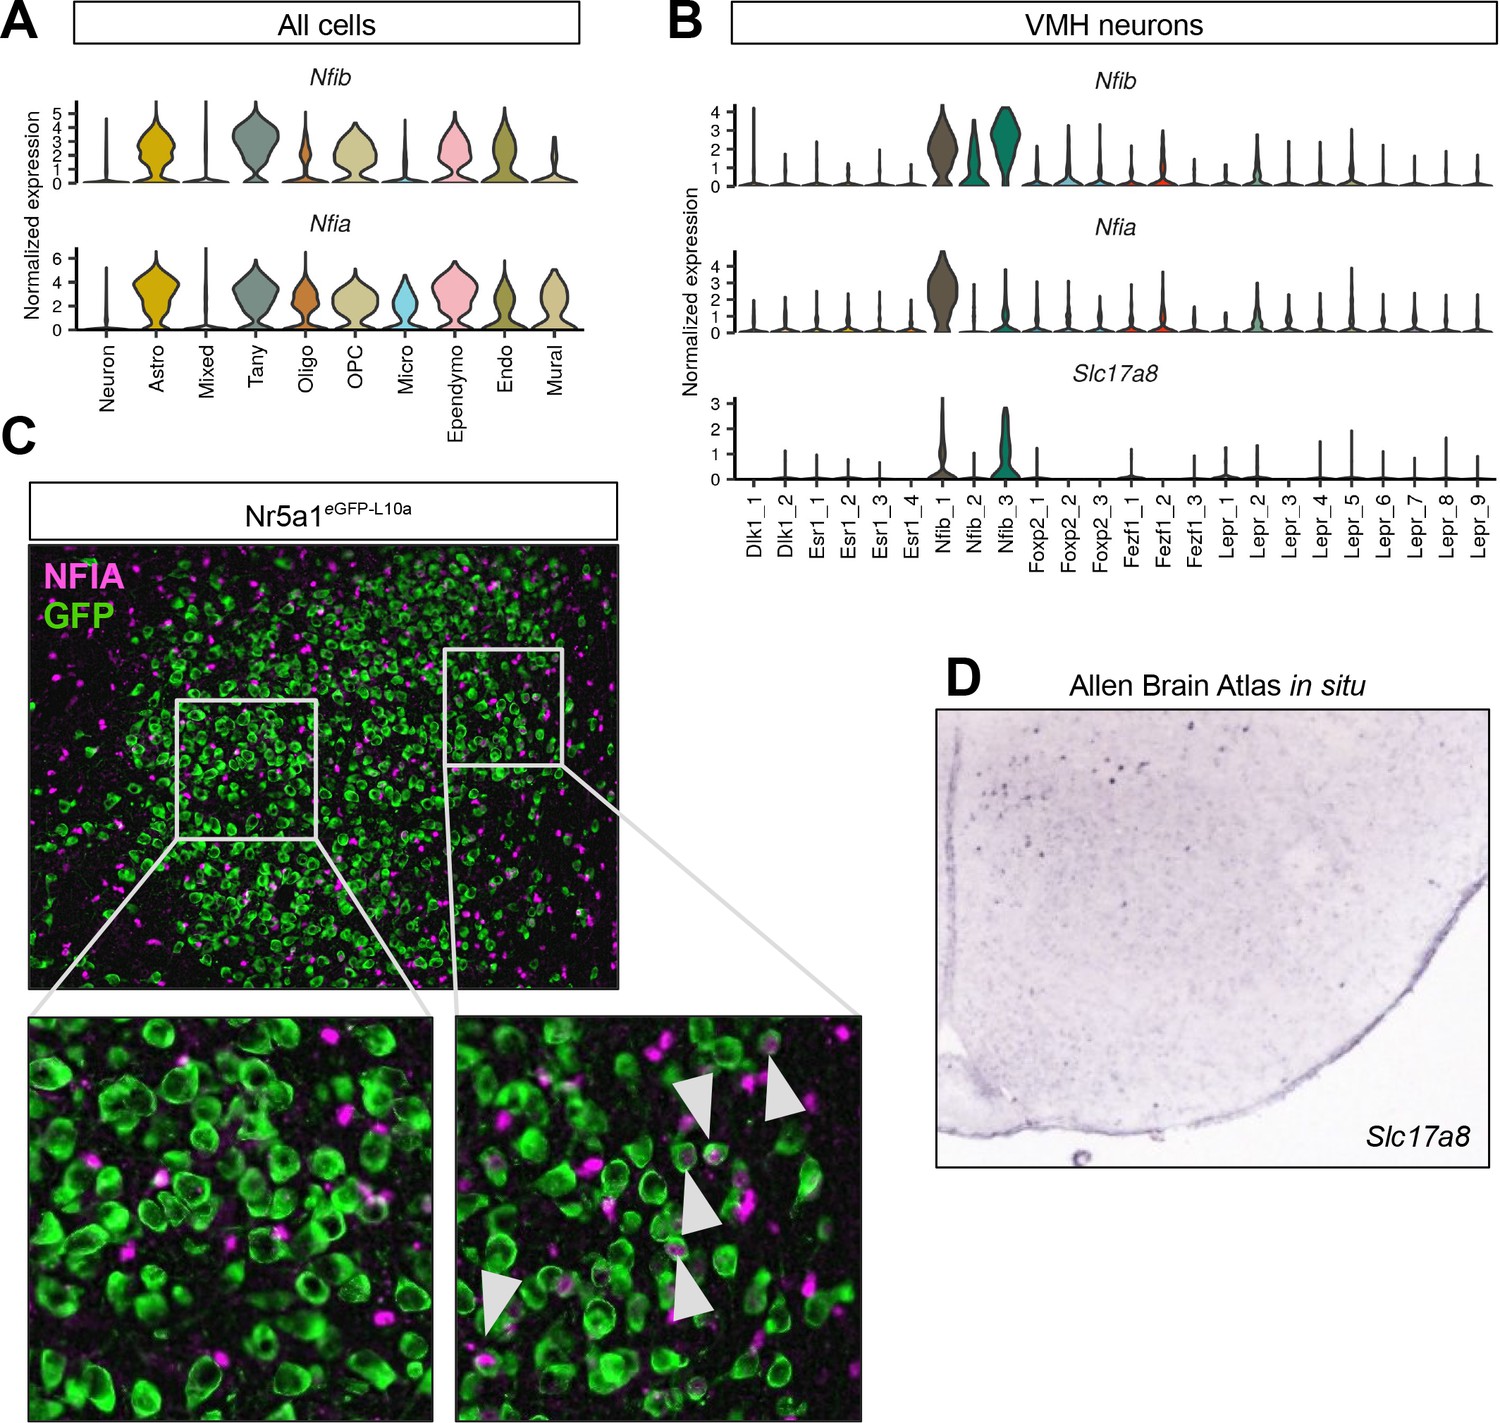
Ventromedial hypothalamic nucleus (VMH) Nfib population localizes to dorsomedial compartment.
(A–B) Nfia marks (B) a subset of VMHNfib neurons but is also widely expressed in (A) non-neuronal populations in the VMH. (C) Representative image showing GFP-IR (green) and NFIA-IR (magenta) in Nr5a1eGFP-L10a (Nr5a1-Cre;R26eGFP-L10a) mice; white arrowheads indicate colocalization. (B) Slc17a8 is a marker for VMHNfib cells and (D) is expressed in the most dorosmedial VMH according to the Allen Brain Atlas in situ database.
Figure 2—figure supplement 6
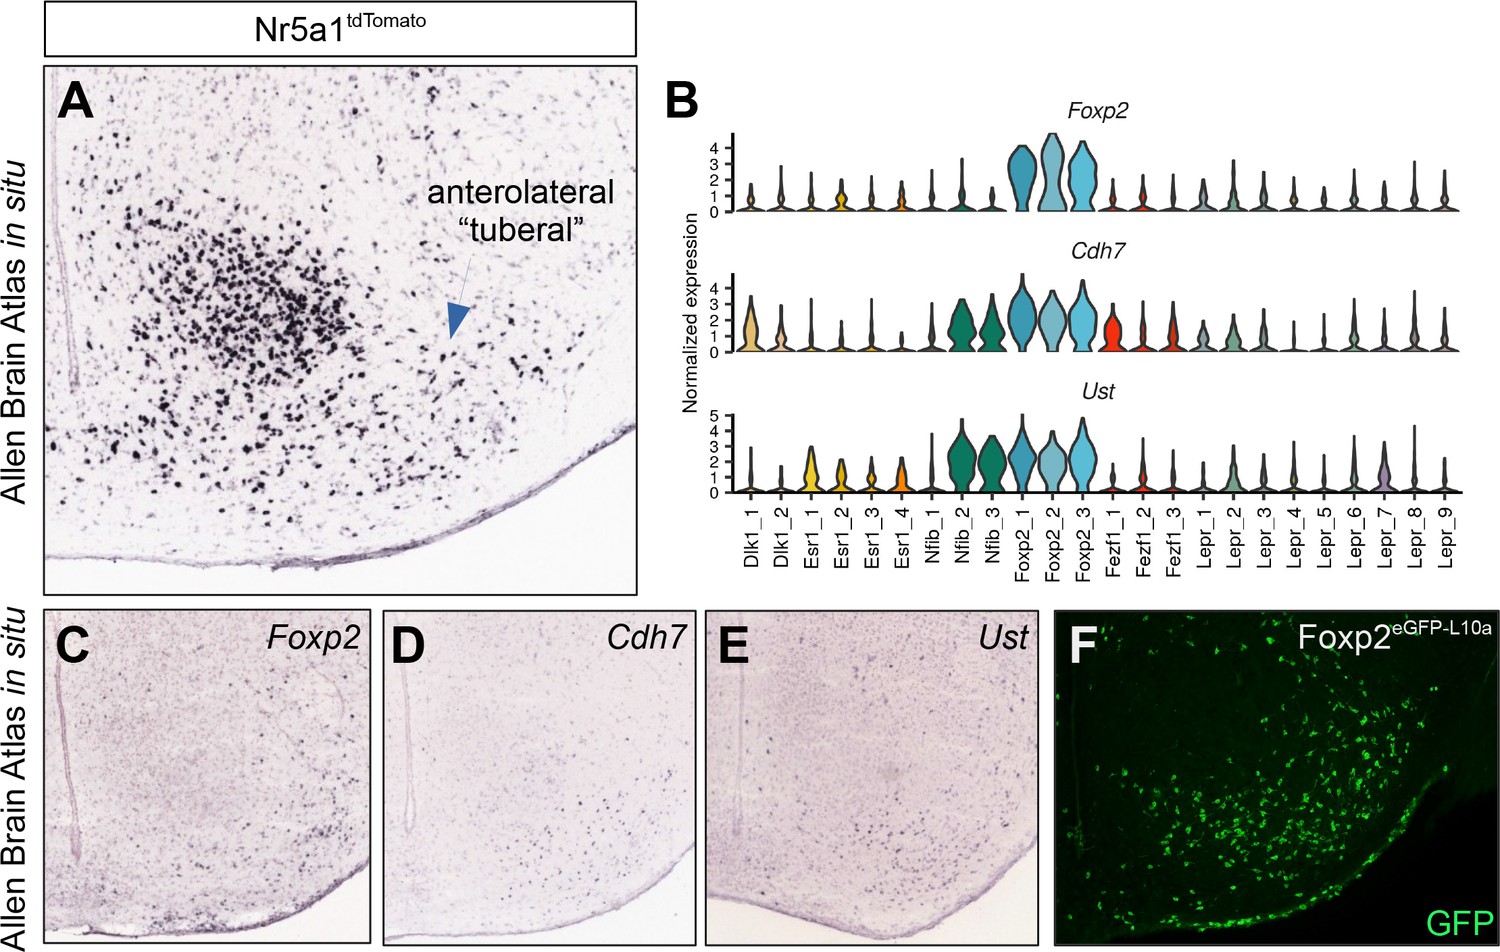
Foxp2 population localizes to anterolateral (‘tuberal’) compartment.
(A) Allen Brain Atlas in situ for tdTomato in Nr5a1tdTomato mice (Nr5a1-Cre;R26LSL-tdTomato) shows widespread expression outside of the core ventromedial hypothalamic nucleus (VMH) in an area referred to as the tuberal nucleus. (B) The VMHFoxp2 population is also marked by Cdh7 and Ust expression. (C–E) Allen Brain Atlas in situ images for (C) Foxp2, (D) Cdh7, and (E) Ust show expression in the tuberal VMH. (F) Representative image showing the distribution of GFP-IR (green) in Foxp2eGFP-L10a (Foxp2Cre/+;R26eGFP-L10a) mice in the tuberal region.
Figure 3 with 1 supplement
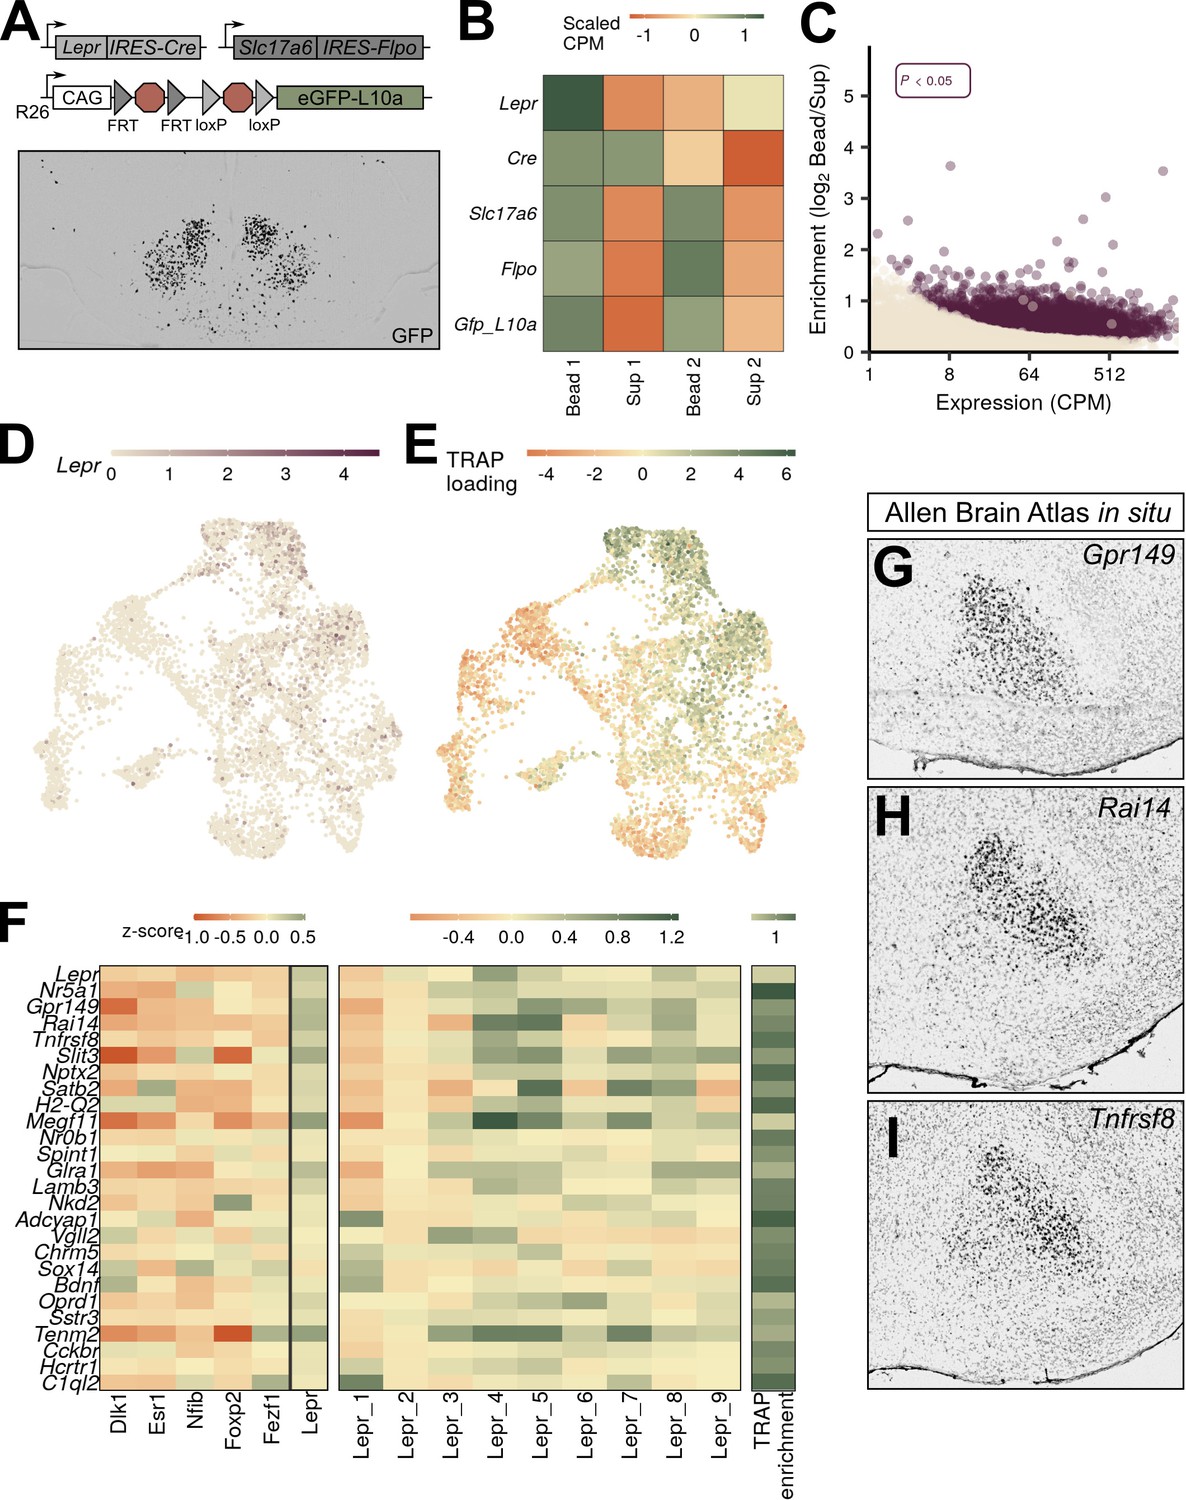
VMHLepr neurons represent a distinct class of ventromedial hypothalamic nucleus (VMH) neurons.
(A) Diagram of strategy to transcriptionally profile the VMHLepr neurons by crossing LeprCre and Slc17a6Flpo to a mouse line in which the ROSA26 (R26) locus contains a CAG-driven, Flp- and Cre-dependent eGFP:L10a allele (RCFLeGFP-L10a). (Below) A representative image of GFP-IR (black) expression in LeprCre;Slc17a6Flpo;RCFLeGFP-L10a (LeprSlc17a6-L10a) mice. (B) Scaled counts per million (CPM) for each gene in LeprSlc17a6-L10a mice. (C) Expression and enrichment of genes from LeprSlc17a6-L10a VMH pulldown. (D) Expression of Lepr in individual VMH neurons in UMAP space. (E) Magnitude of the first principal component after performing principal components analysis for the genes enriched in LeprSlc17a6-L10a VMH translating ribosome affinity purification with RNA-sequencing (TRAP-seq), projected into UMAP space. (F) Mean class expression (left), Lepr cluster expression (center), and LeprSlc17a6-L10a TRAP-seq enrichment (right) of the top genes unique to the VMHLepr population by both TRAP and pseudo-TRAP. (G–I) Sagittal Allen Brain Atlas in situ images for (G) Gpr149, (H) Rai14, and (I) Tnfrsf8; all probes shown in black.
Figure 3—figure supplement 1
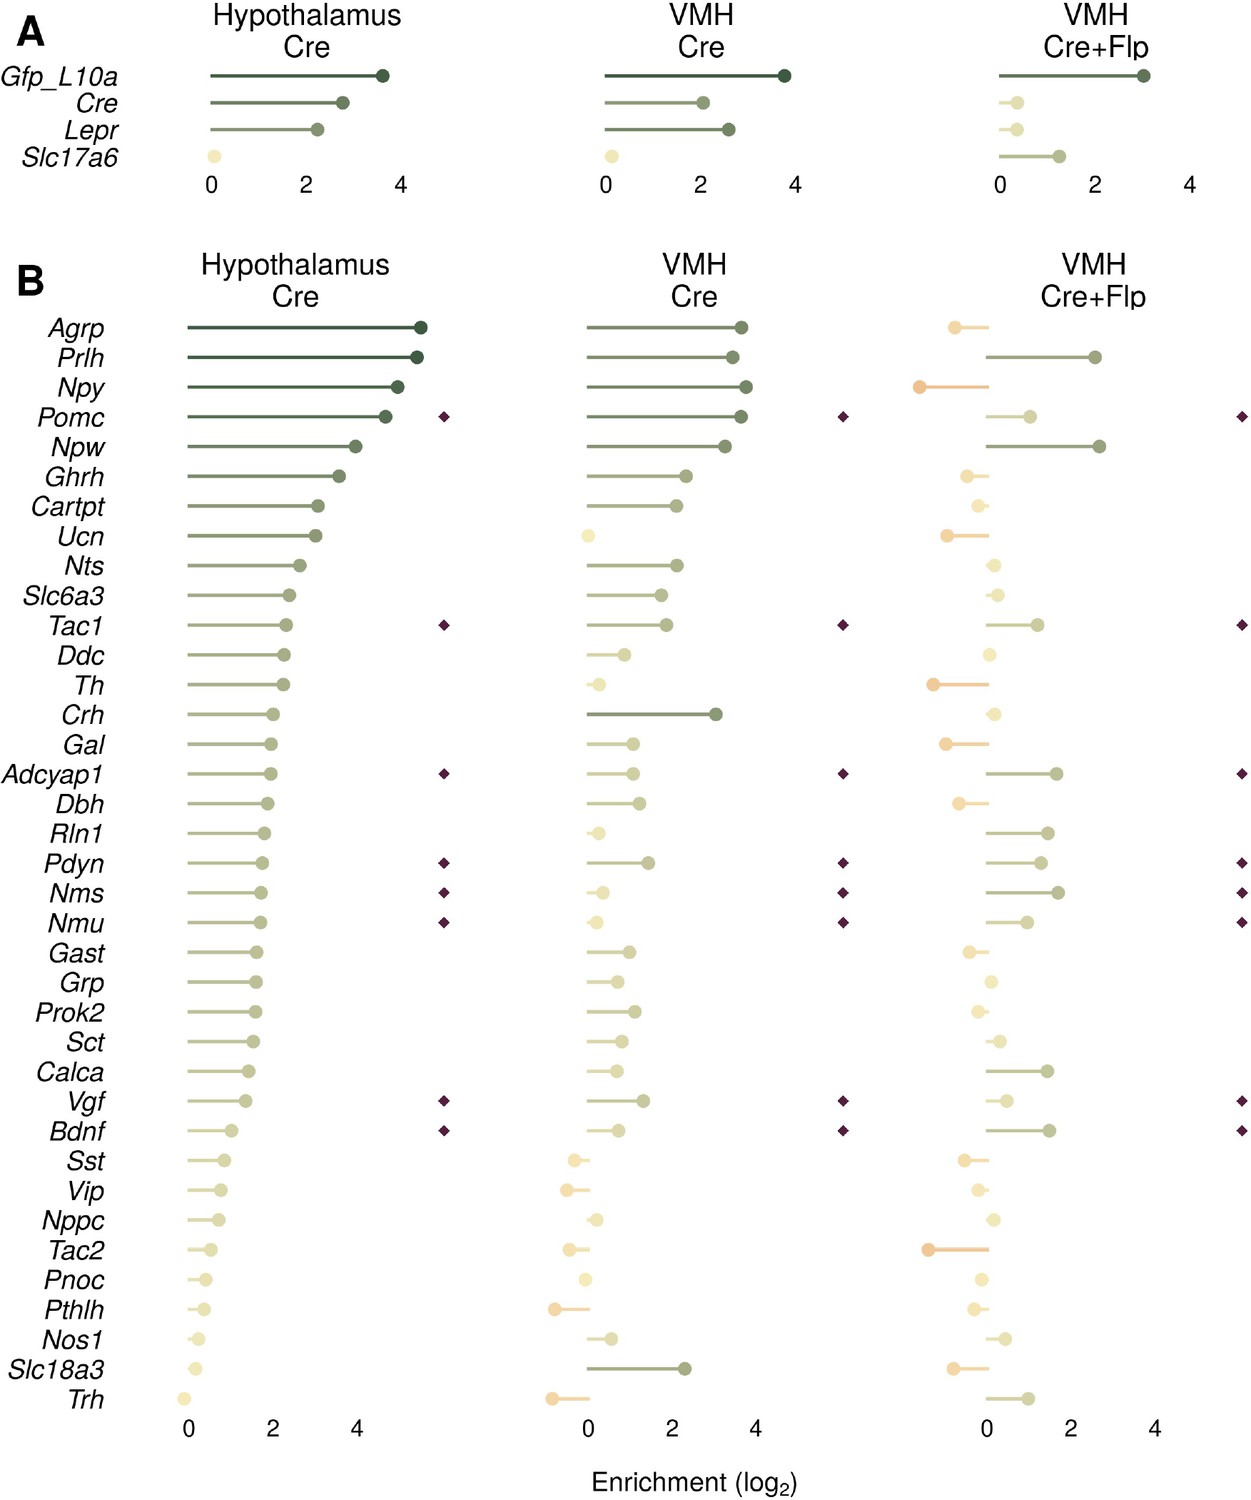
Comparison of different translating ribosome affinity purification with RNA-sequencing (TRAP-seq) approaches for identifying genes enriched in Lepr ventromedial hypothalamic nucleus (VMH) cells.
(A, B) Comparison of LepreGFP-L10a (LeprCre;R26LSL-eGFP-L10a) of the whole hypothlalmus (Hypothalamus Cre), LepreGFP-L10a with targeted dissection of the VMH (VMH Cre), and using the dual Flp- and Cre-dependent RCFLeGFP-L10a with LeprCre;Slc17a6Flpo mice (VMH Cre+Flp). (A) Enrichment of control genes in each dataset. (B) Enrichment of genes conferring neurochemical identity that are significantly enriched in any of the three datasets. Dark red diamonds signify genes that are significantly enriched in the Nr5a1eGFP-L10a TRAP-seq (presumptive VMH).
Figure 4 with 2 supplements
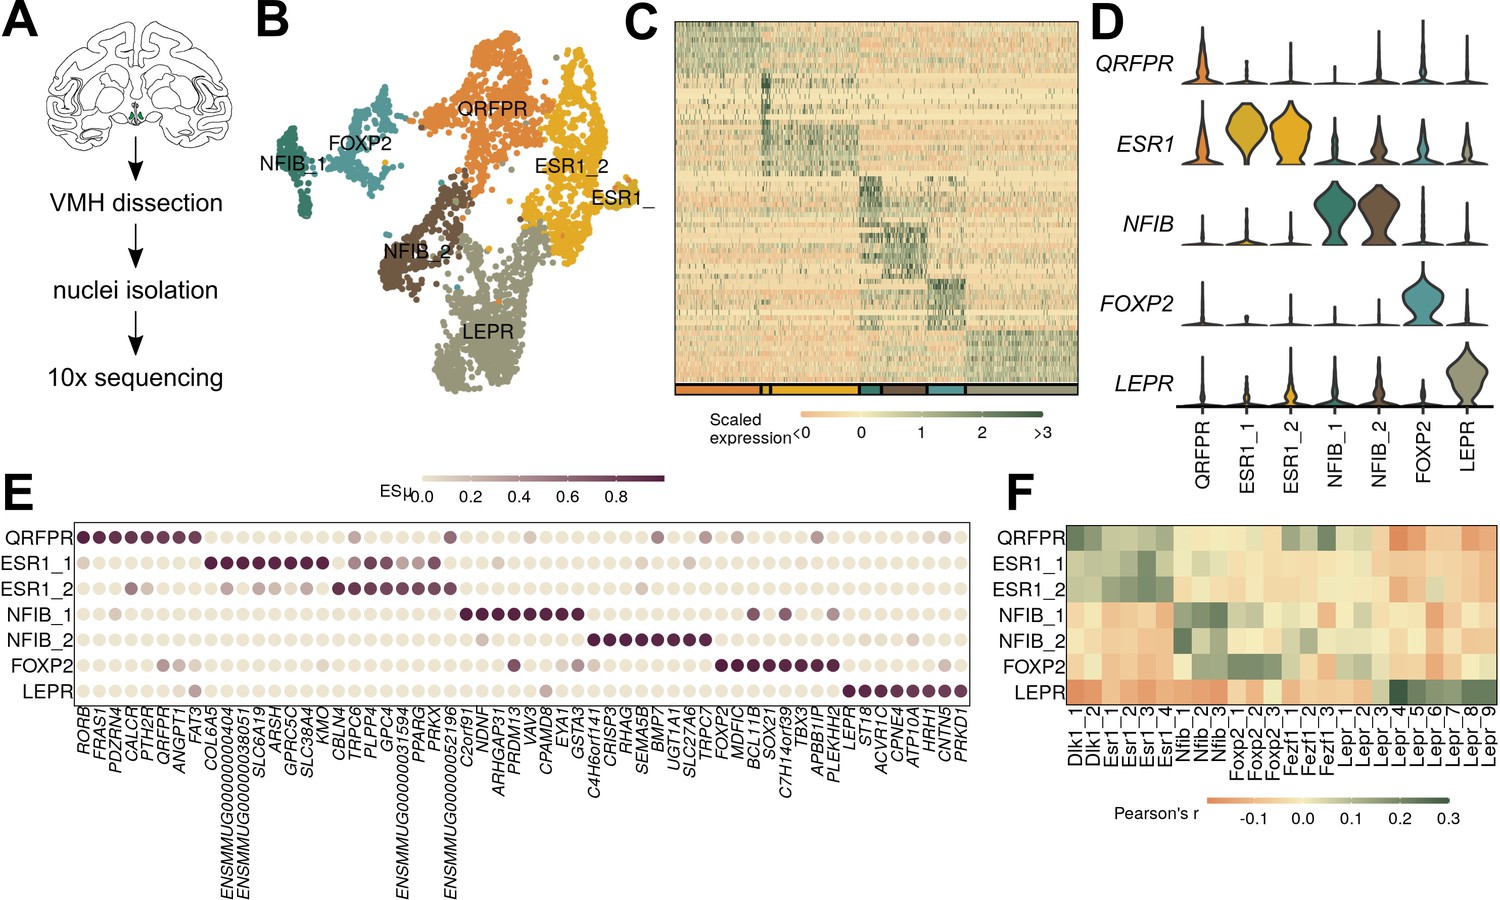
Macaque ventromedial hypothalamic nucleus (VMH) populations revealed by single-nucleus RNA-sequencing (snRNA-seq).
(A) Schematic of experimental process for macaque snRNA-seq. (B) UMAP of 3752 VMH neuronal nuclei colored and labeled by cluster designation. (C) Expression profile of the top enriched genes for each cluster. (D) Violin plot of normalized expression for marker genes for each VMH neuronal population. (E) ESµ for the top five marker genes for each cluster determined by CELLEX. (F) Pairwise scaled expression correlation (Pearson’s r) for each macaque and mouse VMH neuronal cluster.
Figure 4—figure supplement 1
Macaque single-nucleus RNA-sequencing (snRNA-seq) identifies major CNS classes.
(A–C) The number of (A) cells, (B) genes, and (C) UMIs detected per sample used in this study after quality control. (D–E) UMAP of all cells, colored by (D) sample and (E) cluster. (F) Average percent of cells in each cluster across all samples. (G) Representative marker genes for each of the major CNS cell types. (H) Expression profile of top 10 enriched genes for each cluster. (I) UMAP representation of cell-type classification. (J) Quantification of cell classes per sample.
Figure 4—figure supplement 2
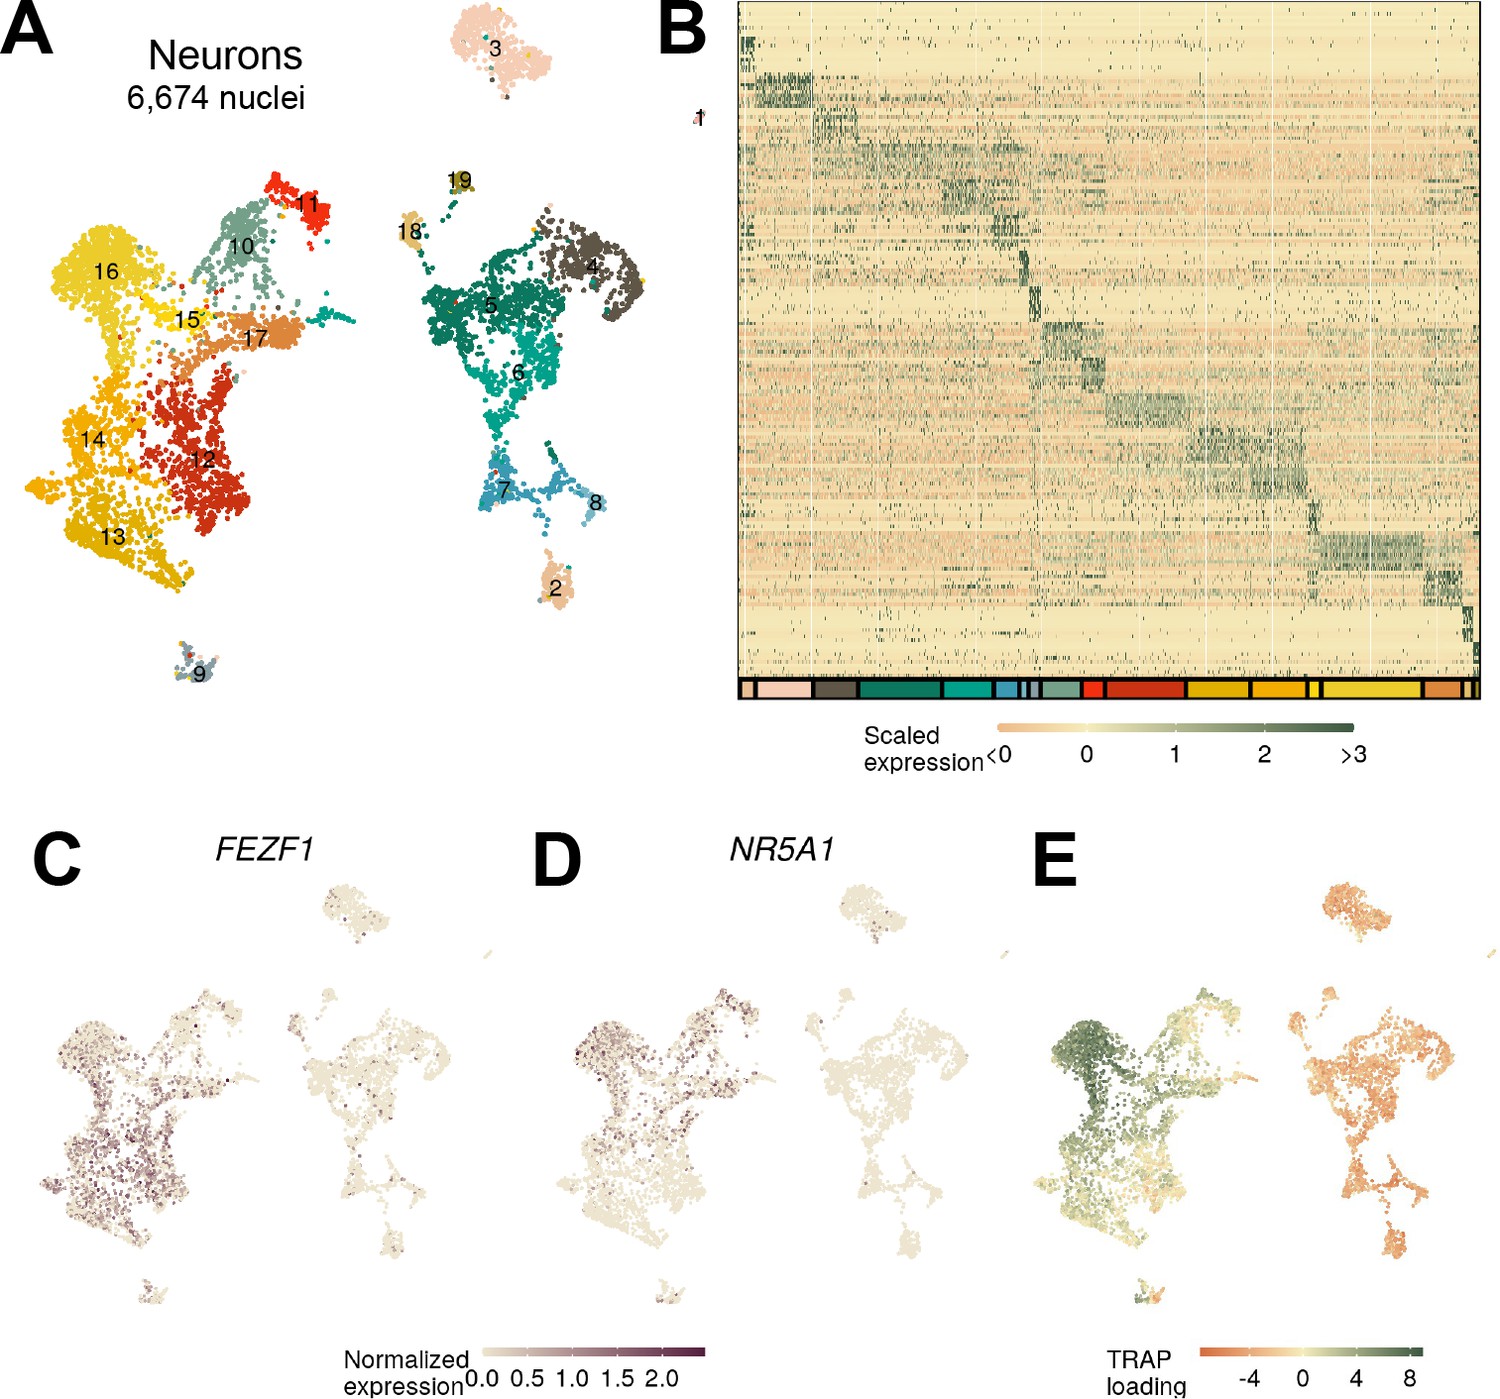
Identifying ventromedial hypothalamic nucleus (VMH) neurons in macaque.
(A) UMAP and labeling by cluster and (B) expression of top 10 genes for each macaque neuron cluster. (C) FEZF1 and (D) NR5A1 expression across the macaque neurons. (E) Loading on the top enriched mouse Nr5a1-Cre translating ribosome affinity purification with RNA-sequencing (TRAP-seq) genes.
Figure 5 with 2 supplements

Ventromedial hypothalamic nucleus (VMH) populations are conserved between mouse and macaque.
(A–B) Mouse and macaque single-nucleus RNA-sequencing (snRNA-seq) datasets were (A) merged using canonical correlation analysis and (B) projected onto UMAP space, colored here by species. (C) UMAP of VMH neuronal nuclei colored and labeled by cluster designation. (D) Mean scaled expression of marker genes across integrated clusters by species. (E) Proportion of cells in each cluster from the sample for each species (mean ± SEM). (F) Expression profile of the top enriched genes for each cluster. (G) Mapping of species-specific clusters onto the integrated clusters. (H) Species-specific ESµ for the top three marker genes for each integrated cluster determined by CELLEX.
Figure 5—figure supplement 1

Similarities of mouse and macaque clusters.
(A) Transferred cluster designations from mouse to macaque (and vice versa) using the Seurat canonical correlation analysis (CCA) projection, colored by median transfer score with dot size corresponding to the number of cells from a given cluster transferred to each cluster. (B) Number of high confidence marker genes (CELLEX ESμ>0.5) for each cluster and species. (C) Top gene ontology (GO) terms associated with genes common between the species. (D) Pairwise expression correlation of 4866 orthologous marker genes between mouse and macaque classes.
Figure 5—figure supplement 2
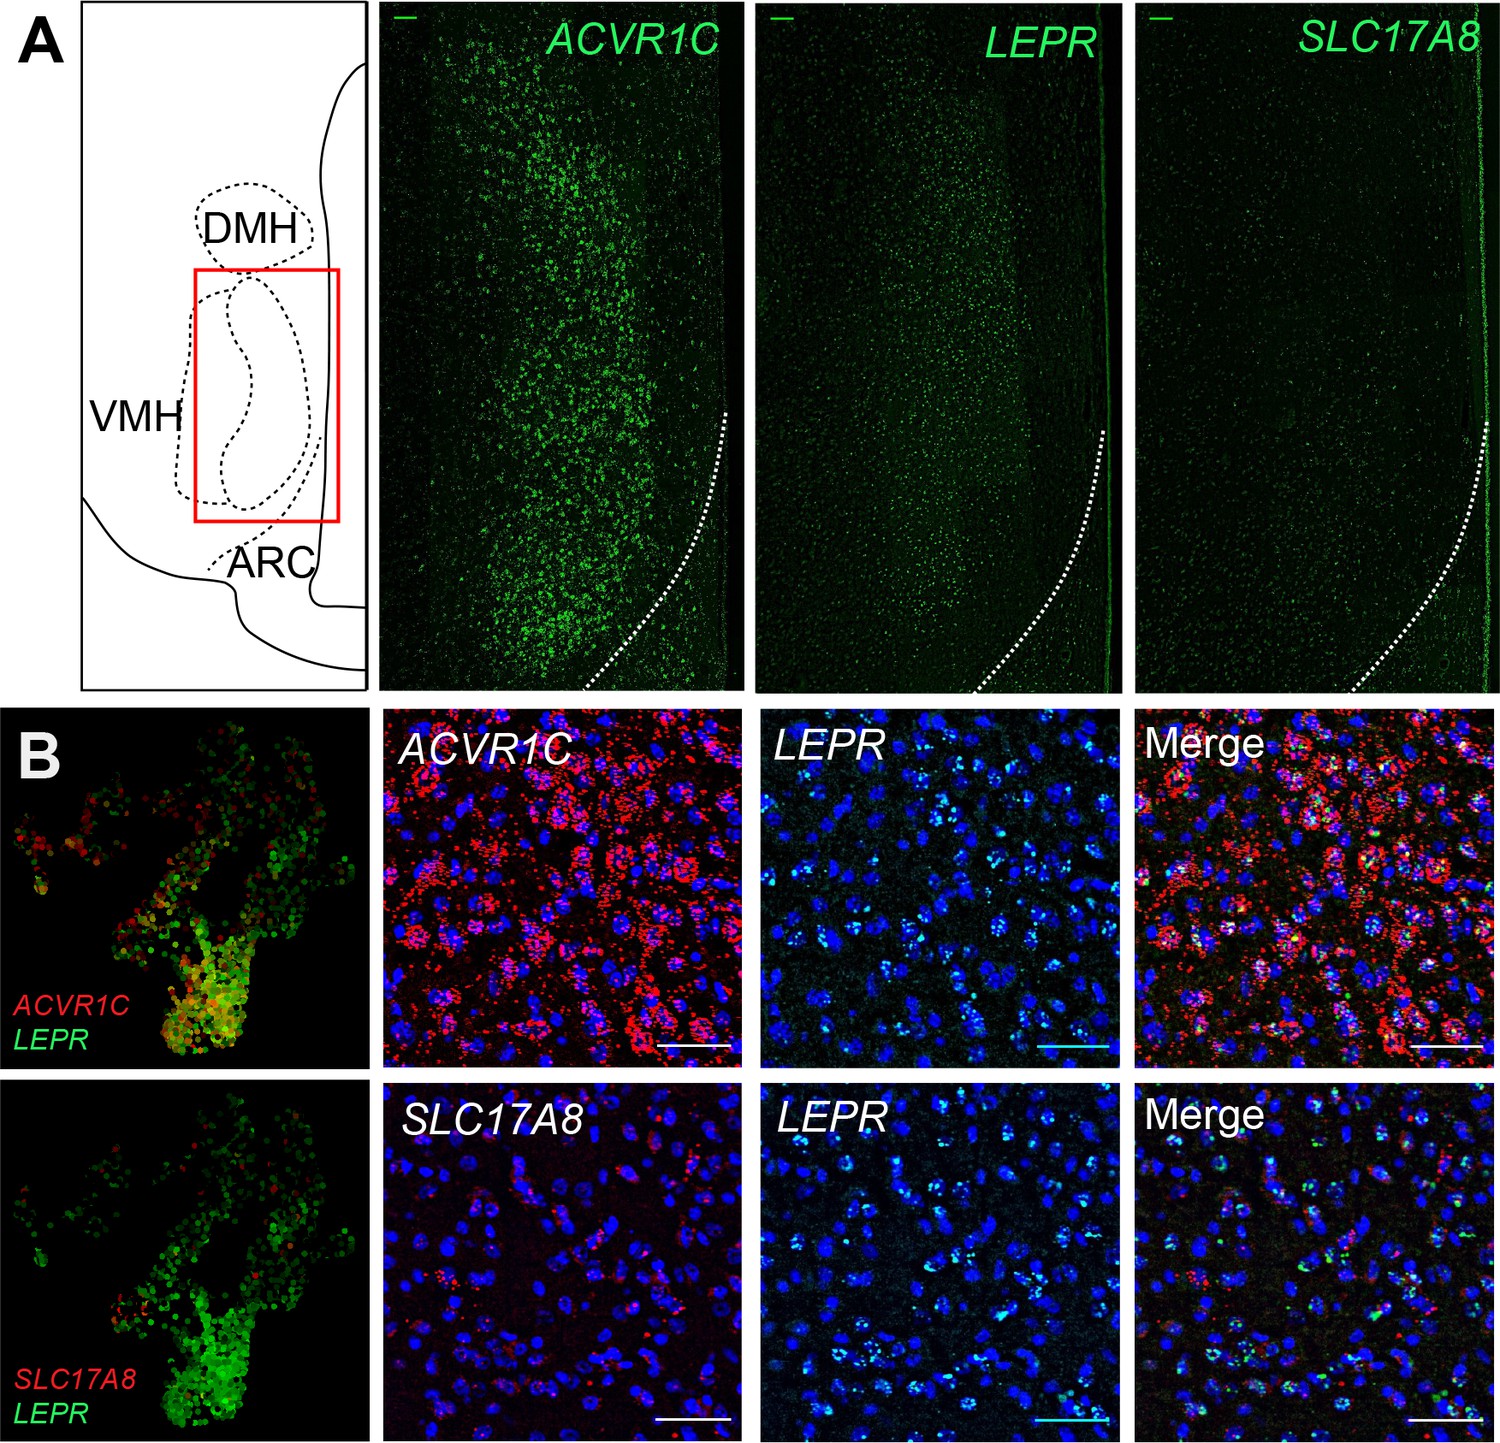
Cluster marker expression in macaque ventromedial hypothalamic nucleus (VMH).
(A) (Left column) Atlas image highlighting the region of interest and (other columns) representative fluorescent in situ hybridization images for ACVR1C, LEPR, and SLC17A8 (all in green). (B) (Left column) Expression of marker genes in the macaque VMH neurons, projected into UMAP space. (Other columns) Representative images showing DAPI (blue) and fluorescent in situ hybridization for ACVR1C (red, top) or SLC17A8 (red, bottom), LEPR (green), and merged images.
Additional files
-
Source data 1
ESμ values from CELLEX for each conserved ventromedial hypothalamic nucleus (VMH) neuron cluster using macaque data.
- https://cdn.elifesciences.org/articles/69065/elife-69065-data1-v3.csv
-
Source data 2
ESμ values from CELLEX for each conserved ventromedial hypothalamic nucleus (VMH) neuron cluster using mouse data.
- https://cdn.elifesciences.org/articles/69065/elife-69065-data2-v3.csv
-
Supplementary file 1
Nr5a1eGFP-L10a ventromedial hypothalamic nucleus (VMH) translating ribosome affinity purification with RNA-sequencing (TRAP-seq) enrichment results.
- https://cdn.elifesciences.org/articles/69065/elife-69065-supp1-v3.csv
-
Supplementary file 2
Ventromedial hypothalamic nucleus (VMH) pseudo-translating ribosome affinity purification with RNA-sequencing (TRAP) enrichment results.
- https://cdn.elifesciences.org/articles/69065/elife-69065-supp2-v3.csv
-
Supplementary file 3
ESμ values from CELLEX for each mouse ventromedial hypothalamic nucleus (VMH) neuron cluster.
- https://cdn.elifesciences.org/articles/69065/elife-69065-supp3-v3.csv
-
Supplementary file 4
ESμ values from CELLEX for each mouse ventromedial hypothalamic nucleus (VMH) neuron class.
- https://cdn.elifesciences.org/articles/69065/elife-69065-supp4-v3.csv
-
Supplementary file 5
LeprSlc17a6-L10a ventromedial hypothalamic nucleus (VMH) translating ribosome affinity purification with RNA-sequencing (TRAP-seq) enrichment results.
- https://cdn.elifesciences.org/articles/69065/elife-69065-supp5-v3.csv
-
Supplementary file 6
Ventromedial hypothalamic nucleus (VMH) Lepr pseudo-translating ribosome affinity purification with RNA-sequencing (TRAP) enrichment results.
- https://cdn.elifesciences.org/articles/69065/elife-69065-supp6-v3.csv
-
Supplementary file 7
ESμ values from CELLEX for each macaque ventromedial hypothalamic nucleus (VMH) neuron cluster.
- https://cdn.elifesciences.org/articles/69065/elife-69065-supp7-v3.csv
-
Supplementary file 8
ESμ values from CELLEX for each conserved ventromedial hypothalamic nucleus (VMH) neuron cluster using combined data.
- https://cdn.elifesciences.org/articles/69065/elife-69065-supp8-v3.csv
-
Transparent reporting form
- https://cdn.elifesciences.org/articles/69065/elife-69065-transrepform-v3.docx
Download links
A two-part list of links to download the article, or parts of the article, in various formats.
Downloads (link to download the article as PDF)
Open citations (links to open the citations from this article in various online reference manager services)
Cite this article (links to download the citations from this article in formats compatible with various reference manager tools)
Cross-species analysis defines the conservation of anatomically segregated VMH neuron populations
eLife 10:e69065.
https://doi.org/10.7554/eLife.69065


