Blood-brain barrier-restricted translocation of Toxoplasma gondii from cortical capillaries
- Department of Molecular Biosciences, The Wenner-Gren Institute, Stockholm University, Sweden
Figures
Figure 1 with 1 supplement
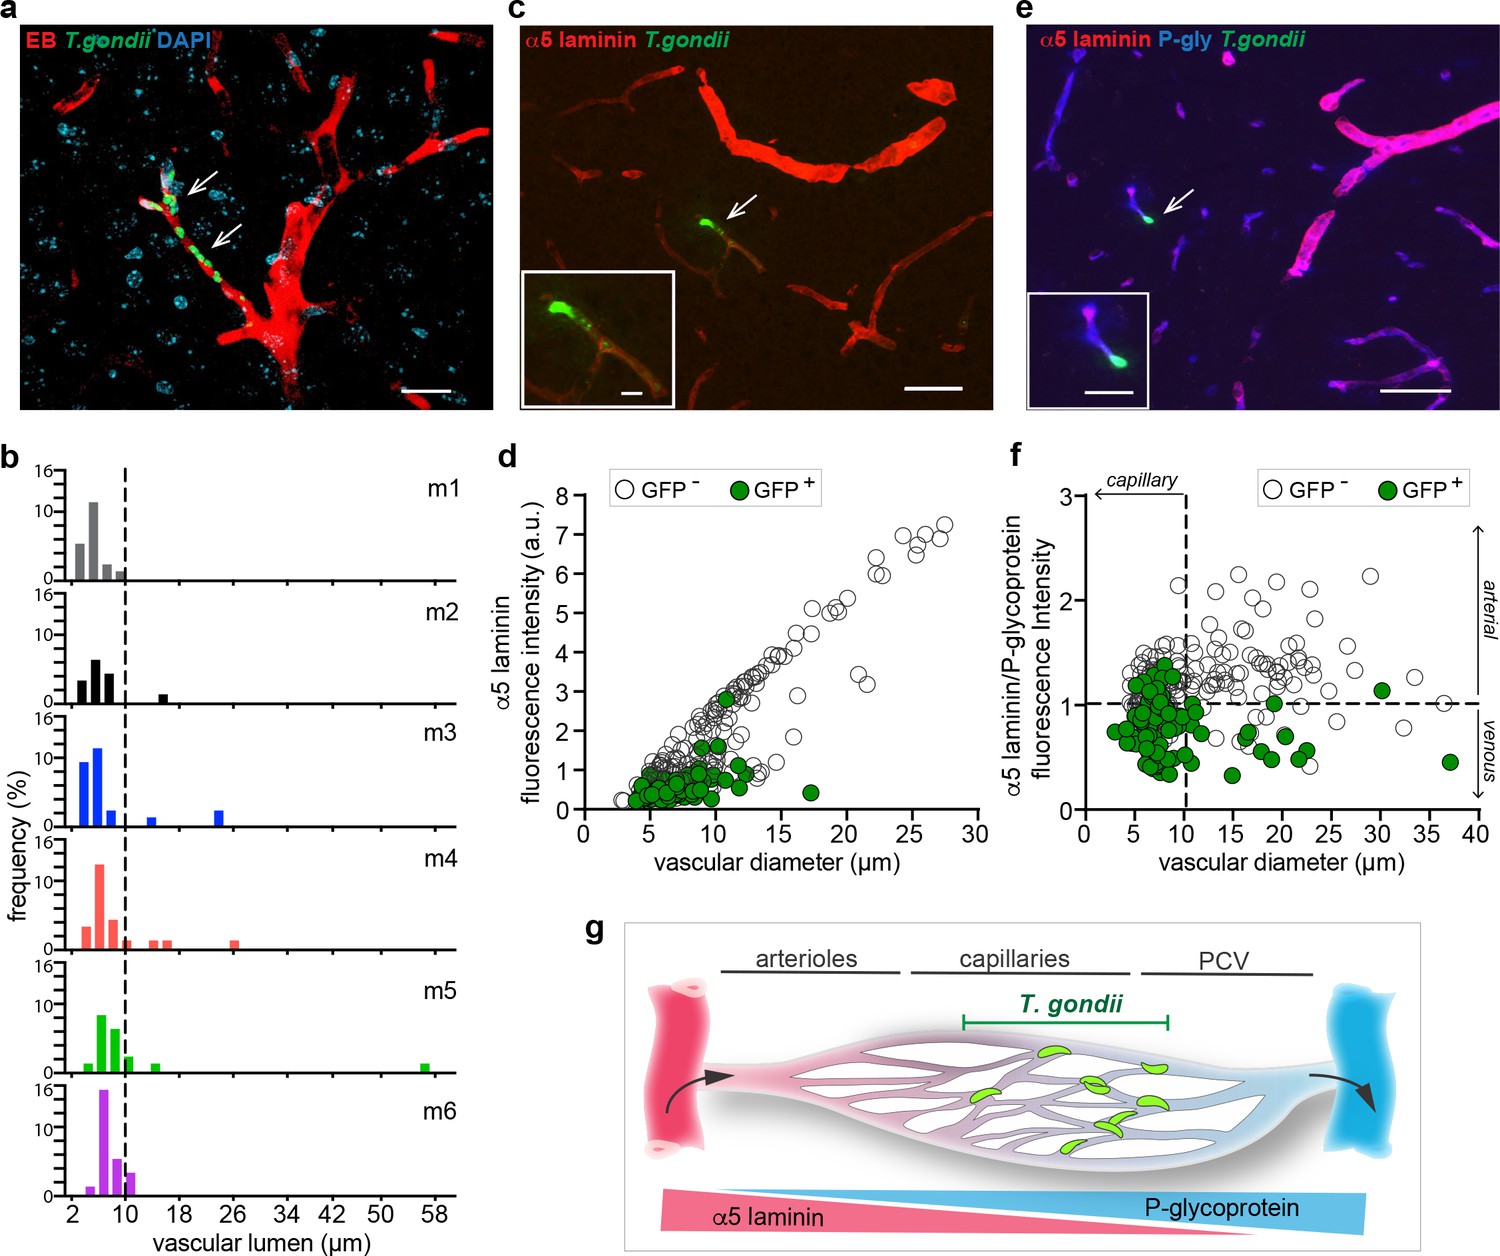
Localization of T. gondii tachyzoites in the cortical vasculature.
C57BL/6 mice were challenged i.v. with 3–10 × 106 T. gondii GFP-expressing tachyzoites (RH) and brains were extracted 72 hr post-inoculation. (a) Representative confocal micrograph of cortical section shows intraluminal vascular staining (EB) and nuclear staining (DAPI). Arrowheads indicate localization of tachyzoites. Scale bar, 20 μm. (b) Graphs show the relative frequency (%) of blood vessels (EB+) with associated T. gondii tachyzoites (GFP+) related to the luminal diameter (µm). Data is from three tissue sections per mouse from 6 mice (m1-6) ranging between 14 and 25 GFP+ vessels per mouse. (c) Immunofluorescence staining of cortical section for α5 laminin. Arrowhead and inset show T. gondii (GFP+) in vicinity of a vessel with relatively low α5 laminin signal. Scale bars, 50 μm, inset 10 μm. (d) Quantification of the relative fluorescence intensity (arbitrary units, a.u.) of α5 laminin signal in GFP- and GFP+ vasculature, related to the blood vessel diameter (µm). Data is from a total of 284 vessels in three sections per mouse (n = 3 mice). ANCOVA, F (1, 281) = 36.931, p < 0.0001. (e) Representative immunofluorescence micrograph of cortical section stained for α5 laminin and P-glycoprotein (P-gly). Arrowhead and inset show T. gondii (GFP+) in the vicinity of a vessel. Scale bars, 50 μm, inset 10 μm. (f) Quantification of the relative fluorescence intensity (a.u.) ratio α5 laminin / P-glycoprotein, related to the blood vessel diameter (µm). Data is from a total of 275 vessels in three sections per mouse (n = 3 mice). ANCOVA, F (1, 272) = 80.255, p< 0.0001. (g) Schematic representation of the cortical microvasculature illustrates the preferential localization of T. gondii to capillaries and, to a lesser extent, post-capillary venules (PCV) in the brain parenchyma. Triangles indicate the relative expression of the vascular markers α5 laminin and P-glycoprotein in arterioles, capillaries, and PCV.
Figure 1—figure supplement 1

Representative epifluorescence micrographs of α5 laminin and α4 laminin co-stainings in isolated brain microvessels.
DAPI indicates nuclear staining. Asterisks indicate the higher relative fluorescence intensity signal of α5 laminin staining in larger microvessels (vascular diameter Ø > 10 μm) compared with smaller microvessels (Ø < 10 μm, capillaries), while the relative fluorescence intensity signal of α4 laminin staining is even in small and large microvessels. Scale bars, 25 µm.
Figure 2 with 1 supplement

Parasite loads in peripheral organs and localization to vasculature in brain tissue.
(a, b, d-g) C57BL/6 mice or (c) BALB/c mice were challenged i.v. with 3–10 × 106 T. gondii GFP-expressing tachyzoites (RH). (a) Representative epifluorescence micrographs of brain, lung and liver sections, respectively, at indicated time-points post-inoculation. Arrowheads indicate localization of GFP-expressing T. gondii tachyzoites at early time-points. Brain sections show intraluminal vascular tracer (EB) injected prior to organ extraction. Scale bars, 50 μm. (b, c) Parasite loads in brain, lung and liver tissue, respectively, at indicated time-points of C57BL/6 mice (b) or BALB/c mice (c) were quantified by plaquing assays. Data show mean ± SEM (n = 3 mice per time-point) *p < 0.05, Kruskal-Wallis test, followed by Dunn’s post-hoc test. (d, e) Representative immunofluorescence micrographs of brain sections show intraluminal vascular staining (EB) and localization of GFP-expressing T. gondii tachyzoites in (d) meningeal vessels and (e) CP 72 hr post-inoculation. Arrows indicate parasite localization. Asterisks indicate sub-meningeal penetrating cortical vessel and characteristic morphology of CP (Figure 2—figure supplement 1), respectively. Scale bars, 50 μm. (f, g) Box-and-whisker dot plots show for (f) total numbers of parasite foci, defined as presence of replicating GFP+ T. gondii, in CP, meninges and parenchyma, and (g) total parasite foci numbers related to tissue area (mm2), respectively, 72 hr post-inoculation. Medians with 25th to 75th percentile of datasets are shown. Whiskers mark 5th and 95th percentile. Each dot represents mean value per brain section in three consecutive brain sections per mouse from separate experiments (n = 6 mice). **p < 0.01; ****p < 0.0001; ns, non-significant, Kruskal-Wallis test, Dunn’s post-hoc test.
Figure 2—figure supplement 1
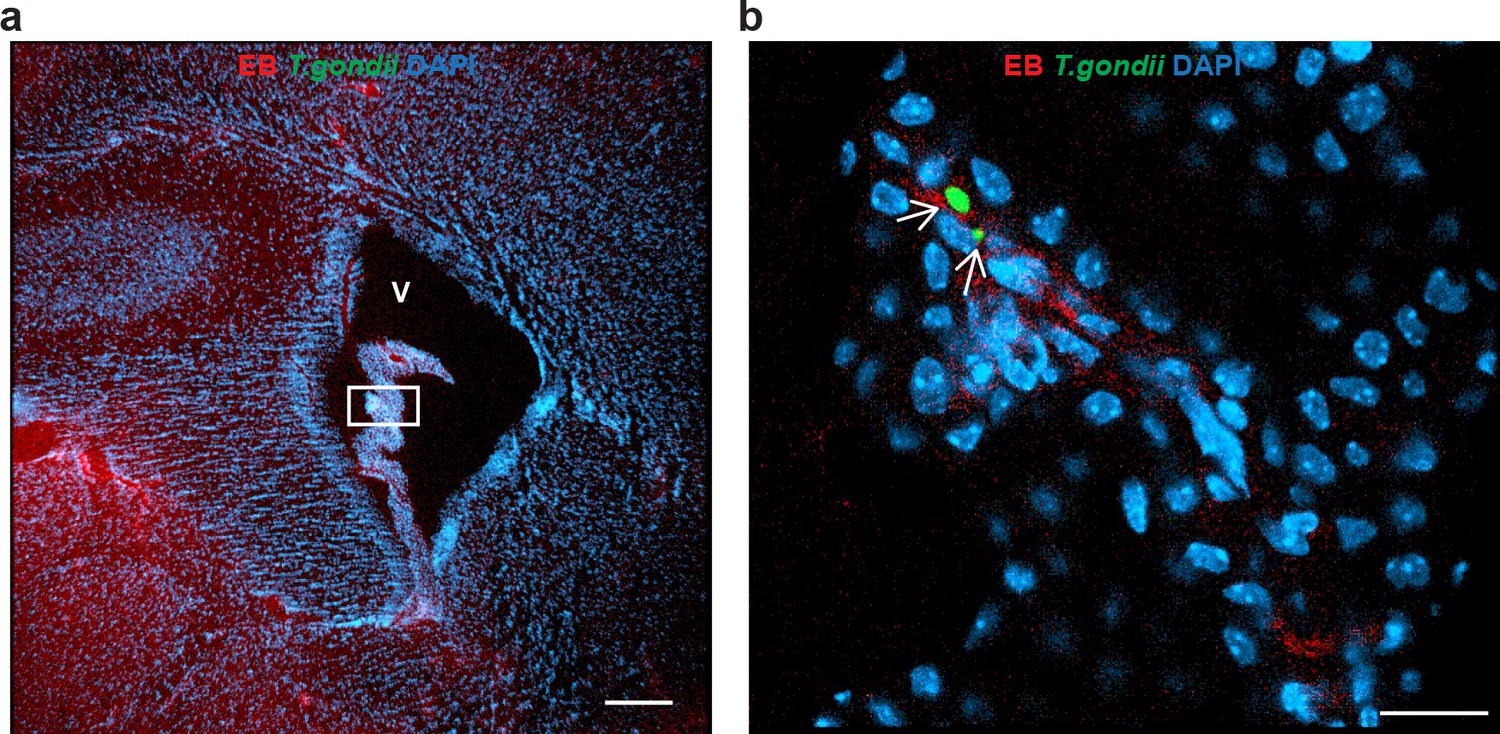
Characterization of T. gondii infection in the choroid plexus.
(a) Representative immunofluorescence micrograph of brain section shows characteristic morphology of the choroid plexus within the ventricular space (V). DAPI indicates nuclear staining and intraluminal vascular staining was performed with EB. Rectangle indicates magnified area shown in (b). Scale bar, 200 μm(b) Magnification of (a) shows localization of GFP-expressing T. gondii tachyzoites (arrowheads), intraluminal vascular staining (EB) and nuclear staining (DAPI). Scale bar, 20 μm.
Figure 3 with 2 supplements
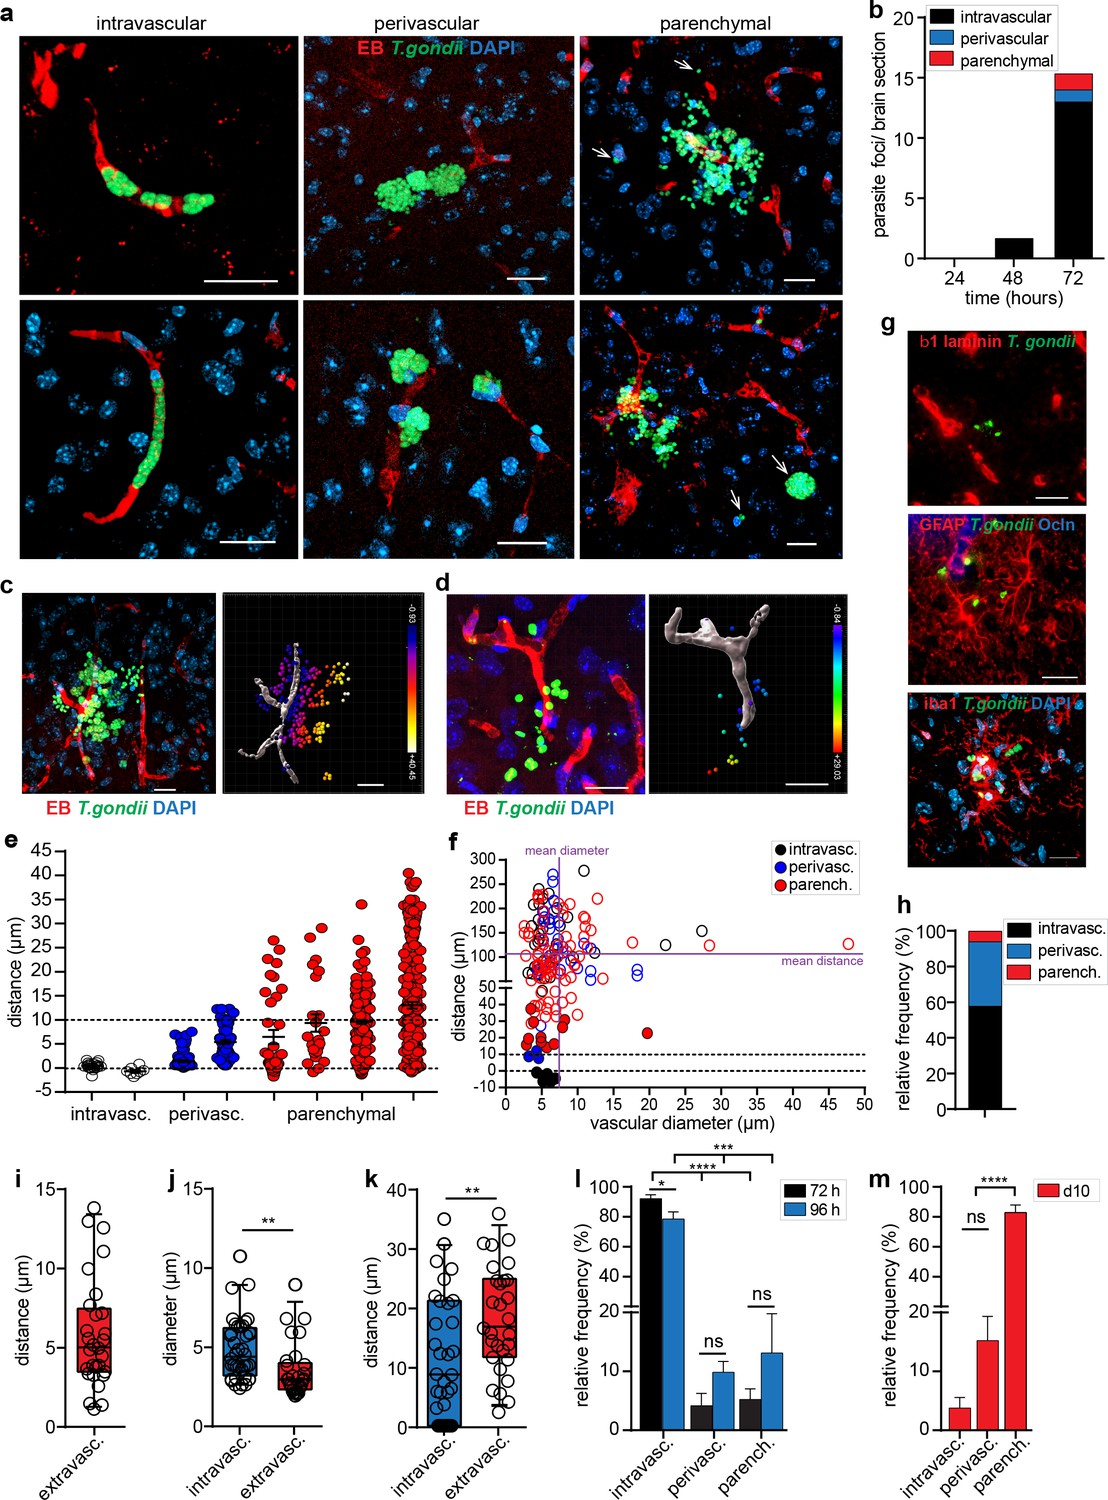
Distribution of parasite loads and invasion of the brain parenchyma by T. gondii tachyzoites.
(a–b) C57BL/6 mice were challenged i.v. with 1–3 × 10⁶ T. gondii GFP-expressing tachyzoites (RH). (a) Representative confocal micrographs of parasite foci with replicating T. gondii (GFP+) categorized by association to the vasculature (EB): intravascular, perivascular and parenchymal localization, as indicated in Methods. DAPI indicates nuclear staining. Arrowheads indicate parasites located in the parenchyma. Scale bars, 20 µm. (b) Mean numbers of parasite foci (GFP+) detected per brain section at indicated time points post-inoculation. Data is from three sections per mouse from 3 mice per time point (n = 3 mice). (c–k) CD1 mice were challenged i.v. with 1–4 × 10⁶ T. gondii GFP-expressing tachyzoites (ME49) and sacrificed at 4 days post-infection. (c, d) Representative micrographs show the distribution of T. gondii tachyzoites (GFP+) around the vascular lumen (EB+) in challenged mice. For each micrograph, the corresponding 3D plot analysis shows individual GFP+ tachyzoite vacuoles as indicated in Methods. Color scales indicate Euclidian distances (μm) of tachyzoites to the nearest vascular lumen. Scale bars, 20 μm. (e) Distribution of Euclidian distances of T. gondii (GFP+) tachyzoites to the nearest capillary. Eight representative foci of challenged mice (day 4) are shown. In graph, each data point represents one tachyzoite (GFP+) and mean + SEM are indicated for each focus. Dashed lines indicate luminal center (0) and 10 μm distance to the nearest vascular lumen, respectively. (f) Distribution of Euclidian distances of randomly located T. gondii (GFP+) vacuoles to vasculature (EB+) in single fields of view (FOV). Filled circles indicate the distance to the nearest located blood vessel for intravascular, perivascular and parenchymal vacuoles, respectively. Unfilled circles indicate distances to vasculature in the same FOVs (Figure 3—figure supplement 2). Dashed lines indicate luminal center (0) and 10 μm distance to the nearest vascular lumen, respectively. Solid lines indicate mean diameter and mean distance, respectively, of vessels to randomly located vacuoles. Chi square test X2(29, N = 166) = 64.96, p < 0.001. (g) Immunofluorescence staining of brain sections depict the parenchymal localization of T. gondii (GFP+) related to the BBB basement membrane marker β1 laminin, the astrocytic marker GFAP and the TJ marker occludin (Ocln) and, the microglia markers Iba1, respectively. DAPI indicates nuclear staining. Scale bars, 25 µm. (h) Relative distribution (%) of the localization of T. gondii tachyzoites assessed by two-photon microscopy in whole brains (day 3). n = 8 independent foci. (i) Distance of individual T. gondii tachyzoites to the nearest blood vessel (EB+). n = 10 independent foci. (j, k) Diameter of the nearest blood vessel (j) and distance to the nearest vascular branching (k) for intravascular and extravascular T. gondii tachyzoites, respectively. n = 69 tachyzoites. **p < 0.01; Student’s t-test. (i–k) Medians with 25th to 75th percentile of datasets are shown. Whiskers mark 5th and 95th percentile. (l, m) Relative frequency (%) of parasite foci related to localization at indicated time points post-inoculation. CD1 Mice were inoculated with (l) high-dose or (m) low-dose T. gondii tachyzoites (ME49). For each condition, the mean + SEM from 3 to 10 sections per mouse from three independent experiments is shown (n = 3–6 mice). *p < 0.05; ***p < 0.001; ****p < 0.0001; ns, non-significant, one-way ANOVA, F (2, 10) = 79.19, followed by Tukey’s multiple comparisons test.
Figure 3—figure supplement 1
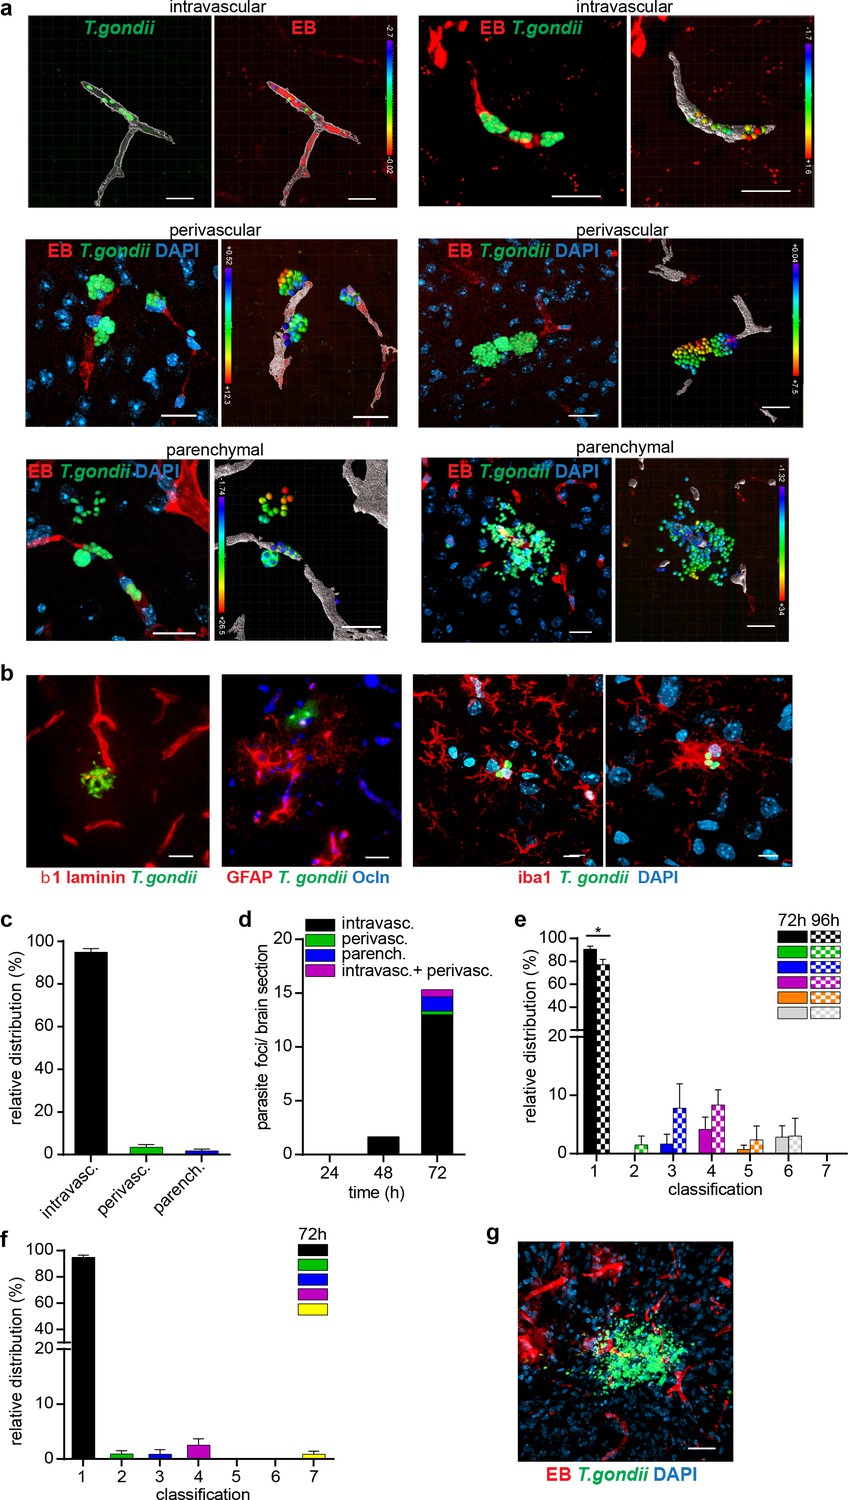
Distribution of T. gondii in the intravascular and extravascular brain compartments in three mouse strains.
BALB/c, CD1, and C57BL/6 mice were inoculated with high dose of GFP-expressing T. gondii and sacrificed after specified time post-infection. EB was injected to i.v. prior to organ extraction. (a) Representative micrographs show the distribution of T. gondii tachyzoites (GFP+) around the vascular lumen (EB+) in challenged mice. For each micrograph, the corresponding 3D plot analysis shows individual GFP+ tachyzoite vacuoles as indicated in Methods. Color scales indicate Euclidian distances (μm) of tachyzoites to the nearest vascular lumen. Scale bars, 20 μm. (b) Immunofluorescence stainings of brain sections depict the parenchymal localization of T. gondii (GFP+) related to β1 laminin, GFAP, occludin (Ocln) and Iba1, respectively. DAPI indicates nuclear staining. Scale bars (two left images), 25 µm, (two right images) 10 µm. (c) Bar graph shows the relative proportion of intravascular, perivascular and parenchymal parasite foci in C57BL/6 mice challenged with T. gondii (RH, hd) at 72 hr post-infection. Data show mean ± SEM from two independent experiments (n = 6 mice). (d) Bar graph shows the relative distribution of cortical parasite foci (intravascular, perivascular, parenchymal and intravascular/perivascular) in BALB/c mice challenged with T. gondii (RH, hd) at 24–72 hr post-inoculation (n = 3 mice per time point). (e) Relative frequency distribution (%) of parasite foci related to localization [1-7] in CD1 mice challenged with T. gondii (ME49, hd) at indicated time points. X-axis show the localization of foci in relation to the brain microvasculature categorized in detail as follows: only intravascular [1], only perivascular [2], only parenchymal [3] intravascular and perivascular [4], intravascular and parenchymal [5], perivascular and parenchymal [6] or intravascular, perivascular and parenchymal [7]. For each condition, the mean + SEM of from 3sections per mouse from 2 independent experiments is shown (n = 3-4) *p < 0.05; Unpaired Student's t-test. (f) Relative frequency distribution (%) of parasite foci related to localization 1–7 as in (e) in C57BL/6 mice challenged with T. gondii (RH, hd) at 72 hr post-inoculation. For each condition, the mean + SEM of 3 sections per mouse from two independent experiments is shown (n = 3–4). (g) Representative confocal micrograph of cortical section on day 10 post-inoculation illustrates focus with T. gondii (GFP+) in the parenchyma. Scale bar, 40 µm.
Figure 3—figure supplement 2

Distances of T. gondii vacuoles to surrounding vasculature.
CD1 mice were challenged i.v. with 1–4 × 10⁶ T. gondii GFP-expressing tachyzoites (ME49) and sacrificed at 4 days post-infection. (a–f) Representative micrographs show distribution of Euclidian distances of randomly located T. gondii (GFP+) vacuoles to vasculature in single fields of view (FOV). In corresponding bar graphs, filled circles indicate distance to the nearest located blood vessel for representative (a, b) intravascular, (c, d) perivascular and (e, f) parenchymal vacuoles, respectively. Scale bars, 50 µm.
Figure 4 with 2 supplements
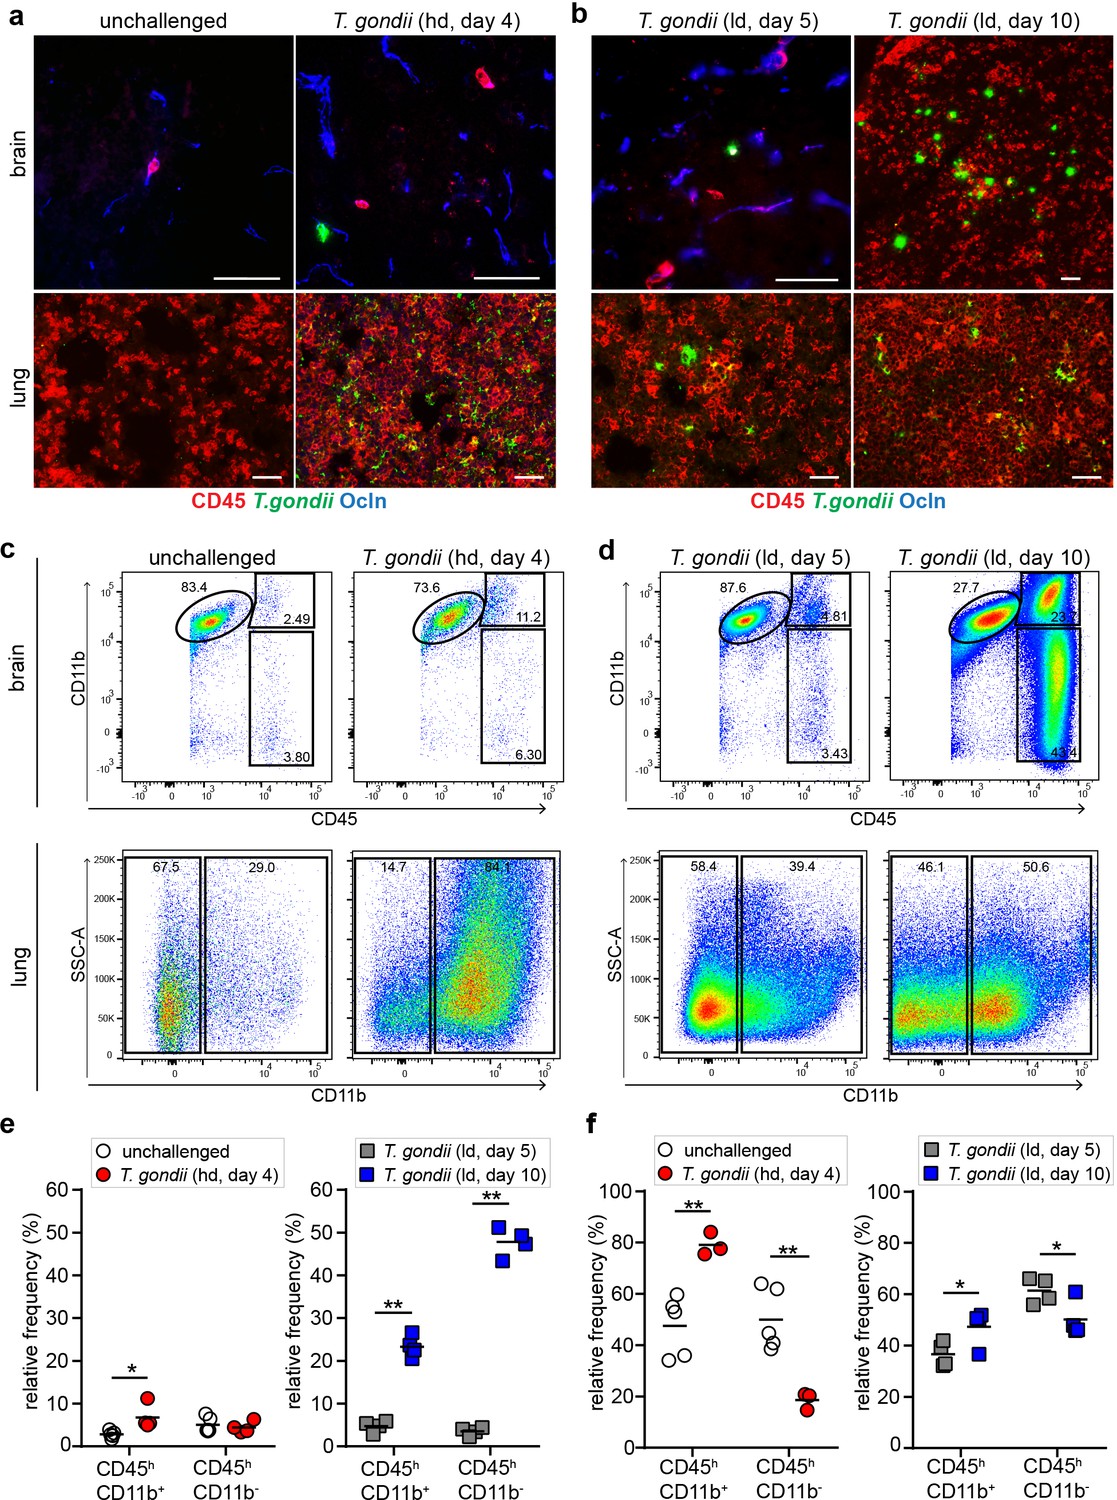
Kinetics of leukocyte infiltration in the brain parenchyma.
CD1 mice were inoculated with high-dose (hd, 1 × 10⁶ i.v.) or low-dose (ld, 5 × 10⁴ i.p.) of T. gondii GFP-expressing tachyzoites (ME49) (a, b) Representative immunofluorescence micrographs of brain and lung cryosections from mice challenged with T. gondii (GFP+) at (a) high-dose or (b) low-dose, assessed after days 4, 5, or 10 post-inoculation. Sections were stained for CD45 and occludin (Ocln). Scale bars, 50 µm. (c, d) Flow cytometry analyses of brain and lung tissue homogenates labeled with anti-CD45 and anti-CD11b antibodies, with gating on CD45+ cells. Representative bivariate plots (brain) show subpopulations of leukocytes discriminated according to the expression of CD11b and CD45: microglia (CD11b+ CD45low), myeloid leukocytes (CD11b+ CD45hi) and non-myeloid leukocytes (CD11b- CD45hi). Plots from lung tissue show CD11b- and CD11b+ subpopulations of CD45+ cells. (e, f) Quantitative analyses of CD45+ immune cell subpopulations in the (e) brain and (f) lung. The relative mean frequency of the leukocyte subpopulations is indicated (n = 3–5 mice per condition). *p < 0.05; **p< 0.01; Student’s t-test.
Figure 4—figure supplement 1
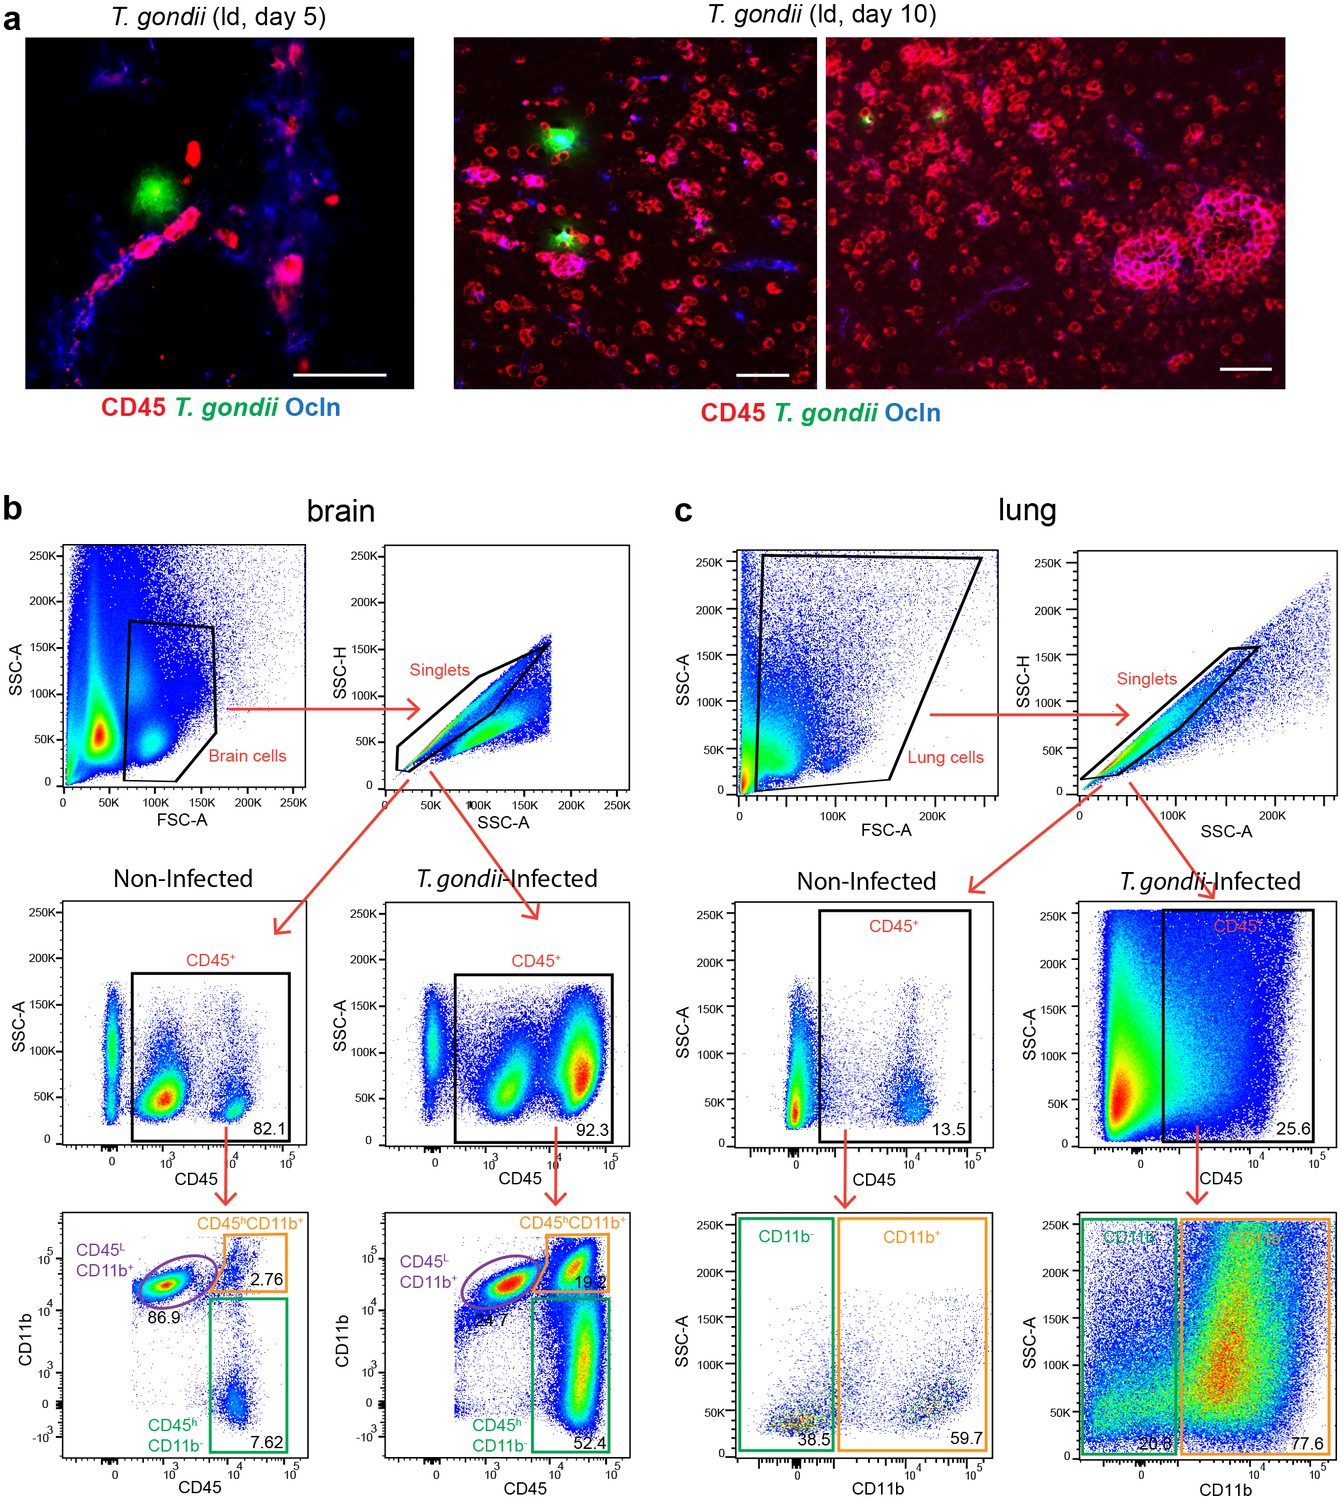
Leukocyte infiltration in the brain parenchyma and gating strategy for flow cytometry.
(a) Representative immunofluorescence micrographs of brain cryosections from CD1 mice challenged with T. gondii (GFP+, ld, PTG) assessed after days 5 or 10 post-inoculation. Sections were stained for CD45 and occludin. Scale bars, 50 µm.(b, c) Gating strategy for (b) brain and (c) lung cells analyzed by flow cytometry. Cells were first selected in a side scatter (SSC) vs forward scatter (FSC) dot plot, then gated on single cells and on CD45+ cells populations. For brain (b), different leukocyte subpopulations were discriminated by their expression level of CD11b and CD45. Resident leukocytes (microglia) were defined as CD11b+ CD45low and infiltrating leukocytes as CD11b+ CD45hi (myeloid cells) or CD11b- CD45hi (non-myeloid cells). In the lungs (c), CD11b+ and CD11b- cells were analyzed.
Figure 4—figure supplement 2
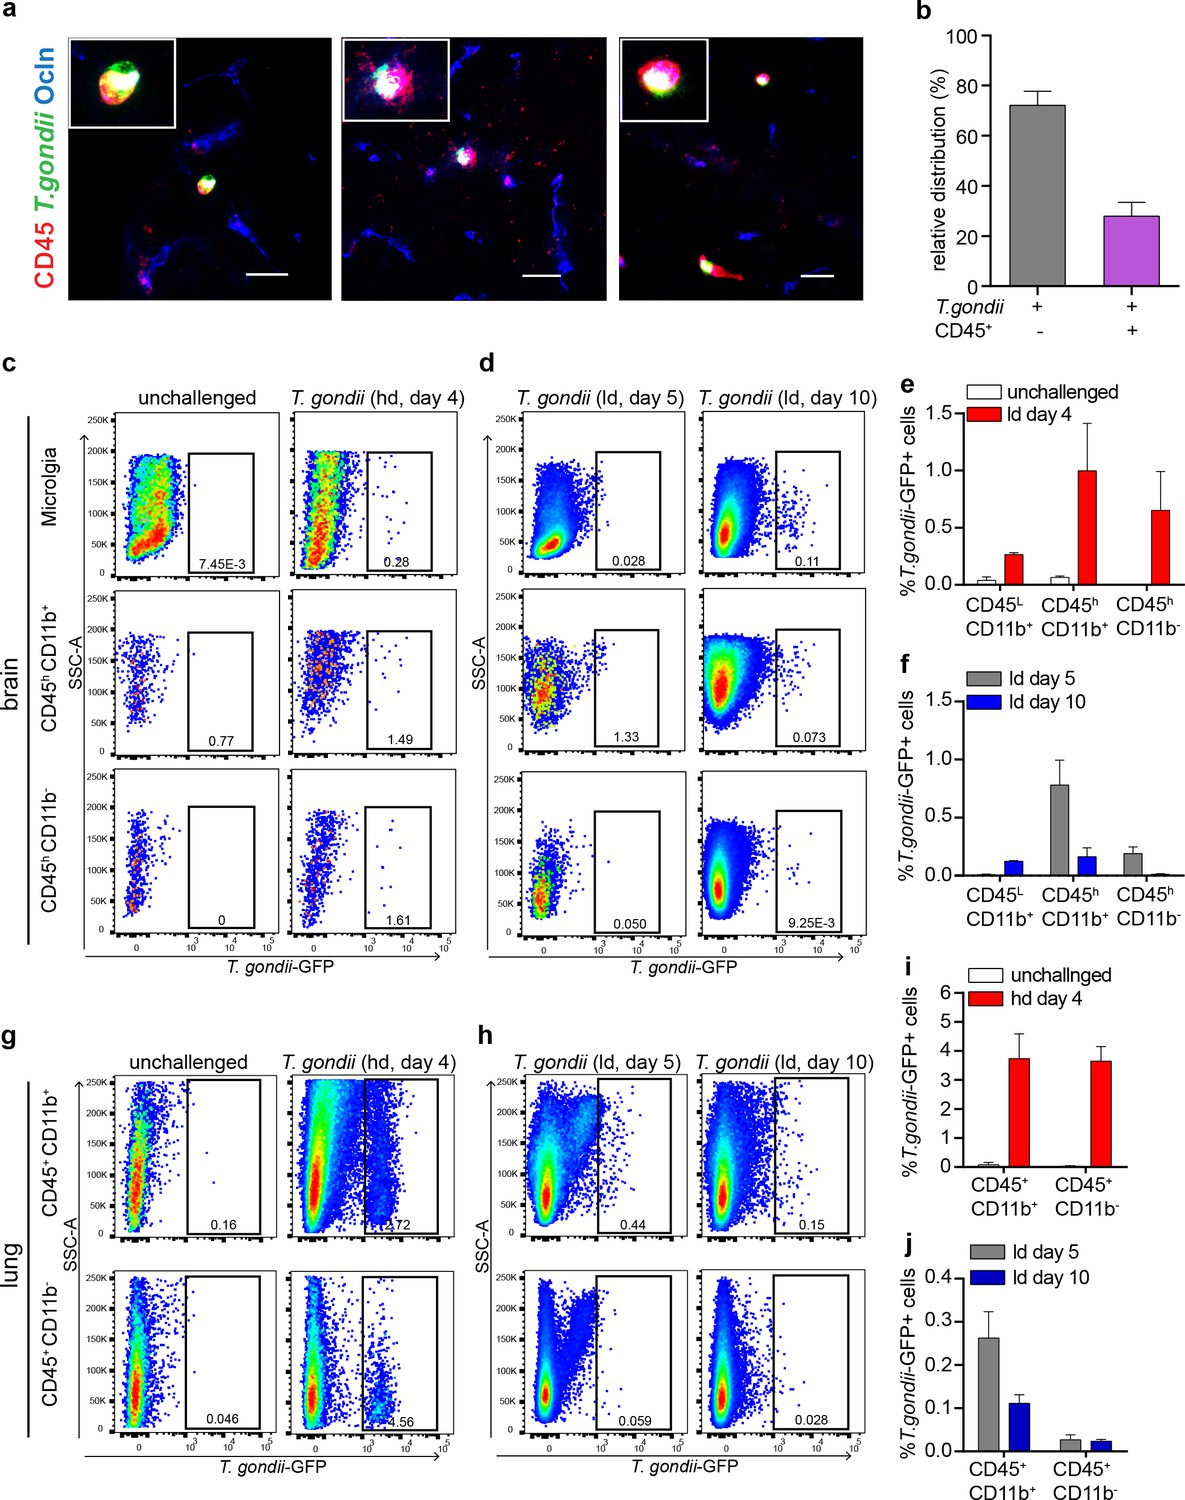
Parasites associate with resident and infiltrating CD45+ cells in the brain.
(a) Representative confocal micrograph from cortical sections of mice challenged with T. gondii (RH-LDM, high-dose) and sacrificed 72 hr post-inoculation show the co-localization of T. gondii (GFP+), CD45+ and occludin (ocln) staining. Scale bars, 25 µm (b) Quantitative analysis of T. gondii and CD45+ co-localization. Bar graph represents the relative frequency distribution (mean ± SEM) of the colocalizing (GFP+ CD45+) and non-colocalizing (GFP+ CD45-) fluorescence signal. Quantification was performed in two consecutives brain sections per mouse (n = 3 mice). (c–j) Flow cytometry analysis of cells subpopulations from brains (c, d) and lungs (g, h) of infected and non-infected mice. Dot plots of GFP signal gated on CD45hi/low and CD11b+/- indicate the presence of T. gondii associated to microglia, myeloid and non-myeloid cells. (e, f) Quantification of flow cytometry data from the brains. (i, j) Quantification of flow cytometry data from the lungs. Bar graphs show the percentage (mean ± SEM) of T. gondii (GFP+) signal associated to each subpopulation of leukocytes over total CD45+ cells (n = 3–5 mice per group).
Figure 5 with 1 supplement
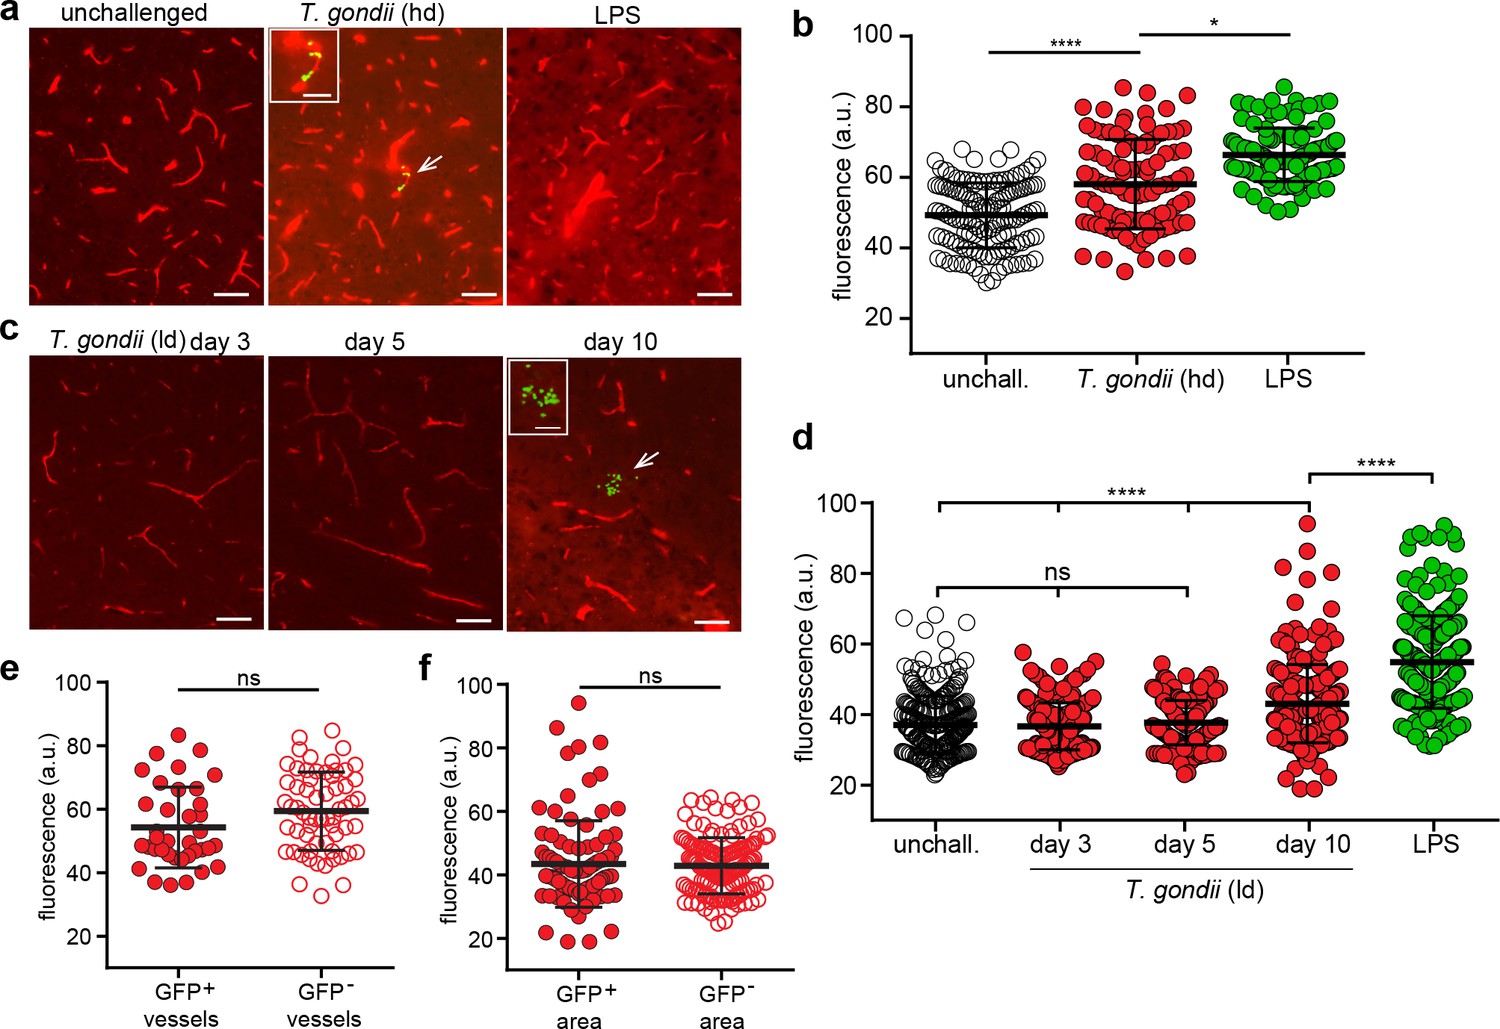
Impact of T.gondii challenge on the BBB permeability.
(a–b) C57BL/6 mice were inoculated with high-dose (hd, 2–4 × 10⁶ i.v. RH) or (c–d) with low-dose (ld, 5 × 10⁴ i.p. ME49) of T. gondii GFP-expressing tachyzoites or treated with LPS (2 mg/kg, 6 hr). (a) Representative fluorescence micrographs of cortical sections show EB+ signal from unchallenged, T. gondii-challenged (GFP+) mice at day 3 post-inoculation and LPS-treated mice. Arrowhead indicates GFP signal, magnified in inset image. Scale bars, 50 µm, inset, 25 µm. (b) Quantification of the extravascular fluorescence intensity (arbitrary units, a.u.) with the EB tracer as described in Methods. Each dot in the graph represents the accumulated fluorescence intensity signal (EB+) around one blood vessel. Data show mean ± SD from a total of 344 vessels (unchallenged 132, T. gondii 97, LPS 115) from three to four sections per mouse (n = 4–5 mice per condition). (c) Representative fluorescence micrographs of cortical sections show EB+ signal as in (a) from T. gondii-challenged (ld, low-dose, ME49) mice at days 3, 5, and 10 post-inoculation. Arrowhead indicates GFP signal, magnified in inset image. Scale bars, 50 µm, inset image, 25 µm. (d) Quantification of the extravascular fluorescence intensity with the EB tracer as in (b). Data show mean ± SD from a total of 1205 vessels (unchallenged 280, T. gondii day3 214, day5 244, day10 234, LPS 233) from three sections per mouse from three independent experiments (n = 3–8 mice per condition). (e, f) Fluorescence intensity analyses with EB tracer signal in (e) GFP+ and GFP- cortical vessels from mice challenged with T. gondii (hd, day 3) or in (f) microvessels located within 100 µm distance to parasite foci (GFP+) and fields of view without detectable foci (GFP-) from mice challenged with T. gondii (ld, day 10). Data show mean ± SD from (e) 97 vessels (GFP+ 37, GFP- 60) and (f) 234 vessels (GFP+ 96, GFP- 138), respectively (n = 3–4 mice per condition). *p < 0.05; ****p < 0.0001; ns, non-significant. (b, d) Kruskal-Wallis test, Dunn’s post-hoc test, (e, f) Mann-Whitney test.
Figure 5—figure supplement 1

Permeability analyses of cortical microvessels with vascular fluorescent tracer.
(a) Representative immunofluorescence micrographs of brain cryosections from unchallenged, T. gondii-challenged and LPS-treated mice, respectively, inoculated with EB fluorescent tracer prior to organ extraction. Yellow lines indicate vessels stochastically chosen for image analyses as indicated under (b). Asterisks indicate vessels exemplified in (b). On average, 5 vessels per field of view were analyzed and a total of ~75 blood vessels per mouse. Scale bars, 50 µm. (b) Micrographs show magnification of EB-labelled blood vessels indicated with asterisks under (a) from unchallenged and T. gondii-challenged mice, respectively. In sections from T. gondii-challenged mice, vessels with associated T. gondii (GFP+) and vessels in the vicinity (GFP-) were analyzed. In each micrograph, yellow lines indicate distance (200 pixels, ~ 60 µm) centered across the vascular lumen utilized for fluorescence intensity analyses (Image J software). The fluorescence intensity was plotted for each blood vessel. Scale bars, 25 µm. (c) Representative fluorescence intensity plots from vessels analyzed as described under (b). For each condition, lines show fluorescence intensities from individual microvessels. The fluorescence peak corresponds to the lumen of the vessels. The grey dashed areas (80–120 pixels) indicate vascular area (intravascular signal). Pixel intensities outside this area were defined as extravascular signal. For each blood vessel, the extravascular signal was calculated (area under the curve, AUC) and the intravascular signal was subtracted.
Figure 6 with 1 supplement
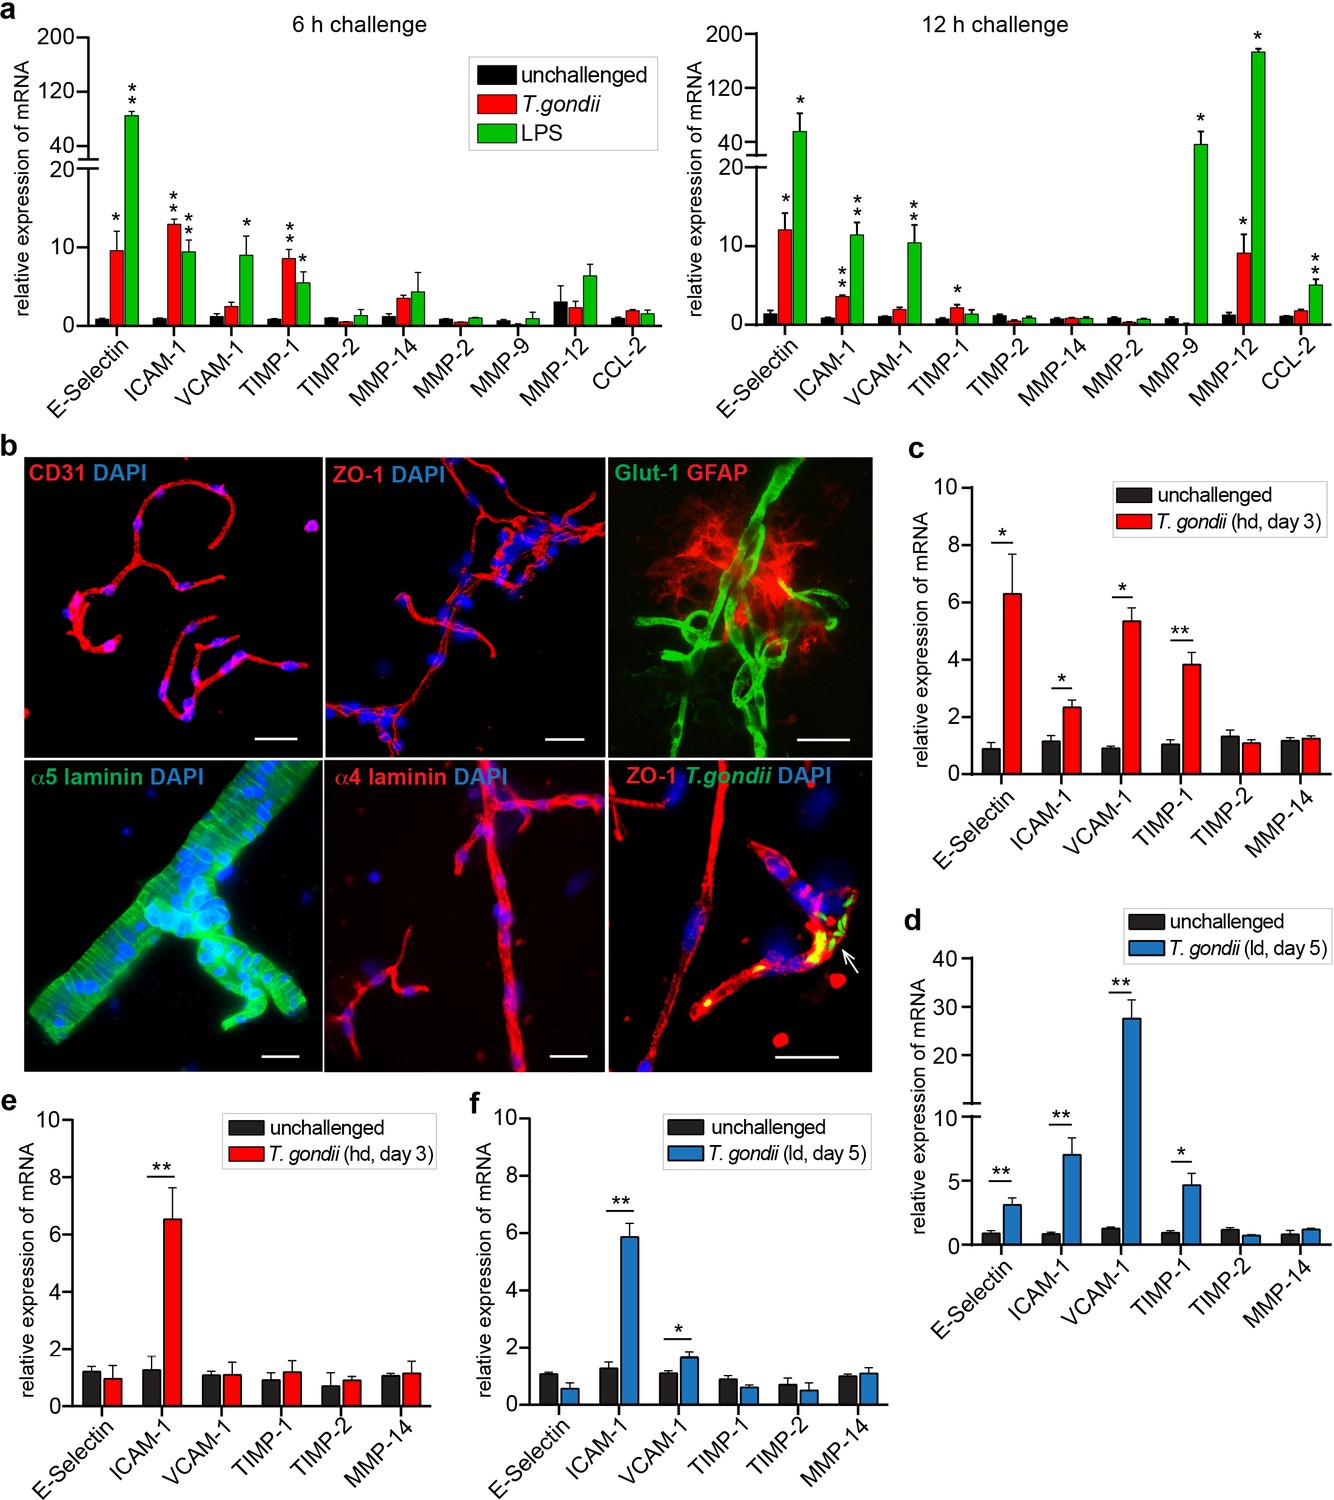
Inflammatory responses of brain endothelium upon T. gondii challenge.
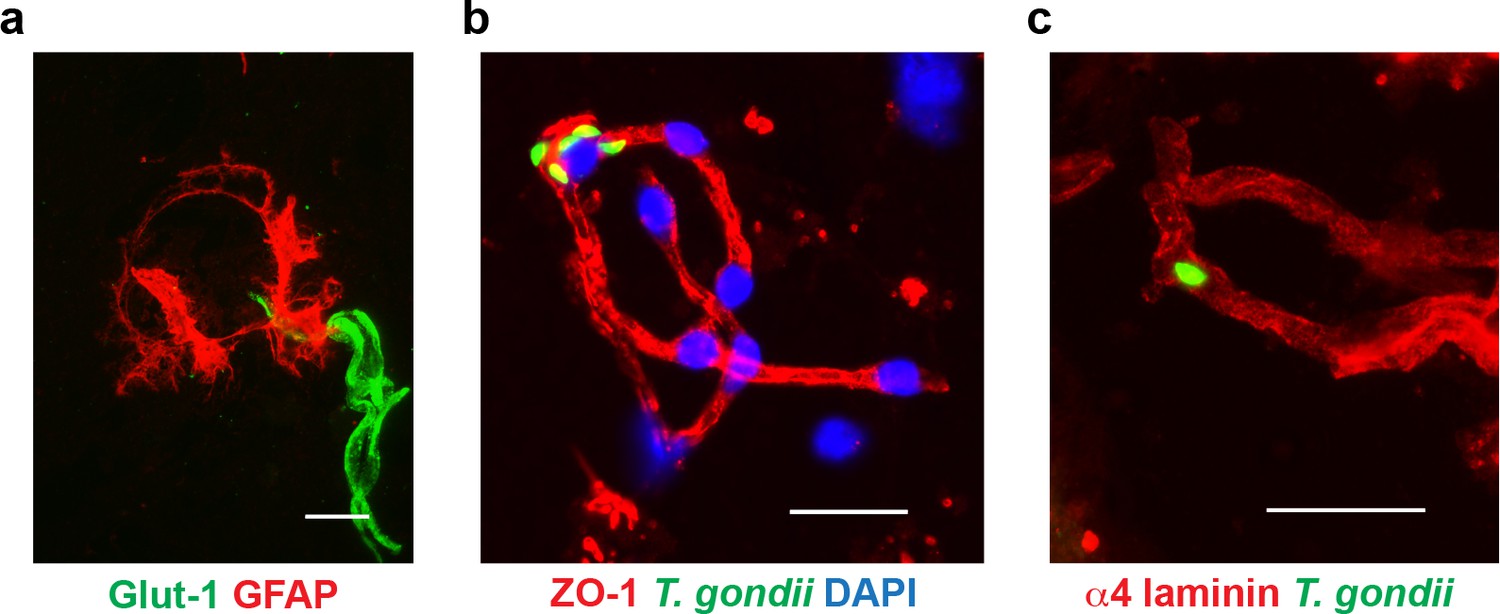
(a) Graphs show the relative mRNA expression, for indicated target genes, in primary MBECs challenged with T. gondii tachyzoites (RH, MOI4) or LPS (100 ng/ml) for 6 or 12 hr, respectively. Data show mean + SEM normalized to non-stimulated controls (unchallenged) from two independent MBEC purifications with 3–7 replicates/condition. (b) Representative immunofluorescence micrographs show brain microvessels isolated from unchallenged and T. gondii (RH)-challenged C57BL/6 mice stained with antibodies to the vascular BBB markers CD31/PECAM-1, ZO-1, Glut-1, α5/α4 laminins and the astrocytic marker GFAP. DAPI indicates nuclear staining. Arrowhead indicates T. gondii tachyzoites (GFP+) in association with the vasculature. Scale bars, 25 µm. (c, d) Relative mRNA expression, for indicated target genes, in purified brain microvessels of C57BL/6 mice challenged with T. gondii. (c) high-dose (hd, 4x10⁶, RH) and (d) low-dose (ld, 5 × 10⁴, ME49), assessed on days 3 and 5 post-inoculation, respectively. Data show mean + SEM gene expression from 3 to 4 mice per group normalized to non-infected controls (n = 3–4 mice). (e, f). Relative mRNA expression (mean + SEM), for indicated target genes, in brain homogenates from mice challenged as in (c, d) (n = 3–4).*p < 0.05; **p < 0.01; (a) one-way ANOVA followed by Dunnett’s test, (c–f), Unpaired Student’s t-test.
Figure 6—figure supplement 1
Immunostainings of isolated cortical microvessels.
(a–c) Representative immunofluorescence micrographs show brain microvessels isolated from (a) unchallenged and (b, c) T. gondii (GFP+)-challenged mice stained with antibodies to Glut-1, GFAP, ZO-1, or α4 laminin. DAPI indicates nuclear staining. Scale bars, 25 µm.
Figure 7 with 2 supplements
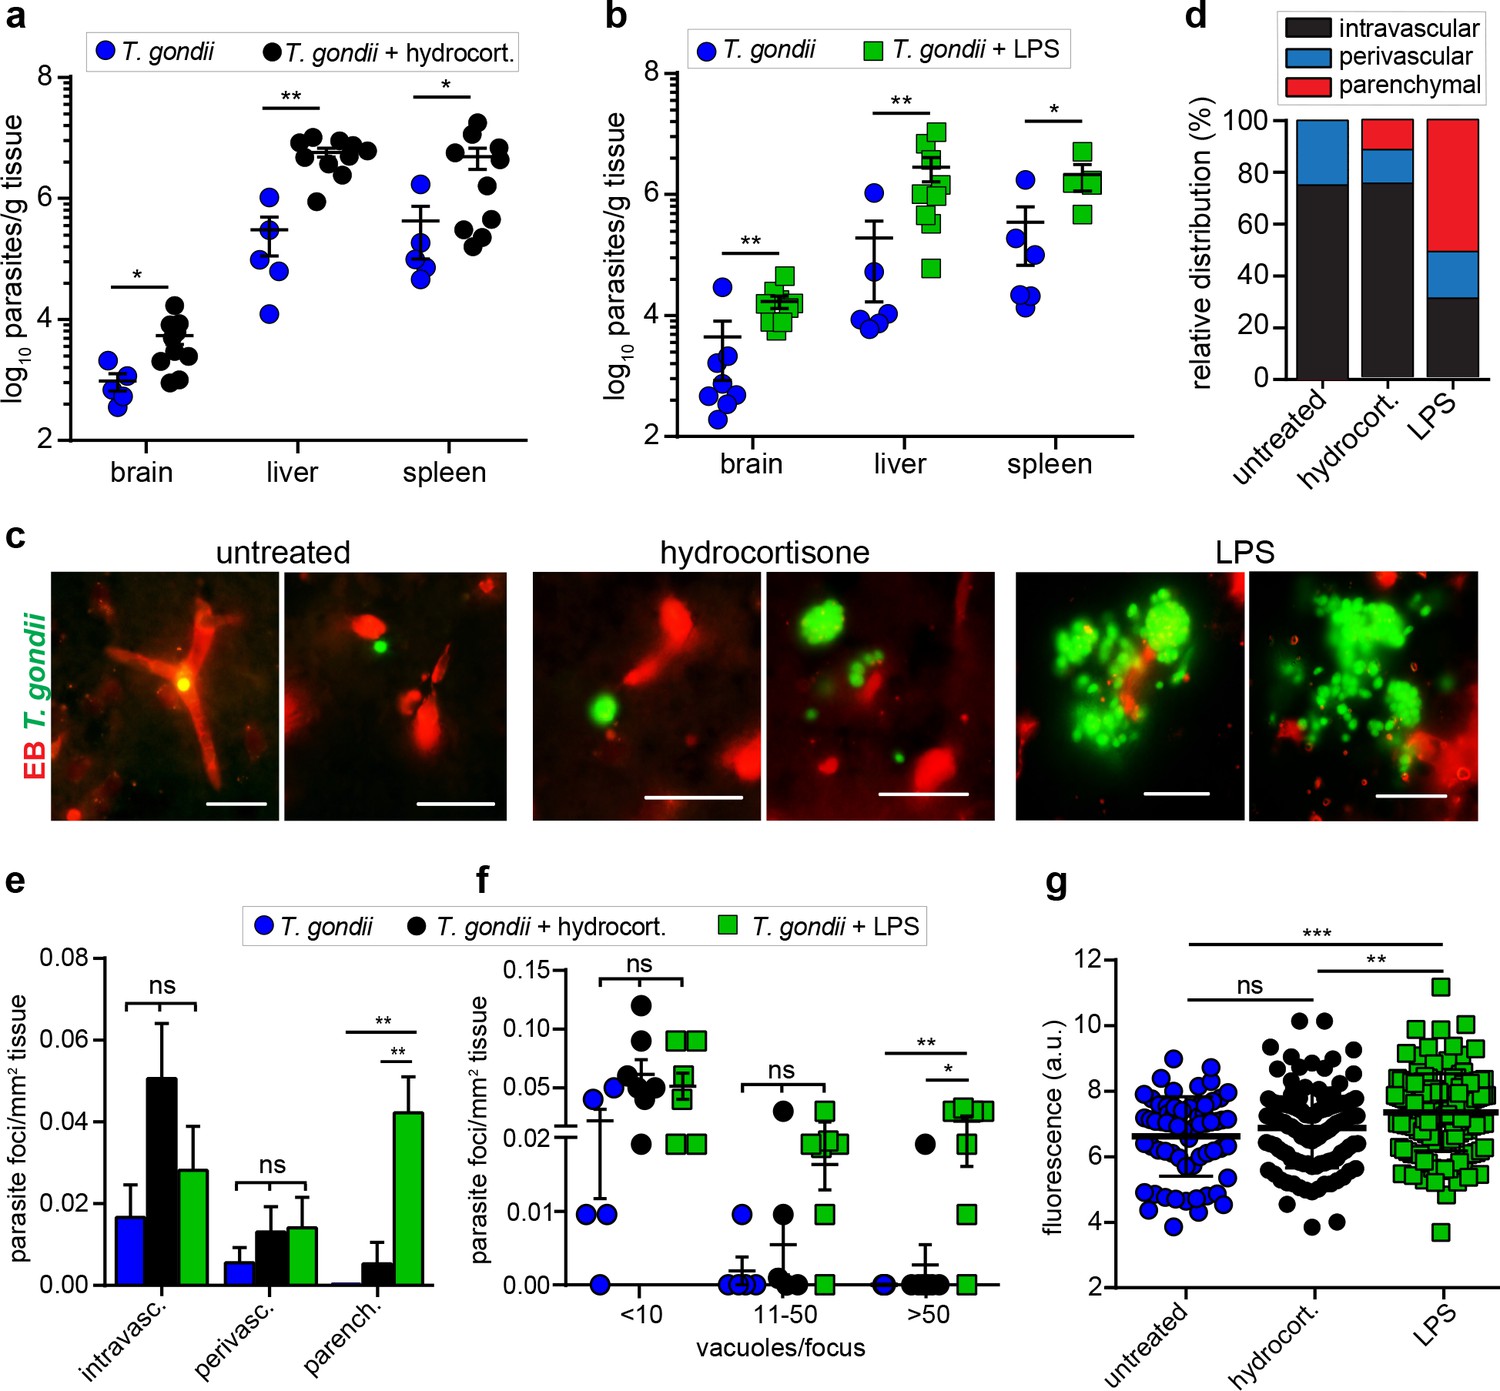
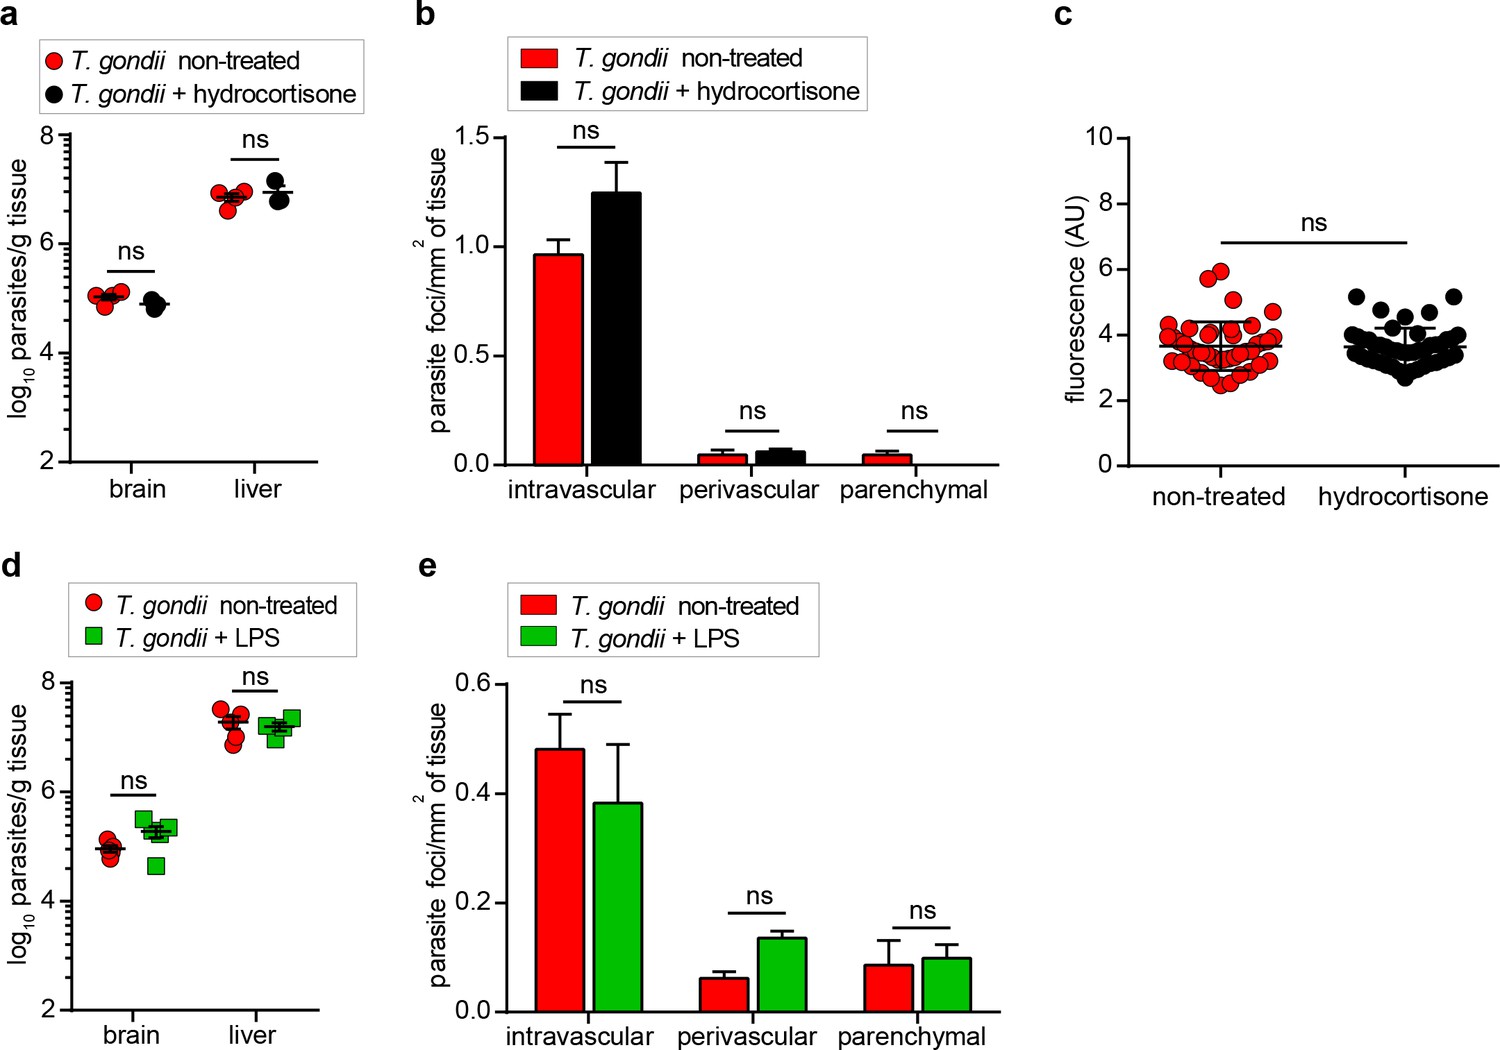
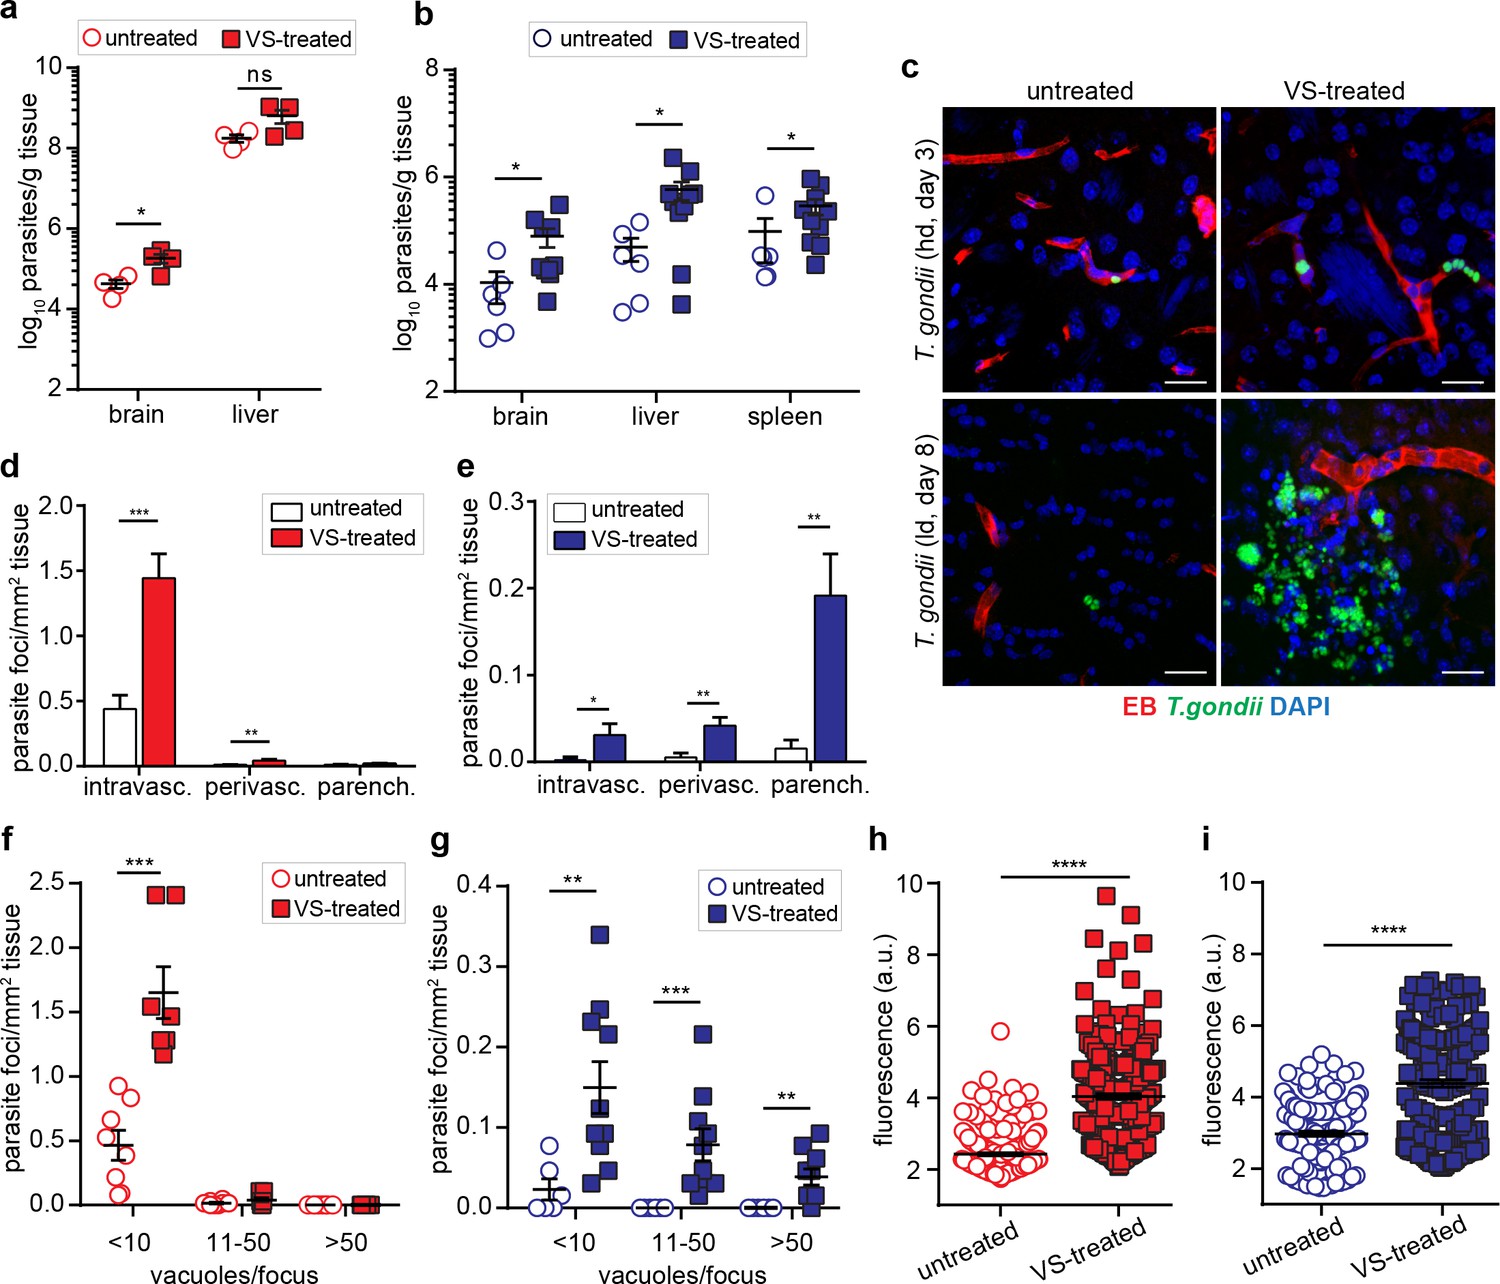
Modulation of parasite loads in the brain by anti-inflammatory and pro-inflammatory treatments.
CD1 mice were inoculated with T. gondii GFP-expressing tachyzoites (ME49, 5 × 10⁴ i.p.). (a, b) Quantification of parasite loads by plaquing assays in brain, liver, and spleen of mice challenged with T. gondii (ld, day 6) and treated with (a) hydrocortisone or (b) LPS, as indicated under Materials and methods. Data show mean ± SEM (n = 5–10 mice per condition) *p < 0.05, **p < 0.01, Mann-Whitney test. (c) Representative micrographs of cortical sections from mice treated as in (a, b) show T. gondii (GFP+) and vascular tracer (EB). Scale bars, 25 µm. (d) Bar graph shows the relative proportion of intravascular, perivascular and parenchymal parasite foci in mice treated as in (a, b). (e) Relative numbers of parasite foci per mm2 tissue related to intravascular, perivascular, and parenchymal localization, respectively, in mice treated as in (a, b). Data show mean + SEM **p < 0.01; ns, non-significant, Kruskal-Wallis test, Dunn’s post-hoc test. (f) Relative numbers of parasite foci per mm2 tissue related to foci size. Foci sizes were determined by counting number of vacuoles (<10, 11–50 or >50 vacuoles/focus) containing replicating tachyzoites (two or more / vacuole). Data show means ± SEM *p < 0.05; **p < 0.01; ns, non-significant, Kruskal-Wallis test, Dunn’s post-hoc test. (g) Quantification of the extravascular fluorescence intensity (arbitrary units, a.u.) with the EB tracer in mice treated as in (a, b). Each dot represents the accumulated fluorescence intensity signal (EB+) around one blood vessel. Data show mean ± SD from a total of 321 vessels (untreated 64, hydrocortisone 111, LPS 146). (d-g) Data are from two independent experiments; untreated condition (n = 5 mice), hydrocortisone (n = 7 mice) and LPS (n = 7 mice).
Figure 7—figure supplement 1
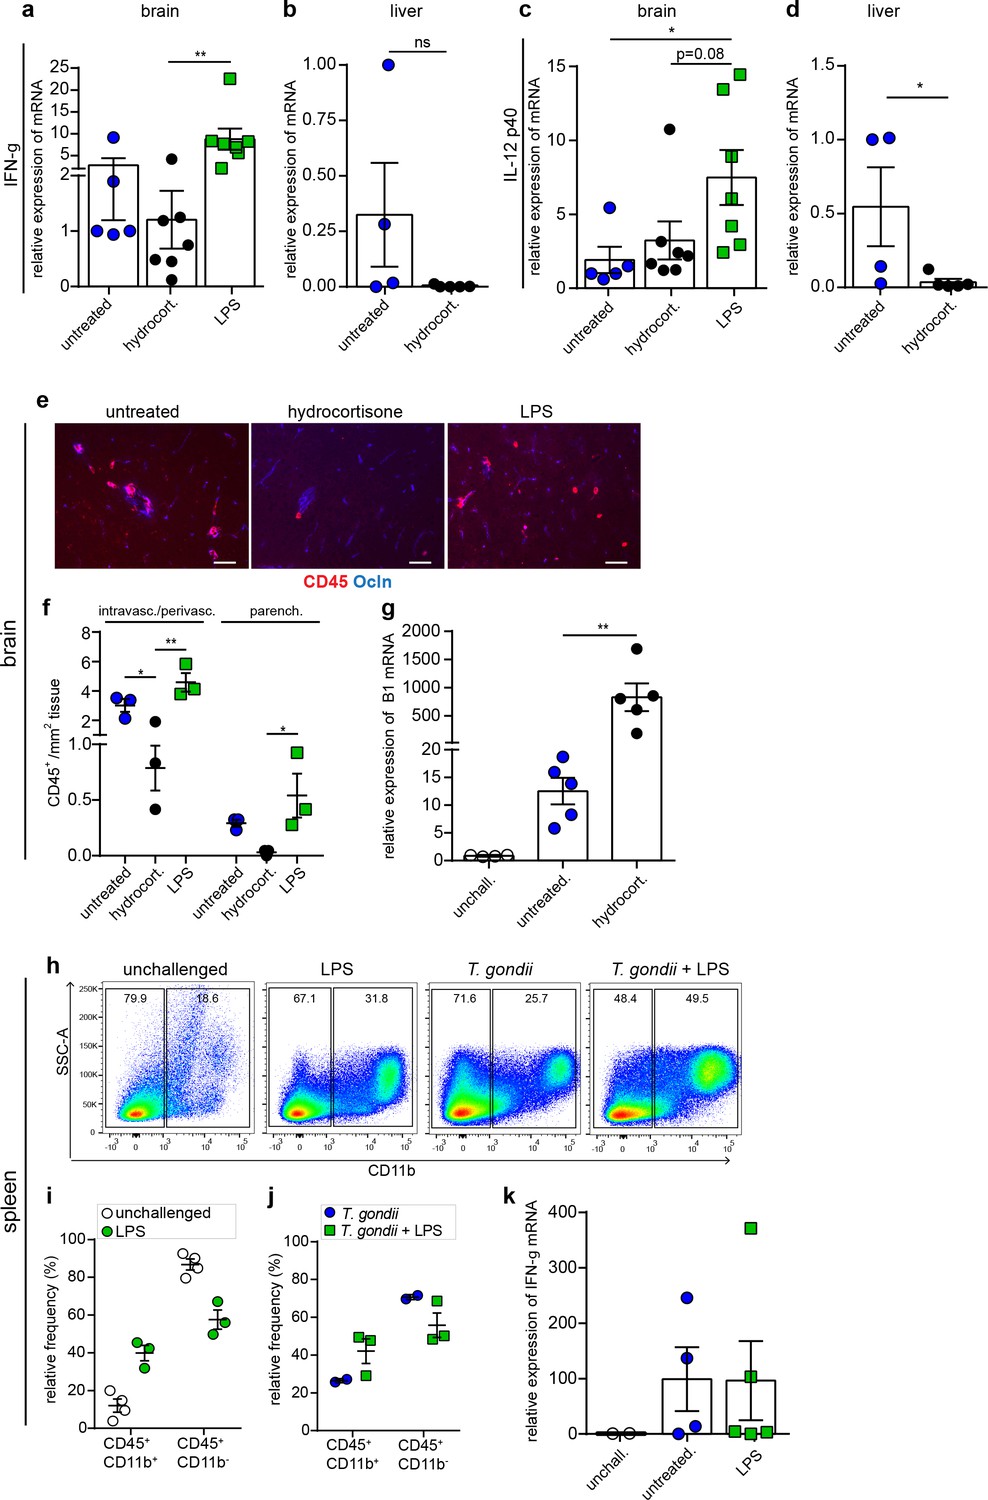
Cytokine (IFN-γ, IL-12p40) and leukocyte responses to anti-inflammatory and pro-inflammatory treatments.
(a–d) Graphs show relative expression of (a, b) IFN-γ mRNA and (c, d) IL-12p40 mRNA in brain and liver tissues of T. gondii-challenged hydrocortisone or LPS-treated mice at day 6 (ld). Data show mean + SEM normalized to untreated controls from (a, c) two independent experiments (n = 5–7 mice) and (b, d) one experiment (n = 4–5 mice). (e) Representative immunofluorescence micrographs of brain cryosections from mice challenged and treated as in (a). Sections were stained for CD45 and occludin (Ocln). Scale bars, 50 µm. (f) Quantification of CD45+ cells per mm2 tissue related to intravascular/ perivascular and parenchymal localization, in mice treated as in (a). Data show mean + SEM from three consecutives brain sections per mouse (n = 3 mice). (g) Quantification of parasite loads by qPCR in the brain of mice challenged with T. gondii (ld, day 6) and treated with hydrocortisone. Graphs show a relative expression of B1 mRNA (mean + SEM) normalized to unchallenged controls, (n = 4–5). (h) Flow cytometry analyses of spleen homogenates from mice challenged with T. gondii (ld, day 6) and LPS as indicated. Representative bivariate plots show subpopulations of CD11b+ cells with gating on CD45+ cells. (i, j) Quantitative analyses of CD45+ CD11b+/- immune cell subpopulations in (h). The relative mean frequency of the leukocyte subpopulations is indicated (n = 3–4 mice per condition). (k) Relative expression of IFN-γ mRNA in spleen of the mice from (h) (mean + SEM) normalized to unchallenged controls (n = 2–4). *p < 0.05; **p < 0.01; ns, non-significant. (a, c, k) Kruskal-Wallis test, Dunn’s post-hoc test, (b, d), Mann-Whitney test, (f, g) one-way ANOVA, followed by Tukey’s multiple comparisons test, (i) Unpaired Student’s t-test.
Figure 7—figure supplement 2
Parasite loads in the brain upon anti-inflammatory and pro-inflammatory treatments at early time-points.
(a) Quantification of parasite loads by plaquing assays in brain and liver of mice at day three after challenge with T. gondii (hd, 3 × 10⁶, ME49) and treated with hydrocortisone. Data show mean + SEM (n = 3–4 mice per group). (b) Relative numbers of parasite foci per mm2 tissue related to intravascular, perivascular and parenchymal localization, respectively, in mice treated as in (a). Data show mean + SEM from one experiment (n = 3–4 mice per group). (c) Quantification of the extravascular fluorescence intensity (arbitrary units, a.u.) with the EB tracer in mice treated as in (a). Each dot represents the accumulated fluorescence intensity signal (EB+) around one blood vessel. Data show mean ± SD from 15 to 20 vessels per mouse (n = 3 mice per condition). (d) Quantification of parasite loads by plaquing assays in brain and liver of mice at day four after challenge with T. gondii (hd, 3 × 10⁶, ME49) and treated with LPS. Data show mean + SEM (n = 5 mice per group). (e) Relative numbers of parasite foci per mm2 tissue related to intravascular, perivascular, and parenchymal localization, respectively, in mice treated as in (d). Data show mean + SEM (n = 3 mice per group). ns, non-significant, (a, d, e) Mann-Whitney test, (b, c) Unpaired Student’s t-test.
Figure 8 with 1 supplement
Modulation of parasite loads and BBB permeability by inhibition of FAK.
CD1 mice were inoculated with high-dose (hd, 3 × 10⁶ i.v., RH) or low-dose (ld, 5 × 10⁴ i.p. ME49) of T. gondii GFP-expressing tachyzoites. (a, b) Quantification of parasite loads by plaquing assays in brain, liver and spleen of mice treated with VS-inhibitor and challenged with T. gondii at (a) high-dose or (b) low dose, assessed at days 3 or 8 post-inoculation, respectively. Data show mean + SEM from three independent experiments (n = 4–10 mice per group). (c)Representative micrographs of cortical sections from mice treated as in (a, b) show T. gondii (GFP+) and vascular tracer (EB). Scale bars, 25 µm. (d, e) Bar graph shows the relative proportion of intravascular, perivascular and parenchymal parasite foci in mice treated with VS-inhibitor and challenged with T. gondii at (d) high-dose or (e) low-dose, assessed at day three or eight post-inoculation, respectively. Data are from four independent experiments (n = 6–10 mice per group). (f, g) Relative numbers of parasite foci per mm2 tissue related to foci size, in mice treated as in (a, b), respectively. Foci sizes were determined by counting number of vacuoles ( < 10, 11–50 or >50 vacuoles/focus) containing replicating tachyzoites. Data show mean + SEM from four independent experiments (n = 6–10 mice per group). (h, i) Quantification of the extravascular fluorescence intensity (arbitrary units, a.u.) with the EB tracer in mice treated as in (a, b). Each dot represents the accumulated fluorescence intensity signal (EB+) around one blood vessel. Data show mean ± SD from a total of (h) 517 vessels (untreated 217, VS-treated 300) and (i) 374 vessels (untreated 153, VS-treated 221) from two independent experiments (n = 6–7 mice per condition). *p< 0.05; **p < 0.01; ***p < 0.001; ****p < 0.0001; ns, non-significant, (a,d,f) Unpaired Student’s t-test, (b,e,g,h,i), Mann-Whitney test.
Figure 8—figure supplement 1
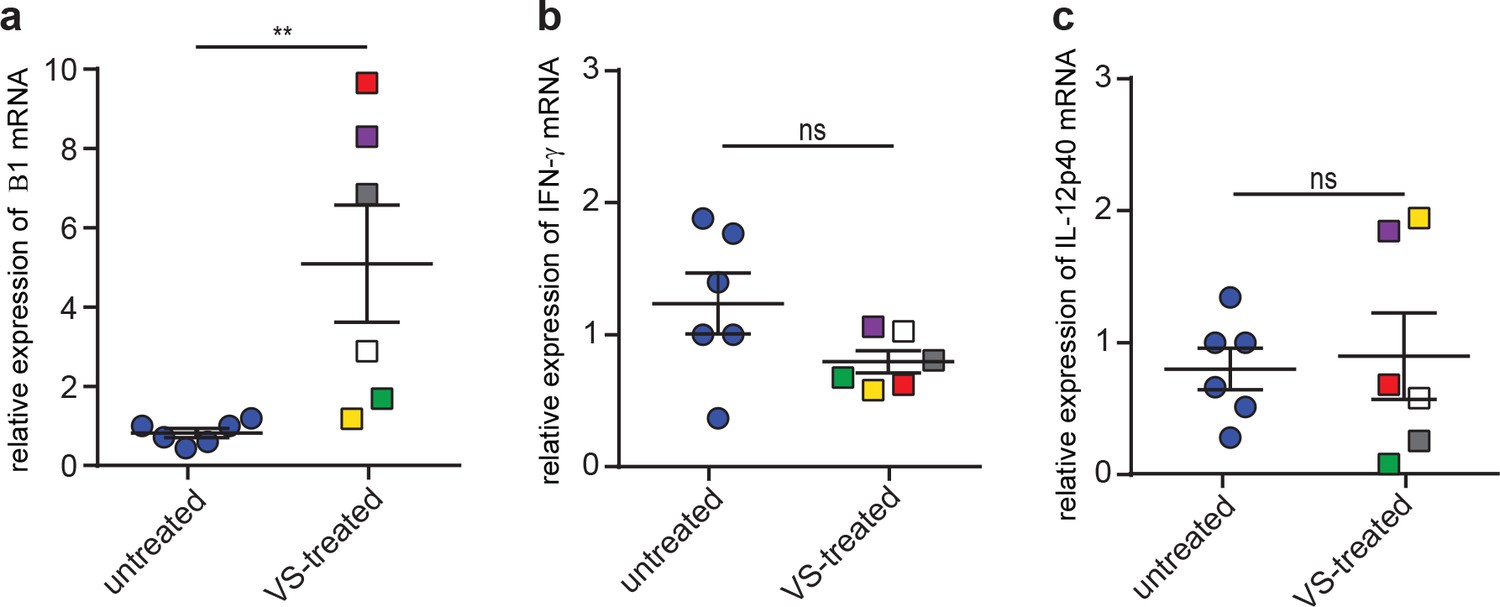
Cytokine responses of mice treated with FAK inhibitor.
(a, b, c) Relative mRNA expression of (a) T. gondii B1, (b) IFN-γ and (c) IL-12p40 in the brain of mice treated with FAK inhibitor (VS) and challenged with T. gondii at low dose, assessed at day 8 post-inoculation. Individual treated mice are color-coded with the same color in (a, b and c). Data show mean + SEM from two independent experiments (n = 6 mice per condition). **p < 0.01; ns, non-significant, Mann-Whitney test.
Figure 9 with 3 supplements
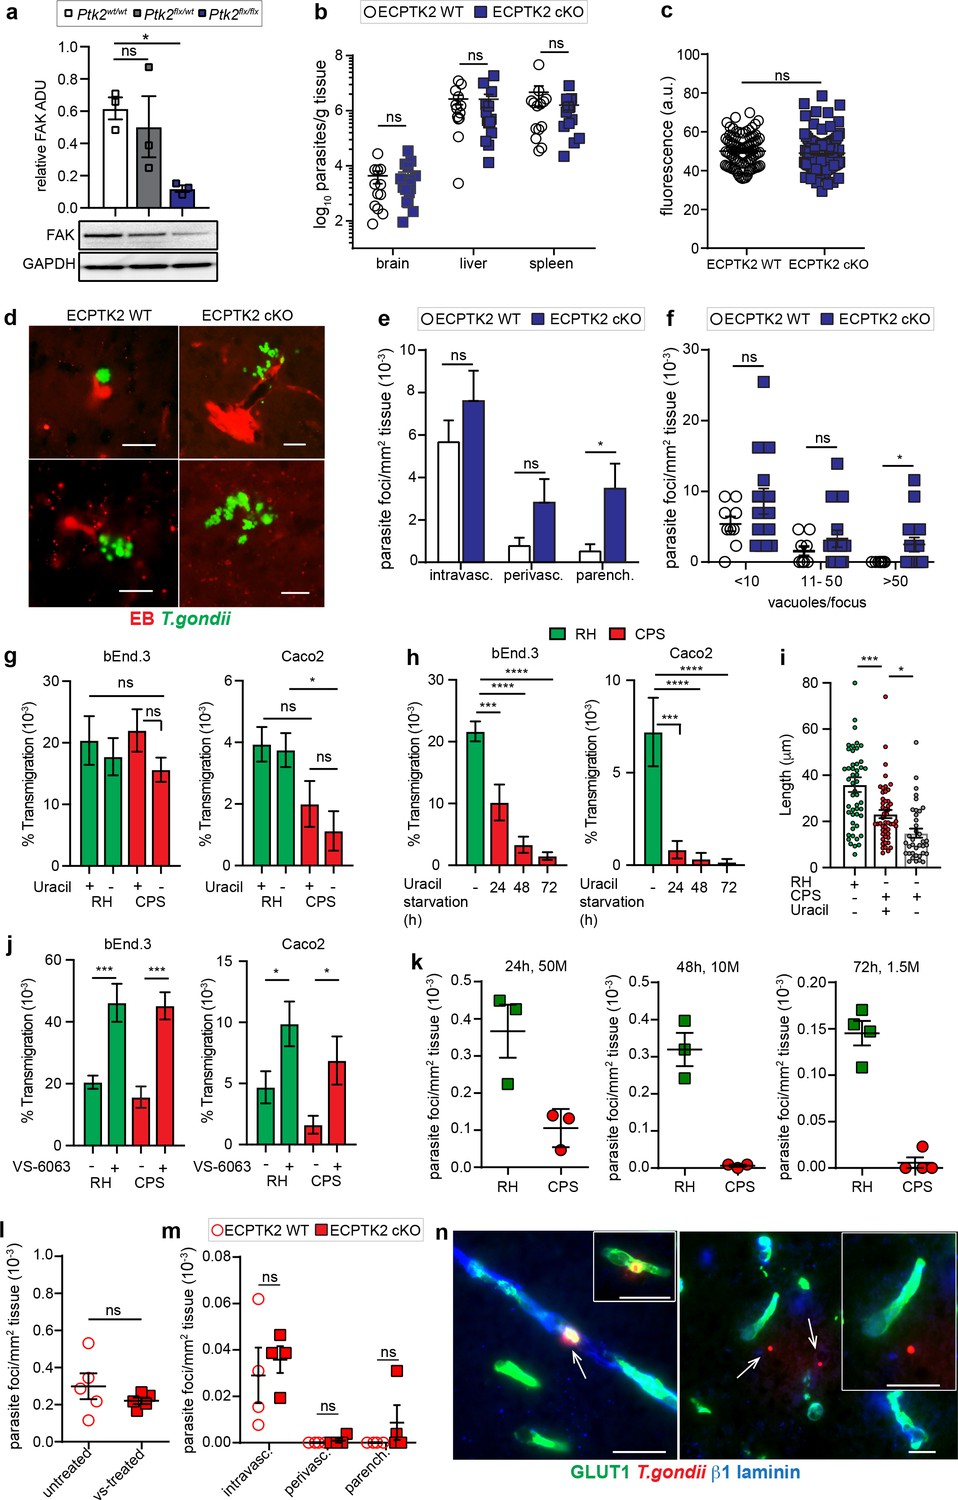
Characterizations of parasite foci in the brain parenchyma of ECPTK2 cKO mice challenged with wildtype (RH) and uracil-auxotroph T. gondii (CPS).
(a) Western blot analysis of total FAK protein expression in endothelial cells derived from Cdh5cre+/- C57BL/6 mice that were Ptk2wt/wt, Ptk2flox/wt, or Ptk2flox/flox. Graph shows FAK expression normalized to GAPDH expression. ADU, arbitrary densitometry unit. n = 3 biological replicates from independent blots. (b) Quantification of parasite loads by plaquing assays in brain, liver and spleen of ECPTK2 WT (Ptk2flox/floxCdh5cre-/-) and ECPTK2 cKO (Ptk2flox/floxCdh5cre+/-) C57BL/6 mice, respectively, challenged with T. gondii (ME49, 2,5–5 × 10⁴), assessed at day 6 post-inoculation. Data show mean + SEM from three independent experiments (n = 14–15 mice per group). (c) Quantification of the extravascular fluorescence intensity (arbitrary units, a.u.) with the EB tracer in mice treated as in (b). Data show mean ± SEM from a total of 86–100 vessels from two independent experiments (n = 4 mice per condition). (d) Representative micrographs of cortical sections from mice treated as in (b) show T. gondii (GFP+) and vascular tracer (EB). Scale bars, 25 µm. (e) Bar graph shows the relative proportion of intravascular, perivascular and parenchymal parasite foci in ECPTK2 WT and ECPTK2 cKO mice challenged with T. gondii as in (b) assessed at day 6 post-inoculation, respectively. Data are from three independent experiments (n = 11–14 mice per group). (f) Relative numbers of parasite foci per mm2 tissue related to foci size, in mice treated as in (b), respectively. Foci sizes were determined by counting number of vacuoles ( < 10, 11–50 or >50 vacuoles/focus) containing replicating tachyzoites. Data show mean ± SEM from three independent experiments (n = 11–14 mice per group). (g) Transmigration frequencies of freshly egressed T. gondii tachyzoites (RH, CPS) across bEnd.3 or Caco2 polarized monolayers, in presence or absence of uracil, are shown as percentage (%) of tachyzoites added in the upper well and assessed by plaquing assays as described under Methods. Data show mean ± SEM from four independent experiments performed in duplicate. (h) Transmigration frequencies of freshly egressed CPS tachyzoites grown in absence of uracil for 24, 48, and 72 hr, respectively. Data show mean ± SEM from three independent experiments performed in duplicate (i) Gliding motility analyses of freshly egressed RH and CPS tachyzoites, in presence or absence of uracil. Compiled data show individual trail lengths (n = 45–50) and mean + SEM from three independent experiments. (j) Transmigration frequencies of T. gondii tachyzoites (RH, CPS) as in (g) in presence or absence of FAK inhibitor (VS-6063). Data show mean ± SEM from 3 (bEnd.3) and 4 (Caco2) independent experiments performed in duplicate. (k) Relative parasite frequency in the brain after co-infection in CD1 mice. Each mouse was co-inoculated i.v. with 5 × 10⁷ (50 M), 1 × 10⁷ (10 M) or 1.5 × 10⁶ (1.5 M) freshly egressed RH and an equal number of freshly egressed CPS tachyzoites, respectively. Consecutive coronal brain sections were assessed for T. gondii after 24, 48, or 72 hr, respectively, as detailed in (Figure 9—figure supplement 3a-d). Data show mean ± SEM from 3 to 4 mice per experiment and condition. (l, m) Parasite loads in the brains of CD1 mice treated with FAK inhibitor (l) or ECPTK2 cKO mice (m), respectively, challenged with freshly egressed CPS tachyzoites (2 × 10⁸, i.v.). Parasite loads were assessed as in (k). Data show mean + SEM from 2 experiments and 5 mice per condition. (n) Representative micrographs from brain sections of C57BL/6 mice challenged with CPS (2 × 10⁸, i.v.) and stained for endothelial marker GLUT1, the basal lamina markerβ1 laminin and anti-T. gondii antibodies followed by secondary antibody Alexa 488/405/594, respectively. Left: micrograph and inset depict intravascular CPS tachyzoites. Right: micrograph illustrates extravascular localization of CPS. Inset represents magnification of area of interest. Arrows indicate T. gondii tachyzoites. Scale bars, 25 µm (Figure 9—figure supplement 3e). *p< 0.05; **p < 0.01; ***p < 0.001; ****p < 0.0001; ns, non-significant (a, g–j) one-way ANOVA followed by Sidaks post-hoc test, (b, c, e, f, l, m), Mann-Whitney test.
-
Figure 9—source data 1
Western blots corresponding to Figure 9a.
- https://cdn.elifesciences.org/articles/69182/elife-69182-fig9-data1-v3.zip
Figure 9—figure supplement 1
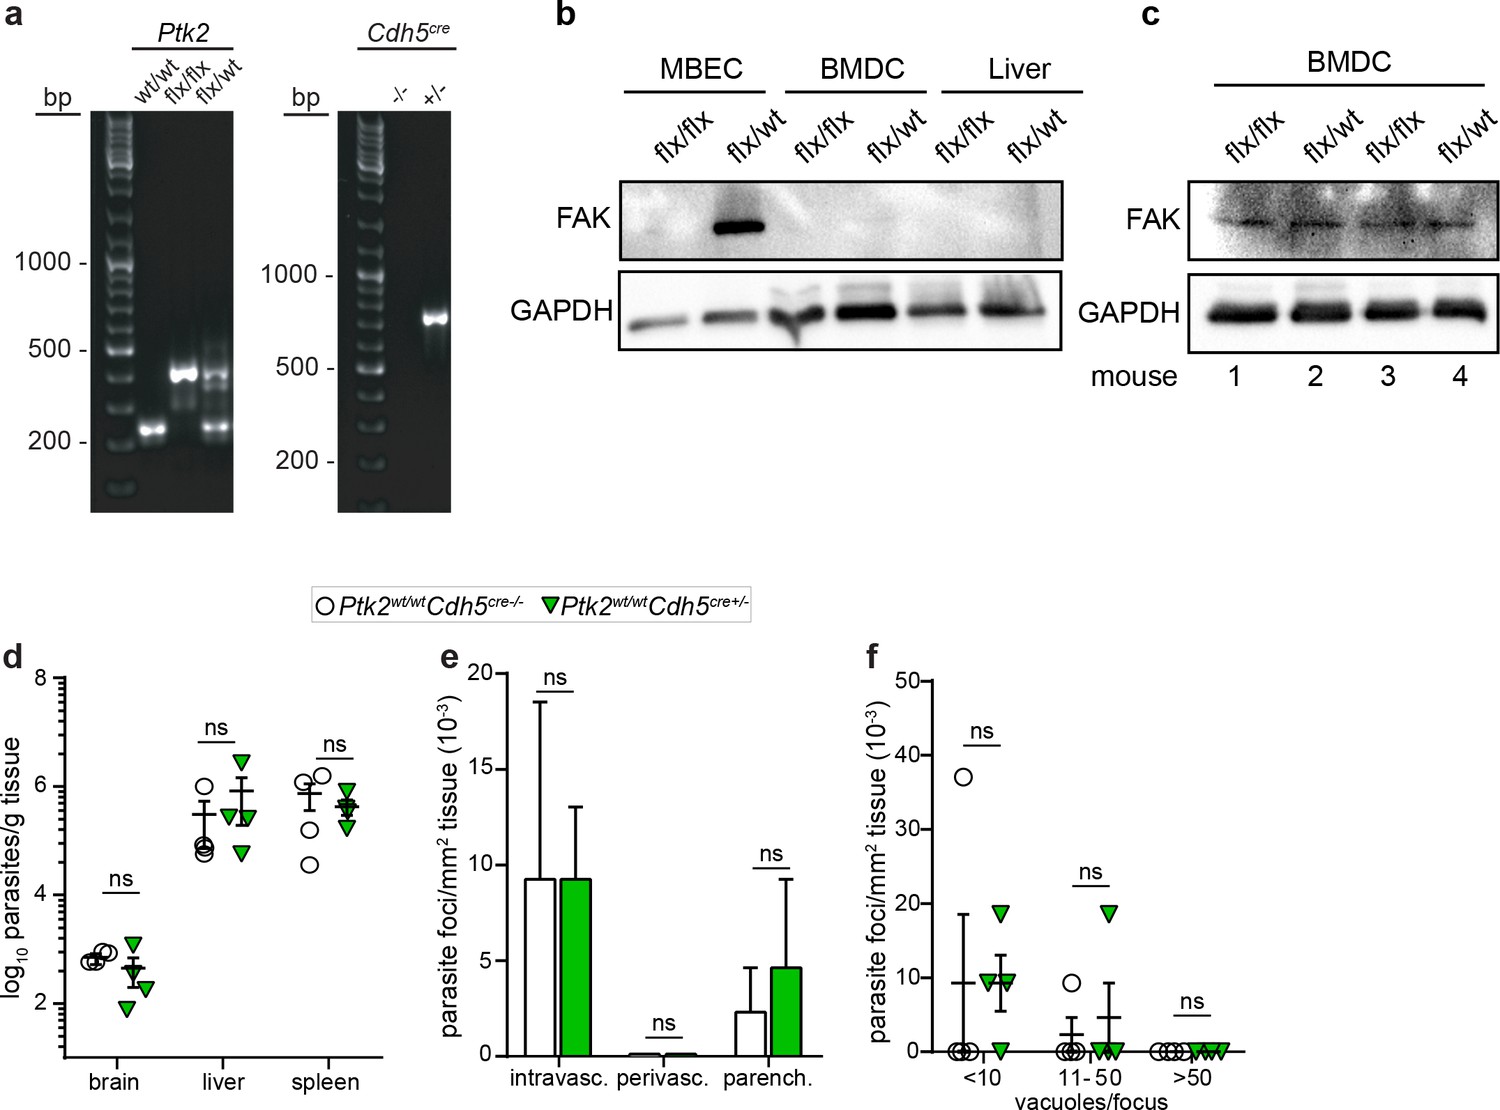
Genotyping, FAK expression in tissue of ECPTK2 cKO mice and characterizations of parasite loads and foci of Cre control mice.
(a) PCR analysis of genomic DNA for genotyping of Ptk2wt/wt (one band of 237 bp), Ptk2flox/wt (two bands of 350 bp and 237 bp, respectively) and Ptk2flox/flox (350 bp band) mice (left) and Cdh5cre-/- (no band) and Cdh5cre+/- (720 bp band) mice (right). (b) Western blot shows the relative FAK expression in mouse brain endothelial cells (MBEC), bone-marrow-derived cells (BMDC) and liver homogenates. A distinct band corresponding to FAK is detected in MBECs derived from Ptk2flox/wt mice, with undetectable signal under these conditions in MBECs derived from Ptk2flox/flox (ECPTK2 cKO) mice, BMDCs and liver, respectively. GAPDH was used as loading control. (c) Western blot of FAK expression in BMDCs show similar expression in tested mice (Ptk2flox/flox, mouse 1 and 3; Ptk2flox/wt, mouse 2 and 4) and low expression levels related to MBECs (b). GAPDH was used as loading control. (d) Quantifications of parasite loads by plaquing assays in brain, liver and spleen of control mice (Ptk2wt/wtCdh5cre-/- and Ptk2wt/wtCdh5cre+/-) C57BL/6 mice, respectively, challenged as in Figure 9b with T. gondii (ME49, 5 × 10⁴) and assessed at day 6 post-inoculation. (e) Bar graph shows the relative proportion of intravascular, perivascular and parenchymal parasite foci in control mice (Ptk2wt/wtCdh5cre-/- and Ptk2wt/wtCdh5cre+/-), respectively, challenged as in Figure 9e with T. gondii, assessed 6 days post-inoculation. (f) Relative numbers of parasite foci per mm2 tissue related to foci size, in mice treated as in Figure 9f, respectively. Foci sizes were determined by counting number of vacuoles ( < 10, 11–50 or >50 vacuoles/focus) containing replicating tachyzoites. (d, e, f) Data show mean ± SEM (n = 4 mice per group). ns, non-significant, Mann-Whitney test.
-
Figure 9—figure supplement 1—source data 1
Western blots corresponding to Figure 9—figure supplement 1b,c.
- https://cdn.elifesciences.org/articles/69182/elife-69182-fig9-figsupp1-data1-v3.pdf
Figure 9—figure supplement 2
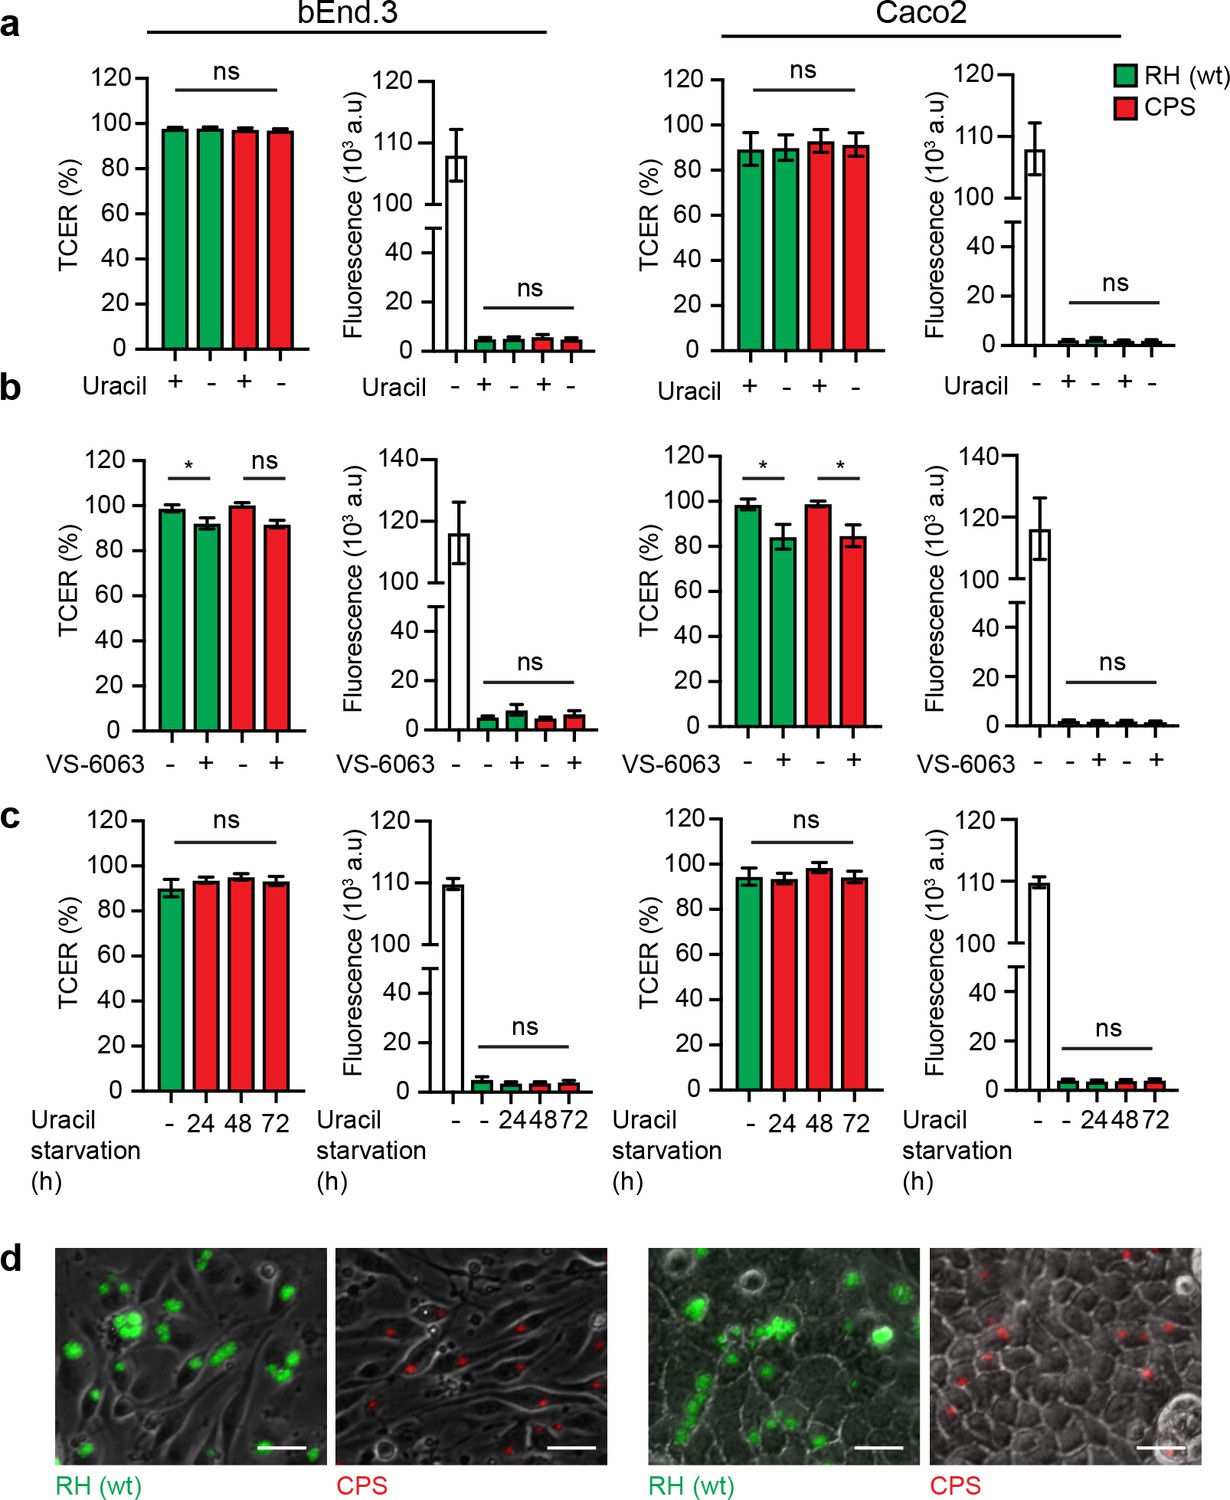
Assessments of polarization and barrier integrity for transmigration assays, and replication in monolayers.
(a, b, c) For each condition, bar graphs (left) show TCER values (Ω•cm2) relative to TCER values at the initiation of the assay (100%) for bEnd.3 and Caco2 monolayers, respectively. Corresponding bar graphs (right) show the permeability of bEnd.3 and Caco2 monolayers, respectively, to FITC‐dextran (3 kDa). FITC-dextran was added to the upper transwell chamber and quantified in the lower chamber upon challenge with freshly egressed T. gondii tachyzoites. White-colored bars indicate control in absence of a polarized monolayer. Data is shown as arbitrary fluorescence units (AU). All data show mean ± SEM from three independent experiments. *p < 0.05; ns, non-significant, one-way ANOVA followed by Sidaks post-hoc test. (d) Imaging of challenged monolayers after transmigration assay. Representative micrographs show combined live phase contrast and epifluorescence microscopy of bEnd.3 and Caco2 monolayers at 18–20 hr post-challenge with RH (GFP) and CPS (mCherry), respectively. Intracellular vacuoles with replicating tachyzoites can be appreciated for RH condition and singe tachyzoites for CPS condition. Data are representative of multiple experiments. Scale bars, 50 μm.
Figure 9—figure supplement 3
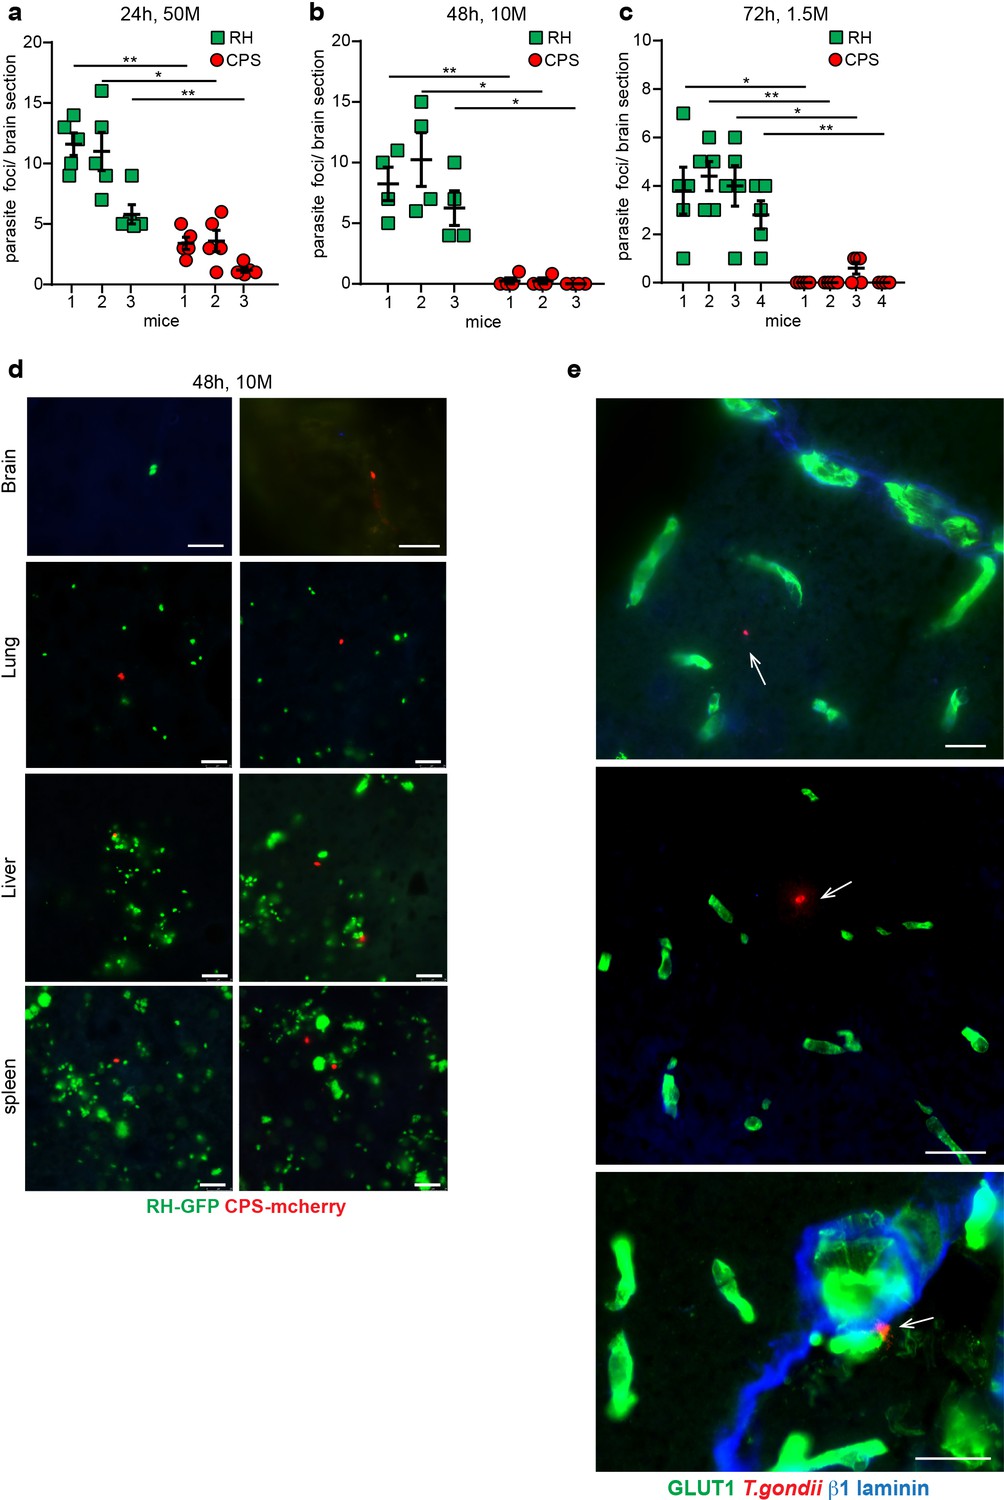
Parasite loads in brain a peripheral organs upon challenge with the non-replicating CPS line.
(a, b, c) Each CD1 mouse was co-inoculated i.v. with 5 × 10⁷ (50 M), 1 × 10⁷ (10 M) or 1,5 × 10⁶ (1.5 M) freshly egressed RH (GFP) and an equal number of freshly egressed CPS (mCherry) tachyzoites, respectively. After 24, 48, or 72 hr, respectively, 4–5 consecutive coronal brain sections from the frontal lobe were assessed for T. gondii tachyzoites, for each mouse. Data show absolute numbers of single tachyzoites or replicating foci, counted equally ( = 1) for RH, and of single tachyzoites for non-replicating CPS, per brain section. Mean + SEM from 3 to 4 mice per experiment and condition. *p < 0.05, **p < 0.01; Paired t test. (d) Representative micrographs illustrate the relative parasite loads of RH (GFP+, green) and CPS (mCherry+, red) in brain, lung, liver, and spleen, respectively, of mice challenged as in (b). Scale bars, 25 µm. (e) Representative micrographs show CPS tachyzoites in brain parenchyma of C57BL/6 mice challenged with CPS (2 × 10⁸, i.v.) and stained for the endothelial marker GLUT1, the basal lamina marker β1 laminin and with anti-T. gondii antibodies. Arrows indicate T. gondii. Scale bars, 25 µm.
Videos
Video 1
Intravascular replication of T. gondii in brain microvasculature.
Movie shows 3D projections of vacuoles with replicating T. gondii (GFP+, green) and association to the vasculature (EB+, red) as detailed in Methods.
Video 2
Perivascular replication of T. gondii.
Movie shows 3D projections of parasite foci with replicating T. gondii (GFP+) in close proximity to the vasculature (EB+, red) as detailed in Figure 3. Nuclei (blue) were stained with DAPI.
Video 3
Parenchymal localization of T. gondii.
Movie shows 3D projections T. gondii tachyzoites (GFP+) and spatial relation to the vasculature (EB+, red).
Video 4
Intravascular, perivascular, and parenchymal localization of T. gondii.
Movie shows 3D projections of parasite foci with replicating T. gondii (GFP+) within a microvessel (EB+, red), in close proximity outside vasculature and distant location.
Video 5
Penetration to the parenchymal tissue by T. gondii.
Movies show 3D projections of representative parasite foci with replicating T. gondii (GFP+) within the brain parenchyma (cell nuclei, DAPI/ blue) and association to the vasculature (EB+, red).
Video 6
Penetration to the parenchymal tissue by T. gondii.
Movies show 3D projections of representative parasite foci with replicating T. gondii (GFP+) within the brain parenchyma (cell nuclei, DAPI/ blue) and association to the vasculature (EB+, red).
Video 7
Penetration to the parenchymal tissue by T. gondii.
Movies show 3D projections of representative parasite foci with replicating T. gondii (GFP+) within the brain parenchyma (cell nuclei, DAPI/ blue) and association to the vasculature (EB+, red).
Video 8
Penetration to the parenchymal tissue by T. gondii.
Movies show 3D projections of representative parasite foci with replicating T. gondii (GFP+) within the brain parenchyma (cell nuclei, DAPI/ blue) and association to the vasculature (EB+, red).
Video 9
Two-photon microscopy analyses of brain tissue ex vivo.
Brains were extracted from T. gondii-challenged mice and immediately subjected to microcopy as indicated under Materials and methods. Movies show 3D projections of representative parasite foci with replicating T. gondii (GFP+) and spatial relation to the vasculature (EB+, red).
Video 10
Two-photon microscopy analyses of brain tissue ex vivo.
Brains were extracted from T. gondii-challenged mice and immediately subjected to microcopy as indicated under Materials and methods. Movies show 3D projections of representative parasite foci with replicating T. gondii (GFP+) and spatial relation to the vasculature (EB+, red).
Video 11
Localization of tachyzoites (CPS) in brain tissue.
Movie shows 3D projections of brain section from C57BL/6 mice challenged with freshly egressed CPS tachyzoites (2 × 10⁸, i.v.) and stained for endothelial marker GLUT1 (green) and anti-T. gondii followed by secondary antibody Alexa 594 (red).
Tables
Key resources table
| Reagent type (species) or resource | Designation | Source or reference | Identifiers | Additional information |
|---|---|---|---|---|
| Strain, strain background (Mus musculus) | C57BL/6NCrl(B6) | Charles River Laboratories | Strain code 027 | |
| Strain, strain background (Mus musculus) | Crl:CD1(ICR)(CD1) | Charles River Laboratories | Strain code 022 | |
| Strain, strain background (Mus musculus) | BALB/cAnNCrl(BALB/c) | Charles River Laboratories | Strain code 028 | |
| Strain, strain background (Mus musculus) | B6.129P2(FVB)-Ptk2tm1.1Guan/J(Ptk2flox/flox) | Jackson Laboratories (Shen et al., 2005; Daneman and Prat, 2015) | JAX stock # 031956 | |
| Strain, strain background (Mus musculus) | C57BL/6-Tg(Cdh5-cre/ERT2)1Rha (Cdh5cre+/-) | Taconic Biosciences | Taconic Model # 13,073 | |
| Cell line (T. gondii) | GFP-expressing RH-LDM, type I(RH) | Kim et al., 2001;Barragan and Sibley, 2002; | ||
| Cell line (T. gondii) | GFP-expressing ME49/PTG, type II(ME49) | Kim et al., 2001 | ||
| Cell line (T. gondii) | mCherry-expressing CPS, type I (CPS) | Fox and Bzik, 2002;Konradt et al., 2016 | ||
| Cell line (Homo sapiens) | HFF-1(HFF) | American Type Culture Collection | SCRC-1041 | |
| Cell line (Mus musculus) | bEND.3 | American Type Culture Collection | CRL-2299 | |
| Cell line (Homo sapiens) | Caco-2 | American Type Culture Collection | HTB-37 | |
| Antibody | Anti-P- glycoprotein (Mouse monoclonal) | GeneTex | Cat# GTX23364, RRID:AB_367204 | IF(1:100) |
| Antibody | Anti- GFAP (Rat monoclonal) | Thermo Fisher Scientific | Cat# 13–0300, RRID:AB_2532994 | IF(1:200) |
| Antibody | Anti-Occludin (Mouse monoclonal) | Thermo Fisher Scientific | Cat# 33–1500, RRID:AB_2533101 | IF(1:100) |
| Antibody | Anti- Iba1(Rabbit polyclonal) | FUJIFILM Wako Shibayag | Cat# 019–19741, RRID:AB_839504 | IF(1:100) |
| Antibody | Anti-CD45 (Rat monoclonal) | BD Biosciences | Cat# 550539, RRID:AB_2174426 | IF(1:20) |
| Antibody | Anti-CD31 (Rat monoclonal) | BD Biosciences | Cat# 553370, RRID:AB_394816 | IF(1:100) |
| Antibody | Anti-ZO-1 (Rabbit polyclonal) | Thermo Fisher Scientific | Cat# 40–2200, RRID:AB_2533456 | IF(1:100) |
| Antibody | Anti-Glut1(Goat polyclonal) | Santa Cruz Biotechnology | Cat# sc-1605, RRID:AB_2239463 | IF(1:40) |
| Antibody | Anti- laminin α4 (Rat polyclonal) | gift from Lydia Sorokin and Krister Kristensson.Masocha et al., 2004. doi:10.1172/JCI22104. | serum 341 | IF(1:500) |
| Antibody | Anti- laminin α5 (Rat polyclonal) | gift from Lydia Sorokin and Krister Kristensson. Masocha et al., 2004. doi:10.1172/JCI22104. | supernatant; clone 4G6 | IF(1:20) |
| Antibody | Anti- laminin β1 (Rat monoclonal) | gift from Lydia Sorokin and Krister Kristensson. Masocha et al., 2004. doi:10.1172/JCI22104. | 1:1; clone 3A4 | IF(1:100) |
| Antibody | Anti-T. gondii (Rabbit polyclonal) | Dellacasa-Lindberg et al., 2011:10.1128/IAI.01042–10 | IF(1:100) | |
| Antibody | Anti-Rat IgG (H + L) Alexa Fluor 594 (Chicken polyclonal) | Thermo Fisher Scientific | Cat# A-21471, RRID:AB_2535874 | IF(1:500) |
| Antibody | Anti-Mouse IgG (H + L) Alexa Fluor 405 (Goat polyclonal) | Thermo Fisher Scientific | Cat# A-31553, RRID:AB_221604 | IF(1:500) |
| Antibody | Anti-Rabbit IgG (H + L) Alexa Fluor 488 (Chicken polyclonal) | Thermo Fisher Scientific | Cat# A-21441, RRID:AB_2535859 | IF(1:1000) |
| Antibody | Anti-Rabbit IgG (H + L) Alexa Fluor 594 (Chicken polyclonal) | Thermo Fisher Scientific | Cat# A-21442, RRID:AB_2535860 | IF(1:1000) |
| Antibody | Anti-Goat IgG (H + L) Alexa Fluor 488 (Donkey polyclonal) | Jackson ImmunoResearch Labs | Cat# 705-545-147, RRID:AB_2336933 | IF(1:100) |
| Antibody | Anti-Rat IgG (H + L) Alexa Fluor 488 (Donkey polyclonal) | Jackson ImmunoResearch Labs | Cat# 712-545-150, RRID:AB_2340683 | IF(1:100) |
| Antibody | Anti-mouse CD45 Brilliant Violet 711(Rat monoclonal) | BioLegend | Cat# 103147, RRID:AB_2564383 | FACS (1 ul per test) |
| Antibody | Anti-mouse CD11b (M1/70), APC, eBioscience (Rat monoclonal) | Thermo Fisher Scientific | Cat# 17-0112-82, RRID:AB_469343 | FACS (1 ul per test) |
| Antibody | Anti- FAK (Rabbit polyclonal) | Cell Signaling Technology | Cat# 3285, RRID:AB_2269034 | WB (1:1000) |
| Antibody | Anti-Toxoplasma gondii P30 (Mouse monoclonal) | Thermo Fisher Scientific | Cat# MA1-83499, RRID:AB_935764 | IF(1:50) |
| Antibody | Anti-rabbit IgG, HRP-linked (Goat polyclonal) | Cell Signaling Technology | Cat# 7074, RRID:AB_2099233 | WB (1:3000) |
| Antibody | Anti-GAPDH (Rabbit polyclonal) | Millipore | Cat# ABS16, RRID:AB_10806772 | WB (1:3000) |
| Sequence-based reagent | Gapdh_F | This paper | PCR primers | TGACCTCAA CTACATGGTCTACA |
| Sequence-based reagent | Gapdh_R | This paper | PCR primers | CTTCCCATT CTCGGCCTTG |
| Sequence-based reagent | Hprt_F | This paper | PCR primers | CCC AGC GTC GTG ATT AGC |
| Sequence-based reagent | Hprt_R | This paper | PCR primers | GGA ATA AAC ACT TTT TCC AAA TCC |
| Sequence-based reagent | Mmp2_F | This paper | PCR primers | GTT GCT TTT GTA TGC CCT TCG |
| Sequence-based reagent | Mmp2_R | This paper | PCR primers | TCA GAC AAC CCG AGT CCT TTG |
| Sequence-based reagent | Mmp12_F | This paper | PCR primers | TGT GGA GTG CCC GAT GTA CA |
| Sequence-based reagent | Mmp12_R | This paper | PCR primers | AGT GAG GTA CCG CTT CAT CCA T |
| Sequence-based reagent | Mmp9_F | This paper | PCR primers | AAA ACC TCC AAC CTC ACG GA |
| Sequence-based reagent | Mmp9_R | This paper | PCR primers | GCT TCT CTC CCA TCA TCT GGG |
| Sequence-based reagent | Mmp14_F | This paper | PCR primers | TATGGGCCC AACATCTGTGAC |
| Sequence-based reagent | Mmp14_R | This paper | PCR primers | AACCATC GCTCCTTG AAGACA |
| Sequence-based reagent | Vcam1_F | This paper | PCR primers | GTG ACT CCA TGG CCC TCA CTT |
| Sequence-based reagent | Vcam1_R | This paper | PCR primers | CGT CCT CAC CTT CGC GTT TA |
| Sequence-based reagent | Icam1_F | This paper | PCR primers | CAA TTT CTC ATG CCG CAC AG |
| Sequence-based reagent | Icam1_R | This paper | PCR primers | CTG GAA GAT CGA AAG TCC GG |
| Sequence-based reagent | Sele (E-selectin)_F | This paper | PCR primers | CCC TGC CCA CGG TAT CAG |
| Sequence-based reagent | Sele (E-selectin)_R | This paper | PCR primers | ACG TGC ATG TCG TGT TCCA |
| Sequence-based reagent | Ocln_F | This paper | PCR primers | AGG ACG GAC CCT GAC CAC TA |
| Sequence-based reagent | Ocln_R | This paper | PCR primers | GGT GGA TAT TCC CTG ACC CAG |
| Sequence-based reagent | Ifng_F | This paper | PCR primers | GCT TTG CAG CTC TTC CTC AT |
| Sequence-based reagent | Ifng_R | This paper | PCR primers | CAC ATC TAT GCC ACT TGA GTT AAA ATA GT |
| Sequence-based reagent | Ccl2_F | This paper | PCR primers | CATCCACGTGTTGGCTCA |
| Sequence-based reagent | Ccl2_R | This paper | PCR primers | GATCATCTTGCTGGTGAATGAGT |
| Sequence-based reagent | Il1240_F | This paper | PCR primers | TCCCTCAAGTTCTTTGTTCG |
| Sequence-based reagent | Il1240_R | This paper | PCR primers | CGCACCTTTCTGGTTACAC |
| Sequence-based reagent | Timp1_F | This paper | PCR primers | GCAACTCGGACCTGGTCATAA |
| Sequence-based reagent | Timp1_R | This paper | PCR primers | CGCTGGTATAAGGTGGTCTCG |
| Sequence-based reagent | Timp2_F | This paper | PCR primers | CTCGCTGTCCCATGATCCC |
| Sequence-based reagent | Timp2_R | This paper | PCR primers | GCCCATTGATGCTCTTCTCTGT |
| Sequence-based reagent | B1_F | This paper | PCR primers | GCATTGCCCGTCCAAACT |
| Sequence-based reagent | B1_R | This paper | PCR primers | AGACTGTACGGAATGGAGACGAA |
| Sequence-based reagent | Ptk2tm1.1_F | The Jackson Laboratory | Stock No: 031956. Protocol 35,084 | GAA CTT GAC AGG GCT GGT CT |
| Sequence-based reagent | Ptk2tm1.1_R | The Jackson Laboratory | Stock No: 031956. Protocol 35,084 | CTC CAG TCG TTA TGG GAA ATC T |
| Sequence-based reagent | CRE_F | Taconic Biosciences | A.2684.Line: 13,073 Tg(Cdh5-cre/ERT2)1Rha | GCCTGCATTACCGGTCGATGCAACGA |
| Sequence-based reagent | CRE_R | Taconic Biosciences | A.2684.Line: 13,073 Tg(Cdh5-cre/ERT2)1Rha | GTGGCAGATGGCGCGGCAACACCATT |
| Chemical compound, drug | Lipopolysaccharides from Escherichia coli O111:B4 | Sigma Aldrich | L2630 | |
| Chemical compound, drug | Hydrocortisone | Sigma Aldrich | H0888 | |
| Chemical compound, drug | Evans Blue | Sigma Aldrich | E2129 | |
| Chemical compound, druC | Defactinib (VS-6063) | Selleck Chemical’s | S7654 | |
| Chemical compound, drug | (Z)–4-Hydroxytamoxifen | Sigma Aldrich | H7904 | |
| Chemical compound, drug | Tamoxifen | Sigma Aldrich | T5648 | |
| Commercial assay or kit | RNeasy Mini Kit | QIAGEN | 74,104 | |
| Commercial assay or kit | DNeasy Blood & Tissue Kit | QIAGEN | 69,506 | |
| Commercial assay or kit | SuperScript IV Reverse Transcriptase (RT) | Thermo Fisher Scientific | 18090050 | |
| Commercial assay or kit | Platinum Taq DNA Polymerase | Thermo Fisher Scientific | 10966034 |
Additional files
Download links
A two-part list of links to download the article, or parts of the article, in various formats.
Downloads (link to download the article as PDF)
Open citations (links to open the citations from this article in various online reference manager services)
Cite this article (links to download the citations from this article in formats compatible with various reference manager tools)
Blood-brain barrier-restricted translocation of Toxoplasma gondii from cortical capillaries
eLife 10:e69182.
https://doi.org/10.7554/eLife.69182


