Repression of CHROMOMETHYLASE 3 prevents epigenetic collateral damage in Arabidopsis
- Gregor Mendel Institute (GMI), Austrian Academy of Sciences, Vienna Biocenter (VBC), Dr. Bohr-Gasse 3, Austria
- Genetics, LMU Biocenter, Ludwig-Maximilians University, Germany
- Laboratory of Molecular Biology, Wageningen University, Netherlands
Figures
Figure 1 with 1 supplement

Cell division is linked with CG and CHG methylation through distinct mechanisms.
(A) Bar chart depicting total abundance (top) and heat map of individual relative transcript levels (bottom) of genes involved in CG methylation in three biological replicates each of flowers, embryos, and leaves (Hofmann et al., 2019). fb, floral buds; pg, preglobular; gl, globular; eh, early heart; lh, late heart; et, early torpedo; lt, late torpedo; bc, bent cotyledon; mg, mature green; lf, leaf. (B) Heatmap showing developmental dynamics of permuted gene set (top) median values (i.e. 1000 iterations of random sampling of 25 genes) and top-25 genes co-varying with MET1, VIM1, VIM2, and VIM3 obtained by employing nearest neighbor algorithm calculated based on Euclidean distance between genes and centroid expression of MET1, VIM1, VIM2, and VIM3 (bottom). (C) Sequence logo representing nucleotide probability relative to differentially methylated cytosines (DMC). (D) Proportion of CG and CHG differentially methylated regions (DMRs) overlapping genomic features. Venn diagram showing overlap between CG and CHG DMRs. Significance overlap of DMRs determined by Fisher's Exact test p value < 0.0001 is indicated by ****. (E and F) Violin plot showing CG (top) and CHG (bottom) methylation differences between mutant and WT leaves for CHG DMRs overlapping (E) or not overlapping (F) with CG DMRs (Stroud et al., 2013). (G and H) Box plots of average weighted methylation of CG DMRs (n = 1185) and (G) CHG DMRs (n = 1398) during development. fb, floral buds; pg, preglobular; eh, early heart; tp, torpedo (6 DAP) Pignatta et al., 2015; bc, bent cotyledon; lt-mg, late torpedo-to-early mature green Hsieh et al., 2009; mg, mature green Bouyer et al., 2017; lf, leaf. fb, pg, eh, bc and lf were from Bouyer et al., 2017; Hsieh et al., 2009; Papareddy et al., 2020; Pignatta et al., 2015. Unless stated as not significant (ns), all combinations are significant with p values < 0.001 obtained by Mann-Whitney U test. Shaded horizontal line in the background represents the median methylation value of floral buds.
Figure 1—figure supplement 1
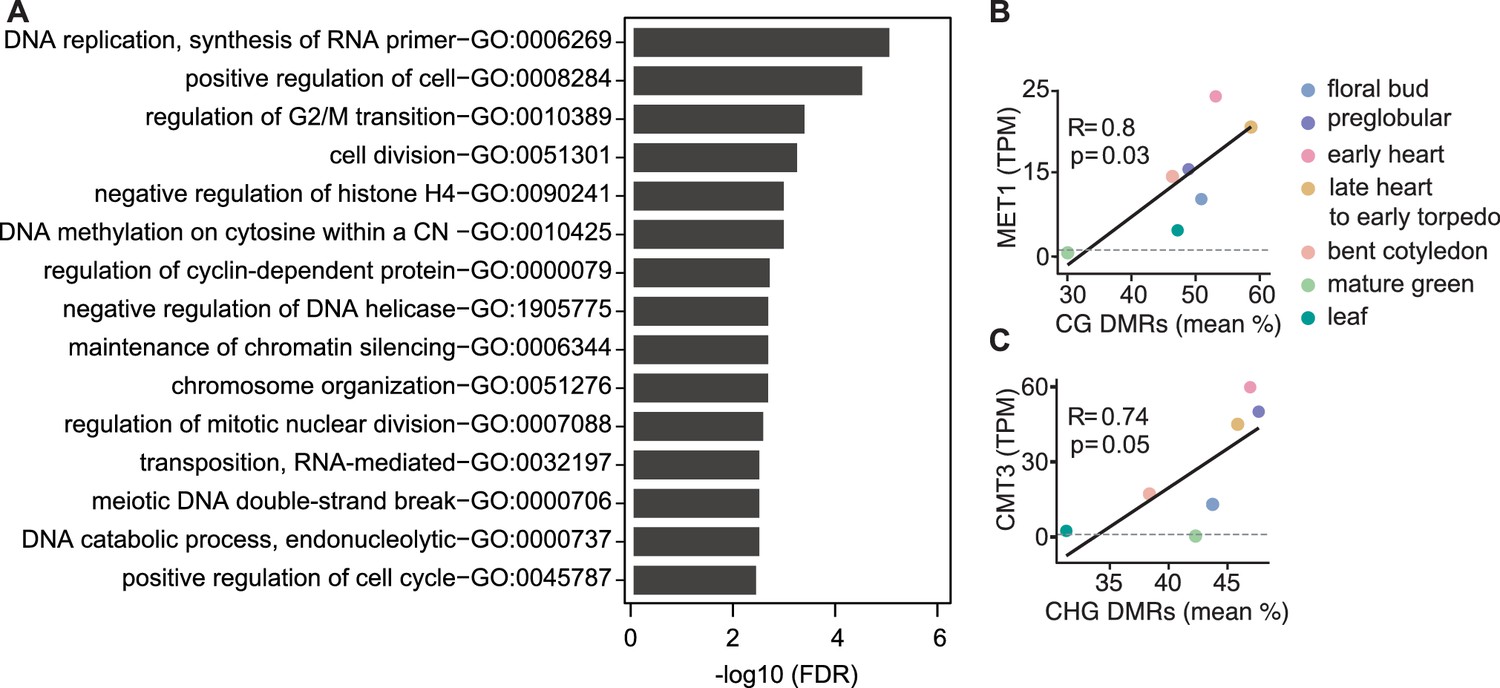
Characteristics of genes and differentially methylated regions co-expressed with symmetric methyltransferases.
(A) Gene ontology enrichment of top-50 genes co-expressed with MET1 and VIM1/2/3 with false discovery rates < 0.05. (B and C) Scatterplots showing Pearson’s R between MET1 transcript levels (TPM; transcripts per million) and mean-weighted CG methylation of developmental CG DMRs (B) or CMT3 TPM and mean-weighted CHG methylation of developmental CHG DMRs.
Figure 2 with 1 supplement
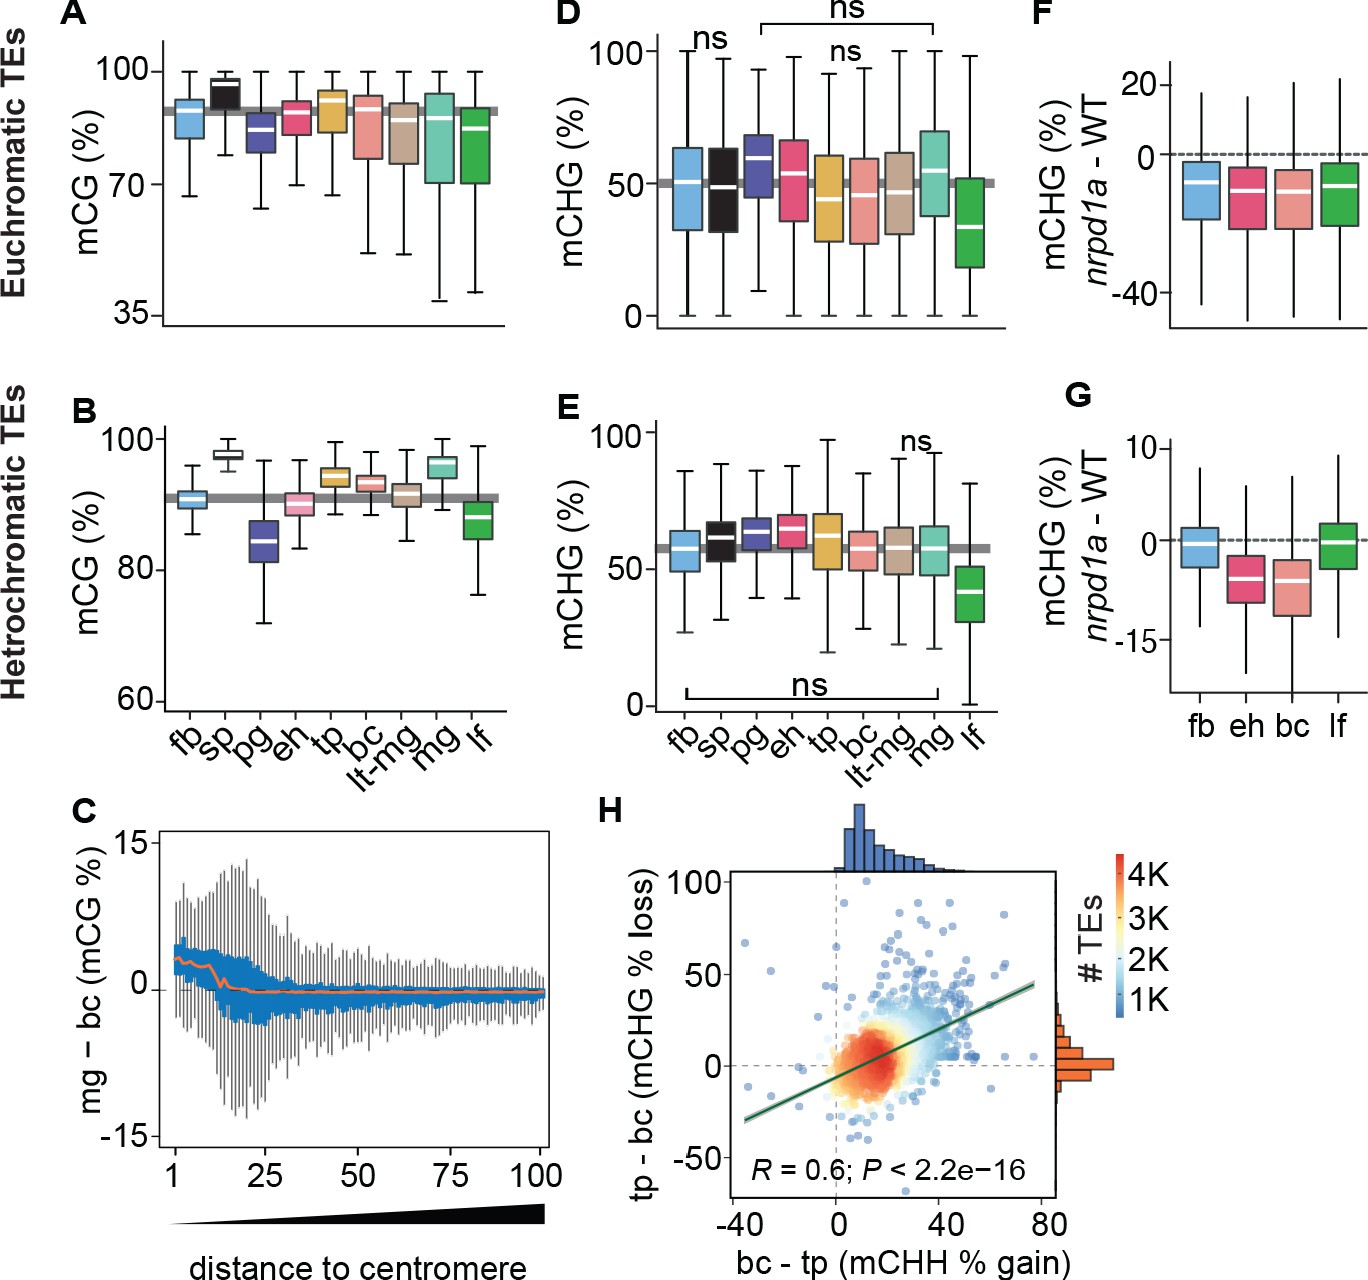
Genome-wide coordination of symmetric DNA methylation.
(A and B) Boxplots of CG methylation percentages on euchromatic (A) and heterochromatic (B) TEs during development. fb, floral buds; sp, sperm (Ibarra et al., 2012); pg, preglobular; eh, early heart; tp, torpedo (6 DAP); bc, bent cotyledon; lt-mg, late torpedo-to-early mature green; mg, mature green; lf, leaf. Thick horizontal bars indicate medians, and the top and bottom edges of boxes represent the 75th and 25th percentiles, respectively. Shaded horizontal line in the background represents the median methylation value of floral buds. (C) Difference in CG methylation between mature green (mg) and bent cotyledon (bc) embryos were calculated in 1 kb genomic bins, which were divided into percentiles and sorted based on their distance to centromeres (1 and 100 being the tile closest and furthest from centromeres, respectively). Red color line indicates the median and the top and bottom edges of the blue colored boxes represent 75th and 25th percentiles, respectively. Vertical gray bars indicate 1.5X the interquartile range. (D and E) Boxplots of CHG methylation on euchromatic (D) and heterochromatic (E) TEs during development (key as in A). (F and G) Boxplots of CHG methylation differences between nrpd1a and WT (Col-0) tissues for euchromatic (F) and heterochromatic (G) TEs. (H) Scatterplot showing Pearson’s correlation coefficients (R). Differences in mCHH and mCHG between bent cotyledon (bc) and torpedo stage (tp) embryos are shown on x- and y-axes, respectively. Histograms show the number of TEs in thousands (K).
Figure 2—figure supplement 1
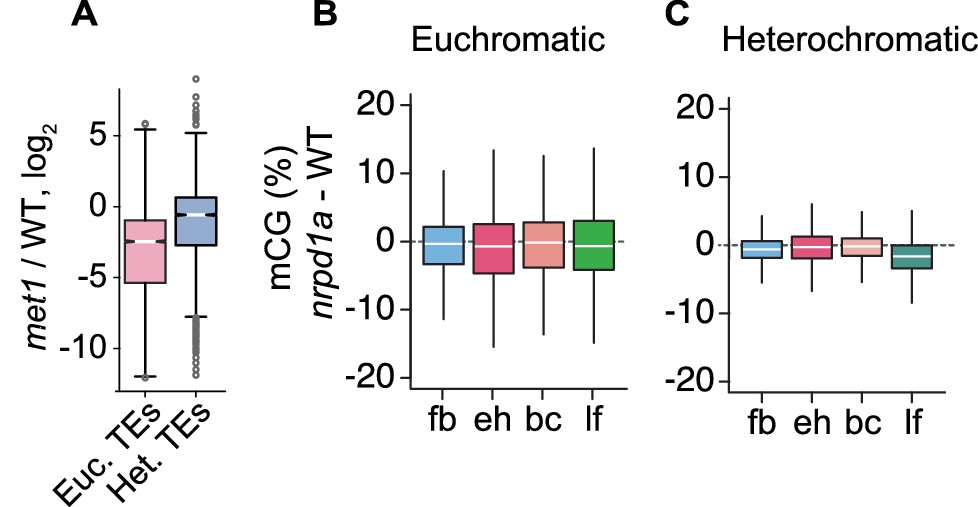
Relationships between MET1 and 24-nt siRNAs.
(A) Boxplot illustrating relative levels of 24-nt siRNAs in met1 relative to WT Lister et al., 2008; Euchromatic and heterochromatic TEs are abbreviated as Euc. TEs and Het. TEs, respectively. (B and C) Boxplots of CG methylation differences between nrpd1a and wild-type tissues for euchromatic (B) and heterochromatic (C) TEs. fb, floral buds; eh, early heart; bc, bent cotyledon; lf, leaf. Thick horizontal bars indicate medians, and the top and bottom edges of boxes indicate the 75th and 25th percentiles, respectively.
Figure 3 with 1 supplement
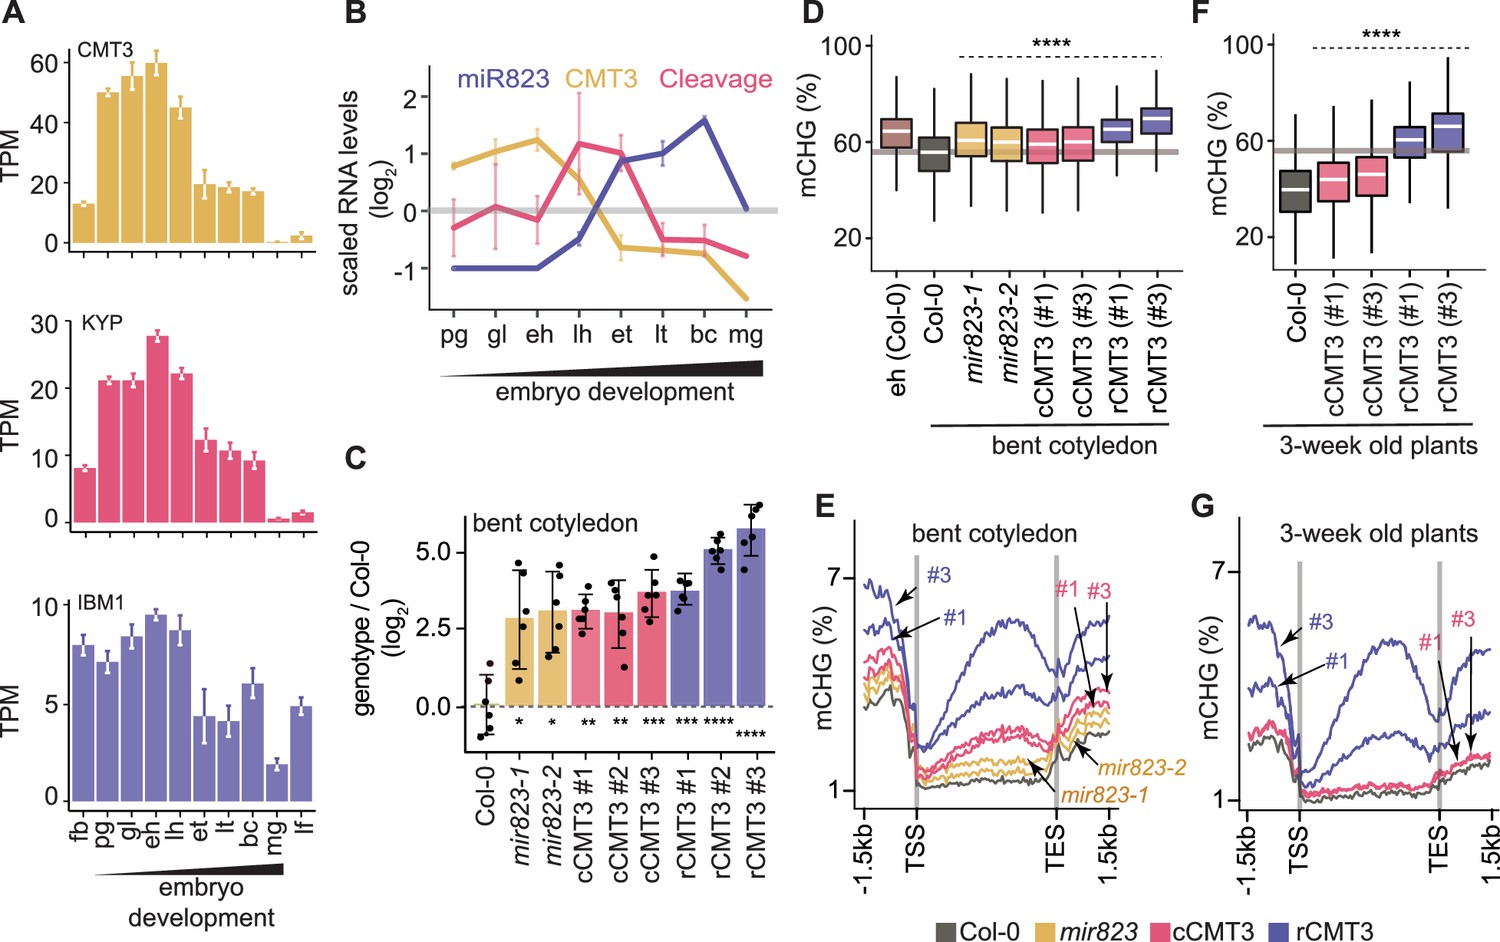
Repression of CMT3 during embryogenesis regulates methylome dynamics.
(A) Barplots illustrating transcript levels of CMT3 (top), KYP (middle), and IBM1 (bottom) in flowers, embryos, and leaves. fb, floral buds; pg, preglobular; gl, globular; eh, early heart; lh, late heart; et, early torpedo; lt, late torpedo; bc, bent cotyledon; mg, mature green; lf, leaf. (B) Line graphs showing the relative RNA abundance of miR823 (blue), CMT3 RNA (yellow), and miR823:CMT3 cleavage products (pink). (C) Log2-transformed relative CMT3 target transcript levels in bent cotyledon embryos (8 DAP; day after pollination) from WT plants (Col-0), or cmt3-11 plants expressing either miR823-cleavable CMT3 (cCMT3) or miR823-resistant CMT3 (rCMT3) versions. Each dot represents the mean of two technical replicates of embryos and bars represent mean values. Error bars in A-C represent standard errors of the means of three biological replicates. Asterisks indicate whether the transcript levels observed in mir823 mutant, cCMT3 and rCMT3 embryos were significantly different compared to WT (Two-tailed Student’s t tests; ****, ***, **, and * represent p values < 0.0001, < 0.001, < 0.01, and < 0.05, respectively). Color-coded according to the key. (D) Boxplots of CHG methylation on transposons with ≥five informative cytosines covered by ≥four reads and classified as either euchromatic or heterochromatic in Papareddy et al., 2020. pValues < 0.0001 based on Mann-Whitney U tests of methylation differences between WT and either mutant or transgenic bent cotyledon embryos are represented by ****. (E) Metaplots of average CHG methylation percentages across genes bodies from transcription start sites (TSS) to transcription end sites (TES), 1.5 kb upstream and 1.5 kb downstream of genes in bent cotyledon embryos. Color-coded according to the key. (F and G) Boxplots of CHG methylation on transposons (F) and metaplots of CHG methylation on genes (G) in three-week old plants as described in D and E, respectively.
Figure 3—figure supplement 1
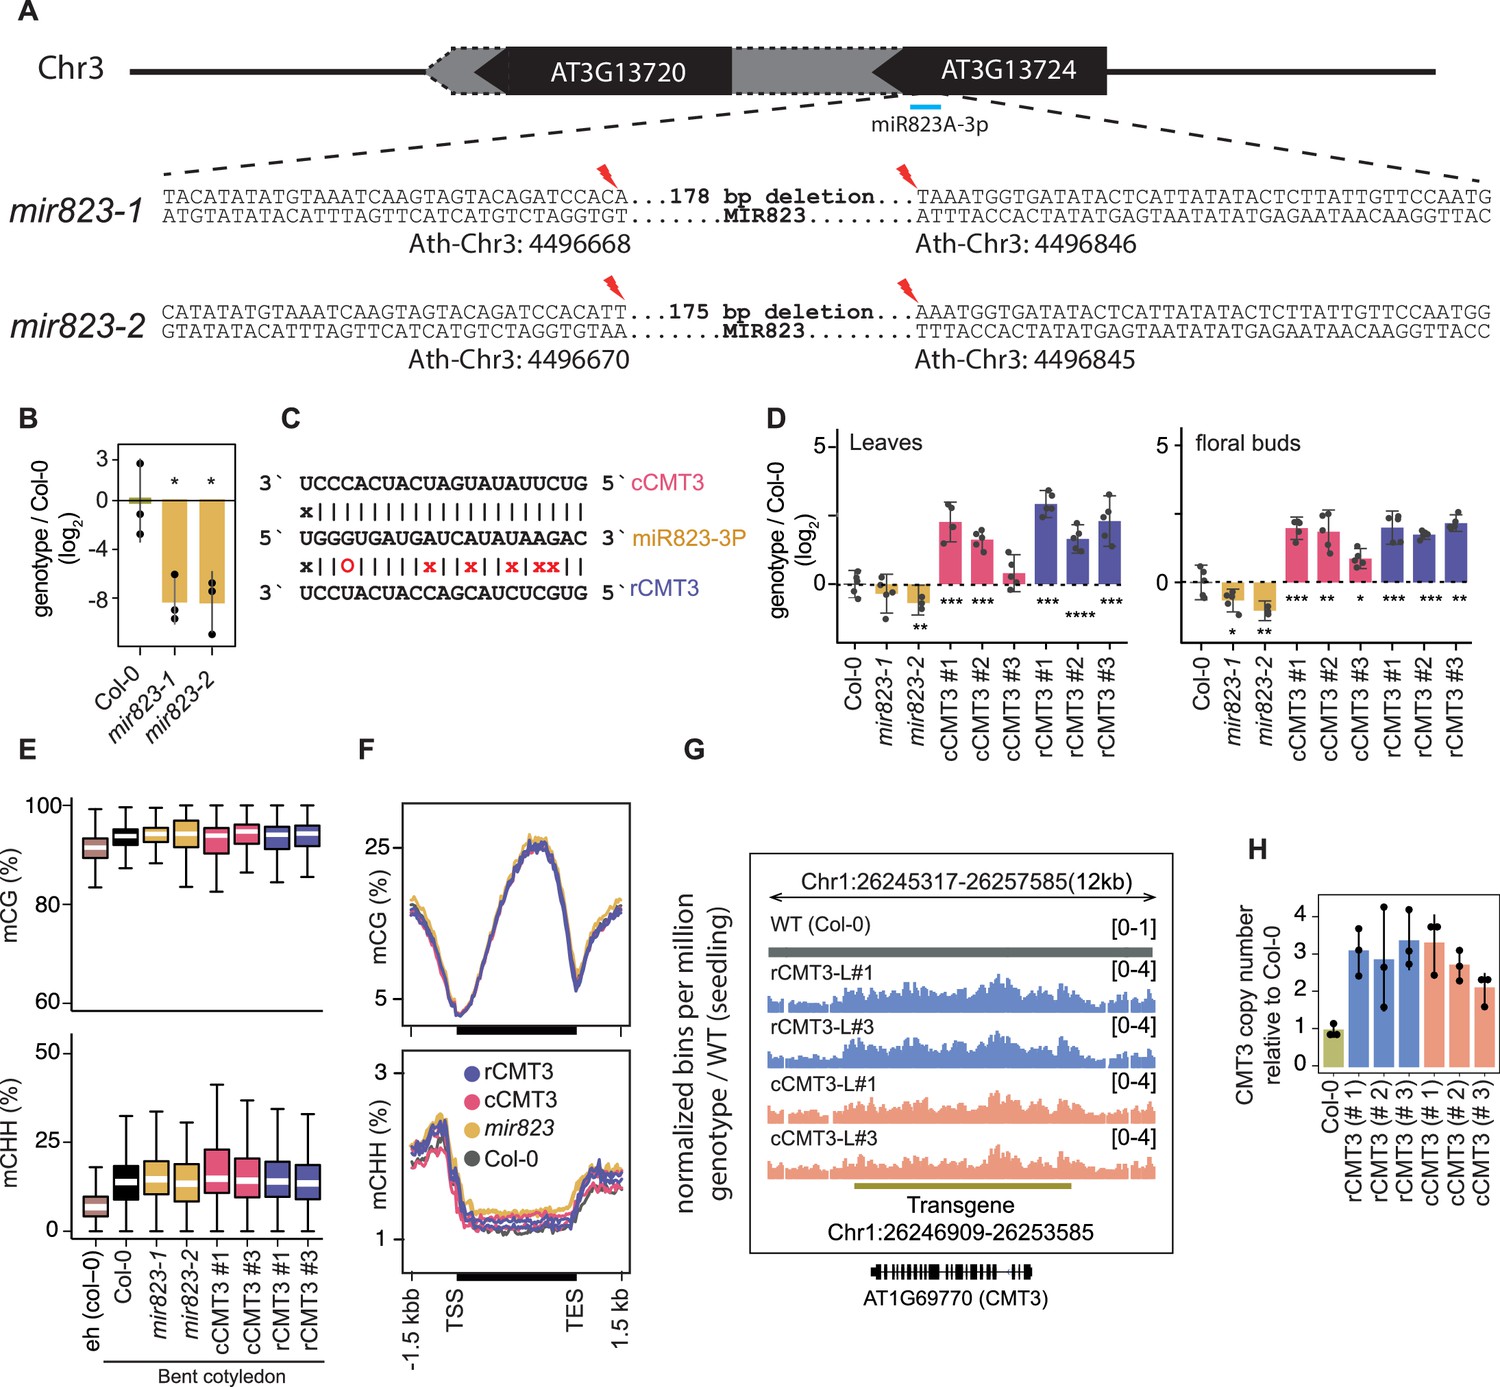
mir823 mutants and effects of miR823-directed repression of CMT3.
(A) Diagram of sequences deleted by CRISPR/Cas9 approach from MIR823A locus in miR823-1 and miR823-2. (B) Relative levels of miR823 in WT (Col-0), mir823-1 and mir823-2 bent cotyledon embryos (~8 DAP; days after pollination). Stem-loop qPCR values were normalized to U6 and then divided by the levels observed in wild-type plants before log2-transformation. Each dot represents the mean of two technical replicates of embryos, and error bars indicate standard error. p Values < 0.01 based on two-tailed Student’s t-test of differences between WT and miR823 mutants are represented by *. (C) Schematics of miR823 target site in CMT3 transcripts. Base-pairing interactions of miR823 with either wild-type target sites (cleavable, cCMT3) or miRNA-resistant target sites (resistant, rCMT3) are indicated above and below, respectively. Mutations introduced are labeled in red, and Watson-Crick base-pairing (I), non-base-pairing (X), and G:U wobbles (O) for each pair are indicated. (D) Relative CMT3 transcript levels in two-week old leaves (left) or floral buds (right) from WT plants (Col-0), mir823-1, mir823-2, or cmt3-11 plants carrying either miR823-cleavable CMT3 (cCMT3) or miR823-resistant CMT3 (rCMT3) transgenes. Bars represent mean values and error bars indicate standard errors. Asterisks indicate whether the transcript levels observed in mir823 mutants, or cCMT3 and rCMT3 transgenics were significantly different compared to WT (Two-tailed Student’s t-tests; ****, ***, **, and * represent p values < 0.0001, < 0.001, < 0.01, and < 0.05, respectively). (E) Boxplots of CG (top) and CHH (bottom) methylation on euchromatic and heterochromatic transposons with ≥4 informative cytosines covered by ≥5 reads. (F) Metaplots of average CG (top) and CHH (bottom) methylation percentages across genes bodies, and 1.5 kb upstream and downstream regions. Genotypes are color-coded according to the key. (G) Integrative Genomics Viewer screenshot of CMT3 locus showing normalized coverage of methylC-seq reads compared to WT (see Materials and methods). (H) CMT3 copy number quantification based on qPCR in 3-week-old leaves from WT (Col-0), or independently generated rCMT3 or cCMT3 transgenics in the cmt3-11 background.
Figure 4 with 1 supplement
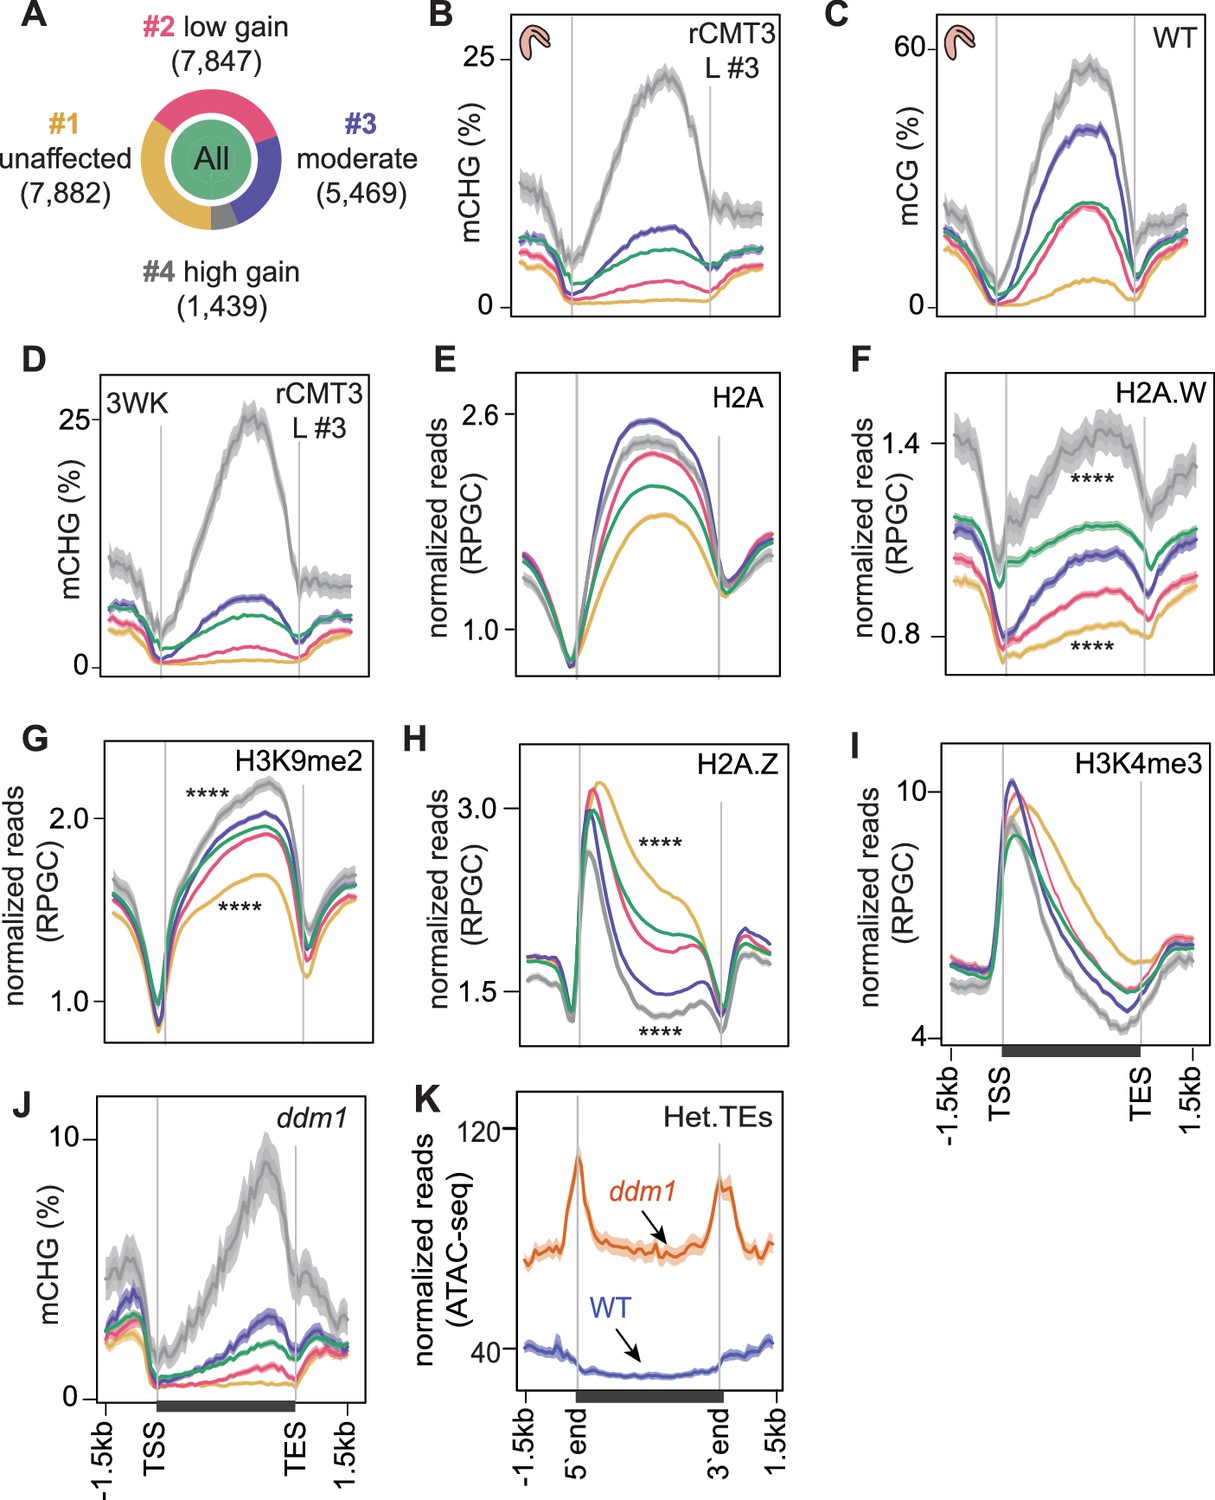
Chromatin features associated with CMT3-induced gene methylation.
(A) Proportion of genes in each cluster partitioned using k-means clustering algorithm based on differences in mCHG between rCMT3 (line #3) and WT embryos. Unaffected genes (yellow), low mCHG gain genes (red), moderate mCHG gain genes (blue), and high mCHG gain genes (gray). Green inner circle represents all expressed genes. (B–D) Metaplots showing mCHG on gene clusters in bent cotyledon embryos from rCMT3 line #3 (L #3) (B), mCG on gene clusters in WT bent cotyledon embryos (C) and mCHG in rCMT3 (L #3) 3-week-old plants (3WK) (D). Shaded ribbons in metaplots represent standard deviations. (E–I) Metaplots showing normalized reads per genomic content (RPGC) average values of histone variant H2A (E), H2A.W (F) (Yelagandula et al., 2014), H3K9me2 (G) (Stroud et al., 2014), H2A.Z (H) (Yelagandula et al., 2014), and H3K4me2 (I) (Maher, 2020). p Values < 0.0001 obtained by Mann-Whitney U test based on differences between genes in cluster 1 or four compared to all genes is represented by ****. (J) Metaplots showing mCHG on gene clusters in seventh generation ddm1 mutants (Stroud et al., 2013). (K) Normalized ATAC-seq reads (Zhong et al., 2021) representing accessibility of heterochromatic TEs (Het.TEs) in WT and ddm1 mutants as defined in Papareddy et al., 2020.
Figure 4—figure supplement 1
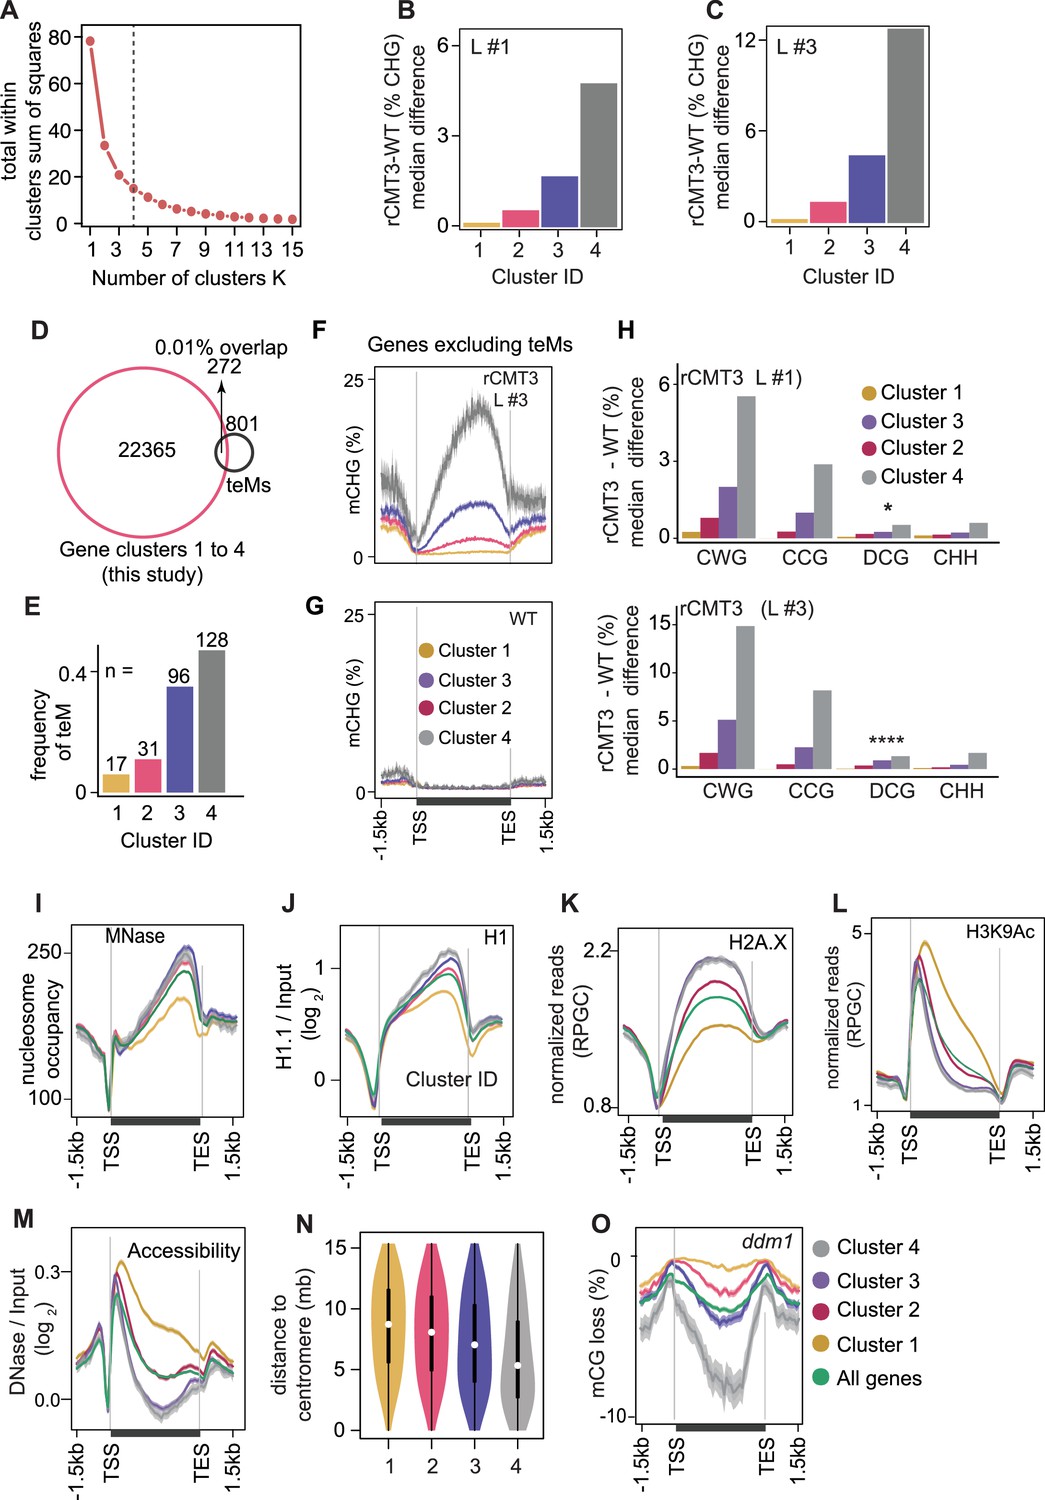
Partitioning of CMT3-induced hypermethylated genes and associated chromatin features.
(A) Determining the optimal K-value based difference in genic mCHG between rCMT3 (Line #3) and wild-type bent cotyledon embryos using the elbow method. Four clusters were selected as optimal because the total within cluster sum of squares (WSS) became marginal after a K value of four. (B and C) Barplots showing median mCHG gain on annotated gene bodies in rCMT3 (Line #1) (B) and rCMT3 (Line #3) (C) compared to wild-type bent cotyledon embryos. (D) Overlap between expressed genes used for K-means clustering in main Figure 4A and all genes classified as teM in Bewick et al., 2016. (E) Number of total intersected teM in each gene cluster. (F-G) Metaplot showing average weighted methylation rate in rCMT3 Line #3 (F) and WT (G) after excluding 272 teM intersecting genes. (H) Barplots illustrating median gain of methylation in rCMT3 (Line #1) (top) and rCMT3 (Line #3) (bottom) compared to wild-type bent cotyledon embryos in various trinucleotide cytosine contexts where W = A or T and D ≠ C. p Values <0.05 and <0.0001 obtained by Mann Whitney U test based on difference in DCG methylation between rCMT3 and WT in bent cotyledon embryos were represented by * and **** respectively. (I-M) Metaplots showing nucleosome occupancy obtained from MNase-seq data (Rutowicz et al., 2019) (I), enrichment of linker histone 1 (H1) on gene clusters (Choi et al.) (J), normalized reads per genomic content (RPGC) average value of histone variant H2A.X (Yelagandula et al., 2014) (K), H3K9Ac (Wang et al., 2019) (L) and DNase-Seq signal on gene clusters representing accessibility (Choi et al.) (M). (N) Violin plot showing distances between genes and centromeres per cluster. White dots indicate the median and vertical black bars indicate 1.5X interquartile ranges. (O) Metaplot of CG methylation in differences in ddm1 compared to WT (Stroud et al., 2013).
Figure 5 with 1 supplement
Impact of CMT3-induced hypermethylation on gene expression.
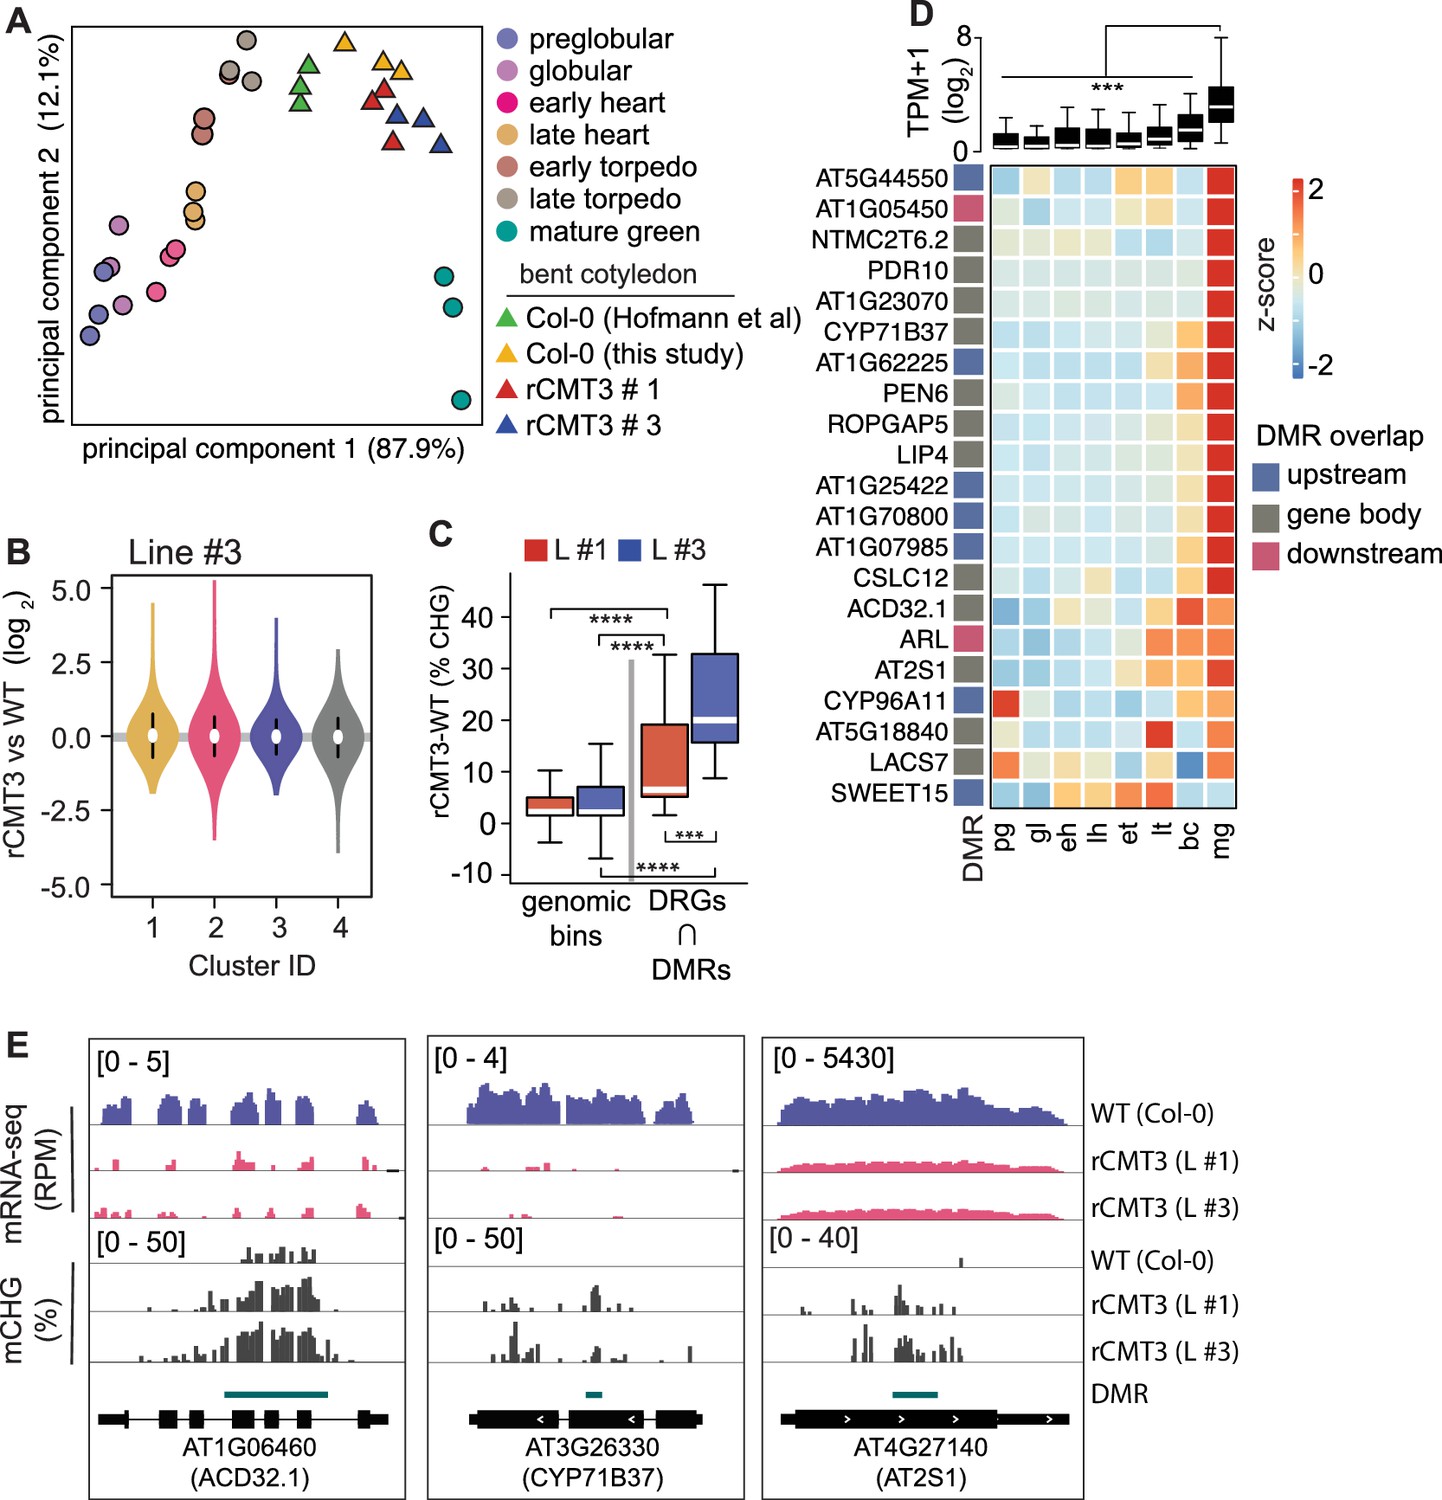
(A) Principal component analysis of mRNA-seq from three biological replicates of rCMT3 and WT (Col-0) bent cotyledon embryos generated in this study along with floral buds, embryos, leaves, from Hofmann et al., 2019 and color-coded according to the key. (B) Violin plot showing transcript fold changes in rCMT3 (line #3) compared to WT (Col-0) bent cotyledon embryos per cluster as defined in Figure 4A. (C) Boxplot showing difference in methylation comparing rCMT3 to WT in down-regulated genes (DRG) intersecting with DMRs and similarly sized genomic bins of 213 bp as controls. p Values < 0.001 and < 0.0001 based on Mann-Whitney U tests are represented by *** and ****, respectively. (D) Boxplot (top) and heatmap (bottom) of transcript levels of DRGs intersecting DMRs during embryogenesis. p Values < 0.001 based on differences in transcript levels between mature green (mg) and all other stages of embryogenesis based on Mann-Whitney U test are represented by ***. (E) Integrative genome viewer (IGV) screenshot of representative downregulated genes associated with DMRs.
Figure 5—figure supplement 1

Additional information regarding the influence of CMT3-induced hypermethylation on gene expression.
(A) Violin plot showing expression fold change in rCMT3 (line #3) compared to WT (Col-0) bent cotyledon embryos per cluster as defined in Figure 4A. (B) Scaled heatmap of differentially expressed genes (DEGs) when rCMT3 bent cotyledon are compared to WT with upregulated (URGs) and downregulated genes (DRGs) shown at the top and bottom, respectively. (C) Three-way Venn diagram showing the proportion of DEGs overlapping with each labelled comparison. (D) Metaplot of difference in CHG methylation in rCMT3 (line #1) (red) or rCMT3 (line #3) (blue) compared to WT for all expressed genes (AEGs, left), downregulated genes (DRGs, middle) and upregulated genes (URGs, right). (E) Venn diagram showing overlap between hyper differentially methylated regions (DMRs) and down regulated genes (DRGs) in rCMT3 compared to WT bent cotyledon embryos. (F) Boxplot showing log2 fold-change (FC) of transcript levels between rCMT3 and Col-0 (WT) for all DRGs intersecting DMRs (top). Heatmap showing fold-change of individual DRGs (bottom). (G) Venn diagram showing overlap between genes rapidly activated at mature green stage (cluster D6 genes based on Hofmann et al., 2019) and 21 DRGs/DMRs.
Figure 6
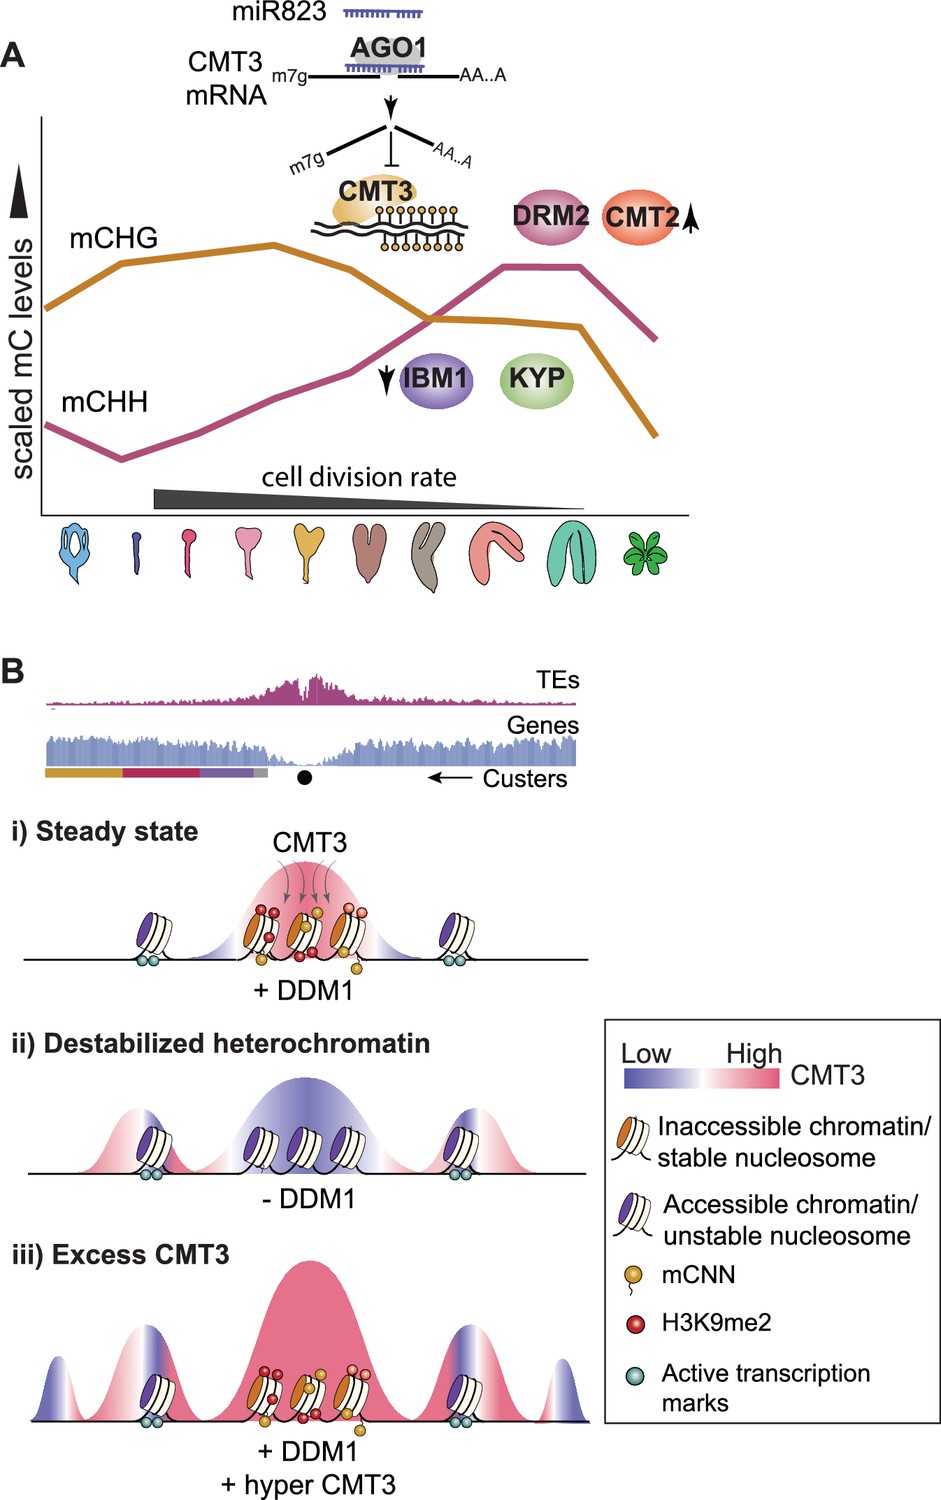
Models for CMT3 regulation during periods of fluctuating cell division rates and destabilized chromatin.
(A) Model of non-CG methylation dynamics during embryo development and corresponding regulatory mechanisms. (B) Model for how CMT3 equilibrium is maintained to restrict its activity to heterochromatin. Density of transposable elements (TEs) (top; red) and genes (middle; blue) on chromosome 1. Cartoon illustration of gene cluster location (bottom) according to key in Figure 4A. Black dot represents the centromere. (i) In steady state, stable nucleosomes along with H3K9me2 and DNA methylation provides positive reinforcement to sequester CMT3 to constitutive heterochromatin. (ii) Loss of DDM1 results in destabilized and accessible heterochromatin (Zhong et al., 2021), characterized by loss of H3K9me2 and stable nucleosomes (Osakabe et al., 2021). Accessible chromatin or DNA without stable nucleosomes is no longer a preferable substrate for CMT3 and results in CHG hypomethylation of TEs. CMT3 will now be readily available and redirected to genic regions where it induces ectopic CHG methylation in proportion to the levels of stable nucleosomes and chromatin marks. (iii) Excess levels of CMT3 causes genome-wide CHG hypermethylation with a preference for stable nucleosomes associated with repressive marks that tend to be in regions closer to centromeres compared to chromosomal arms.
Tables
Key resources table
| Reagent type (species) or resource | Designation | Source or reference | Identifiers | Additional information |
|---|---|---|---|---|
| Gene (Arabidopsis thaliana) | CHROMOMETHYLASE 3 (CMT3) | TAIR | AT1G69770 | |
| Gene (Arabidopsis thaliana) | MICRORNA 823A (MIR823A) | TAIR | AT3G13724 | |
| Genetic reagent (Arabidopsis thaliana) | miR823-cleavable CMT3 (cCMT3) | this paper | pAlligatorR43/promoterCMT3::genomicCMT3 | |
| Genetic reagent (Arabidopsis thaliana) | miR823-resistant CMT3 (rCMT3) | this paper | pAlligatorR43/promoterCMT3::resistantCMT3 (generated from cCMT3 with site-directed mutagenesis) | |
| Recombinant DNA reagent | pAlligatorR43 (plasmid) | DOI:10.7554/eLife.04501 | mCherry selection marker | |
| Recombinant DNA reagent | pHSE401 (plasmid) | Addgene | #62201 | CRISPR/Cas9 plasmid |
| Recombinant DNA reagent | pCBCD-T1T2 (plasmid) | Addgene | #50590 | CRISPR/Cas9 plasmid |
| Strain (Arabidopsis thaliana) | cmt3-11T | NASC | SALK_148381 | T-DNA insertion mutant of CMT3 |
| Strain (Arabidopsis thaliana) | mir823-1 | this paper | miR823 knockout mutant | |
| Strain (Arabidopsis thaliana) | mir823-2 | this paper | miR823 knockout mutant | |
| Commercial kit | Q5 Site-Directed Mutagenesis Kit | New England Biolabs | #E0554S | |
| Commercial kit | Fast SYBR Green Master Mix | Roche | #06402712001 | |
| Commercial kit | SuperScript III Reverse Transcriptase | Thermo Fisher Scientific | #18080093 | |
| Commercial kit | TRIzol | Invitrogen | #15596026 | |
| Software | Lightcycler 96 | Roche Diagnostics | Version 1.1.0.1320 |
Additional files
-
Supplementary file 1
CG differentially methylated regions during development.
- https://cdn.elifesciences.org/articles/69396/elife-69396-supp1-v3.xlsx
-
Supplementary file 2
CHG differentially methylated regions during development.
- https://cdn.elifesciences.org/articles/69396/elife-69396-supp2-v3.xlsx
-
Supplementary file 3
Transcript levels in rCMT3 compared to wild-type embryos.
- https://cdn.elifesciences.org/articles/69396/elife-69396-supp3-v3.xlsx
-
Supplementary file 4
CHG differentially methylated regions in rCMT3 compared to wild type.
- https://cdn.elifesciences.org/articles/69396/elife-69396-supp4-v3.xlsx
-
Supplementary file 5
Oligonucleotides used in this study.
- https://cdn.elifesciences.org/articles/69396/elife-69396-supp5-v3.xlsx
-
Supplementary file 6
MethylC-seq and mRNA-seq mapping statistics.
- https://cdn.elifesciences.org/articles/69396/elife-69396-supp6-v3.xlsx
-
Transparent reporting form
- https://cdn.elifesciences.org/articles/69396/elife-69396-transrepform-v3.docx
Download links
A two-part list of links to download the article, or parts of the article, in various formats.
Downloads (link to download the article as PDF)
Open citations (links to open the citations from this article in various online reference manager services)
Cite this article (links to download the citations from this article in formats compatible with various reference manager tools)
Repression of CHROMOMETHYLASE 3 prevents epigenetic collateral damage in Arabidopsis
eLife 10:e69396.
https://doi.org/10.7554/eLife.69396


