The alpha/B.1.1.7 SARS-CoV-2 variant exhibits significantly higher affinity for ACE-2 and requires lower inoculation doses to cause disease in K18-hACE2 mice
- Recombinant Protein and Antibody Laboratory, Copenhagen University Hospital, Denmark
- Laboratory of Molecular Medicine, Department of Clinical Immunology, Section 7631, Rigshospitalet Copenhagen University Hospital, Denmark
- Novo Nordisk A/S, Denmark
- Department of Biomedicine, Aarhus University, Denmark
- Institute of Immunology and Microbiology, University of Copenhagen, Denmark
- Department of Molecular Medicine, Aarhus University Hospital, Denmark
Figures
Figure 1

Biophysical characterization of recombinant receptor-binding domain (RBD) variants.
(A) Sodium dodecyl sulphate–polyacrylamide gel electrophoresis (SDS–PAGE) total protein stain of RBD variants and angiotensin-converting enzyme-2 (ACE-2). (B) Size-exclusion chromatography (SEC) profiles of the purified proteins run in a BioSep-SEC-S3000 column. Purity was determined by peak integration with the Empower software. (C) Thermal denaturation curves of the RBD wild-type (wt), N439K, and N501Y variants. Data are represented as the first derivative of the intrinsic fluorescence ratio 350:330 nm of the mean of three replicates. Vertical dashed lines represent the inflection temperatures (Ti). Biolayer interferometry (BLI) sensorgrams of RBD wt (D), N439K (E), and N501Y (F) binding to ACE-2-Fc immobilized in anti-human Fc capture (AHC) sensors. ACE-2-immobilized sensors were dipped into 7- to 11-point dilution series of RBD for 500 s, followed by dissociation for another 500 s.
-
Figure 1—source data 1
Accompanying Figure 1.
- https://cdn.elifesciences.org/articles/70002/elife-70002-fig1-data1-v3.pdf
-
Figure 1—source data 2
Accompanying Figure 1.
- https://cdn.elifesciences.org/articles/70002/elife-70002-fig1-data2-v3.pdf
-
Figure 1—source data 3
Accompanying Figure 1.
- https://cdn.elifesciences.org/articles/70002/elife-70002-fig1-data3-v3.xlsx
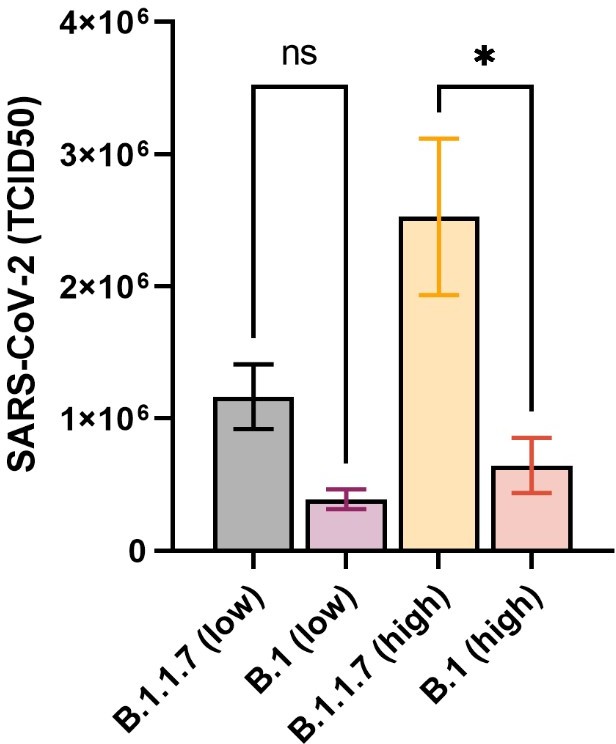
Figure 2
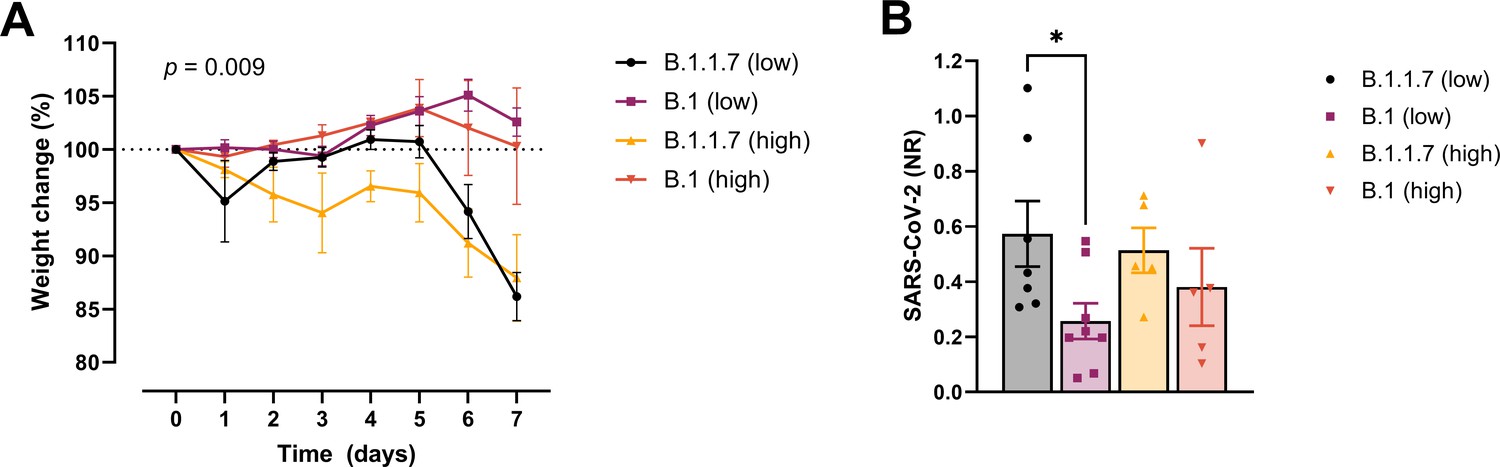
Development of COVID-19-like disease in mice.
(A) Weight evolution of K18-hACE2 mice challenged intranasally with 2.5 × 10³ (low, n = 9 per group) or 2.5 × 10⁴ p.f.u. (high, n = 5 per group) SARS-CoV-2 B.1 (Freiburg isolate, FR-4286) or B.1.1.7. Global differences between the groups were analysed with the Kruskal–Wallis test. (B) Viral load measured in the lungs on day 2 post-infection. The mice were infected with the same doses as described in (A). The expression of SARS-CoV-2 RNA was analysed by real-time quantitative polymerase chain reaction (qPCR). Values normalized to 18S-rRNA are presented as mean ± standard error of the mean (SEM). * = 0.019.
-
Figure 2—source data 1
Accompanying Figure 2.
- https://cdn.elifesciences.org/articles/70002/elife-70002-fig2-data1-v3.xlsx
Figure 3
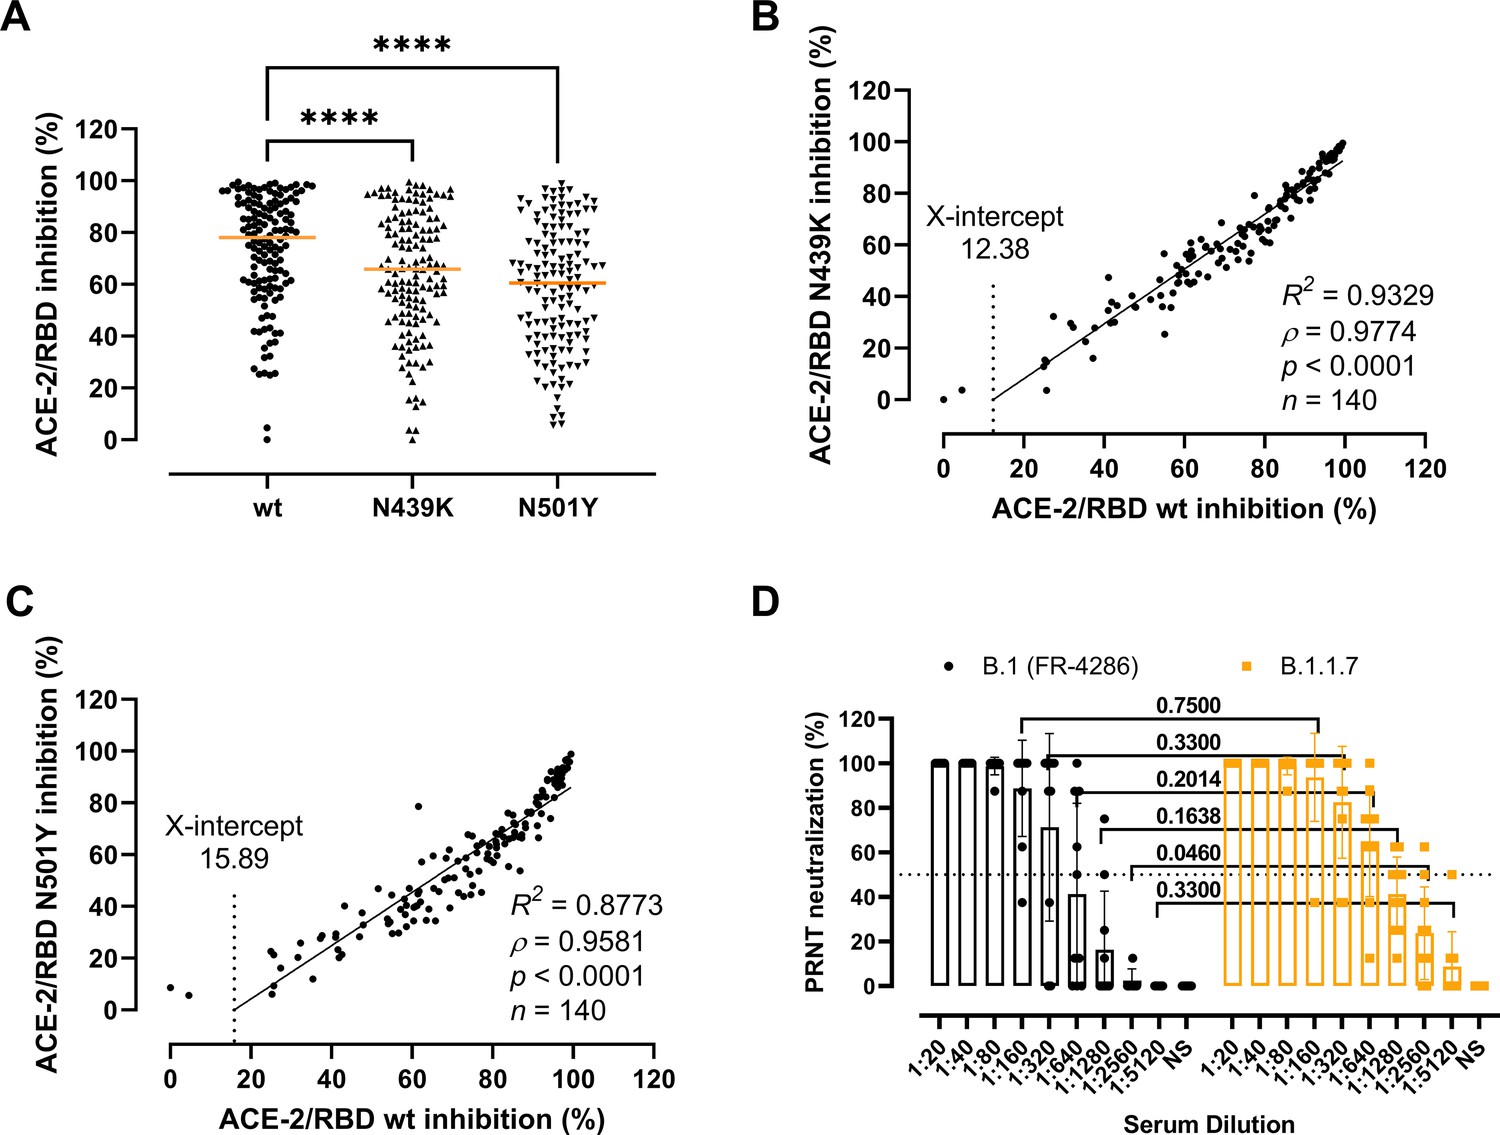
Antibody-mediated inhibition potency of recovered COVID-19 patient sera.
(A) Inhibition of wild-type (wt), N439K, and N501Y receptor-binding domain (RBD) towards angiotensin-converting enzyme-2 (ACE-2) in serum from convalescent COVID-19 individuals (n = 140). Friedman test with Dunn’s multiple comparisons. Orange lines represent medians. ****p < 0.0001. Linear regression and Spearman correlation analyses for N439K vs wt (B) and N501Y vs wt (C). Trend line represents linear regression. (D) Neutralization of serum from convalescent COVID-19 individuals (n = 10) against B.1 and B.1.1.7 calculated by the plaque reduction neutralization test (PRNT) and analysed using Wilcoxon matched-pairs signed ranked tests with multiple comparisons corrections. NS, no serum.
-
Figure 3—source data 1
Accompanying Figure 3.
- https://cdn.elifesciences.org/articles/70002/elife-70002-fig3-data1-v3.xlsx
Figure 4
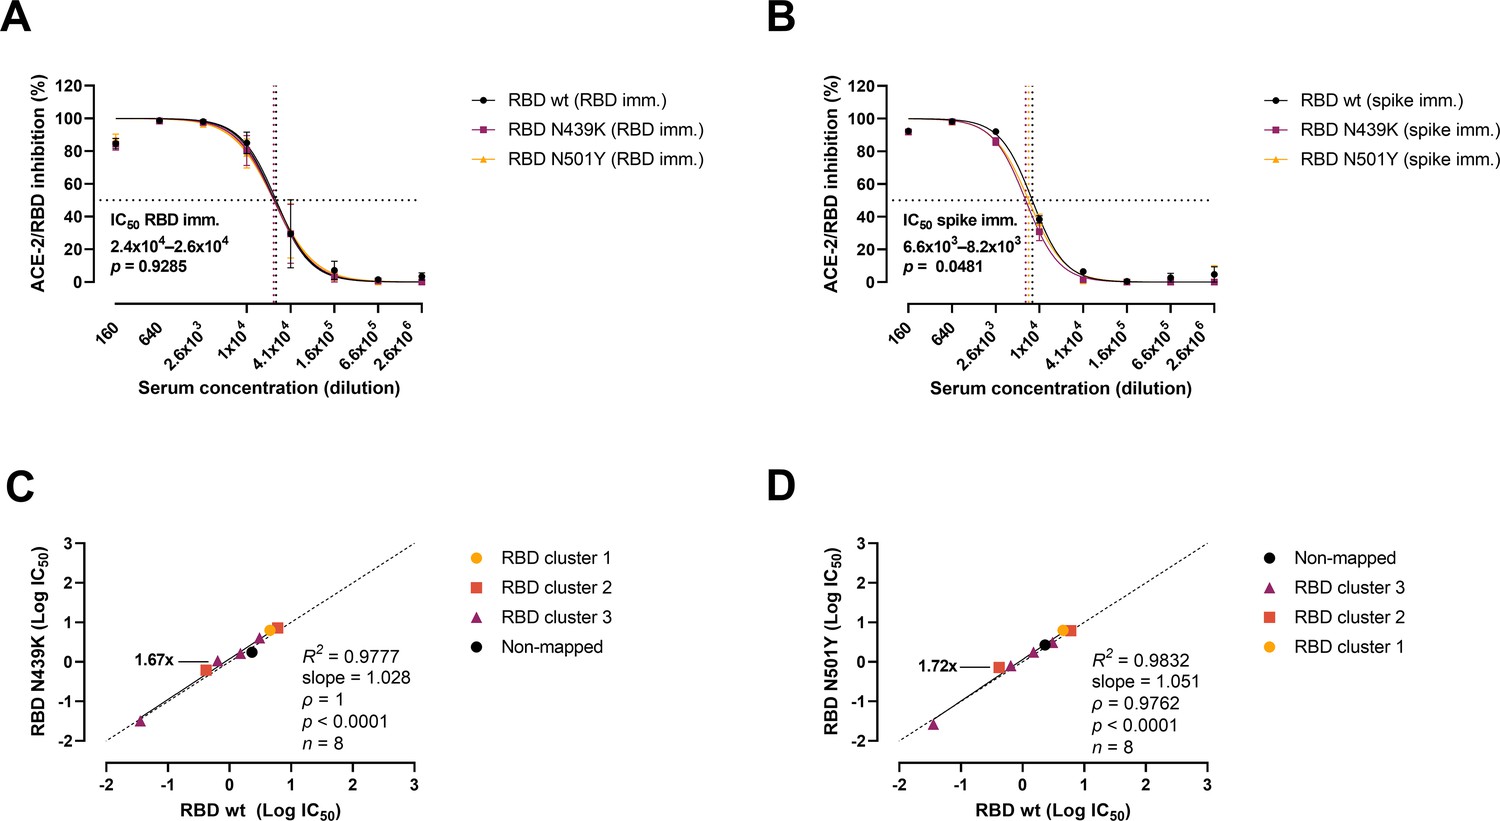
Antibody-mediated inhibition potency of polyclonal sera and monoclonal antibodies (mAbs) isolated from mice immunized against wild-type (wt) receptor-binding domain (RBD) or spike protein.
IC50 comparison of the inhibition of polyclonal mice sera from an animal vaccine model based on RBD (A) or spike (B) challenged with RBD wt, N439K, and N501Y. Connecting lines represent non-linear fits using the equation [inhibitor] vs normalized response with variable slope. Vertical dashed lines delimit the IC50 values, where they intersect the horizontal 50% inhibition dashed line. Data are presented as mean ± standard error of the mean (SEM). Comparison of the inhibition potency (log[IC50]) of mouse mAbs (n = 8) calculated from three independent experiments against RBD wt and RBD N439K (C) or RBD N501Y (D), analysed by linear regression and Spearman correlation. The trend represents a linear regression. Dashed line signals equidistance between axis (i.e. slope 1). Neutralization fold changes over 1.5 are highlighted. Only mAbs with IC50 values within the range of concentrations tested were included in the statistical analyses (i.e. 8 out of 18 tested mAbs).
-
Figure 4—source data 1
Accompanying Figure 4.
- https://cdn.elifesciences.org/articles/70002/elife-70002-fig4-data1-v3.xlsx
Author response image 1
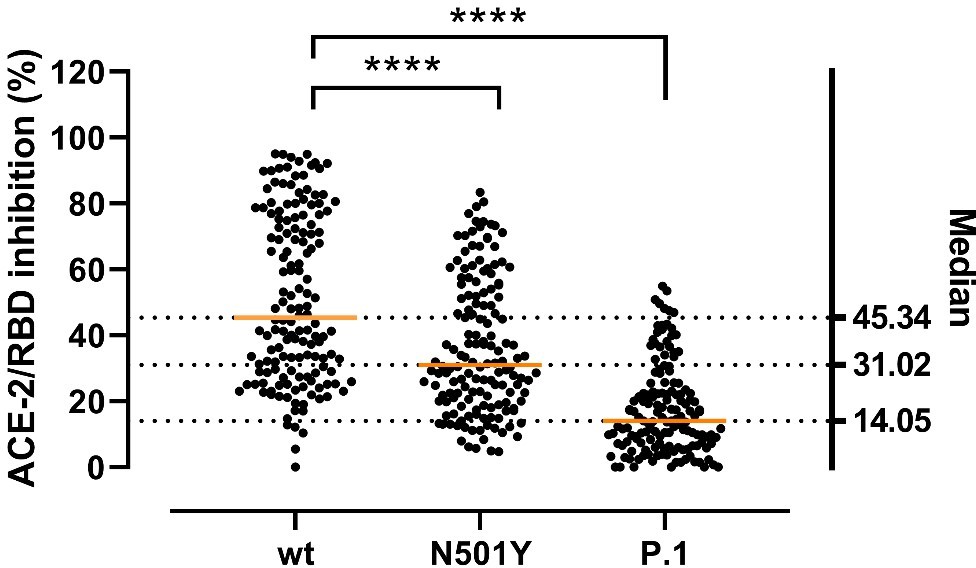
Inhibitory potency of COVID-19 convalescent patient sera against RBD variants.
Antibody-mediated inhibition of serum from recovered COVID-19 patients (n = 150) against RBD wt, N501Y and P.1 (harboring the Y417N, E484K, and N501Y mutations). Statistical comparisons between groups were performed using the Friedman test with Dunn’s multiple comparisons. Orange lines represent medians.
Author response image 2
Additional files
Download links
A two-part list of links to download the article, or parts of the article, in various formats.
Downloads (link to download the article as PDF)
Open citations (links to open the citations from this article in various online reference manager services)
Cite this article (links to download the citations from this article in formats compatible with various reference manager tools)
The alpha/B.1.1.7 SARS-CoV-2 variant exhibits significantly higher affinity for ACE-2 and requires lower inoculation doses to cause disease in K18-hACE2 mice
eLife 10:e70002.
https://doi.org/10.7554/eLife.70002


