MicroRNA-203 represses selection and expansion of oncogenic Hras transformed tumor initiating cells
- University of Colorado, Boulder, United States
- University of Colorado Denver Anschutz Medical Campus, United States
Abstract
In many mouse models of skin cancer, only a few tumors typically form even though many cells competent for tumorigenesis receive the same oncogenic stimuli. These observations suggest an active selection process for tumor-initiating cells. Here, we use quantitative mRNA- and miR-Seq to determine the impact of HrasG12V on the transcriptome of keratinocytes. We discover that microRNA-203 is downregulated by HrasG12V. Using a knockout mouse model, we demonstrate that loss of microRNA-203 promotes selection and expansion of tumor-initiating cells. Conversely, restoration of microRNA-203 using an inducible model potently inhibits proliferation of these cells. We comprehensively identify microRNA-203 targets required for Hras-initiated tumorigenesis. These targets include critical regulators of the Ras pathway and essential genes required for cell division. This study establishes a role for the loss of microRNA-203 in promoting selection and expansion of Hras mutated cells and identifies a mechanism through which microRNA-203 antagonizes Hras-mediated tumorigenesis.
https://doi.org/10.7554/eLife.07004.001eLife digest
DNA mutations occur and accumulate during an individual's lifetime. Often these changes are harmless. But some mutations—called driver mutations—can trigger the formation of tumors. This is often because these mutations allow the cells to grow faster than normal cells. Mutations in genes in the Ras gene family are among the most common driver mutations found in human cancers. These common mutations lead to the uncontrolled activation of genes that are normally tightly controlled, which in turn allows the cells to divide more and live for longer: these are two key features of cancer cells.
So, how are Ras genes and the genes that they control regulated to prevent such dangerous over activation? One mechanism rests on binding sites in their messenger RNA sequence that are recognized by smaller RNA molecules called microRNAs. RNA molecules are created when genes are transcribed. Some RNAs, called messenger RNAs, are then decoded to create proteins. Many other RNAs, including microRNAs, do not code for proteins, but instead bind to many messenger RNA targets, and repress their ability to be decoded into proteins. Three genes, called Hras, Kras, and Nras, are regulated in this way by numerous microRNAs, which together act to dampen the normal activities of these genes.
Riemondy et al. investigate how a cancer-promoting mutation in the Hras gene affects the activities of microRNAs in mouse skin cells in culture. By measuring RNA levels, the experiments reveal that skin cells carrying this mutation produce significantly lower levels of what is normally the most highly produced microRNA in the skin. This microRNA, called microRNA-203, acts to limit the proliferation of skin cells when these cells are dividing rapidly. When the gene encoding microRNA-203 was deleted in mice, the skin cells proliferated more. These mice also developed more skin tumors than normal mice when they were exposed to cancer-causing chemicals. When the gene for microRNA-203 was added into skin cells carrying the Hras mutation and then activated, the cells both divided less and, as a results, grew less. This indicates that microRNA-203 could prevent cancerous cells from expanding in number, a key event in the initiation of tumors.
Riemondy et al. also used a variety of approaches to identify the molecules targeted by microRNA-203 in the skin, and reveal that it targets multiple signaling pathways, including components of the Ras pathway, to suppress cell proliferation. Together, these findings highlight microRNA-203 as a potential source of new treatments to prevent or slow tumor growth in humans.
https://doi.org/10.7554/eLife.07004.002Introduction
Recent efforts in comprehensively sequencing human cancer genomes have confirmed ∼140 protein-coding genes that, when mutated, can drive tumorigenesis (Vogelstein et al., 2013). When genome sequencing data were utilized to construct the history of cancer cells in breast cancer, it was revealed that a considerable amount of ‘molecular time’ exists between the common ancestors that harbor the great majority of driver mutations and the phenotypically identified cancer cells that compose the bulk of the tumor (Nik-Zainal et al., 2012). In support of these observations, lineage tracing experiments conducted in genetically engineered mouse models revealed that only a few clones give rise to tumors whereas a vast majority of mutated cells are unable to sustain tumorigenesis (Driessens et al., 2012; Schepers et al., 2012). These results suggest that even after the acquisition of key driver mutations in the nascent cancer cells, these cells must still undergo continuous evolution and likely clonal selection before developing into clinically apparent tumors. To begin to understand the molecular basis underlying such selection, we examined papilloma formation driven by oncogenic Hras in the skin, a well-characterized model where Hras has been shown to initiate the formation of tumors that clonally evolve (Brown et al., 1986; Driessens et al., 2012; Beck and Blanpain, 2013). Oncogenic Ras mutations are some of the most frequently detected driver mutations in human cancer. Among the three Ras genes (H-, K-, and N-ras), Hras is commonly mutated in tumors originated from stratified epithelial tissues including squamous cell carcinoma in the skin, head, and neck cancer as well as bladder cancer (Bos, 1989; Agrawal et al., 2011; Stransky et al., 2011). Experimental and genomic sequencing studies have revealed that the vast majority of Ras mutations are missense, point mutations at amino acid residues glycine 12 (G12), glycine 13 (G13), or glutamine 61 (Q61) (Bos, 1989). Structural and biochemical studies have further confirmed that all of these mutations generally interfere with the GTP binding pocket and compromise the GTPase activity of Ras proteins. In turn, these mutations lead to uncontrolled activation of downstream effectors including Raf/MEK/ERK and PI(3)K pathways, resulting in sustained cell survival and proliferation observed in human cancers. Because of the prominent role of Ras mutations in human cancer, extensive efforts have been devoted to uncover and subsequently target downstream pathways that are regulated by Ras mutations. However, the immediate impact of Ras mutations on the transcriptome, in particular, with regards to microRNAs (miRNAs) remains unclear.
miRNAs are a class of small, noncoding RNA species that are involved in virtually all biological processes examined in mammals including mouse and human. These regulatory RNA molecules function by repressing the protein producing ability of mRNA targets through destabilization of mRNAs and inhibition of translation (Bartel, 2009). miRNAs typically target a large number of mRNAs in a dosage- and cell context-dependent manner (Mukherji et al., 2011). As prominent proto-oncogenes, Ras mutations have long been recognized to interact with the miRNA pathway. Indeed, Hras, Kras, and Nras all harbor multiple binding sites for the let-7 miRNA, a founding member of miRNAs, in their 3′UTRs (Johnson et al., 2005). Additionally, impaired miRNA biogenesis in the form of Dicer1 disruption has been shown to be a tumor-suppressing mechanism for the development of Kras-induced lung cancer in a mouse model (Kumar et al., 2007). A number of individual miRNAs were also found to function as modifiers for Ras-induced tumorigenesis that include miR-21, -29, and miR-17∼92 as tumor-promoting miRNAs and miR-34, -15/16, and miR-143/145 as tumor-suppressing miRNAs (Kasinski and Slack, 2010; Iorio and Croce, 2012; Mendell and Olson, 2012). Collectively, these seminal studies demonstrate unequivocally that the miRNA pathway and individual miRNAs play important roles in Ras-induced tumorigenesis. However, it is unclear how Ras mutations, usually the tumor-initiating drivers, directly alter the landscape of miRNA expression during tumorigenesis. Importantly, it is also unknown whether the changes in miRNA expression play a role in the selection of oncogenic Ras-transformed cells during tumor initiation. Finally, the lack of a comprehensive survey of high-confidence miRNA targets that may play a role downstream of Ras mutations hinders our mechanistic understanding and limits the potential to develop miRNA-based therapeutics.
In this study, we utilized our recently improved quantitative miR-Seq techniques to examine the impact of an oncogenic Hras mutation (HrasG12V) on both mRNA and miRNA expression. We discovered that miR-203, the most highly expressed miRNA in the skin (Yi et al., 2008; Jackson et al., 2013), is downregulated by HrasG12V. Using both knockout (KO) and inducible models, we provide evidence for an important role of miR-203 in restricting expansion of oncogenic Hras-transformed cells in vitro and in vivo. We comprehensively surveyed skin-specific targets of miR-203 and identified a number of novel targets that have important implications for Hras-mediated tumorigenesis. Our results suggest that miR-203 plays a tumor-suppressing role in inhibiting selection and expansion of tumor-initiating cells early in tumor development.
Results
HrasG12V profoundly deregulates the mRNA and miRNA transcriptome in the skin
Oncogenic mutation of the Hras gene is one of the initiating drivers in the development of benign papillomas and malignant squamous cell carcinomas in murine skin chemical carcinogenesis. However, the molecular consequences defining the cellular changes that accompany expansion of oncogenic Hras-transformed keratinocytes to initiate papillomas remain elusive. We first investigated the consequences of HrasG12V activation on the mRNA transcriptome using a modified form of PolyA+ RNA-Seq, known as 3P-Seq, or 3seq (Figure 1A–C). Compared to traditional RNA-Seq, 3Seq allows both quantification of mRNA transcripts and detection of changes in alternative 3′ UTR formation (Wang et al., 2013). To examine the immediate impact of HrasG12V on primary skin cells, we used primary keratinocytes isolated from newborn skin and performed 3Seq after HrasG12V transduction. We did not observe widespread shortening or alternative formation of 3′UTRs, which are often ascribed to oncogenic transformation when comparing tumor cell lines to normal cells (data not shown). This is similar to our previous observation that alternative 3′UTR usage is infrequent within the skin lineages (Wang et al., 2013). Over 1100 transcripts were differently expressed (two-fold change and FDR <0.05) in keratinocytes expressing HrasG12V, compared to the control (Figure 1C and Figure 1—source data 1). Gene ontology functional analysis revealed profound deregulation in three core processes by HrasG12V: activation of cellular migration, upregulation of pro-angiogenic pathways, and suppression of the terminal differentiation program (Figure 1D). All of these three processes are identified as hallmarks of human cancer (Hanahan and Weinberg, 2011). The observed widespread changes in the transcriptome also endorse the driver role of HrasG12V in skin tumorigenesis. Importantly, transcripts upregulated by HrasG12V in our primary keratinocytes strongly and significantly overlapped with the putative cancer stem cell signatures obtained from murine squamous cell carcinoma (SCC) models (Schober and Fuchs, 2011). In addition, transcripts upregulated by HrasG12V significantly overlapped with transcripts known to be targets of the c-Fos transcription factor in a genetic model of SCC (Durchdewald et al., 2008). Furthermore, known core components of the Hras signaling pathway were also among the differentially detected genes (Bild et al., 2006) (Figure 1E). These transcriptome data indicate that we have captured the initiating changes induced by oncogenic Hras in the keratinocytes.
Figure 1
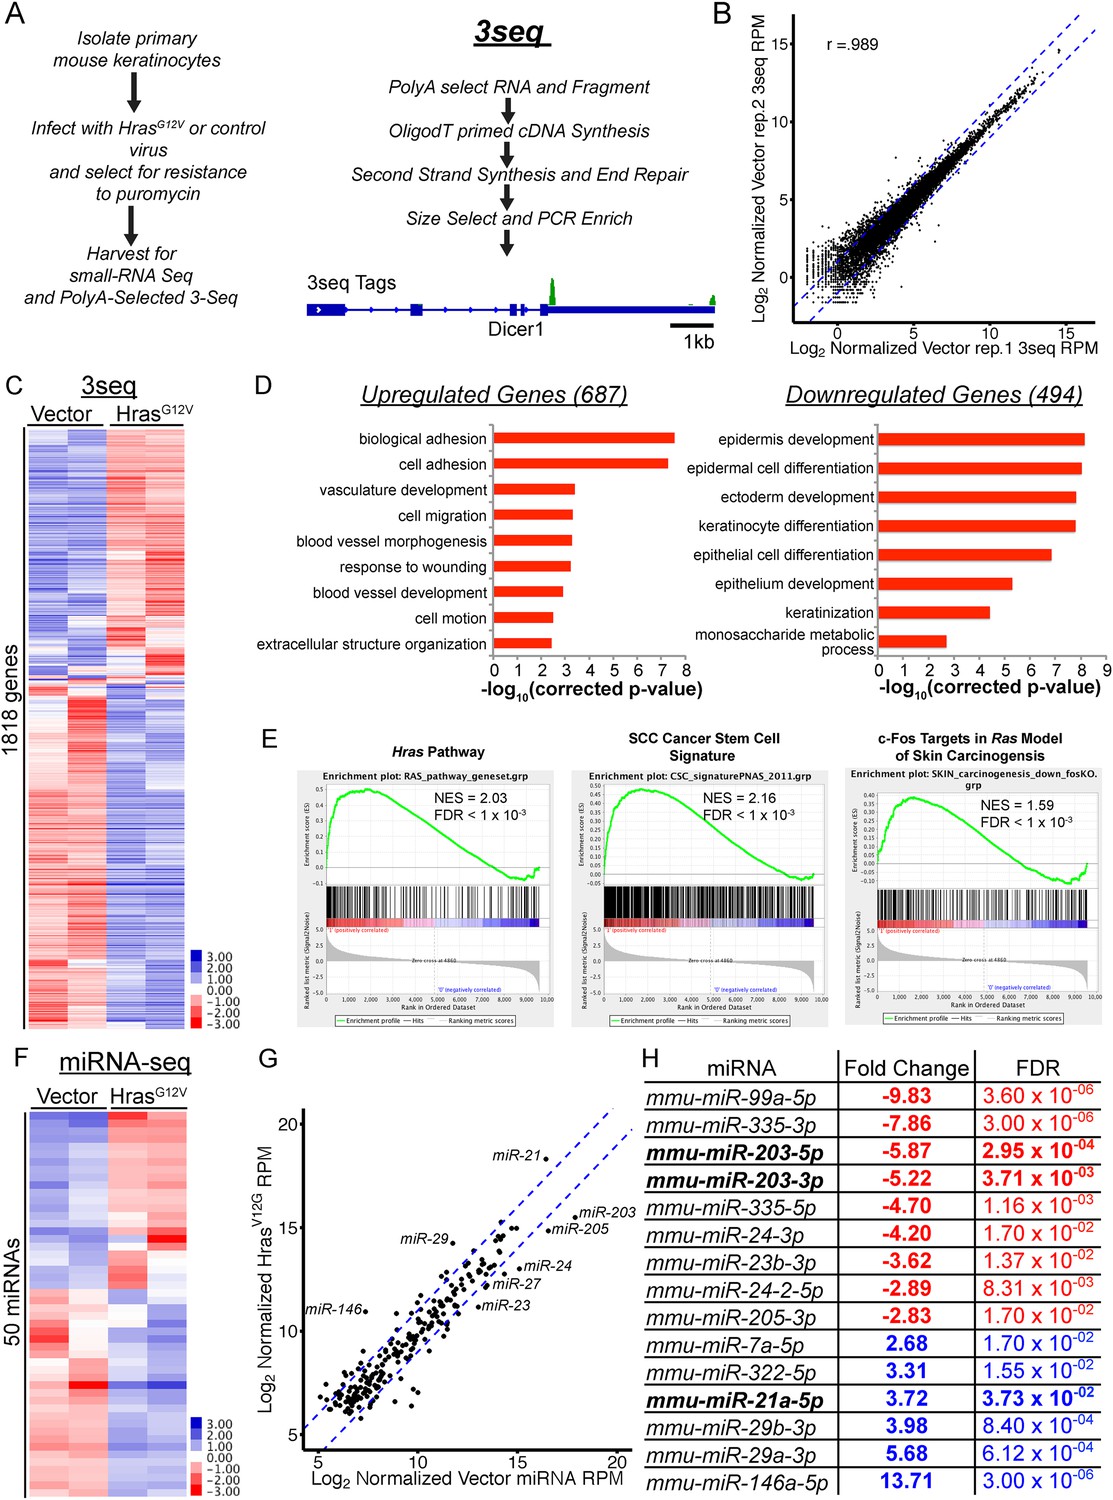
Genome-wide profiling of the oncogenic HrasG12V-transformed miRNA and mRNA transcriptome in primary keratinocytes.
(A) Schematic of experimental approach to identify deregulated mRNA and miRNA networks driven by oncogenic HrasG12V using small-RNA Seq and 3Seq. The 3seq library preparation allows quantitative definition of poly-A+ RNA 3′ends and expression levels. (B) 3Seq reproducibly detects mRNA expression levels over 4 orders of magnitude. Pearson correlation coefficient displayed (C) unsupervised hierarchical clustering of log-transformed mean-centered mRNA expression levels for all transcripts deregulated twofold by oncogenic HrasG12V (n = 2 libraries per condition) (D) Gene Ontology analysis of transcripts up and downregulated by HrasG12V (twofold change FDR <0.05) indicates enrichment for migratory and angiogenic processes, and suppression of keratinocyte differentiation. (E) GSEA analysis of selected genesets relevant to skin carcinogenesis. (F) Unsupervised hierarchical clustering of log-transformed mean-centered miRNA expression levels for all transcripts deregulated twofold by oncogenic HrasG12V (n = 2 libraries per condition) (G, H) Abundant miRNAs such as miR-203, miR-205, and miR-21 are strongly deregulated by oncogenic Ras.
-
Figure 1—source data 1
Log2 fold changes for transcripts up or down regulated twofold with FDR <0.05 in HrasG12V-transformed keratinocytes.
- https://doi.org/10.7554/eLife.07004.004
To define the impact of the oncogenic Hras on the landscape of miRNA, we applied our recently developed, quantitative miRNA-Seq (Zhang et al., 2013) to HrasG12V-transformed keratinocytes. Overall, we detected 15 differentially expressed miRNAs upon HrasG12V expression (FDR <0.05, two-fold change) (Figure 1F–H). Two key patterns emerged in these profiles. First, the epithelial tissue-specific miRNAs, miR-203 and miR-205, which represent the most abundant miRNAs expressed in murine skin and primary keratinocytes were strongly suppressed by HrasG12V. Additionally, members of the abundantly expressed, miR-23/24/27 miRNA cluster were also downregulated by HrasG12V. Secondly, miR-21 was strongly induced becoming the most highly expressed miRNA, consistent with its direct activation by oncogenic Ras reported in other systems (Talotta et al., 2009). The upregulation of miR-21 is also consistent with its well-appreciated oncogenic function in skin cancer (Darido et al., 2011). miR-146 was also induced by HrasG12V. However, this miRNA is expressed 2-orders of magnitude lower than miR-21, suggesting that its upregulation may have limited contribution to Hras-initiated tumorigenesis at this early stage.
We further measured mature miR-21, miR-203, and miR-205 RNAs by qPCR. In support of the quantitative performance of our miR-Seq, the differential expression of all three miRNAs measured by qPCR was nearly identical to the quantification by our miR-Seq (Figure 2A,B). To initially probe the mechanism through which HRASG12V suppresses miR-203 expression, we examined the level of miR-203 primary transcripts. We previously characterized the transcribed genomic region of miR-203 including the promoter region and transcription start site (Jackson et al., 2013). Because the primary transcript of miR-203 harbors a polyadenylation [Poly(A)] signal and generates a Poly(A) tail, we directly quantified the abundance of the primary transcripts by counting the 3′end reads of the primary miRNA obtained by 3seq (Figure 2C). This result was further confirmed by qPCR measurement specific to the pri-miR-203 (Figure 2D). The degree of downregulation for both mature and primary miR-203 transcripts was similar as judged by these two independent assays. Collectively, we conclude that the repression of miR-203 by HrasG12V is most likely mediated by suppressing the production of primary miR-203 transcripts at an early stage of oncogenic cellular transformation.
Figure 2
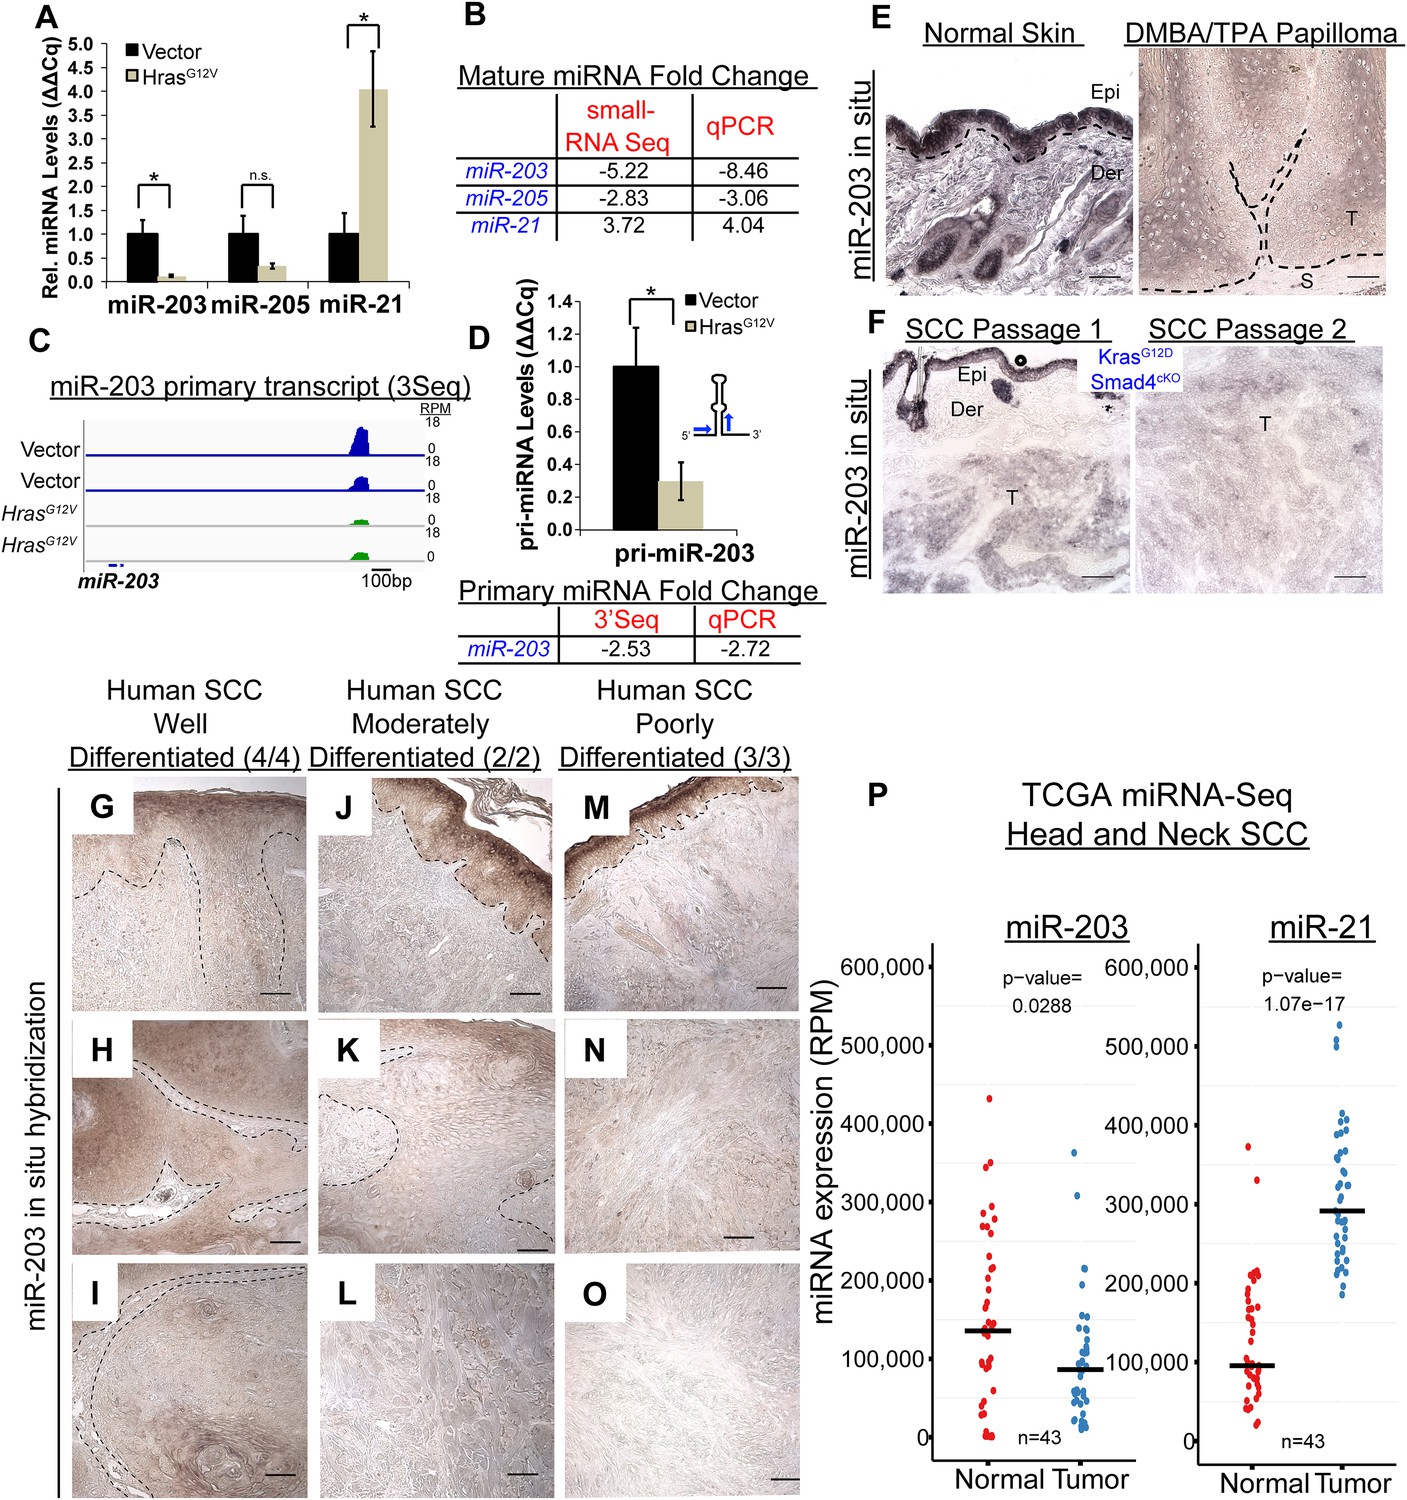
miR-203 is strongly suppressed in mouse and human SCCs.
(A, B) qPCR and small-RNA-Seq independently validate downregulation of miR-203 and upregulation of miR-21 driven by oncogenic HrasG12V (n = 3 biological rep. qPCR, n = 2 small-RNA-Seq, mean ± SEM displayed, *p < 0.05, Student's t-test two-sided). (C) Gene track and quantification the 3′end of the miR-203 primary transcript based on 3Seq. (D) miR-203 primary transcript detection by qPCR (n = 3 biological replicates, Mean ± SEM displayed, *p < 0.05, ns = non-significant, Student's t-test two-sided). (E) miR-203 is downregulated in DMBA/TPA produced papillomas compared to normal adjacent tissue. Epi = epidermis, Der = dermis, T = tumor, and S = stroma. The black lines denote the epidermal/dermal and tumor/stroma boundary (F) miR-203 is downregulated in malignant SCCs derived from KrasG12D/Smad4cKO and passaged in immunocompromised mice. (G–O) Reduced miR-203 expression is correlated with increasing malignancy in human skin SCC cancers. Panels G, J, M were taken from regions with more histologically normal regions to demonstrate successful miR-203 hybridization. (P) miRNA-Seq quantification from patient matched normal and tumor tissue obtained from the TCGA consortium data (bar indicates mean value, Student's t-test two-sided). Scale bar = 50 μm.
miR-203 silencing is an early event in mouse and human SCC
Our data revealed the early silencing of miR-203 by oncogenic Hras in an in vitro model. We further investigated miR-203 expression with in situ hybridization during skin tumorigenesis in vivo. In classic chemical carcinogenesis models initiated by DMBA/TPA treatment of mouse skin, Hras is preferentially mutated, which compromises the GTPase activity and results in constitutive Hras activation. Mutating Hras at Q61 leads to papilloma development and infrequent malignant transformation to SCCs (Abel et al., 2009). We first examined miR-203 expression in benign papillomas. Consistent with our in vitro results, miR-203 expression was absent from epithelial compartments adjacent to tumor stroma, the region where putative cancer stem cells reside. Although we also observed moderately expressed miR-203 in tumor regions with evidence of cellular differentiation (keratin pearls and large differentiated morphology), the levels of miR-203 was considerably lower in these regions compared to the suprabasal cells of adjacent normal skin, where miR-203 is normally expressed (Figure 2E). Overall, miR-203 expression levels were strongly reduced in tumor tissues compared to adjacent epidermal regions. In an independent mouse model of SCC, we also found that miR-203 expression was gradually lost in a KrasG12D/Smad4cKO model where skin tumors progressed to invasive SCC through serial passages of tumors (White et al., 2013) (Figure 2F). Taken together, these results demonstrate that miR-203 is significantly downregulated at both early and late stages of papilloma and SCC formation in mouse models.
To evaluate the relevance of the loss of miR-203 in human skin cancer, we examined 9 tumor samples obtained from patients with the early, middle, and late stages of skin cancer. In these human skin SCC samples, miR-203 was already downregulated at the onset of tumorigenesis and progressively lost during the course of tumor progression, similar to the pattern observed in the mouse models. In the poorly differentiated SCC samples, the miR-203 signal was completely absent, yet readily detectable in surrounding hyperplastic or normal epidermal regions (Figure 2G–O). In addition, we mined publically available data sets from The Cancer Genome Atlas (TCGA) and detected a significant reduction in miR-203 and an elevation of miR-21 in head and neck SCC samples compared to patient-matched normal tissues (Figure 2P). Altogether, these results corroborate our observations in mouse models and validate the strong correlation between the loss of miR-203 and the development of skin cancer at multiple stages of tumorigenesis. These expression analyses suggest that the loss of miR-203 coincides with the tumor-initiating events and miR-203 might function as a tumor-suppressing mechanism in skin cancer.
Genetic deletion of miR-203 impacts early epidermal development in mouse
We then generated a conditional KO mouse model to assess the function of miR-203 in murine skin development and carcinogenesis in vivo. We have characterized the genomic locus of miR-203 and determined that miR-203 is located in an intergenic region, 3.3 kbp downstream from the Asp gene and 15.3 kbp upstream of the Kif26a gene (Figure 3—figure supplement 1). Two loxP sites were inserted to flank the miR-203 hairpin (Figure 3A). miR-203 was deleted by first mating miR-203fl/fl mice with Actb-Flpe mice to remove the Neo cassette, followed by breeding with EIIa-Cre or Krt14-Cre mice, resulting in complete miR-203 loss from all tissues or only from skin tissues, respectively. In both cases, ablation of miR-203 was confirmed by qPCR on isolated epidermis and in situ hybridization (Figure 3B,C). We previously demonstrated that expression of miR-203 was largely restricted to stratified epithelial tissues. Within the skin, the differentiated skin lineages express miR-203 ∼10-fold higher than the stem/progenitor lineages. Consistent with this observation, there are no discernible differences between constitutive miR-203 null (miR-203−/−) mice and skin-specific cKO (Krt14-Cre/miR-203fl/fl) mice. Both strains were born at the expected Mendelian ratio. They also showed no signs of gross developmental defects as adults (Figure 3D). For all subsequent studies, we used miR-203−/−, which was maintained in the C57BL/6 background.
miR-203 is highly expressed primarily in stratified epithelial tissues, such as the epidermis, tongue, esophagus, and cervix, yet poorly expressed or absent in other tissues such as the small intestine, bladder, lung, kidney, liver, or brain (Figure 3—figure supplement 2). Because miR-203 begins to be expressed by E13 when the epidermis begins to stratify, we examined the proliferation rate and thickness of embryonic skin from E16 to P4. At E16, we observed a mild increase in cell proliferation in the KO, as measured by BrdU incorporation (Figure 3E,F). Although the difference in BrdU incorporation did not achieve statistical significance (p = 0.07), the thickness of the KO epidermis was significantly increased, compared to WT littermates (p = 0.03). Interestingly, the increase in epidermal thickness was most prominent at early stages (E16 and E17) and waned as skin development progressed (P4) (Figure 3G). At P4, miR-203−/− mice displayed normal histological development of the epidermis and hair follicles, and the difference in proliferation and epidermal thickness between KO and WT became indistinguishable (Figure 3G). In addition, we found no evidence of perturbed differentiation in miR-203−/− mice based upon analysis of early and late epidermal differentiation markers, Keratin 1 and Loricrin, for the spinous and granular layers, respectively (Figure 3H,I). Together, these results provide evidence that miR-203 limits cell division when the proliferation rate is high during early embryonic skin development but not at later stages when the proliferation rate wanes.
Figure 3 with 2 supplements see all
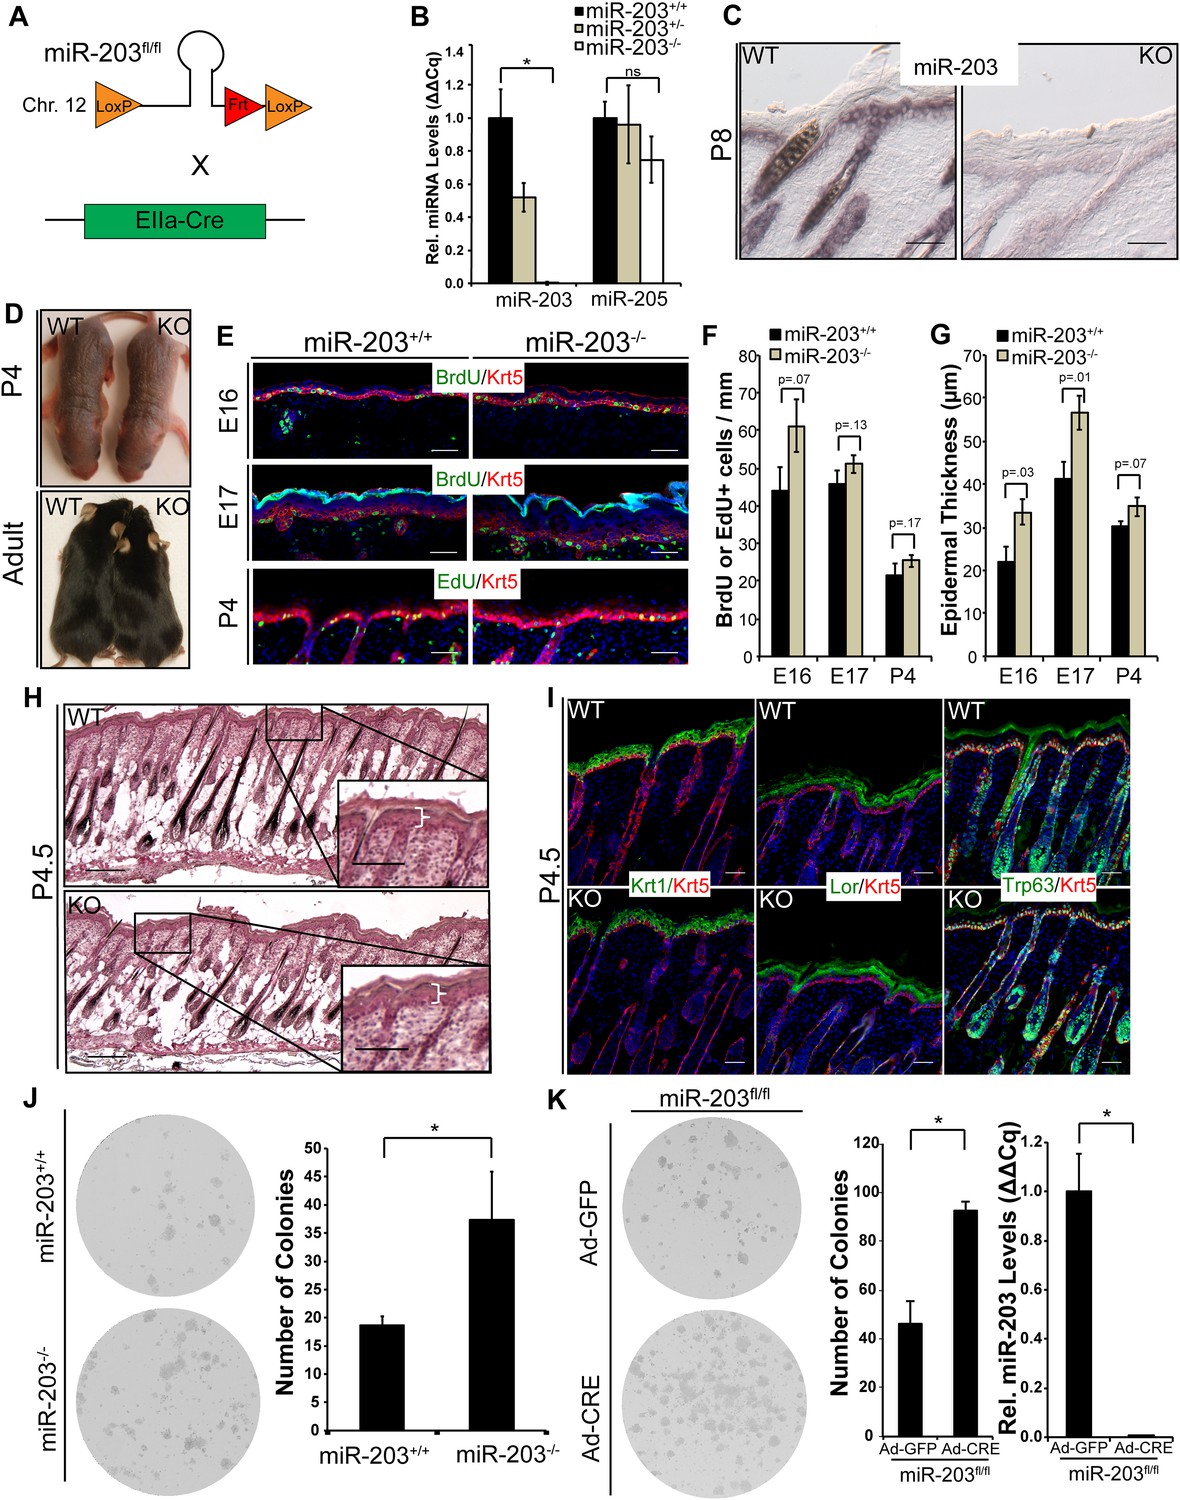
Loss of miR-203 modestly impairs embryonic epidermal development.
(A) Schematic of miR-203 conditional allele generation and knockout strategy. (B) Validation of miR-203 ablation by qPCR from isolated epidermal samples (n = 3 biological replicates, * p < 0.05, ns = non-significant, Student's t-test two-sided). (C) Validation of miR-203 ablation within the epidermis by in situ hybridization (Scale bar = 50 μm). (D) miR-203 knockout mice are visibly indistinguishable from wild-type counterparts. (E–G) miR-203 ablation results in mild epidermal hyperplasia during embryonic development. (n = 3 E16, n = 4 E17, and n = 3 p4 animals, p-value provided in figure, Student's t-test one-sided). (H) Representative hematotoxylin and eosin image from p4.5 animals, demonstrating restored normal skin morphology in neonatal animals. (Scale bars = 50 μm for inset and 100 μm for main images) (I) Epidermal differentiation is not compromised by loss of miR-203. (Scale bars = 50 μm) (J) miR-203−/− primary keratinocytes are more clonogenic than wild-type counterparts (representative results from 3 experiments, *p < 0.05, Student's t-test two-sided). (K) Conditional ablation of miR-203 from passaged miR-203fl/fl keratinocytes results in higher clonogenicity (representative results from n = 3 independent experiments, mean ± standard deviation displayed, *p < 0.05, Student's t-test, two-sided).
We noted that the impact of miR-203 loss was correlated with the rate of cell proliferation. To further test whether miR-203 functions to restrict the expansion of highly proliferative cells, we investigated the roles for miR-203 in regulation of primary and established keratinocyte cell lines, respectively. We observed ∼two-fold higher colony-forming capacity of miR-203−/− keratinocytes, compared to the WT controls (Figure 3J). To further confirm the ability of miR-203 to suppress cell proliferation cell-autonomously, we generated a miR-203fl/fl keratinocyte cell line. By treating these cells with an adenoviral vector to express Cre (Ad-Cre), we determined that within 48 hr of Ad-Cre exposure miR-203 was completely depleted (<1% remaining as measured by qPCR). We again observed a similar, ∼two-fold higher colony-forming capacity by the Ad-Cre-treated miR-203fl/fl cells compared to the Ad-GFP-treated control cells (Figure 3K). In both cases, although we detected some slightly larger clones with more cells formed by the miR-203 null keratinocytes, the biggest differences were the significantly increased number of clones formed by the miR-203 null cells. These results suggest that miR-203 limits the clonogenicity of normal keratinocytes. When miR-203 is deleted, more cells are likely to become clonogenic.
Loss of miR-203 enhances chemical carcinogenesis in the skin
We determined that the loss of miR-203 is an early event in the initiation and development of both mouse and human skin SCCs. Furthermore, genetic deletion of miR-203 confers ∼two-fold higher colony-forming ability on primary keratinocytes. Because oncogenic Hras is a potent driver for tumorigenesis in the skin and our miR-seq data revealed a rapid and strong repression of miR-203 by HrasG12V, these observations prompted us to investigate whether the loss of miR-203 plays a role in skin carcinogenesis. We subjected WT and miR-203 null mice to two-stage chemical DMBA/TPA carcinogenesis (Figure 4A). The chemical carcinogenesis experiments were terminated at week 21 when tumor burden had reached a maximum. Because our mice were generated in the C57BL/6 background and these mice are known to be resistant to two-stage chemical carcinogenesis (Abel et al., 2009), all tumors generated in our mice were papillomas with no evidence for malignant conversion to squamous cell carcinomas during the time frame of our study. Nevertheless, we examined the temporal and numeric characteristics of tumor formation in our mice for the role of miR-203 in tumor initiation. During the course of carcinogenesis, we observed a slightly earlier tumor formation pattern on the backskin of miR-203 null animals (Figure 4B). Furthermore, miR-203 null animals developed ∼2.5-fold more tumors, when compared to WT control animals (Figure 4B). Measurement of tumor sizes at week 17 showed no statistically significant difference in tumor sizes between genotypes although miR-203 null animals were more susceptible to tumor formation (Figure 4C). These results suggest that loss of miR-203 increases the number of tumor-initiating cells but does not significantly alter the type of tumors for example, conferring tumors with more aggressive phenotypes.
Figure 4 with 1 supplement see all

Loss of miR-203 sensitizes mice to DMBA/TPA skin carcinogenesis.
(A) Representative images of tumors that were formed in the skin of WT and miR-203 null mice treated with DMBA/TPA. (B) miR-203−/− mice have a larger tumor burden than miR-203+/+ counterparts (n = 6 and 7 miR-203+/+ and miR-203−/− animals respectively, mean ± SEM displayed, £ = p < 0.05, Whitney–Mann U-test one-sided). (C) miR-203−/− tumor size distribution is similar to wild-type animals (ns = non-significant, Student's t-test two sided, median displayed as bar). (D, E) miR-203+/+ and miR-203−/− papillomas display similar morphologies and histology. (F) Proliferation and differentiation dynamics are similar between miR-203+/+ and miR-203−/− tumors. (Scale bars = 50 μm).
Hematoxylin and Eosin staining revealed that the papillomas produced had similar morphology, displaying exophytic lesions with evidence for squamous differentiation (Figure 4D,E). Assessment of proliferation (Ki67), differentiation markers (Krt1, Lor) revealed similar dynamics between miR-203+/+ and miR-203−/− tumors (Figure 4F). To further probe the mechanistic differences between miR-203 WT and KO tumors, we assessed the mutation spectra of these tumors and found that they possess the canonical HrasQ61L mutation at similar frequencies, 80% and 85.7% for WT and KO tumors, respectively (Figure 4—figure supplement 1). Taken together, these results provide direct evidence for miR-203's tumor suppressing roles at the stage of tumor initiation in the classic DMBA/TPA tumorigenic model.
miR-203 represses clonal selection of oncogenic Hras-transformed cells in vitro
To further probe miR-203's role in clonal selection, we infected miR-203 WT and null primary keratinocytes with pBabe-HrasG12V. At the passage 1, the loss of miR-203 led to ∼40% increase in colony-forming capacity immediately after the initial plating (Figure 5A). When we passaged the HrasG12V transduced cells, we began to observe reduced numbers of colonies that were formed by both the WT and null cells (Figure 5A). This was likely due to oncogenic stress caused by HrasG12V induction. Strikingly, in contrast to the WT cells that generally formed smaller colonies in subsequent passages, the miR-203 null cells generated more and bigger clones compared to WT control cells at each passage (Figure 5A). Collectively, the serial passage assay supported the enhanced selection of tumor-initiating cells in the absence of miR-203 upon oncogenic Hras induction.
Figure 5
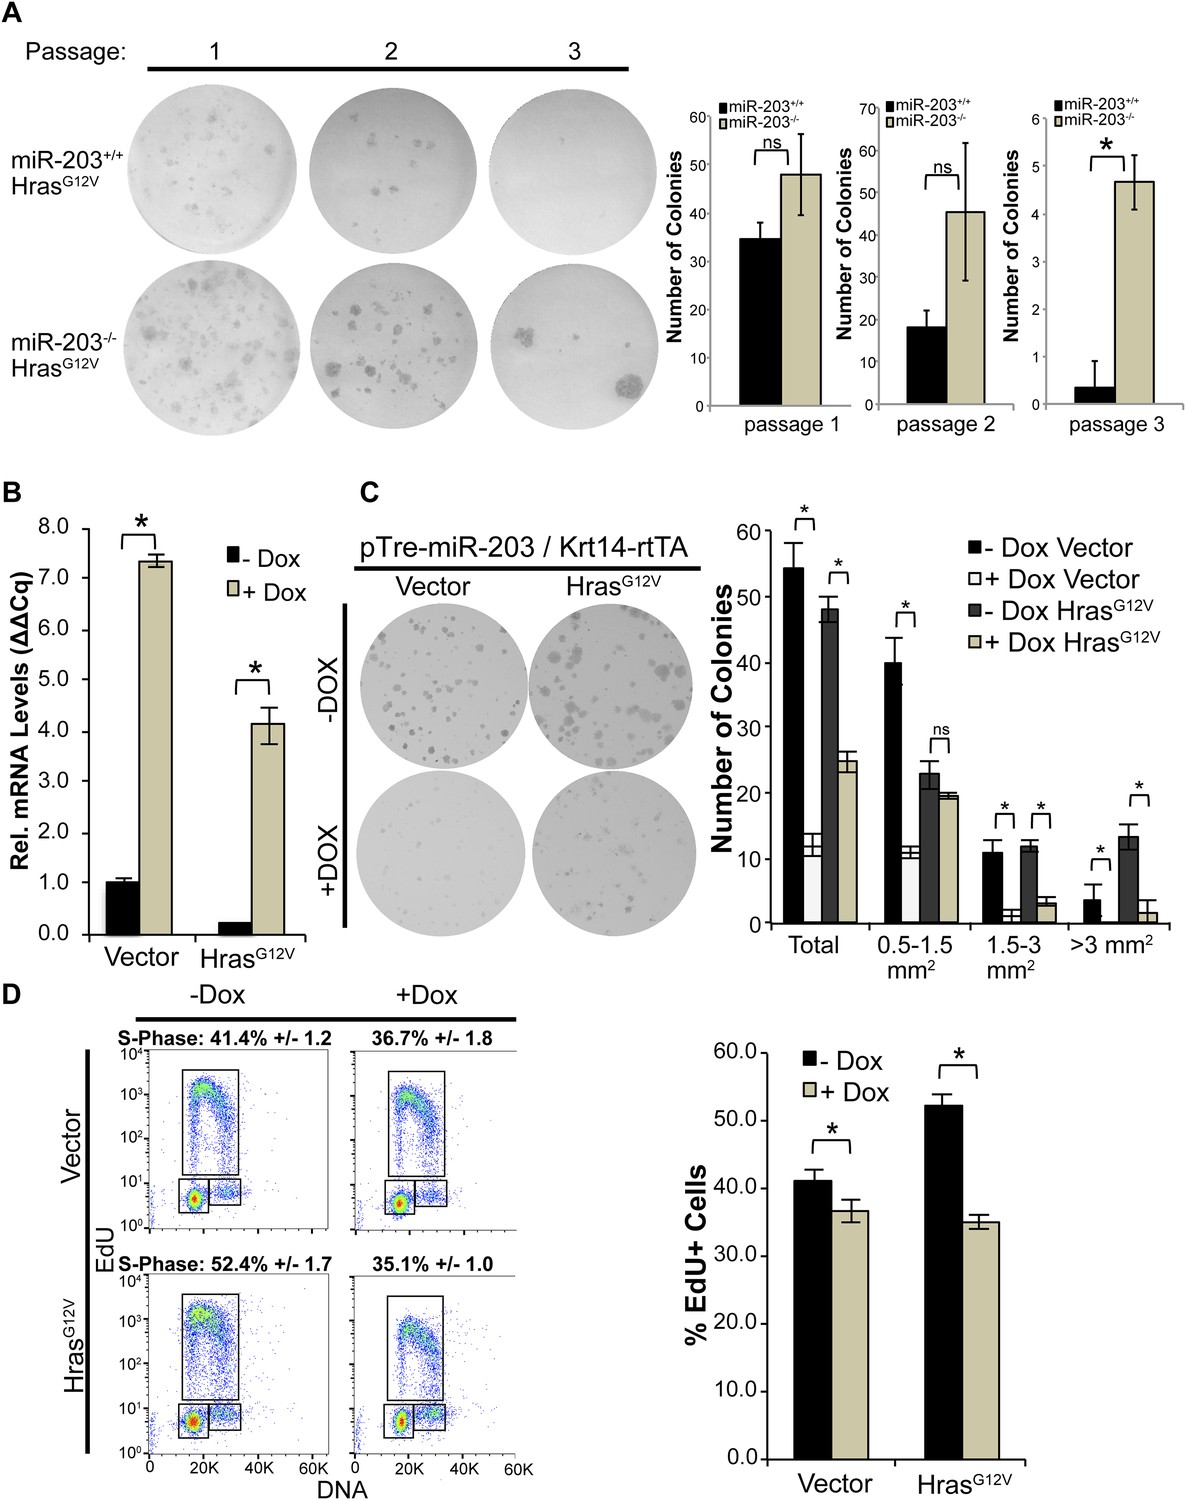
miR-203 antagonizes HrasG12V-driven keratinocyte proliferation.
(A) HrasG12V transduced miR-203−/− primary cultures are more colonogenic upon serial passage than wild-type controls (representative of n = 2 independent experiments, mean ± standard deviation displayed. *p < 0.05, ns = non-significant, Student's t-test two-sided). (B) qPCR of miR-203 induction upon addition of doxycycline in vector and HrasG12V transduced cells (mean ± SEM displayed, n = 3 biological replicates). (C) Restoration of miR-203 using a doxycycline-inducible transgene results in suppression of colony formation ability in HrasG12V transduced and control keratinocytes. miR-203 was induced with doxycycline (5 μg/ml) 24 hr after plating (representative of n = 3 independent experiments, mean ± standard deviation displayed, *p ≤ 0.05, , ns = non-significant). (D) miR-203 restoration suppresses HrasG12V-driven S-Phase entry. miR-203 was induced for 24 hr prior to harvesting for flow cytometry. (n = 3, mean ± standard deviation displayed, *p ≤ 0.05).
To further characterize the ability of miR-203 to suppress the growth of oncogenic Hras-transformed cells, we used our previously established Krt14-rtTA/pTre2-miR-203-inducible model (Jackson et al., 2013). After infecting the inducible keratinocytes with either the pBabe vector control or pBabe-HrasG12V, we treated the cells with 5 µg/ml doxycycline to induce ∼4- to 7-fold increase in miR-203 expression, a physiologically relevant level of miR-203 typically observed during epidermal differentiation (Figure 5B). Introduction of miR-203 resulted in suppression of keratinocyte proliferation and colony formation ability (Figure 5C,D), as noted previously (Yi et al., 2008; Jackson et al., 2013; Benaich et al., 2014). Furthermore, whereas oncogenic Hras-enhanced S-phase entry, short-term (∼24 hr) induction of miR-203 completely abolished the gain of S-phase entry (Figure 5D). Over a longer term, continuous induction of miR-203 severely compromised the colony-forming capacity of the transduced cells (Figure 5C). We did not detect any evidence for enhanced apoptosis caused by miR-203, as measured by the absence of sub-G1 keratinocytes. Taken together, our results suggest that the loss of miR-203 is critical for the initial selection and expansion of primary keratinocytes harboring the oncogenic Hras mutation and the gain of miR-203 can effectively suppress the growth of these cells.
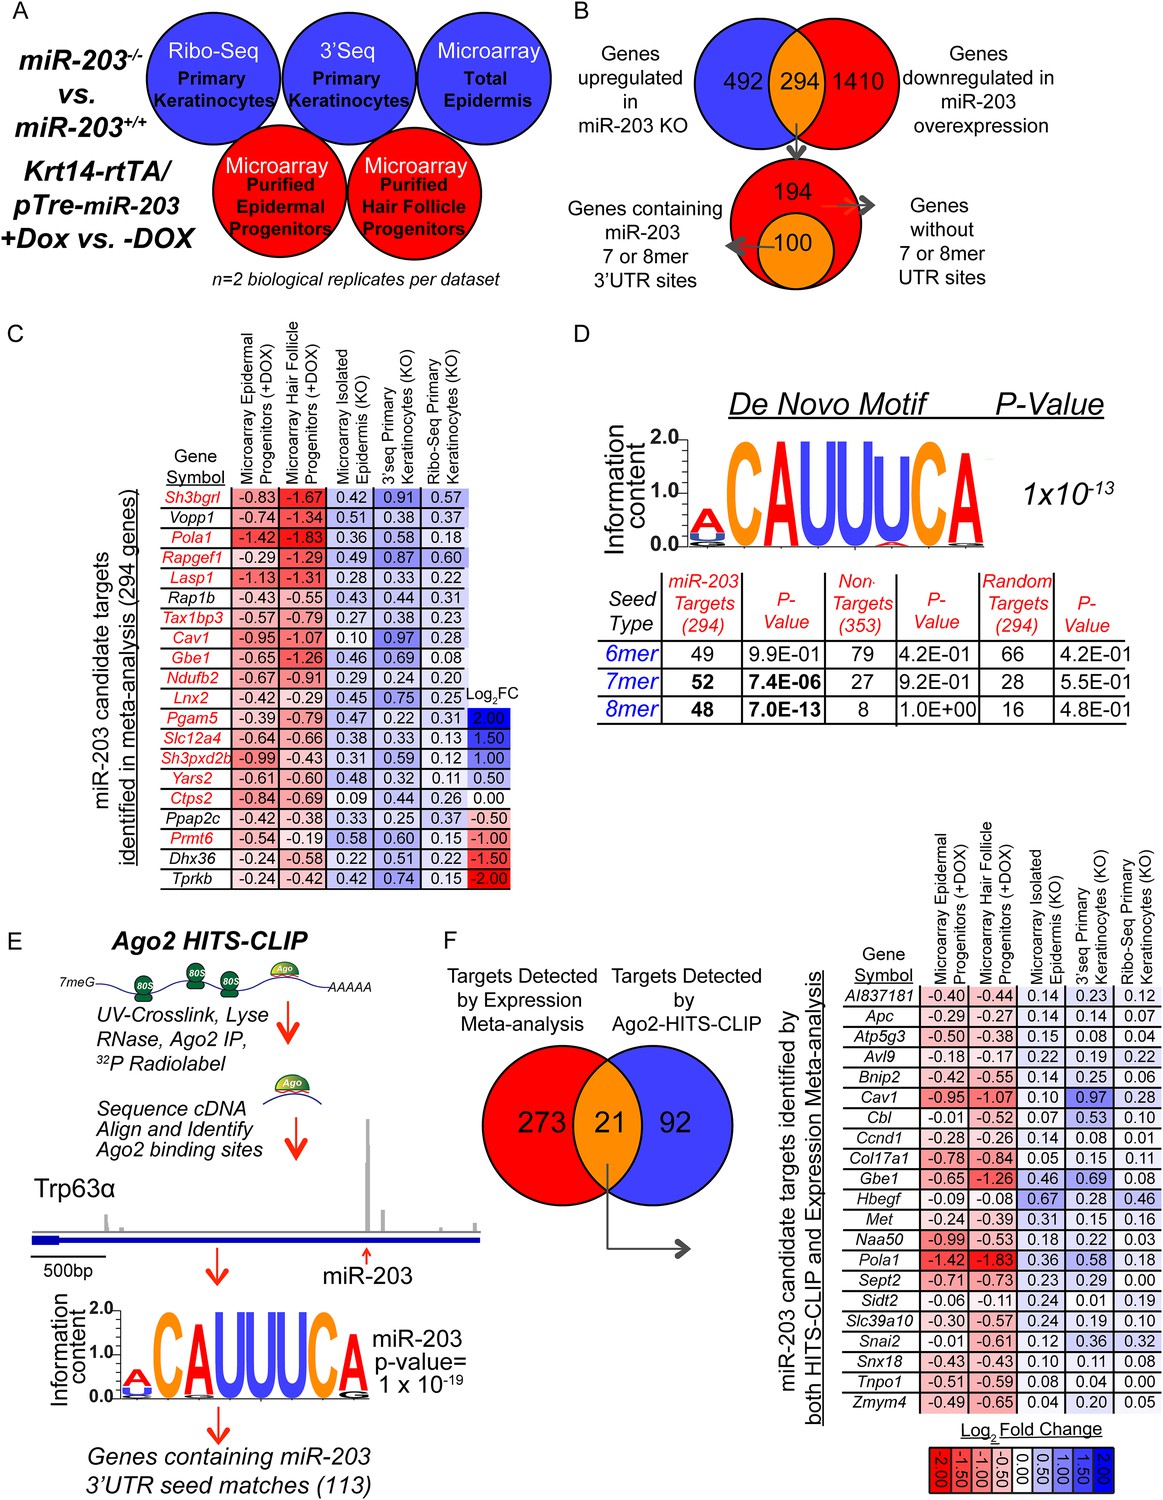
Comprehensive identification of miR-203 targets reveals regulation of the Ras signaling pathway
Our data so far have suggested a role of miR-203 in suppressing the expansion of tumor-initiating cells driven by oncogenic Hras mutations. To decode the underlying mechanism, we carried out comprehensive analyses to identify miR-203 targets in the skin. Recent studies demonstrated that miRNAs' impact on gene expression could be largely captured by measuring the changes of mRNA levels upon manipulation of miRNA expression (Guo et al., 2010; Eichhorn et al., 2014). In parallel, the high-throughput sequencing of RNA isolated by crosslinking immunoprecipitation (HITS-CLIP) approach directly crosslinks miRISC to their targets and identifies miRNA targets through physical interaction (Chi et al., 2009). Therefore, we took a combinatorial approach integrating multiple data sets obtained from our KO and inducible mouse models with Ago2 HITS-CLIP analysis.
We applied several different profiling techniques including ribosome profiling, RNA-Seq (3Seq) and microarray methods to determine upregulated genes in miR-203 KO samples and downregulated genes in miR-203-induced samples. For ribosome profiling and 3Seq, we used primary keratinocytes, which are amenable to effective cycloheximide treatment and therefore also allowed us to investigate miR-203's impact on translation efficiency (Figure 6A). For microarray analysis, we used freshly isolated epidermis obtained from miR-203 WT and KO animals at P4.5. To interrogate the impact of miR-203 gain-of-function, we used the Krt14-rtTA/pTre2-miR-203-inducible mouse model that allows us to control the duration and dosage of miR-203 expression (Jackson et al., 2013). We applied microarray profiling to determine downregulated genes in FACS-purified neonatal epidermal and hair follicle progenitors with a short-term (24 hr) induction of miR-203 (Figure 6A). Altogether, we accrued 20 genome-wide expression data sets from miR-203 WT, KO and inducible samples. This comprehensive collection of functional genomic data allowed us to characterize the action of miR-203 on the transcriptome.
Figure 6 with 5 supplements see all
Comprehensive identification of miR-203 targets using genome-wide expression analyses and Ago2 HITS-CLIP.
(A) Schematic of genome-wide expression profiling data sets used in meta-analysis to identify bono-fide miR-203 targets. (B) Genes upregulated in all three miR-203 loss-of-function data sets (786 genes, no fold-change or p-value cut-off) were compared to genes downregulated in both miR-203 gain-of-function data sets (1704 genes, no fold-change or p-value cut-off) to identify a subset of genes with a strong inverse correlation to miR-203 expression (294 genes) of which 100 genes contained miR-203 7mer or 8mer seed sequence matches in their 3′UTRs. (C) Table demonstrating top 20 genes identified in meta-analysis ranked by negative-correlation to miR-203 expression. Genes colored in red contain 3′ UTR miR-203 7 or 8mer seed matches. (D) De novo motif searching identified an 8mer miR-203 seed motif, complementary to the miR-203 seed sequence enriched in the 3′UTR of candidate miR-203 target genes identified in the meta-analysis (294 genes). Table demonstrating enrichment for 7 or 8mer seed matches in the 3′UTR of candidate miR-203 target genes (294) over the background seed distribution in primary keratinocytes, which is not seen for randomly selected 294 genes expressed in primary keratinocytes or a negative control gene set of genes upregulated in miR-203 gain-of-function and downregulated miR-203 loss-of-function (353 genes). (E) Schematic of Ago2 HITS-CLIP and the identified miR-203 seed motif. (F) Diagram of genes detected by expression meta-analysis and Ago2-HITS-CLIP. Table of 21 high confidence miR-203 targets identified through expression meta-analysis and that have Ago2-HITS-CLIP 3′UTR peaks with miR-203 seed matches.
-
Figure 6—source data 1
GO-analysis of selected miR-203 data sets.
- https://doi.org/10.7554/eLife.07004.013
-
Figure 6—source data 2
Putative miR-203 targets detected in the expression meta-analysis.
- https://doi.org/10.7554/eLife.07004.014
We first analyzed the miR-203 overexpression samples. GO-analysis demonstrated that genes involved in regulation of mitotic cell cycle, DNA synthesis, and metabolism were prominently downregulated upon miR-203 induction (Figure 6—source data 1). miR-203 upregulation in both epidermal and hair follicle progenitors resulted in strong suppression of transcripts harboring perfect seed matches to miR-203 in their 3′UTRs (Figure 6—figure supplement 1). Among them, transcripts containing the 8-mer matches were strongly suppressed, compared to transcripts without a miR-203 seed match (p = 1.5 × 10⁻²³ for epidermis and 2.6 × 10⁻²⁵ for hair follicle, respectively) (Figure 6—figure supplement 1A). In contrast to miR-203 overexpression, deletion of miR-203 did not perturb transcript levels genome-wide as strongly as observed under the induced conditions and offered little insight into miR-203's function based upon GO analysis (Figure 6—source data 1). However, despite the relatively mild changes in the transcript levels in the KO skin and primary keratinocytes, transcripts that contain 8-mer 3′UTR matches were still more significantly upregulated than transcripts without any miR-203 seed matches (p < 0.05) (Figure 6—figure supplement 1B). Lastly, a ranked sum analysis that ranked genes based on expression changes correlated with the levels of miR-203 showed that genes with the 8-mer or 7-mer seed ranked significantly higher than those transcripts without seed matches (Figure 6—figure supplement 1C).
By demanding all potential targets be upregulated in all the miR-203 KO samples and downregulated in all the miR-203-induced samples, we identified 294 transcripts as our candidates for miR-203 targets (Figure 6B). Among the top 20 most differentially expressed transcripts when miR-203 was deleted or induced, 15 of them contain at least one 7-mer or 8-mer match in their 3′UTRs (Figure 6C and Figure 6—source data 2). In support of this approach, an unbiased de novo motif search using the 3′UTRs of these 294 transcripts revealed that the most enriched motif (ACAUUUCA, p = 1 × 10⁻¹³) perfectly matched to nucleotide position 2–9 of miR-203, the 8-mer seed sequences of miR-203 (Figure 6D). Additional statistical analysis of the number of genes containing perfect 3′UTR matches to the 7-mer or 8-mer seed among these candidates revealed significant enrichment over the background distribution among mRNAs expressed in the skin (Figure 6D). Therefore, we selected genes containing 7-mer or 8-mer seed matched 3′UTR sites as miR-203 target candidates and obtained a collection of 100 potential miR-203 targets (Figure 6B).
We then applied HITS-CLIP to interrogate the direct interaction between miR-203 and its mRNA targets. We generated four Ago2 HITS-CLIP libraries from primary WT keratinocytes, which abundantly express miR-203 (Figure 1G). Ago2-RNA complexes were isolated from a region extending from approximately 110 kd–130 kd as expected (Figure 6—figure supplement 2A). Sequencing libraries from Ago2 HITS-CLIP samples were generated and analyzed using previously described methods (Chi et al., 2009; Moore et al., 2014). The HITS-CLIP faithfully captured miRNA species expressed in keratinocytes, including miR-203 (Figure 6—figure supplement 2B,E). Overall our HITS-CLIP reads and clusters alignment were similar to previous published results with a significant portion aligned to 3′UTRs (Figure 6—figure supplement 2D). To further validate our approach, we analyzed the positional enrichment of miRNA seed sequences within the 3′UTR HITS-CLIP clusters and detected strong enrichment over dinucleotide shuffled cluster sequences or randomly distributed 3′UTR regions (Figure 6—figure supplement 3A). Additionally, de novo motif searching for 8mer motifs identified the seed sequences of miRNAs that are highly expressed in keratinocytes (Figure 6—figure supplement 3B). The motif corresponding to miR-203 detected by the HITS-CLIP was also ACAUUUCA (p = 1 × 10⁻¹⁹), identical to the motif detected by our transcriptome analysis (Figure 6E and Figure 6—figure supplement 3B). A total of 113 mRNAs were detected to have miR-203 seed containing Ago2 binding sites. We next examined the ranked sum expression of these targets and determined that transcripts with Ago2 HITS-CLIP miR-203 binding sites were ranked significantly higher compared to non-targeted mRNAs, indicating that many of these targets are functional (Figure 6—figure supplement 4). Finally, we did not detect any evidence for global regulation at the translation level for miR-203 targets based on our analysis of translational efficiency changes upon miR-203 deletion (Figure 6—figure supplement 5). Together, these HITS-CLIP data independently validated that miR-203 uses its seed sequences for mRNA targeting and predicted 113 miR-203 targets based on Ago2 binding.
By combining the targets detected by our differential expression data sets and by the HITS-CLIP, we identified a list of high-confidence targets for miR-203 (Figure 6F). Importantly, we found a number of key regulators in the Ras signaling pathway and important genes involved in regulation of cell division including Hbegf, Ccnd1, Snai2, Met, and Pola1 in this list (Figure 6F). This collection of miR-203 targets suggests that miR-203 targets multiple pathways, including several components of the Ras signaling pathway, to suppress cell proliferation.
miR-203 directly targets Hbegf and Pola1
Our genome-wide analyses identified a number of novel targets of miR-203. Given our findings that the loss of miR-203 promotes the selection and expansion of oncogenic Hras-transformed cells both in vivo and in vitro, we were interested in understanding the underlying mechanism. Overall, miR-203 targets identified in the meta-analysis were enriched in the upregulated transcripts in HrasG12V-transformed keratinocytes, compared to non-targeted transcripts, consistent with the downregulation of miR-203 in these cells (Figure 7—figure supplement 1A). Among these targets, we were intrigued by the observation that multiple regulators of the Ras signaling pathway and critical factors for DNA replication and cell cycle progression were among our high confidence targets and additionally were among the most upregulated miR-203 targets in HrasG12V-transformed keratinocytes (Figure 7—figure supplement 1B). To begin to validate the high-confidence set of miR-203 targets, we selected Pola1 and Hbegf for further study. Pola1 is the catalytic subunit of the DNA-POL-alpha holoenzyme, which is required in initiation of DNA replication during S-phase (Lehman and Kaguni, 1989). Hbegf is an Egf-like ligand that activates MAPK signaling through activation of EGF-receptors, Erbb1 and Erbb4. In keratinocytes, Hbegf is mitogenic and promotes keratinocyte migration (Stoll et al., 2012). In an epithelial cancer cell line, Hbegf acts as an oncogene promoting cell proliferation (Miyamoto et al., 2004). Pola1 and Hbegf contain 3′ UTR miR-203 target sites (9-mer and 8-mer respectively) that are targeted by miR-203, validated by luciferase assay (Figure 7A). Furthermore, in miR-203 null epidermis, both Pola1 and Hbegf mRNAs were elevated (Figure 7B). In addition to mRNA levels, Pola1 protein levels were also elevated in the absence of miR-203. It was further elevated in the presence of HrasG12V and repressed by miR-203 induction (Figure 7C,D). We were unable to measure the protein level of Hbegf due to poor antibody performance. Additionally, we observed that the expression of Ccnd1, an essential cell cycle regulator that is often induced or amplified by oncogenic Ras (Downward, 2003; Stransky et al., 2011), showed a strong negative correlation to miR-203 (Figure 7C,D). This suggested that loss of miR-203 increases the levels of Ccnd1 and contributes to the observed upregulation of this critical gene.
Figure 7 with 2 supplements see all
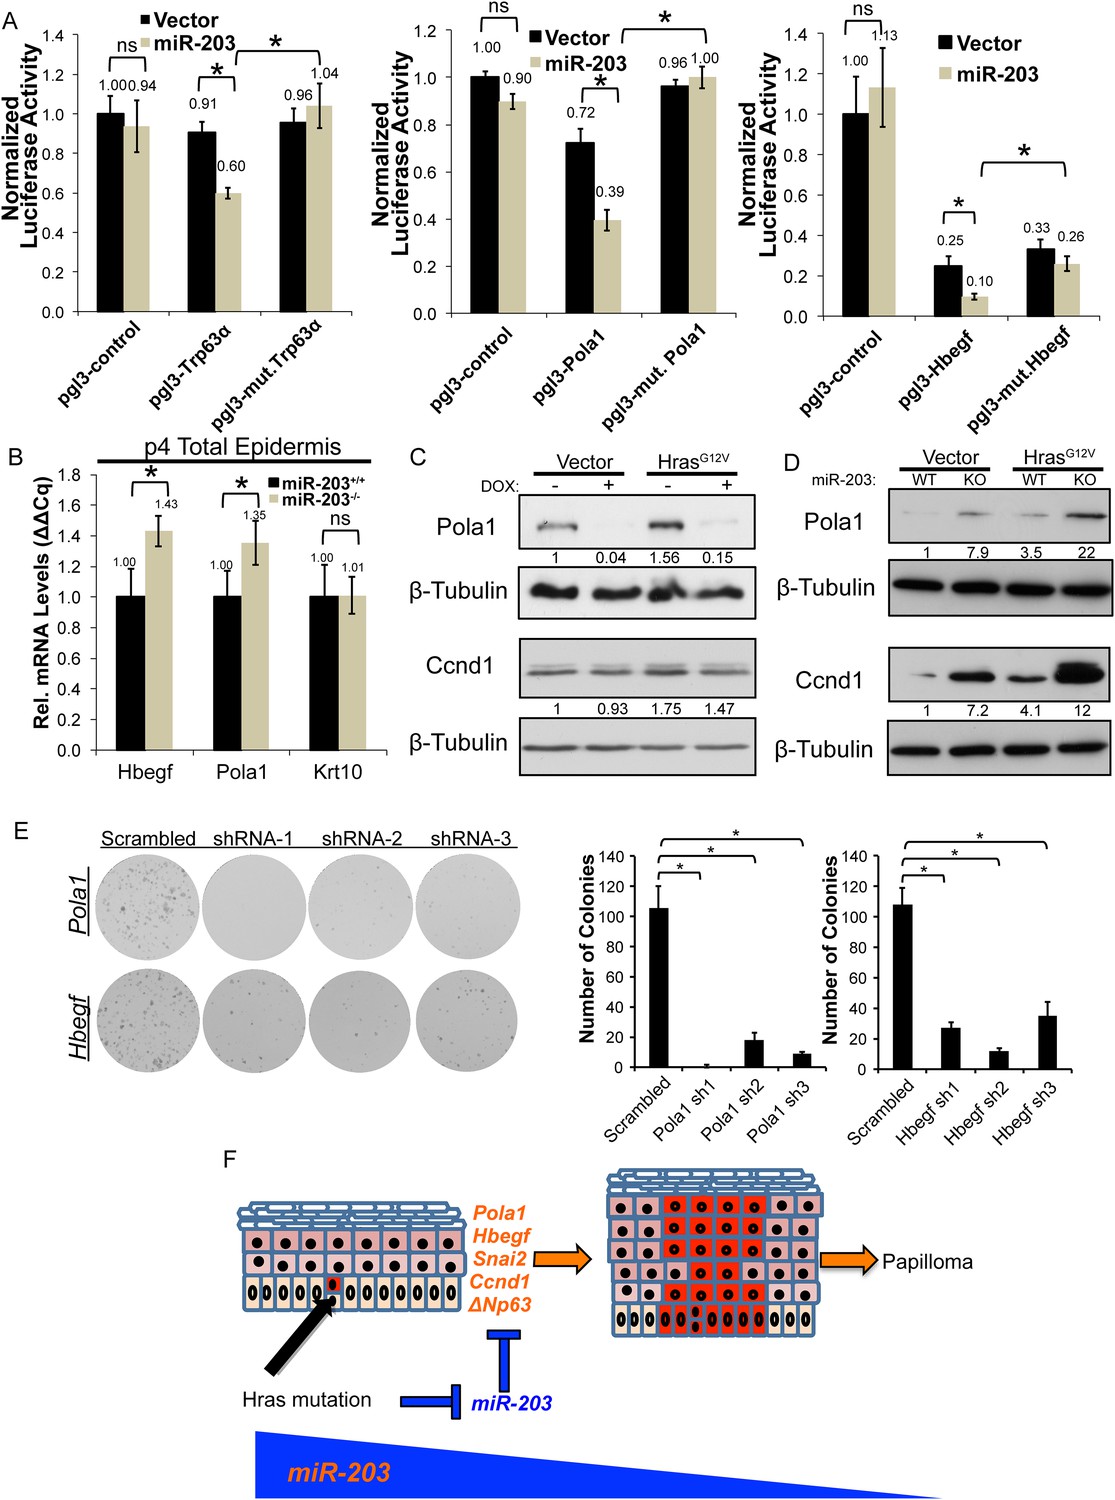
Hbegf and Pola1 are direct miR-203 target genes critical for keratinocyte proliferation.
(A) 3′UTR luciferase reporter assays demonstrate that miR-203 directly targets Trp63 (positive control), Pola1, and Hbegf in keratinocytes (representative of n = 3 independent experiments, mean ± propagated standard deviation displayed, *p < 0.05, ns = non-significant, Student's t-test two-sided) (B) Hbegf and Pola1 are upregulated in miR-203−/− isolated epidermis (p4) (n = 8 and n = 10, miR-203+/+ and miR-203−/− animals respectively, mean ± SEM displayed, *p < 0.05). (C, D) Western blots from lysates with miR-203 overexpression (48 hr) or miR-203 ablation. (E) shRNA knockdown of Hbegf or Pola1 impairs keratinocyte colony formation ability (representative of n = 3 independent experiments, *p <0.05, mean ± standard deviation displayed). (F) Model for the mechanism of miR-203 in restricting Hras-initiated tumorigenesis.
To assess the functional consequences of Hbegf and Pola1 suppression on keratinocyte proliferation, we knocked down these targets using three independent shRNAs. Suppression of Hbegf and Pola1 strongly suppressed the growth potential of keratinocytes (Figure 7E). Additionally, we knocked down Hbegf and Pola1 in established miR-203+/+ and miR-203−/− keratinocytes transduced with HrasG12V and similarly observed potent suppression of keratinocyte growth potential, demonstrating that these targets are also required in HrasG12V-transformed keratinocytes (Figure 7—figure supplement 2). Taken together, these results validate Hbegf and Pola1 as direct targets of miR-203. We hereby propose a model in which miR-203 restricts selection and expansion of Hras-mutated cells by repressing multiple targets, a subset of which are involved in the Ras signaling pathway (Figure 7F).
Discussion
Identification and experimental validation of driver gene mutations have been instrumental for our understanding of cancer biology (Vogelstein et al., 2013). Although it is clear that not all cells harboring driver gene mutations develop into tumors, the mechanism of clonal selection within cells that have acquired driver gene mutations remains poorly understood. In this study, we used an oncogenic Hras-induced tumor model to determine the molecular consequences of this oncogenic driver mutation and to study the selection process. We quantitatively measured the impact of oncogenic HrasG12V on the landscape of mRNA and miRNA expression. Whereas our mRNA-Seq data confirmed the profound ability of HrasG12V in promoting cellular transformation, our miR-Seq data revealed new insights into the dynamic changes in highly expressed miRNAs caused by HrasG12V (Figure 1). In particular, the downregulation of miR-203, one of the most highly expressed miRNAs in the skin, likely occurs at the transcriptional level (Figure 2C,D). By examining tumor samples obtained from both mouse and human at multiple stages, we showed that the downregulation of miR-203 is associated with tumor initiation and progression (Figure 2E–P). To determine the role of miR-203 in this process, we generated a KO mouse model. Initial insights into the function of miR-203 came from the analysis of miR-203 null epidermis during skin development. Whereas we and others have shown the potent inhibition of epidermal proliferation by miR-203 with gain-of-function approaches (Lena et al., 2008; Yi et al., 2008; Jackson et al., 2013; Benaich et al., 2014), it is unknown how the loss of miR-203 affects the skin and mouse development in general. By analyzing the KO mouse, we revealed an early, albeit mild, hyperproliferative phenotype in the embryonic but not postnatal skin (Figure 3E–I). However, when we subjected miR-203 WT and null cells obtained from postnatal skin for their colony-forming ability, we observed an increased ability of the miR-203 null cells to give rise to colony-forming cells (Figure 3J,K). This observation was indicative of a role for miR-203 in restricting the expansion of highly proliferative cells. Of note, we did not observe any defects in the formation of the differentiated layers of the skin in the miR-203 KO mice. This suggests that the primary function of miR-203 is to restrict cell proliferation but not to promote epidermal differentiation per se. When we examined the role of miR-203 during DMBA/TPA-mediated chemical carcinogenesis, we observed strong increase in the number of papillomas formed in the KO skin (Figure 4A–C). In vitro colony formation assays with serial passages further illustrated the enhanced ability for selecting tumor-initiating cells with miR-203 KO cells when subjected to HrasG12V transformation (Figure 5A). However, due to tumor resistance of our C57BL/6 strain, we were unable to determine if the loss of miR-203 also promotes malignant transition. Of note, a recent study showed interesting results that restoration of miR-203 suppresses human SCC metastasis (Benaich et al., 2014). Collectively, our results provide experimental evidence for an important role of miR-203 in suppressing clonal selection and expansion of Hras-mutated nascent cancer cells.
A major challenge in understanding miRNA functions is to identify their high-confidence targets globally. To this end, we employed two independent approaches: transcriptome analysis with our KO and inducible models and direct miRNA target capture by Ago2 HITS-CLIP (Figure 6). Importantly, with our expansive data set, we confirmed that miR-203 utilizes the 5′ seed sequences to target perfectly matched sequences located on the 3′UTRs of its target genes. Consistent with recent genome-wide studies for the impact of miRNA on mRNA levels and translation efficiency in mammals (Guo et al., 2010; Eichhorn et al., 2014), we found no evidence for global changes of translational efficiency in the absence of miR-203, one of the most highly expressed miRNAs in the skin. However, we also noted that Trp63, a well-established miR-203 target, showed little change at the mRNA levels under all conditions (not shown). Our analysis with differential gene expression did not identify Trp63 as a miR-203 target. In contrast, the recognition of the 3′UTR site of Trp63 by miR-203 was robustly detected by the HITS-CLIP (Figure 6E). Thus, it is likely that our identification of miR-203 targets based on the transcriptome analysis alone was conservative. More studies will be required to further integrate direct miRNA target capture with transcriptome analysis for miRNA target identification. Nevertheless, we still observed strong enrichment of miR-203 targets in genes required for cell proliferation. These high-confidence targets illustrate the broad targeting of cell proliferation by miR-203 and suggest mechanisms by which loss of miR-203 can facilitate the expansion of oncogenic Hras-transformed cells. These new insights point to the potential of utilizing miR-203 to simultaneously target multiple effectors required for cell division in human cancers. We also note that miR-203 is known to antagonize human papillomaviruses (HPV) (Melar-New and Laimins, 2010). Our identification of Pola1, a critical cellular gene required for HPV genome replication, as a target of miR-203 may provide a potential mechanism for miR-203-mediated antagonism against HPV infection. Finally, the relatively mild requirement for miR-203 in slowly proliferating cells suggests that a reduction or increase in the level of miR-203 may be well tolerated by most normal cells. This unexpected discovery could be further explored to determine miR-203's therapeutic potential in treating certain types of epithelial cancers.
Materials and methods
3seq library construction
Request a detailed protocol3′seq libraries were constructed using methods described previously (Wang et al., 2013). Briefly, 500 ng of total RNA isolated from primary keratinocytes was poly-A purified (Dynabeads, Thermo Fisher Scientific, Waltham, MA) and chemically fragmented by treatment 95°C for 8 min in Fragmentation Buffer (Thermo Fisher Scientific). Fragmented RNAs were then oligoDT primed with a P7T20V oligo and reverse transcribed using SuperScript III (Thermo Fisher Scientific) (see Supplementary file 2 for Oligo Sequences). Following ethanol precipitation, ligation competent cDNAs were generated via second-strand synthesis using RNase H and DNA Pol I enzymes, end-repaired using a mix of T4 DNA polymerase, Klenow DNA polymerase and T4 Polynucleotide Kinase in the presence of dNTPs (New England Biolabs, Ipswich, MA), and A-Tailed using Klenow 3′ to 5′ exo- in the presence of dATP (New England Biolabs). Ligation was then performed using the P5 Adaptor with T4 DNA Ligase for 1 hr (New England Biolabs). cDNA inserts 80–100 nt in length were isolated from 8% PAGE gels and subject to PCR amplification using RP1 and RT-Primer oligos for 12–16 cycles (Phusion, New England Biolabs). PCR products were isolated from PAGE gels and subject to 6 cycles of secondary PCR to introduce unique indices for multiplexed DNA sequencing on a HiSeq 2000 (Illumina, San Diego, CA).
Bioinformatics processing of 3seq data was performed as described previously, including adaptor trimming, read alignments, peak calling, peak filtering to remove internal polyA priming events, and transcript quantification with minor modifications (Wang et al., 2013). Following read alignment to the mm10 genome, alignments from every library were grouped together for peak calling and 3′end filtering to create a master set of high confidence 3′ end peaks. From this 3′end data set, reads counts for each library were obtained (see Supplementary file 1 for mapping statistics). To obtain transcript read counts, reads from all peaks that passed our internal priming filter and were 3′UTR localized were summed to obtain an overall transcript count for each transcript. Normalized transcript counts were calculated as reads per million reads mapped (RPM). To determine differential transcript expression, low-abundance transcripts with less than 10 reads in two libraries were first excluded then the remaining transcripts were analyzed with EdgeR with classical analysis parameters.
Small RNA-Seq
Request a detailed protocolSmall RNA-Sequencing libraries were prepared using minor modifications of a previously published protocol that reduces RNA-ligation biases and enables accurate miRNA quantification (Zhang et al., 2013). Briefly, two micrograms of total RNA was first ligated to a pre-adenylated 3′ linker (10 μM) using truncated T4 RNA Ligase 2 (20 Units New England Biolabs) in the presence of PEG-8000 (10% wt/vol) RNaseOUT (20 Units Thermo Fisher Scientific) for 4 hr at room temperature. Ligation reactions were then resolved on 7 M Urea-15% PAGE gel to isolate the miRNA-3′ adaptor hybrids. Following overnight elution from the acrylamide gel in HSCB buffer (400 mM NaCl, 25 mM Tris–HCl pH 7.5, 0.1% SDS), ligation products were ethanol precipitated, resuspended in 5′ ligation reaction mixture containing a 5′ linker (10 μM), 1 mM ATP, Peg-8000 (20% wt/vol), 1 × T4 RNA Ligase buffer (New England Biolabs), denatured for 5 min at 70°C, after which RNaseOUT (20 units) and T4 RNA Ligase 1 (10 units) were added. Following ligation for 37°C for 2 hr, cDNA was generated via reverse transcription using Superscript III (Thermo Fisher Scientific) in the presence of a 3′adaptor specific primer. cDNA products were then subjected to 10–14 PCR cycles and resolved on 8% native PAGE gels. Libraries were then eluted as described above, precipitated, and submitted for sequencing on a HiSeq 2000 (Illumina).
Small-RNA sequencing reads were analyzed following previously described methods with the following modifications (Zhang et al., 2013). Adaptor sequences were trimmed from reads using CutAdapt using default parameters. Reads were then further trimmed to remove the randomized adaptor dinucleotides on the 5′ and 3′ end. Read were next aligned to a database of mouse miRNA sequences (miRbase) using blastn with the following settings (blastn -word_size 11 -outfmt 6 -strand plus). Blast alignments were then parsed with custom python scripts to extract and count the best miRNA alignment for each read with a minimum read alignment of 18 nucleotides. miRNA counts for each library were then filtered to keep only miRNAs with a minimum count of 50 reads in two libraries and analyzed for differential expression using EdgeR, with classical analysis parameters.
Affymetrix microarray analysis
Request a detailed protocolFor the miR-203 epidermal loss-of-function microarray analysis, RNA was isolated from total epidermal samples from two-pairs of miR-203+/+ and miR-203−/− animals at p4. For the doxycycline-inducible miR-203 over-expression microarray analysis, RNA was isolated from two pairs of doxycline induced or uninduced Krt14-rtTA/ pTre-miR-203 animals using FACS sorting for Krt14-H2B-GFP+ cells as described previously (Jackson et al., 2013). The microarray analysis of miR-203 overexpression in basal epidermis was previously published (Jackson et al., 2013). Subsequently total RNAs (500 ng) were processed and hybridized to the GeneChip Mouse Genome 430 2.0 array (Affymetrix, Santa Clara, CA) following the manufacturer's instruction at the MCDB microarray facility. Microarray image files were processed using the R Bioconductor suite and Mas5 normalization. Probesets were then filtered to include only those probes with present or absent calls in at least two arrays. Probesets were then collapsed using the probeset with the maximum averaged probeset intensity to represent each GeneID. Log2 fold changes were then computed using the limma Bioconductor package.
Ribosome profiling
Request a detailed protocolRibosome profiling was performed on primary keratinocyte lysates using the ARTseq Ribosome profiling kit (Illumina). Briefly, lysates from a 10-cm dish of primary keratinocytes were isolated in the presence of cycloheximide (Sigma-Aldrich, St. Louis, MI, 50 μg/ml) and subject to limited RNAse digestion (10 units) for 45 min at room temperature. RNase digestion was terminated by addition of 15 μl of SUPERase In (Thermo Fisher Scientific) followed by ribosome isolation using illustra MicroSpin S-400 HR Columns (GE Healthcare, United Kingdom). Following RNA extraction and precipitation, rRNA was depleted using the Ribo-Zero Gold kit (Illumina), with the remaining RNA then fractionated through 18% PAGE gels. RNA species 28–32 nt were isolated for adaptor ligation, reverse transcription, circularization, and PCR amplification following the manufacturer's protocol. PAGE gel isolated PCR products were then sequenced on a HiSeq 2000 (Illumina).
Raw reads were first trimmed to remove 3′ adaptors using cutAdapt with default parameters. Reads were aligned to mm10 rRNA, tRNA, and ncRNA (Ensemble annotation) databases using Bowtie (default settings) to exclude reads aligning to abundant rRNA, tRNA, and ncRNA sequences. Unaligned reads were then aligned via Tophat using default settings, with a supplied .gtf annotation file containing combined Refseq and Ensembl gene annotations (iGenomes Illumina downloaded 9/4/2013). Uniquely aligned read counts were quantified across each CDS using HTSeq Count (settings: -s yes -m union -t CDS) using the above-mentioned GTF annotation database. Transcripts with low reads counts were excluded by only keeping transcripts with at least 50 reads in at least two libraries. Filtered transcript reads count data were then analyzed for differential expression using EdgeR with classical analysis parameters. To calculate translation efficiency for each transcript, Reads Per Million Mapped (RPM) values from 3Seq were divided by Reads per Million Mapped to coding sequence for the Ribo-Seq. The change in translation efficiency was then computed as the ratio of translation efficiency in the miR-203−/− and miR-203+/+ libraries.
Ago2 HITS-CLIP
Request a detailed protocolAgo2 HITS-CLIP was performed as described with minor modifications (Chi et al., 2009). 15-cm2 dishes of primary keratinocytes were irradiated twice at 200 mJ/cm with 254 nm UVC light. Following irradiation, cell lysates were harvested by scraping and stored at −80°C. Following thawing, lysates were further lysed by trituration 3 times through pre-chilled 25- and 30-gauge needles. Lysates were then treated with 10 μl Turbo DNase (Thermo Fisher Scientific) and 5 μl RNaseOUT (Thermo Fisher Scientific) per ml of lysate. Limited RNase digestion was performed using 10 μl per ml of lysate of a 1:20 dilution of an RnaseA/T1 mix (Sigma-Aldrich/Thermo Fischer Scientific 1× mix = 3.33 μl RnaseA [2 μg/μl] with 6.66 μl RnaseT1 [1 U/μl]). Crosslinked Ago2 was recovered via immunoprecipitation for 2 hr at 4°C with 3 μg of a monoclonal anti-mouse Ago2 antibody (Wako Chemicals USA Inc., Richmond, VA, clone 2D4) complexed with Protein-G Dynabeads (Thermo Fisher Scientific). Immunoprecipitates were washed twice with High-Salt Buffer and PNK buffer, then end labeled with 25 μCi 32P y-ATP using PNK 3′ phosphatase minus (New England Biolabs) for 5 min at 37°C. After washing the beads as listed above, 5′ adaptor ligation was performed for 2 hr at room temperate using T4 RNA Ligase 1 with 10 μM 5′ RNA Linker, 20% PEG-8000 (wt/vol final), 1 mM ATP, and RNaseOUT (Thermo Fisher Scientific). Beads were again washed twice with PNK buffer then resuspended in a phosphatase reaction with 5 μl FastAP (Thermo Fisher Scientific) with RNaseOUT. Following washing twice with PNK buffer, Protein–RNA complexes were eluted from the beads using 1× NuPage Loading buffer supplemented with 50 mM DTT at 70°C for 10 min. Protein–RNA complexes were then resolved on an 8% Bis-Tris Gel and transferred to nitrocellulose. Membranes were exposed to a phosphor screen for 1–2 hr to obtain an autoradiograph. Subsequently, RNA–protein complexes migrating in the 110–130 kD range were excised. RNA was recovered from the nitrocellulose using Proteinase K treatment followed by phenol–chloroform extraction and ethanol precipitation. Isolated RNA was ligated to a 3′linker using the same ligation reaction conditions as for 5′ ligation, and ligated RNA species were fractionated away from adaptor–adaptor products on 10% UREA PAGE gels. The RNA was eluted from the PAGE gel with HSCB buffer overnight at 4°C, then ethanol precipitated and resuspended for reverse transcription with SuperScript III (Thermo Fisher Scientific). cDNA products were then subjected to PCR amplification for 20–24 cycles and fractionated on an 8% native PAGE gel. PCR products representing cDNA inserts of 20–50 nts were recovered and subject to sequencing on a HiSeq 2000 (Illumina).
HITS-CLIP reads were analyzed as follows. First, reads were processed to identify miRNA alignments using the same pipeline that we use for Small-RNA-Seq listed above. Reads not mapping to miRNAs were next processed as follows. Reads were trimmed with Cutadapt to remove adaptor sequences using default settings. To avoid PCR duplicates from biasing the analysis, duplicate reads were then collapsed to a single read using Fastx_collapser (default settings). The 5′ and 3′ adaptor sequences contain randomized dinucleotides on their 3′ and 5′ ends respectively, which were next trimmed from the reads. The reads were then aligned to the mm10 genome assembly using NovoAlign requiring a minimum alignment length of 25 nucleotides (settings –s 1 –t 85 –l 25) (Novocraft, Malaysia). All unique alignments from each library were then pooled to identify Ago2 HITS-CLIP clusters. Clusters were defined as two read alignments that overlap by a minimum of one nucleotide. Clusters were next annotated to gene features in a hierarchical manner in which clusters were annotated to protein coding RefSeq 3′ UTRs (with 5 kbp extension allowed), RefSeq CDS regions, RefSeq 5′ UTRs, Ensemble ncRNA regions, and RefSeq intron regions. Clusters not found in these regions were annotated as intergenic clusters. For predicting miRNA target sites, 3′UTR cluster sequences were searched for 6mer seed-sequence matches for miRNA species that accounted for 90% of miRNAs expressed in epidermis based on small-RNA sequencing. From this data set, 117 binding sites in 113 mRNAs were predicted be miR-203 target sites.
Meta-analysis of miR-203 targets
Request a detailed protocolThe miR-203 overexpression data sets used in the meta-analysis included previously published microarrays from sorted H2B-GFP+ epidermal cells with transient miR-203 induction (GSE45121), and microarrays from sorted H2B-GFPhi+ hair follicle progenitor cells with transient miR-203 induction described in this manuscript. The miR-203 knockout data sets used in the meta-analysis included the microarrays from p4.5 total epidermal samples from miR-203+/+ and miR-203−/− animals, ribosome profiling of miR-203+/+ and miR-203−/− primary keratinocytes, and 3seq of miR-203+/+ and miR-203−/− primary cultures. We also performed 3seq on miR-203−/− cells transformed with HrasG12V; however, there was no enrichment for miR-203 seed matches in the upregulated transcripts based on CDF analysis, consistent with the low levels of miR-203 in HrasG12V-transformed keratinocytes, and therefore, this data set was excluded from the expression meta-analysis (data not shown). Gene symbols were used to compare across microarray, 3Seq, and Ribo-Seq data sets. Log2 fold changes were used to assess differential gene expression in each data set. In total 6407 genes were detectable in all the data sets, from which 294 satisfied the criteria of being upregulated in all the miR-203 knockout data sets and downregulated in the miR-203 overexpression data sets. Negative control data sets were constructed to analyze the enrichment of genes containing miR-203 seed matches with the following criteria, randomly selected genes from the list of detected transcripts in the meta-analysis, or genes that have a positive correlation to miR-203 expression (downregulated in miR-203 knockout data sets and upregulated in miR-203 overexpression data sets).
In order to compare gain-of-function and loss-of-function data sets in aggregate, a ranked correlation to miR-203 metric was calculated. Transcripts were assigned a rank in each knockout data set with the most upregulated gene given a rank of 1. Transcripts were next assigned a rank in each overexpression data set with the most downregulated gene given a rank of 1. The ranked values from each of the 5 data sets were then summed and ranked with the transcript most upregulated upon miR-203 ablation and downregulated upon overexpression being assigned a value of 1.
Hierarchical clustering, GO-term analysis, GSEA, 3′UTR motif-searching
Request a detailed protocolNormalized transcript abundances (expressed as Reads Per Million) were used for mean-centered unsupervised hierarchical clustering using Cluster 3.0 software. For 3seq data, only transcripts with at least twofold change were selected and for miRNA data, only miRNAs with at least an expression level of 1000 RPM and at least a twofold change were selected for visualization in JavaTree View. GO-term enrichment analysis was performed by DAVID using Gene-IDs as input, with analysis being performed using GO biological processes data sets. GSEA analysis was performed using ranked expression values for the displayed data set, and genesets were selected from the referenced publications. De novo motif searching was performed using the HOMER package to search for 7 or 8mer motifs in RefSeq 3′UTR sequences for selected genesets. For genes with multiple 3′UTR isoforms, the longest 3′UTR was selected for motif searching. miRNA seed-sequence searches in Ago2-HITS-CLIP clusters were performed with a Python script using regular expressions.
Analysis of The Cancer Genome Atlas (TCGA) data
Request a detailed protocolHead and Neck SCC miRNA-Seq data were obtained from the TCGA https://tcga-data.nci.nih.gov/tcga/ (Download date 10/23/2014). Patient matched normal solid tissue and tumor miRNA quantification records were identified using custom R scripts (regular expression query for tumor and solid tissue normal samples respectively ‘TCGA-[0-9A-Z]{2}-[0-9A-Z]{4}-0’, ‘TCGA-[0-9A-Z]{2}-[0-9A-Z]{4}-11’). The normalized reads_per_million quantification for miR-203 and miR-21 was then plotted to determine the relative expression in normal and tumor tissue samples.
Mouse strains and generation of the conditional miR-203 knockout mouse
Request a detailed protocolA gene targeting vector was constructed that contained 11 kbp homologous region surrounding the miR-203 locus (Figure 3—figure supplement 1). LoxP were inserted flanking the pre-miR-203 sequences, with a neomycin selection cassette flanked by Frt sites. The construct was electroporated into Cy2.4 ES cells (B6(Cg)-Tyr<c2J> genetic background). Positive clones were identified by Southern blot analysis using a probe complementary to the 3′ end of the targeted homologous region. ES cells were injected into blastocysts and chimeras were screened based on white/black coat color selection. Upon obtaining germline transmission, the neo cassette was excised by breeding the F1 progeny to an Actb-Flpe line maintained on a C57BL/6J background (obtained from Jackson Labs, Bar Harbor, ME). miR-203floxed animals were then bred to a EIIa:Cre line maintained on a C57Bl/6 background (obtained from Jackson Laboratory) or a Krt14:Cre line maintained on a mixed background (obtained from E. Fuchs Laboratory), to obtain germline or conditional ablation of miR-203. The EIIa:Cre transgene was removed from the germline miR-203 deleted line by backcrossing to a C57Bl/6 line and subsequently maintained on a C57Bl/6 background. pTre2-miR-203/Krt14-rtTA mice were generated as described previously and maintained on an FVB background (Jackson et al., 2013). Mice were bred and housed according to the guidelines of IACUC at a pathogen-free facility at the University of Colorado (Boulder, CO, USA).
Immunofluorescence, EdU detection, and miRNA in situ hybridization
Request a detailed protocolFrozen cryostat sections (8 μM) were fixed in 4% paraformaldehyde for 10 min at room temperature, washed thrice with PBS, and blocked for 10 min using Gelatin Block (0.1% Triton X-100, 2% gelatin, 2.5% normal goat serum, 2.5% normal donkey serum, and 1% BSA in PBS). Primary antibodies, diluted in gelatin block, were then incubated overnight (see Supplementary file 2 for antibody references). Following three washes with PBS, sections were incubated with appropriate Alexa-Fluor secondary antibodies (1:2000) for 1–2 hr at room temperature. Following three washes with PBS, sections were stained with Hoescht Dye and mounted in Anti-fade solution. miRNA in situ hybridization for miR-203 was performed on frozen sections as described previously (Yi et al., 2008). EdU detection was performed following manufacturer's instructions, with the following parameters. P4 animals were IP injected with 50 μg/g EdU 4 hr prior to tissue harvest. Following EdU detection, the sections were blocked and probed with antibodies as described above. BrdU detection was performed as previously described, with the following parameters. Pregnant female mice were IP injected with 50 μg/g BrdU for 2 hr prior to embryo harvest in OCT compound. miR-203 in situ hybridization on FFPE mouse and human tumor samples was performed with the following modifications, after deparaffinization in xylenes, the tissue was treated with proteinase K (20 μg/ml) for an extended period of 20 min at an elevated temperature (37°C). Microscopy images were obtained using a Leica DM5500B microscope with either a Leica camera (brightfield) or Hamamatsu C10600-10B camera (fluorescence) and processed with the Leica image analysis suite, MetaMorph (MDS Analytical Technologies, Sunnyvale, CA) and Fiji software. BrdU or EdU image quantifications were performed by counting the number of Krt5+/EdU or BrdU positive cells in randomly chosen microscopy fields. The length of the basement membrane was used to represent the length of the epidermis analyzed and was determined by tracing the basement membrane and calculating line length using Fiji software. Epidermal thickness was assessed by tracing a line tangential to the basement membrane and extending to the beginning of the stratum corneum and calculating the line length.
qPCR and western blotting
Request a detailed protocolqPCR was performed using the Qiagen (Germany) miR-script RT system and a BioRad CFX-384 machine (Hercules, CA). Fold-changes were computed using the ΔΔCt formula normalized to sno25 and Hprt values. In all qPCR figures, error bars denote standard errors of the normalized mean. Western blotting was performed using 20–40 μg of protein lysate run on 8–12% SDS-PAGE gels. Proteins were transferred to PVDF for detection of Pola1, β-tubulin (Tubb5), or Ccnd1. Primary antibodies were incubated in 5% BSA overnight and detected using HRP-conjugated secondary antibodies and Amersam ECL-Plus reagents (1:10,000)(GE Healthcare). See Supplementary file 2 for antibody descriptions and dilutions. X-ray films were scanned and processed with Fiji software to calculate relative protein abundance.
Primary keratinocyte harvesting and cell culture, viral infections, Edu flow cytometry, and shRNA knockdown
Request a detailed protocolPrimary keratinocytes were isolated from neonatal mice using previously described methods with the following modifications (Lichti et al., 2008). Isolated skin was incubated on a solution of Dispase overnight at 4°C to dissociate the epidermis from the dermis. The following day epidermal sheets were incubated in 37°C Trypsin for 10 min to isolate keratinocytes. Primary keratinocytes were then plated in 6-cm or 10-cm dishes with E-Low media supplemented with 0.2 mM calcium chloride for the first 24 hr then switched to E-Low media with 0.05 mM Ca++. Lentiviral particles were produced by transient transfection of pLKO-shRNA constructs, PsPax.2, and pVSVG. 24 hr post transfection, the media was changed to E-Low calcium. Retroviral particles were produced by transient transfection of pBabe-vector-puro, pBabe-HrasG12V-puro, pBabe-vector-neo, or pBabe-HrasG12V-neo, with PCL-Eco and pAdvantage packaging plasmids. Viral supernatant was harvested every 12 hr for up to 96 hr, pooled and filtered with 0.45-μM filter. Ad-eGFP or Ad-CREeGFP adenoviruses were obtained from the Iowa Gene Transfer Core and used at MOI of 50. Retroviral and lentiviral infections were performed 3–4 days after plating primary keratinocytes. Keratinocytes were selected with 2 μg/ml puromycin for 48 hr or 50 μg/ml neomycin for 7 days, at which time non-infected cell cultures were non-viable. Spontaneously immortalized miR-203+/+, miR-203−/−, and miR-203fl/fl mouse keratinocyte cell lines were also generated via serial passage on mitomycin-C treated NIH-3T3 feeder cell culture layer and utilized for assays as noted in the text. Flow cytometry was performed as previously described, with minor modifications (Jackson et al., 2013). Cell cultures derived from pTre2-miR-203/Krt14-rtTA animals were treated with 5 μg/ml doxycycline for 24 hr to induce miR-203 expression, pulsed with EdU (10 μM) for 30 min, harvested and analyzed according to the Click-IT EdU Plus instructions on an BD Cyan flow cytometer (Thermo Fisher Scientific). For colony formation assays, 2000 cells were split into individual wells of 6-well plates, cultured for 10–14 days, fixed with 4% PFA, and stained with 0.2% crystal violet in 70% ethanol. For induction of miR-203, 24 hr after plating, cells were supplied with fresh media containing doxycycline at 5 μg/ml. Sigma–Aldrich TRC lentiviral shRNAs against Hbegf and Pola1 were obtained from the Functional Genomic Facility (University of Colorado at Boulder, sequences listed in Supplementary file 2).
3′UTR luciferase assays
Request a detailed protocol3′UTR reporter constructs were generated by PCR amplification of 3′UTRs from cDNA or gDNA and subcloning of the fragments into pGL3-Control (Promega, Madison, WI) (primer sequences listed in Supplementary file 2). 2 ng renilla luciferase control, 20 ng pGL3-3′UTR reporter, and 380 ng of Krt14 empty vector, or Krt14-miR-203 were transiently cotransfected into keratinocytes in each well of a 12-well plate using Mirus Bio LT1 reagent (Mirus Bio LLC, Madison, WI). 24 hr later cell lysates were collected, and renilla and firefly luciferase activity were measured using Dual-Glo Luciferase Assay system (Promega) as described previously (Yi et al., 2008). Data are represented as the ratio of firefly to renilla RFU values, normalized to Pgl3-control values. Error bars represent propagated standard deviations.
DMBA/TPA carcinogenesis
Request a detailed protocolDMBA/TPA carcinogenesis was performed as described previously (Abel et al., 2009). The backskin of 7- to 9-week-old miR-203+/+ and miR-203−/− mice was shaved. 48 hr later the backskin was painted with a single dose of 25 μg of DMBA in 200 μl of Acetone. 2 weeks following DMBA treatment the mice began receiving bi-weekly treatments of 4 μg of TPA in acetone. The number of palpable tumors of at least 1 mm in diameter, persisting for at least 2 weeks, was recorded weekly. Tumor diameters were measured using a digital caliper. Following 21 weeks of TPA treatment, mice were euthanized and tumors were collected for HrasQ61l genotyping, OCT embedding, and paraffin embedding.
HrasQ61L genotyping of DMBA/TPA tumors
Request a detailed protocolTumor DNA was isolated by incubating the tissue in a DNA Lysis Buffer (400 mM NaCl, 0.1% SDS, 1 mM EDTA, 1 μg/ml Proteinase K) at 55°C for 4 hr. Lysates were then vortexed and lightly centrifuged to liberate DNA from the partially digest tumor tissue. The supernatant was then removed and subject to Phenol–chloroform extraction, followed by isopropanol precipitation. Isolated DNA pellets were then resuspended in TE buffer and quantified by UV spectrophotometry (10 mM Tris pH 8.0, 1 mM EDTA). The Hras gene was PCR amplified using primers that flank exon 2. Following amplification, the PCR reactions were digested with 5 units of XbaI restriction enzyme at 37°C. The reaction products were then resolved and visualized on a 3% agarose gel. DNA isolated from the tails of animals in the DMBA/TPA experiment was treated in parallel as a negative control for detection of the HrasQ61L mutation.
Statistical analysis
Request a detailed protocolStatistical analysis was performed using either R or Microsoft Excel. Statistical methods employed are indicated in the figure legends. Unpaired two-sided Student’s t-tests were used to assess statistical significance unless indicated otherwise in the figure legends. For comparisons with multiple categories, ANOVA was used with Tukey's HSD post-hoc test. Non-parametric Whitney–Mann U-tests were used to assess significance for the tumor multiplicity measurements (Abel et al., 2009). The hypergeometric test was used to assess the enrichment of gene lists in genome-wide studies. The Kolmogorov–Smirnov test was used to assess differences in cumulative distributions functions.
Data access
Request a detailed protocolAll sequencing and microarray data are deposited in the Gene Expression Omnibus (GSE66056).
Data availability
-
MicroRNA-203 represses selection and expansion of oncogenic HRas transformed tumor initiating cellsPublicly available at the NCBI Gene Expression Omnibus (Accession no: GSE66056).
References
-
Unravelling cancer stem cell potentialNature Reviews. Cancer 13:727–738.https://doi.org/10.1038/nrc3597
-
Targeting RAS signalling pathways in cancer therapyNature Reviews. Cancer 3:11–22.https://doi.org/10.1038/nrc969
-
Podoplanin is a novel fos target gene in skin carcinogenesisCancer Research 68:6877–6883.https://doi.org/10.1158/0008-5472.CAN-08-0299
-
Potential microRNA therapies targeting Ras, NFkappaB and p53 signalingCurrent Opinion in Molecular Therapeutics 12:147–157.
-
miR-203 represses “stemness” by repressing DeltaNp63Cell Death and Differentiation 15:1187–1195.https://doi.org/10.1038/cdd.2008.69
-
MicroRNAs can generate thresholds in target gene expressionNature Genetics 43:854–859.https://doi.org/10.1038/ng.905
-
Tumor-initiating stem cells of squamous cell carcinomas and their control by TGF-β and integrin/focal adhesion kinase (FAK) signalingProceedings of the National Academy of Sciences of USA 108:10544–10549.https://doi.org/10.1073/pnas.1107807108
-
Heparin-binding EGF-like growth factor promotes epithelial-mesenchymal transition in human keratinocytesThe Journal of Investigative Dermatology 132:2148–2157.https://doi.org/10.1038/jid.2012.78
-
Epithelial stem cell mutations that promote squamous cell carcinoma metastasisThe Journal of Clinical Investigation 123:4390–4404.https://doi.org/10.1172/JCI65856
Article and author information
Author details
Funding
National Institute of Arthritis and Musculoskeletal and Skin Diseases (NIAMS) (R01AR059697)
- Kent Riemondy
- Rui Yi
American Cancer Society (ACS) (124718-RSG-13-197-01-DDC)
- Rui Yi
National Institute of Arthritis and Musculoskeletal and Skin Diseases (NIAMS) (R01AR066703)
- Rui Yi
National Cancer Institute (NCI) (R01CA052607)
- Enrique C Torchia
- Dennis R Roop
National Institute of Arthritis and Musculoskeletal and Skin Diseases (NIAMS) (P30AR057212)
- Kent Riemondy
- Dennis R Roop
- Rui Yi
The funders had no role in study design, data collection and interpretation, or the decision to submit the work for publication.
Acknowledgements
We thank C Yang, J Gao, and D Feng for the generation of the miR-203 KO mouse. We thank members of the Yi laboratory for their critical discussions. We also thank P Muhlrad for critical reading of the manuscript.
Ethics
Animal experimentation: This study was performed in strict accordance with the recommendations in the Guide for the Care and Use of Laboratory Animals of the National Institutes of Health. All of the animals were handled according to approved institutional animal care and use committee (IACUC) protocols (#1408.01) of the University of Colorado, Boulder. Every effort was made to minimize suffering.
Copyright
© 2015, Riemondy et al.
This article is distributed under the terms of the Creative Commons Attribution License, which permits unrestricted use and redistribution provided that the original author and source are credited.
Metrics
-
- 0
- citations
Views, downloads and citations are aggregated across all versions of this paper published by eLife.
Download links
A two-part list of links to download the article, or parts of the article, in various formats.
Downloads (link to download the article as PDF)
Open citations (links to open the citations from this article in various online reference manager services)
Cite this article (links to download the citations from this article in formats compatible with various reference manager tools)
MicroRNA-203 represses selection and expansion of oncogenic Hras transformed tumor initiating cells
eLife 4:e07004.
https://doi.org/10.7554/eLife.07004


