STING mediates immune responses in the closest living relatives of animals
- Department of Microbiology, University of Texas Southwestern Medical Center, United States
- McDermott Center Bioinformatics Lab, University of Texas Southwestern Medical Center, United States
- Howard Hughes Medical Institute, and Department of Molecular and Cell Biology, University of California, Berkeley, United States
Figures
Figure 1 with 1 supplement

P. aeruginosa has pathogenic effects on M. brevicollis.
(A) Immunofluorescence illuminates the diagnostic cellular architecture of M. brevicollis, including an apical flagellum (f) made of microtubules, surrounded by an actin-filled microvilli feeding collar (co). Staining for tubulin (green) also highlights cortical microtubules that run along the periphery of the cell body, and staining for F-actin (magenta) highlights basal filopodia (fp). DNA staining (blue) highlights the nucleus (n). (B) M. brevicollis exhibits truncated flagella after exposure to P. aeruginosa. M. brevicollis were exposed to E. coli or P. aeruginosa for 24 hr, and then fixed and immunostained. Arrows point to flagella. Green: anti-tubulin antibody (flagella and cell body), magenta: phalloidin (collar), blue: Hoechst (bacterial and choanoflagellate nuclei). Scale bars represent 10 μm. Flagellar length was quantified using Fiji, and statistical analysis (unpaired t-tests) was performed in GraphPad software. (C) Exposure to P. aeruginosa, but not other Gammaproteobacteria, results in M. brevicollis cell death. Bacteria were added to M. brevicollis culture at an MOI of 1.5 (at Hours = 0), and M. brevicollis cell density was quantified at indicated time points. Data represent mean ± SD for three biological replicates. Statistical analysis (multiple unpaired t-tests) was performed in GraphPad software; p-values shown are from comparisons between Flavobacterium and P. aeruginosa. (D–F) M. brevicollis does not ingest P. aeruginosa bacteria. (D,E) M. brevicollis were fed either fluorescent E. coli (D) or P. aeruginosa (E) for 1 hr, and then visualized by DIC (D,E, left) and green fluorescence (D, E, right). Fluorescent food vacuoles were observed in choanoflagellates fed E. coli, but not P. aeruginosa. (F) M. brevicollis was exposed to GFP-expressing E. coli, V. parahaemolyticus, C. jejuni, or P. aeruginosa (MOI = 50) for 1 hr, and then imaged by DIC and green fluorescence to quantify number of cells with internalized bacteria. Choanoflagellate cells with ≥1 GFP+ food vacuole were scored as GFP+, and cells without any GFP+ food vacuoles were scored as GFP–. Data represent cells quantified over three biological replicates. (G,H) P. aeruginosa does not broadly inhibit M. brevicollis phagocytosis. (G) Internalization of 0.2 μm fluorescent beads was used to quantify phagocytic activity after exposure to E. coli or P. aeruginosa bacteria. Although cells did not phagocytose P. aeruginosa, cells exposed to E. coli and P. aeruginosa had similar phagocytic uptake of beads. Data represent n = 600 cells from three biological replicates. Statistical analyses (multiple unpaired t-tests) were performed in GraphPad software. (H) Exposure to P. aeruginosa does not inhibit phagocytic uptake of E. coli. Internalization of fluorescent E. coli or P. aeruginosa bacteria was quantified after exposure to unlabeled P. aeruginosa (PAO1 strain). Data represent n = 200 cells from two biological replicates. Statistical analysis (unpaired t-test) was performed in GraphPad software. (I) Secreted P. aeruginosa molecules are sufficient to induce M. brevicollis cell death. 5 % (vol/vol) bacterial conditioned medium was added to M. brevicollis culture (at Hours = 0), and M. brevicollis cell density was quantified at indicated time points. Data represent mean ± SD for three biological replicates. Statistical analysis (multiple unpaired t-tests) was performed in GraphPad software, and p-values shown are from comparisons between Flavobacterium and P. aeruginosa. (J) Sustained exposure to secreted P. aeruginosa molecules is required to induce M. brevicollis cell death. P. aeruginosa or Flavobacterium conditioned medium (5% vol/vol) was added to stationary-phase M. brevicollis cultures. After indicated times, cultures were washed and resuspended in fresh media. M. brevicollis cell density was quantified after 24 hr. The % survival is a measure of the cell density of P. aeruginosa-treated cells relative to Flavobacterium-treated controls. Data represent mean ± SD for three biological replicates.
Figure 1—figure supplement 1
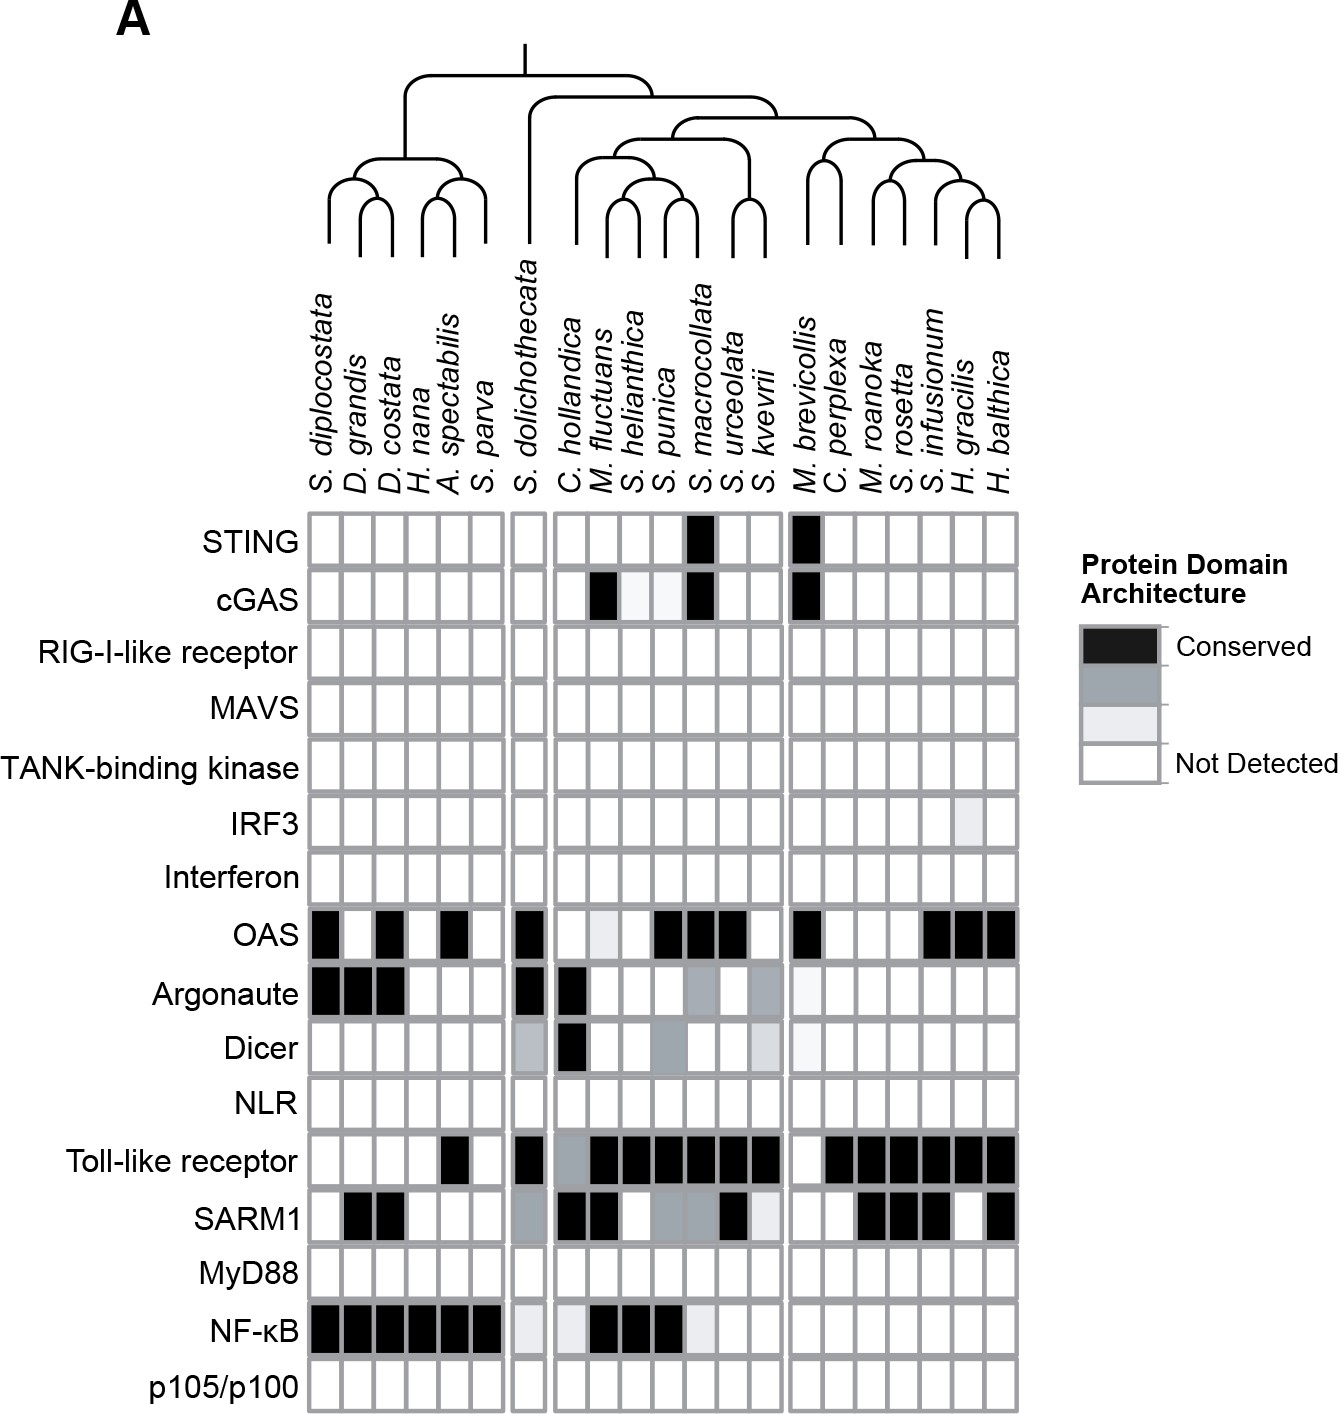
Presence of animal innate immune genes in choanoflagellates.
(A) The transcriptomes of 21 choanoflagellate species (Richter et al., 2018) were searched for genes that play key roles in animal innate immune responses. Evidence for gene presence was based on sequence homology in a BLAST-based approach and conserved domain architectures, as described in Richter et al., 2018.
Figure 2 with 1 supplement
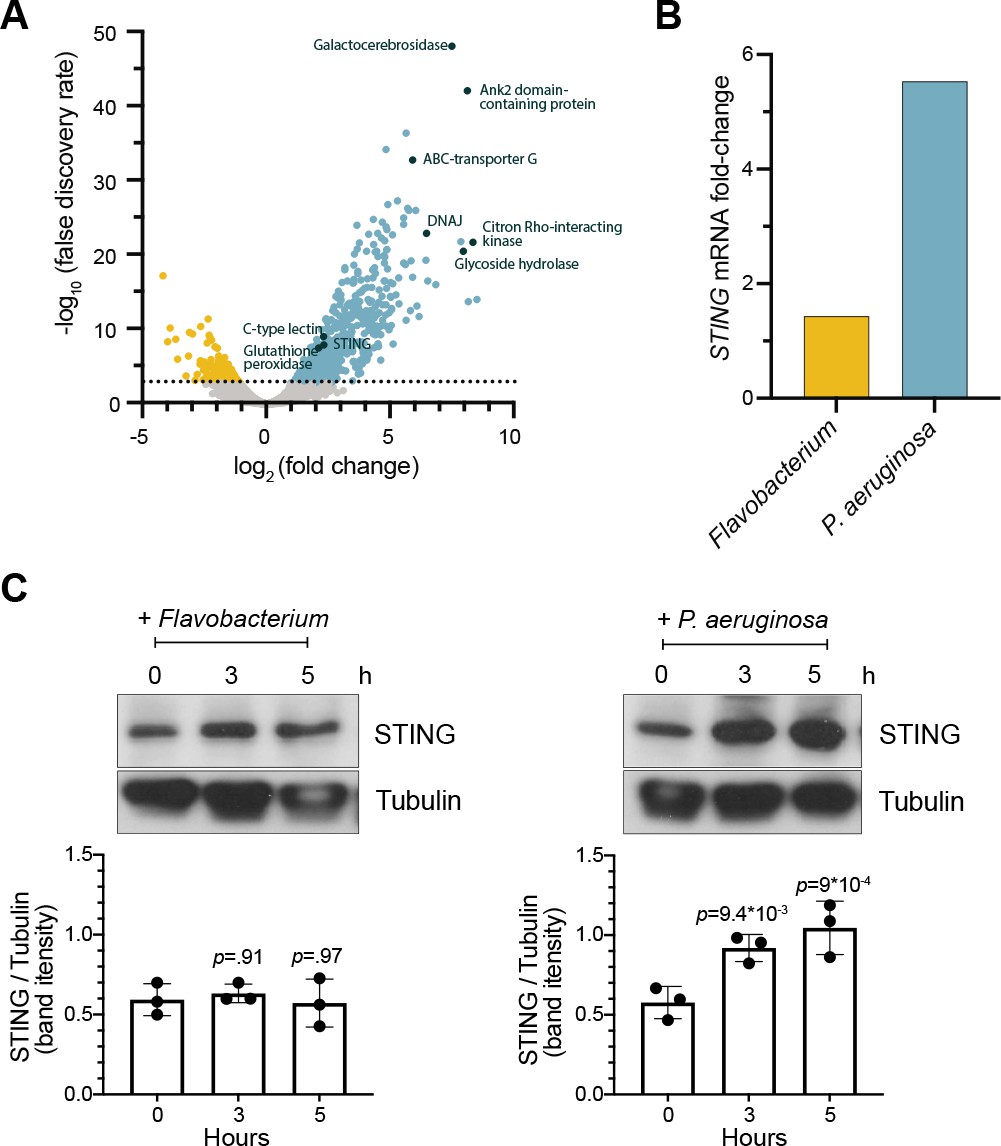
STING is upregulated in M. brevicollis after exposure to P. aeruginosa (A,B) STING transcript levels increase in response to P. aeruginosa.
(A) Volcano plot displaying genes differentially expressed between M. brevicollis exposed to P. aeruginosa PAO1 and Flavobacterium (control) conditioned medium for three hours. Differentially expressed genes are depicted by blue (674 upregulated genes) and yellow (232 downregulated genes) dots (fold change ≥2; FDR ≤ 1e–4). Select genes that are upregulated or may function in innate immunity are labeled. RNA-seq libraries were prepared from four biological replicates. (B) After a 3-hr treatment, STING mRNA levels (determined by RNA-seq) increase 1.42-fold in cells exposed to Flavobacterium conditioned medium and 5.54 fold in cells exposed to P. aeruginosa conditioned medium, compared to untreated controls. (C) STING protein levels increase after exposure to P. aeruginosa. STING levels were examined by immunoblotting at indicated timepoints after exposure to Flavobacterium or P. aeruginosa conditioned medium (5% vol/vol). Tubulin is shown as loading control, and intensity of STING protein bands were quantified relative to tubulin. Statistical analysis (one-way ANOVA, Dunnett’s multiple comparison) was performed in GraphPad software, and p-values shown are calculated using 0 hr timepoint as the control group.
Figure 2—figure supplement 1
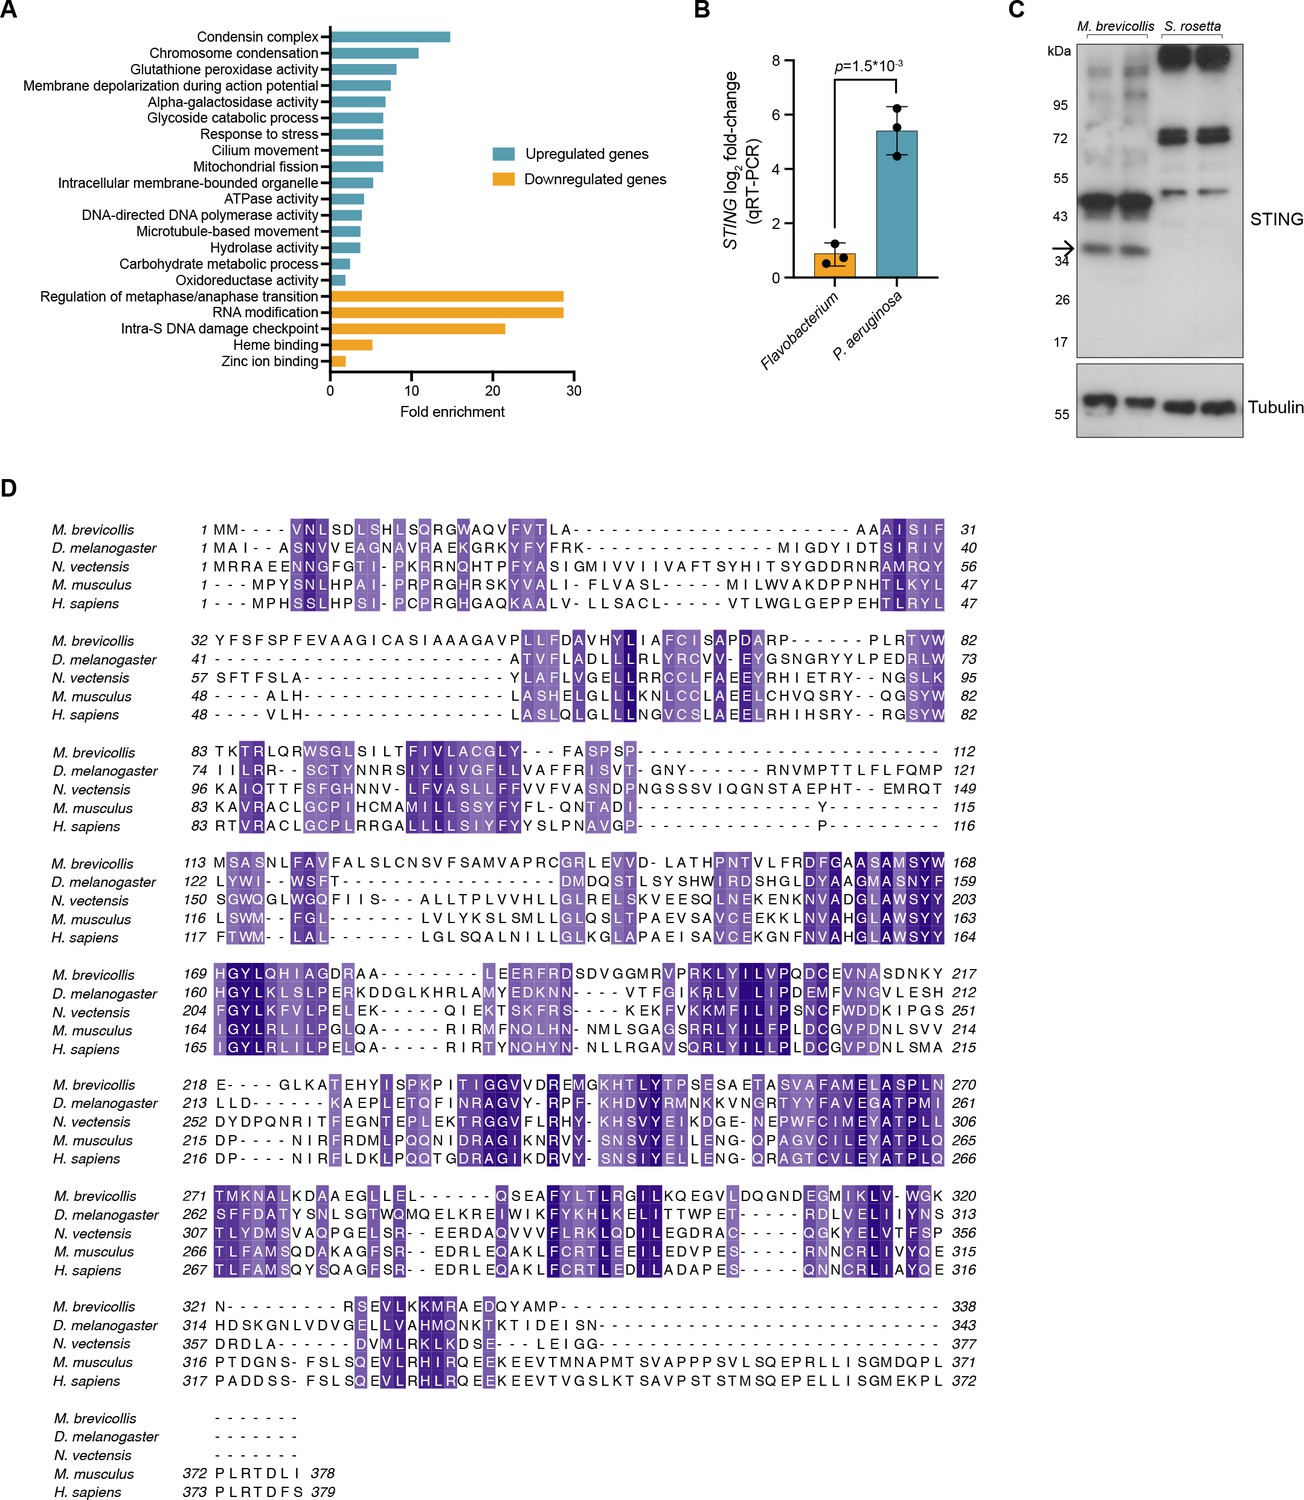
M. brevicollis response to P. aeruginosa, andSTING antibody validation and protein alignment.
(A) Gene ontology enrichmentanalysis of genes identified as differentially expressed (fold change≥2; FDR≤1e -4 ) afterexposure to P. aeruginosa. Due to lack of annotation, >40% of the differentiallyexpressed genes were not included in the enrichment analysis. (B) qRT-PCR validationof STING mRNA after exposure to Flavobacterium or P. aeruginosa conditioned mediafor 3 hr, compared to vehicle control. Error bars represent SD. Statisticalanalysis (t-test) was performed in GraphPad software (C) To validate the M. brevicollis STING antibody, cell lysates from M. brevicollis were immunoblotted alongside celllysates from S. rosetta, a closely-related choanoflagellate species that does not have aSTING homolog. A band at 36kD, the predicted size of M. brevicollis STING, is detectable in M. brevicollis lysate but not S. rosetta lysate. Arrow indicates STING band.Non-specific bands are likely due to co-cultured feeding bacteria. Tubulin is shown asloading control. (D) Protein sequence alignment (generated by Clustal Omega multiplesequence alignment) of M. brevicollis and animal STING proteins, colored by similarity. M. brevicollis STING and human STING are 19.1% identical and 36.6% similar at the amino acid level.
Figure 3 with 1 supplement
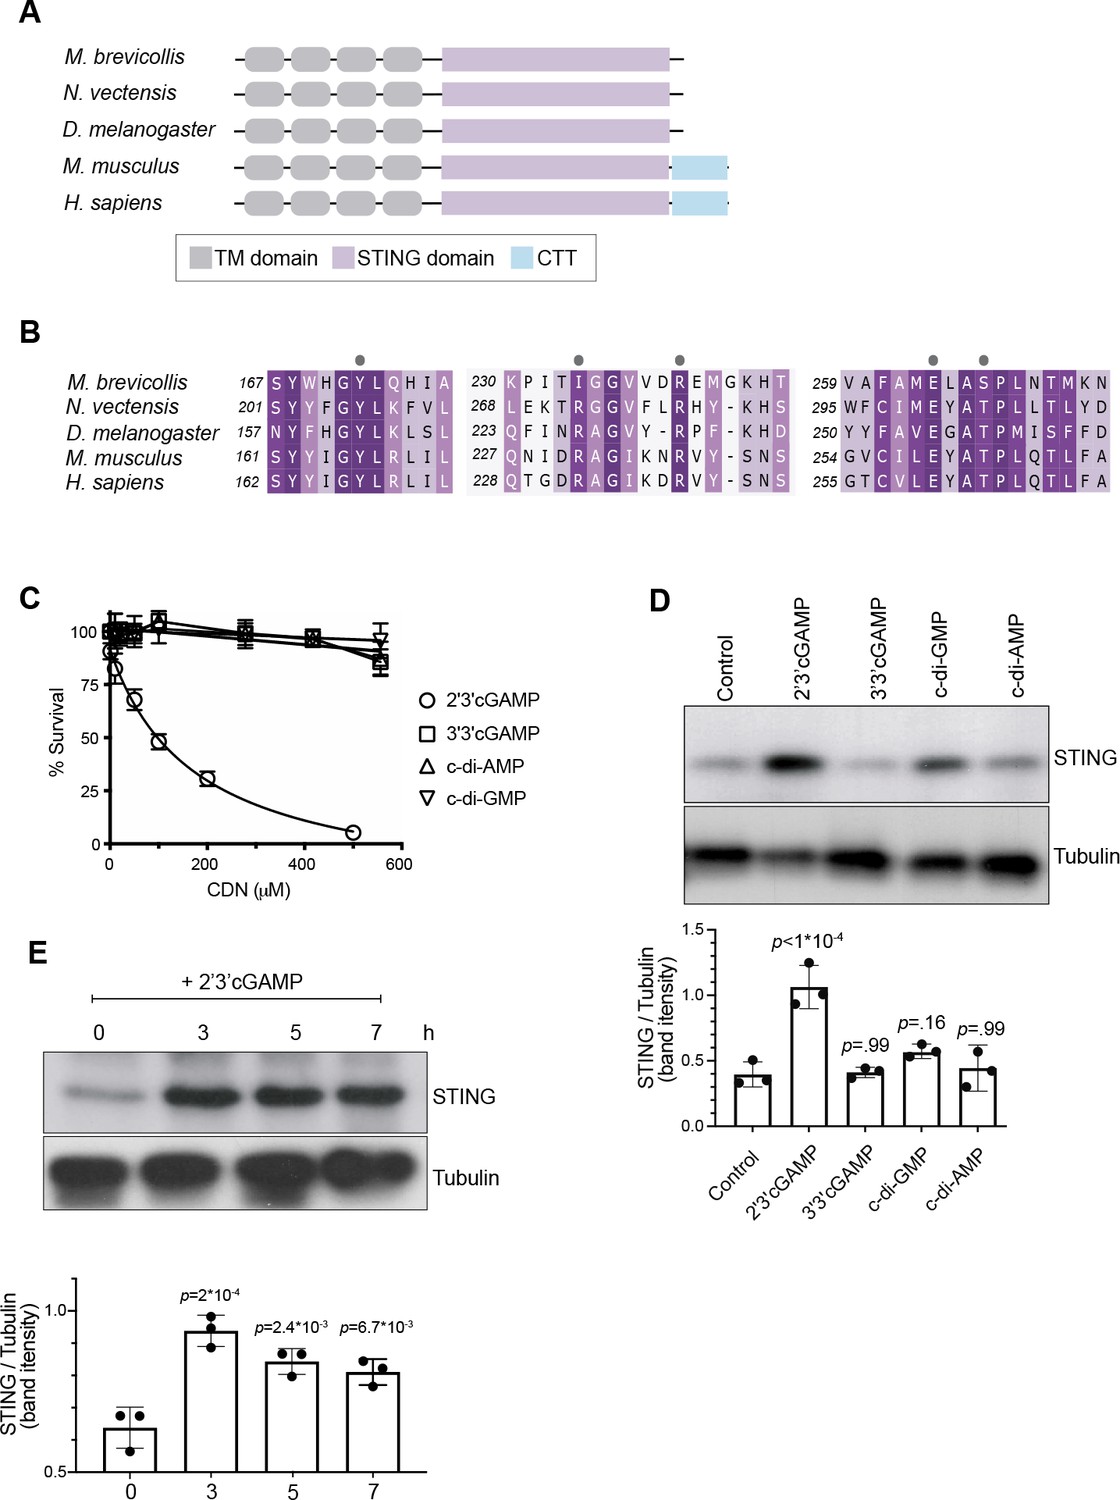
2’3’ cGAMP, but not bacterially produced cyclic dinucleotides, induces elevated levels of STING.
(A) Schematic of choanoflagellate (M. brevicollis), sea anemone (N. vectensis), insect (D. melanogaster), and mammalian (M. musculus and H. sapiens) STING proteins. Transmembrane (TM) domains are depicted in gray, STING cyclic dinucleotide binding domain (CDN) in purple, and C-terminal tail domain (CTT) in blue. (B) Partial protein sequence alignment (generated by Clustal Omega multiple sequence alignment) of M. brevicollis and animal STING proteins, colored by similarity. M. brevicollis STING and human STING are 19.1 % identical and 36.6 % similar at the amino acid level. Key cyclic dinucleotide-interacting residues from human STING structure are indicated by circles. (C) Dose-response curves of M. brevicollis exposed to cyclic dinucleotides for 24 hr reveal that treatment with 2’3’cGAMP, but not 3’3’ cGAMP, c-di-AMP, or c-di-GMP, leads to M. brevicollis cell death in a dose-dependent manner. Data represent mean ± SD for at least three biological replicates. (D) STING protein levels increase after exposure to 2’3’cGAMP, but not bacterially produced cyclic dinucleotides. M. brevicollis STING levels were examined by immunoblotting 5 hr after exposure to 2’3’cGAMP (100 µM), 3’3’cGAMP (200 µM), c-di-GMP (200 µM), or c-di-AMP (200 µM). Tubulin is shown as loading control, and intensity of STING protein bands were quantified relative to tubulin. Shown is a representative blot from three biological replicates. Statistical analysis (one-way ANOVA, Dunnett’s multiple comparison) was performed in GraphPad software. (E) STING protein levels increase and remain elevated after exposure to 100 µM 2’3’cGAMP. Tubulin is shown as loading control, and data are representative of three biological replicates. Statistical analysis (one-way ANOVA, Dunnett’s multiple comparison) was performed in GraphPad software, and p-values shown are calculated using 0 hr timepoint as control group.
Figure 3—figure supplement 1
M. brevicollis has distinct responses to 2’3’ cGAMP and 3’3’ cGAMP.
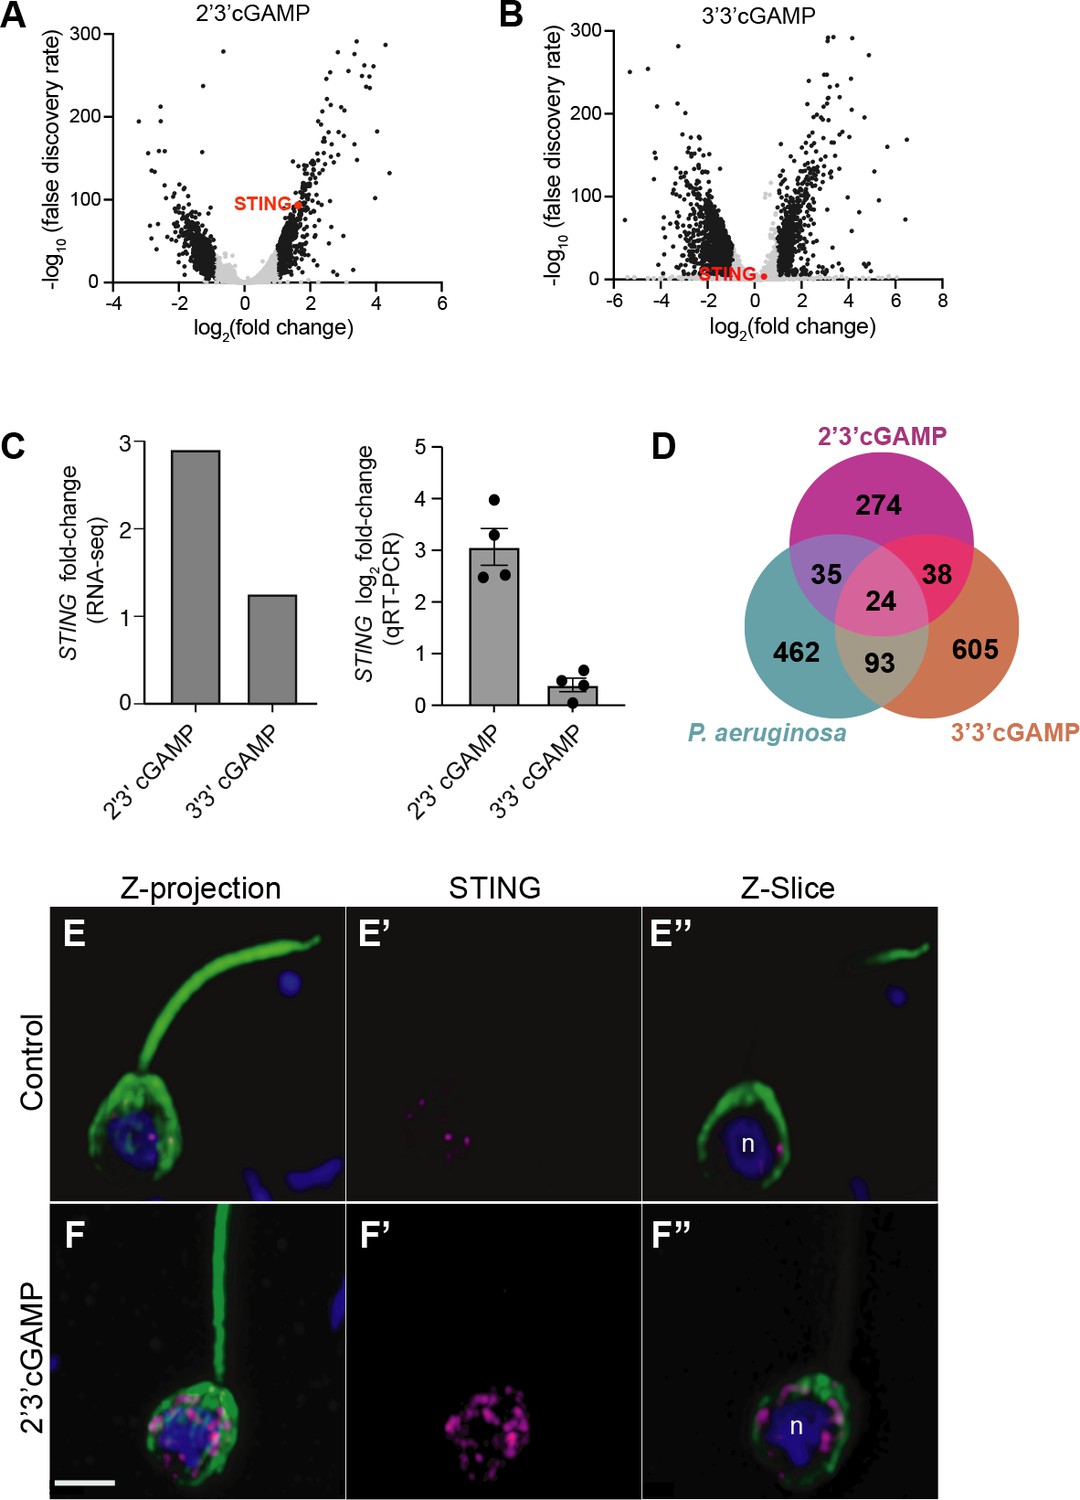
(A,B) Volcano plots displaying RNA-seq differential expression analysis of M. brevicollis treated with (A) 100 µM 2’3’cGAMP or (B) 200 µM 3’3’cGAMP for 3 hr, relative to an untreated control. Genes with a fold change ≥2 and false discovery rate ≤10e–4 are depicted by black dots. STING is highlighted in red. RNA-seq libraries were prepared from three (2’3’ cGAMP) or two (3’3’ cGAMP) biological replicates. (C) M. brevicollis STING mRNA levels increase in response to 2’3’cGAMP. (Left) RNA-seq fold change of STING mRNA after exposure to 100 µM 2’3’cGAMP or 200 µM 3’3’cGAMP for 3 hr, compared to vehicle control. (Right) qRT-PCR fold change of STING mRNA after exposure to 100 µM 2’3’cGAMP or 200 µM 3’3’cGAMP for 3 hr, compared to vehicle control. (D) Venn diagram comparing the overlap of genes identified as differentially expressed after treatment with 2’3’cGAMP, 3’3’cGAMP, and P. aeruginosa (DEG cutoff: fold change ≥3, false discovery rate ≤10e–4). (E,F) Representative immunostained M. brevicollis demonstrating 2’3’cGAMP stimulates the formation of STING puncta at perinuclear regions. M. brevicollis was left untreated (E), or exposed to 100 µM 2’3’cGAMP (F) for 5 hr. Cells were fixed and STING levels and localization were probed using an anti-STING antibody. (E’,F’) Exposure to 2’3’cGAMP results in increased numbers of STING puncta compared to untreated controls. (E’’,F’’) Z-slice images of the plane containing the nucleus ‘n’ show that STING puncta localize to perinuclear regions. Green: anti-tubulin antibody (flagella and cell body), magenta: anti-STING antibody, blue: Hoechst. Scale bar represents 2 µm.
Figure 4
Transfection reveals STING localization to perinuclear and endoplasmic reticulum regions.
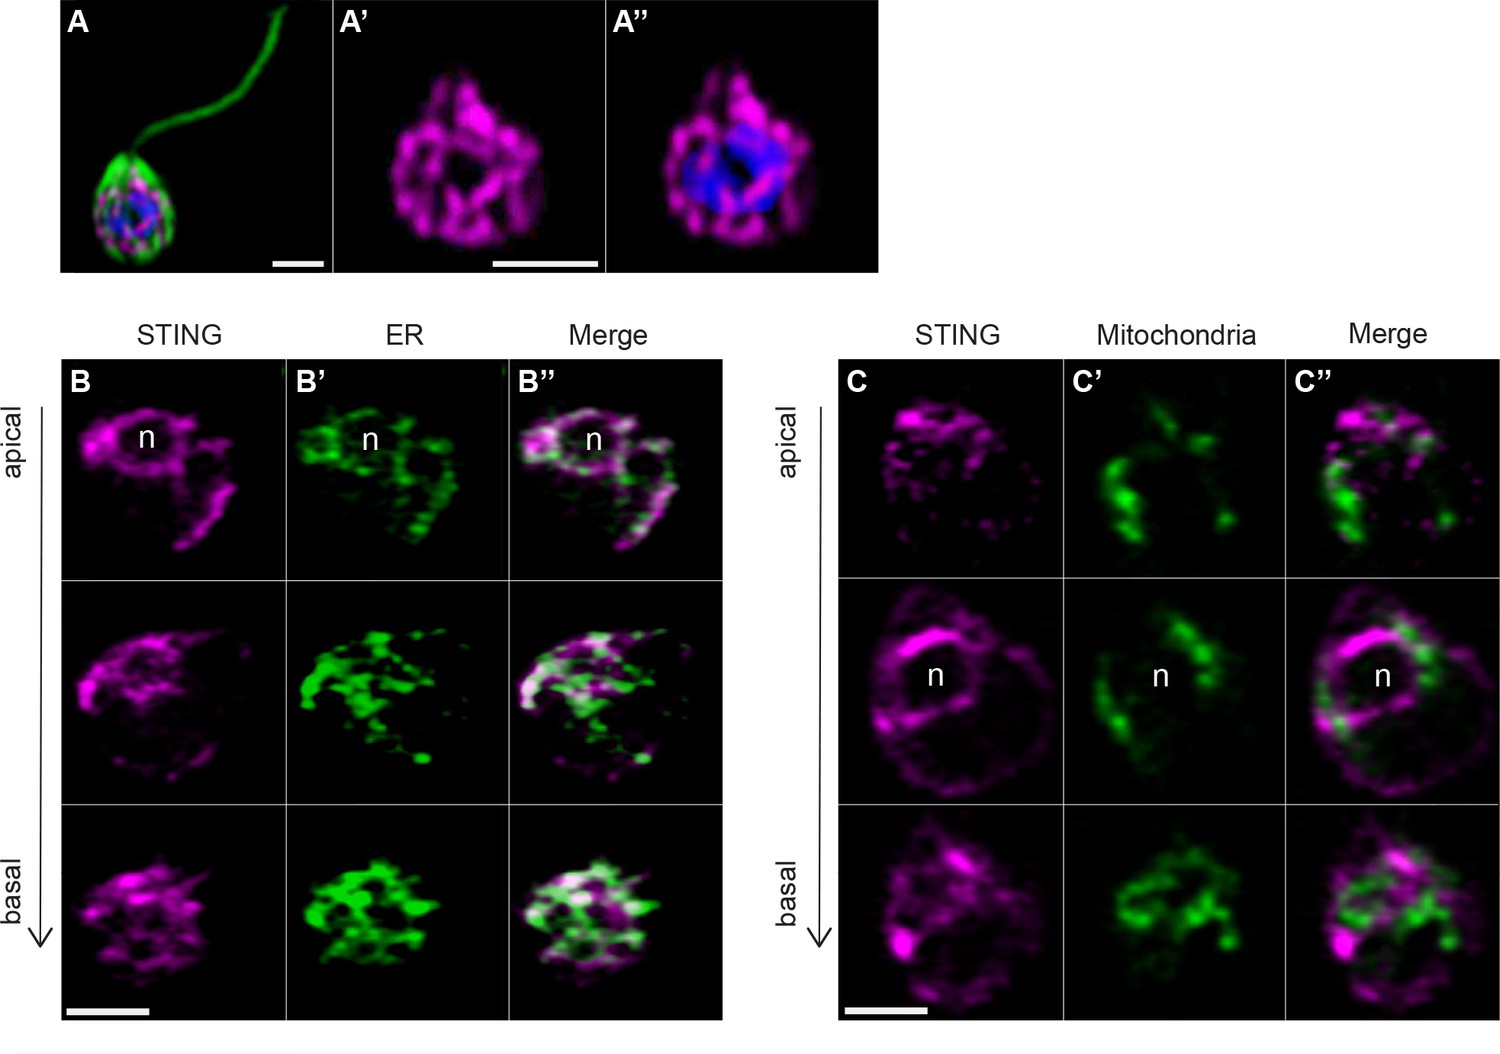
(A) STING-mTFP localizes to tubule-like structures around the nucleus in cells stably expressing STING-mTFP. Green: anti-tubulin antibody (flagella and cell body), magenta: anti-STING antibody, blue: Hoechst. Scale bar represents 2 µm. (B,C) Fluorescent markers and live cell imaging reveal that STING is localized to the endoplasmic reticulum (ER). Cells were co-transfected with STING-mTFP and an mCherry fusion protein that localizes either to the endoplasmic reticulum (B; mCherry-HDEL) or mitochondria (C; Cox4-mCherry) (King et al., 2008). Cells were recovered in the presence of Flavobacterium feeding bacteria for 28 hr after co-transfection, and then live cells were visualized with super-resolution microscopy. Each panel shows Z-slice images of a single representative cell. In confocal Z-slice images, cells are oriented with the apical flagella pointing up, and the nucleus is marked by ‘n’ when clearly included in the plane of focus. STING colocalized with the ER marker (B’’), but not the mitochondrial marker (C’’). Scale bar represents 2 µm.
Figure 5 with 1 supplement
STING mediates responses to 2’3’cGAMP and P. aeruginosa.
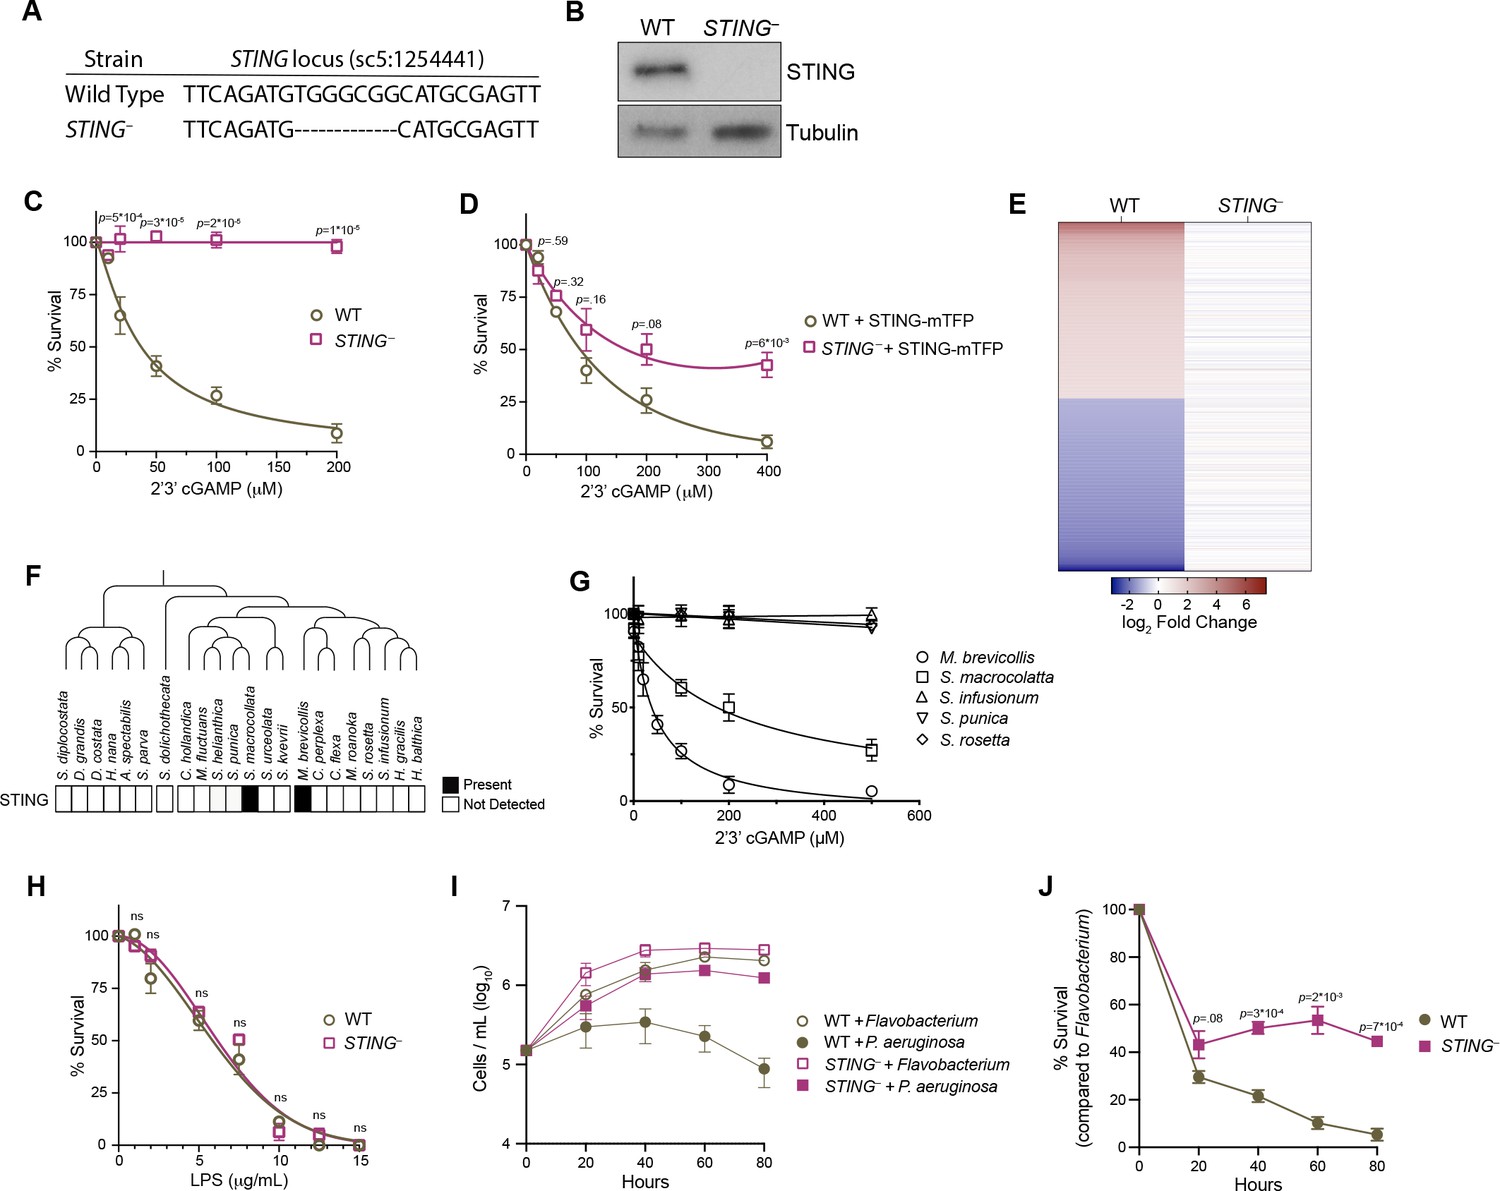
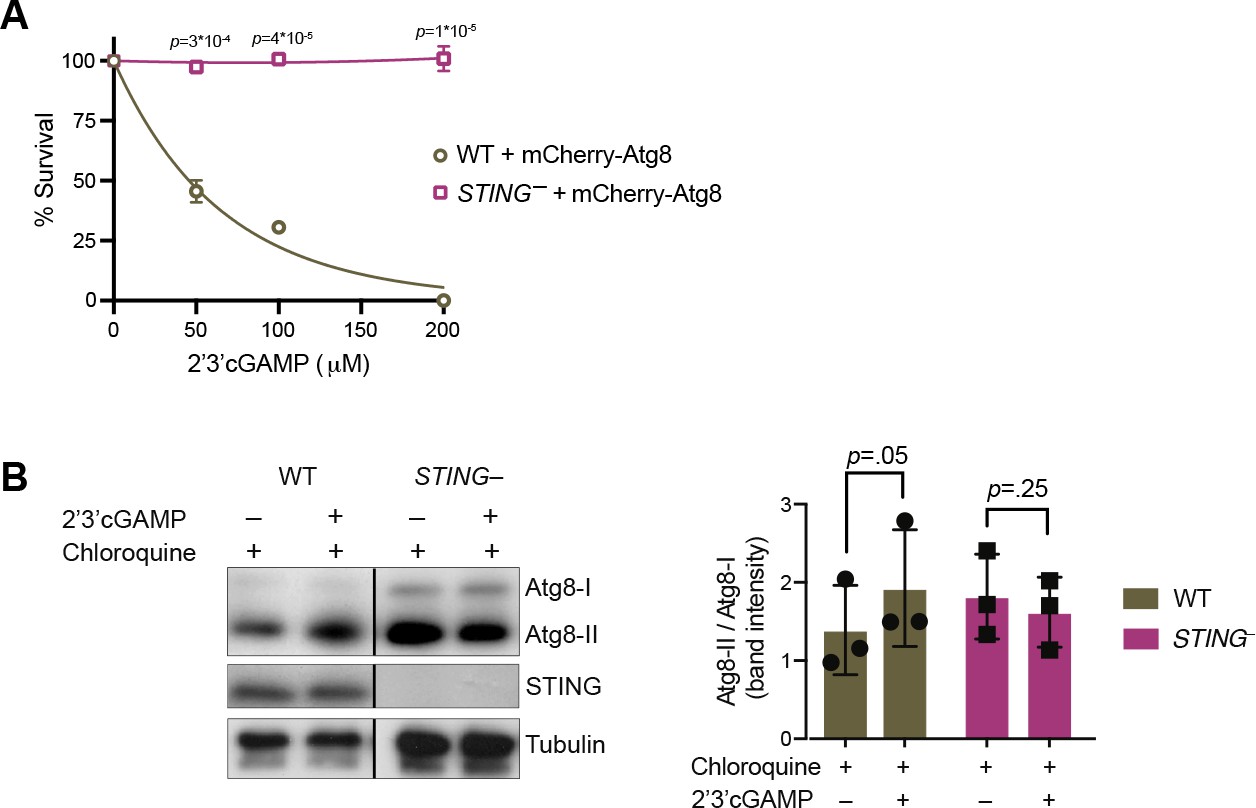
(A) The genotypes of wild type and genome-edited STING– strains at the STING locus. (B) STING protein is not detectable by immunoblot in STING– cells. Shown is a representative blot from three biological replicates. (C,D) STING is necessary for 2’3’cGAMP-induced cell death. (C) Wild type and STING– strains were treated with increasing concentrations of 2’3’cGAMP, and survival was quantified after 24 hr. In contrast to wild type cells, 2’3’cGAMP does not induce cell death in STING– cells. Data represent mean ± SD for four biological replicates. (D) Wild type and STING– cells were transfected with STING-mTFP, and treated with puromycin to generate stable clonal strains. Stable expression of STING-mTFP in STING– cells partially rescued the phenotype of 2’3’cGAMP-induced cell death. Data represent mean ± SD for three biological replicates. Statistical analysis (multiple unpaired t-tests) was performed in GraphPad software. (E) Wild type and STING– strains have distinct transcriptional responses to 2’3’ cGAMP. Differential expression analysis was performed on wild type and STING– cells treated with 100 µM 2’3’cGAMP or a vehicle control for 3 hr. A heatmap comparing the log2 fold change of genes identified as differentially expressed (FC ≥2; FDR ≤ 10–4) in wild-type cells after 2’3’ cGAMP treatment, to their log2 fold change in STING– cells after 2’3’ cGAMP treatment. RNA-seq libraries were prepared from two biological replicates. (F) Presence of STING in the transcriptomes of diverse choanoflagellate species. Data from Richter et al., 2018. (G) Effects of 2’3’cGAMP on different choanoflagellate species. Choanoflagellates were grown to late-log phase, and treated with increasing concentrations of 2’3’cGAMP. Survival was quantified after 24 hr. 2’3’cGAMP only affected the survival of M. brevicollis and S. macrocollata, the two sequenced choanoflagellate species with a STING homolog. Data represent mean ± SD for three biological replicates. (H) Wild type and STING– cells have similar survival responses to LPS, suggesting that STING is not required for mediating a response to LPS. Wild type and STING– strains were treated with increasing concentrations of E. coli LPS, and survival was quantified after 24 hr. Data represent mean ± SD for four biological replicates. Statistical analysis (multiple unpaired t-tests) was performed in GraphPad software. (I,J) STING renders M. brevicollis more susceptible to P. aeruginosa-induced growth inhibition. (I) Wild type and STING– cells were exposed to control Flavobacterium or P. aeruginosa conditioned medium (5% vol/vol), and cell densities were quantified at indicated time points. Data represent mean ± SD for three biological replicates. (J) Percent survival calculated from growth curves in (I). Statistical analysis (multiple unpaired t-tests) was performed in GraphPad software.
Figure 5—figure supplement 1
Characterizing STING– M. brevicollis.
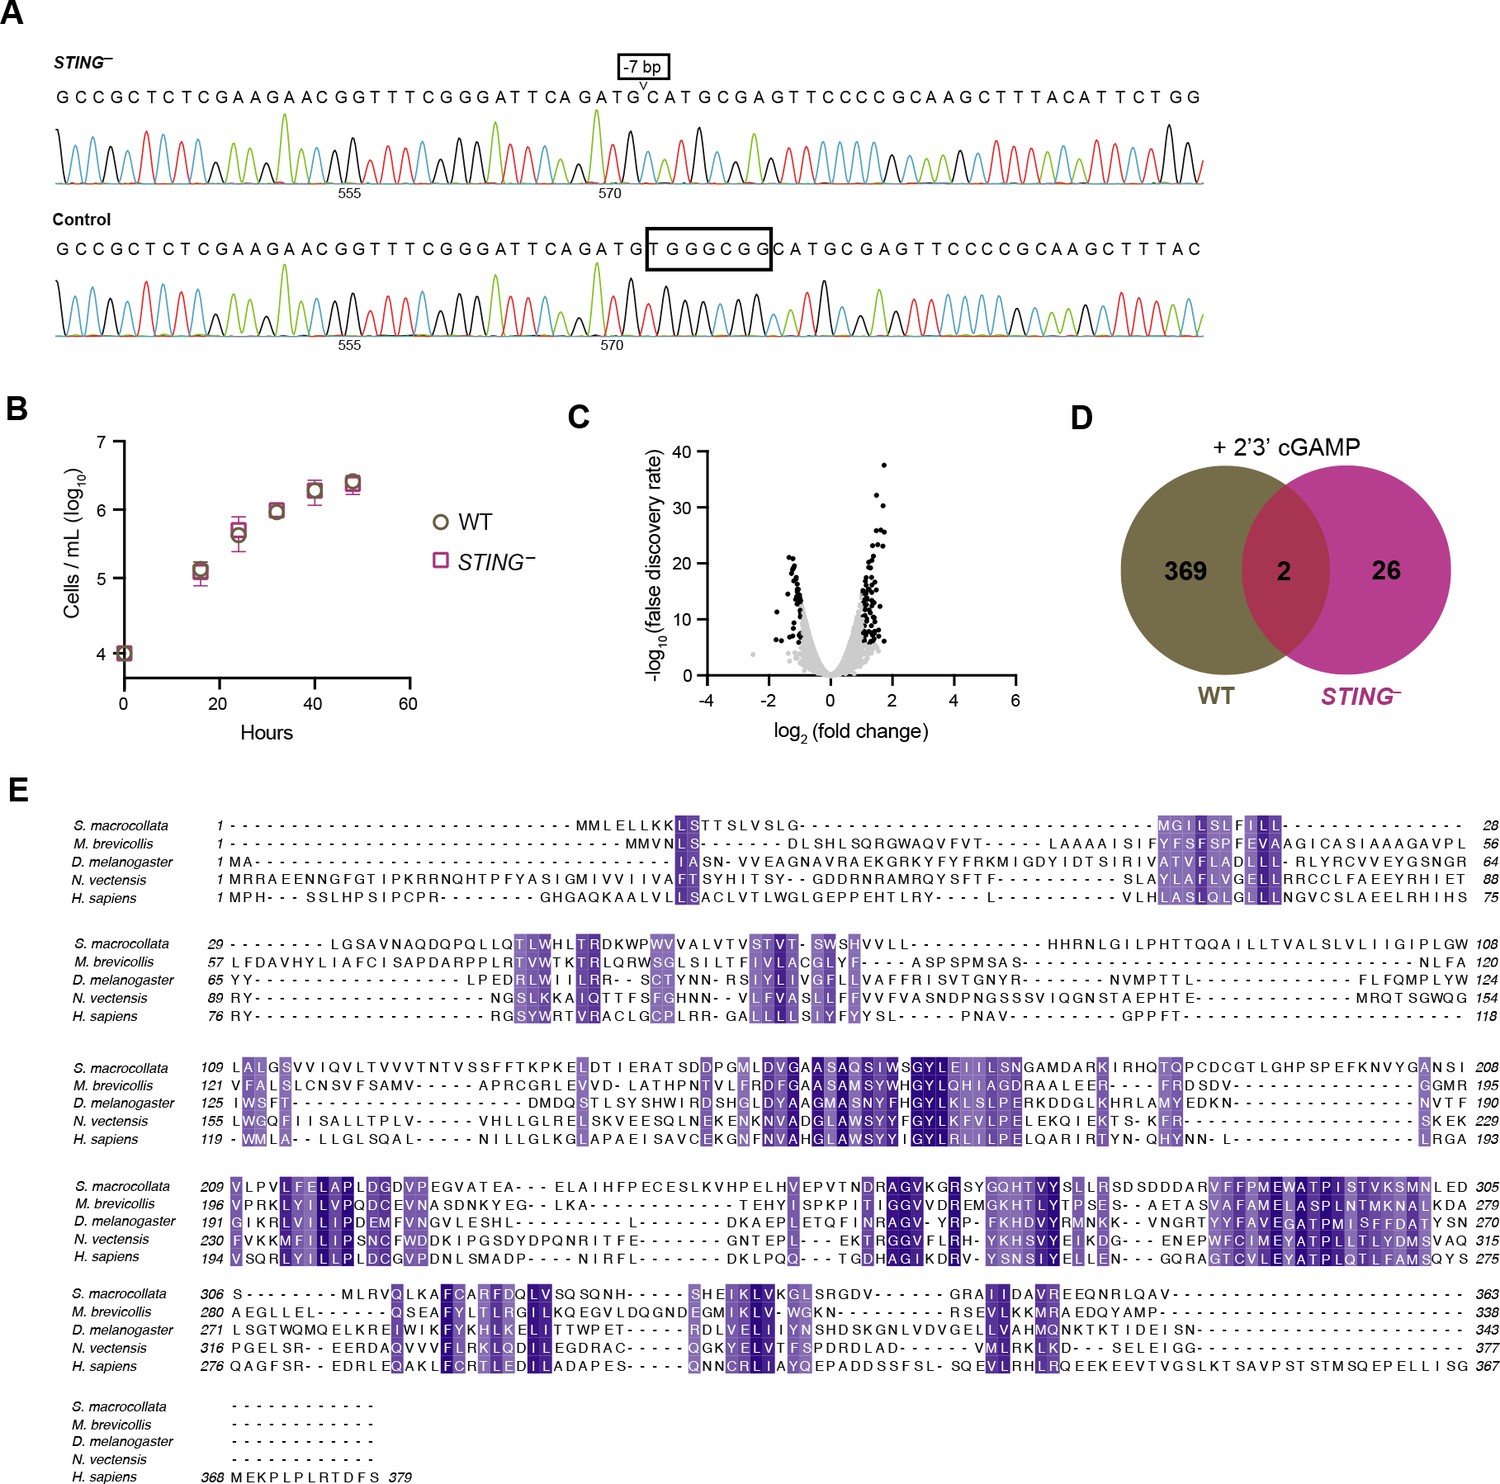
(A) Sanger sequences of the consensus genotype at the site of gene editing in wild type and STING– cells. STING– cells have a seven base-pair deletion that leads to premature stop codons. (B) Growth curves of wild type and STING– cells indicate that both strains have similar growth dynamics. Statistical analysis (multiple unpaired t-tests) was performed in GraphPad software. (C) Volcano plot displaying RNA-seq differential expression analysis of STING– cells treated with 100 µM 2’3’cGAMP for 3 hr, relative to an untreated control. Genes with a fold change ≥2 and false discovery rate ≤10e–4 are depicted by black dots. RNA-seq libraries were prepared from two biological replicates. (D) Venn diagram comparing the overlap of genes identified as differentially expressed (FC ≥3; FDR ≤ 10–4) after treatment with 2’3’cGAMP in wild type and STING– cells. (E) Protein sequence alignment (generated by Clustal Omega multiple sequence alignment) of STING proteins from choanoflagellates S. macrocollata and M. brevicollis and animals, colored by similarity.
Figure 6 with 1 supplement

STING mediates 2’3’cGAMP-induced autophagic pathway.
(A) 2’3’cGAMP-induced Atg8 lipidation requires STING. WT and STING– cells stably expressing mCherry-Atg8 were treated with a vehicle control or 100 µM 2’3’cGAMP for 3 hr, followed by immunoblotting. The band intensity of Atg8-I (unmodified Atg8) and Atg8-II (lipidated Atg8) were quantified for each sample. Relative levels of Atg8 lipidation were assessed by dividing the band intensities of Atg8-II/Atg8-I. Tubulin is shown as loading control. Immunoblot is representative of three biological replicates. (B) 2’3’cGAMP induces Atg8 lipidation in chloroquine-treated wild type cells. WT cells stably expressing mCherry-Atg8 were first incubated with 40 mM chloroquine for 6 hr, and then treated with a vehicle control or 100 µM 2’3’cGAMP for 3 hr in the presence of chloroquine, followed by immunoblotting. For each sample, relative levels of Atg8 lipidation were assessed by dividing the band intensities of Atg8-II/Atg8-I. Tubulin is shown as loading control. Immunoblot is representative of three biological replicates. For a representative immunoblot and quantification of Atg8-II/Atg8-I levels in chloroquine-treated STING– cells, refer to Figure 6—figure supplement 1B. (C–G) STING is required for 2’3’cGAMP-induced autophagosome formation. (C–F) WT and STING– cells stably expressing mCherry-Atg8 were treated with a vehicle control or 100 µM 2’3’cGAMP for 3 hr, and then fixed and immunostained. (C,D) Representative confocal images of wild-type cells show that Atg8 puncta accumulate after 2’3’cGAMP treatment. Magenta: mCherry-Atg8; Green: anti-tubulin antibody (flagella and cell body). (E,F) Representative confocal images of STING– cells show that Atg8 remains evenly distributed in the cytoplasm after 2’3’cGAMP treatment. (G) The number of Atg8 puncta/cell was quantified for WT and STING– cells treated with a vehicle control or 2’3’cGAMP for 3 hr. Data represent cells quantified from two biological replicates (n = 150 cells per treatment group). Statistical analyses (unpaired two-tailed t-tests) were performed in GraphPad software. (H) Treatment with lysosomotropic agents that inhibit autophagy rescue 2’3’ cGAMP-induced cell death in wild-type cells. WT and STING– cells were pre-treated with 40 mM chloroquine, 10 mM NH4Cl, or a vehicle control for 6 hr. Cells were then exposed to either 100 µM 2’3’cGAMP or a vehicle control for 18 hr before quantifying survival. Data represent mean ± SD for three biological replicates. Statistical analyses (multiple unpaired t-tests) were performed in GraphPad software.
Figure 6—figure supplement 1
STING mediates 2’3’cGAMP-induced autophagic signaling.
(A) Overexpression of mCherry-Atg8 does not alter the susceptibility of wild type and STING– strains to 2’3’cGAMP. Wild type and STING– strains stably expressing mCherry-Atg8 were treated with increasing concentrations of 2’3’cGAMP, and survival was quantified after 24 hr. Data represent mean ± SD for two biological replicates. (B) 2’3’cGAMP does not induce increased Atg8 lipidation in chloroquine-treated STING– cells. STING– cells stably expressing mCherry-Atg8 were incubated with 40 mM chloroquine for 6 hr, and then treated with a vehicle control or 100 µM 2’3’cGAMP for 3 hr in the presence of chloroquine, followed by immunoblotting. For each sample, relative levels of Atg8 lipidation were assessed by dividing the band intensities of Atg8-II/Atg8-I. Tubulin is shown as loading control. Immunoblot is representative of three biological replicates. Statistical analyses (unpaired two-tailed t-tests) were performed in GraphPad software. Source data 1. Uncropped western blots for: Figure 2—figure supplement 1, Figures 2C, 3D, E, 5B, 6A, B and - supplement1B.
Videos
Video 1
Supplementary file 1.
P. aeruginosa influences M. brevicollis motility. Movies depicting M. brevicollis cultures after exposure to E. coli or P. aeruginosa bacteria for 16 hours. In the absence of pathogenic bacteria,M. brevicollis is a highly motile flagellate and swims up in the water column (Movie 1). However, co-culturing M. brevicollis with P. aeruginosa results in reduced motility and cell settling (Movie 2).
Tables
Table 1
Bacteria screened for pathogenic effects.
| Bacterium | Pathogenic effects | Reference or details | Source |
|---|---|---|---|
| Aeromonas hyrophila | – | Environmental isolate | This study |
| Bacillus aquimaris | – | Environmental isolate | This study |
| Bacillus badius | – | Mouse isolate | Julie Pfeiffer |
| Bacillus cereus | – | Environmental isolate | This study |
| Bacillus indicus | – | Environmental isolate | This study |
| Bacillus marisflavi | – | Environmental isolate | This study |
| Bacillus pumilus | – | Mouse isolate | Julie Pfeiffer |
| Bacillus safensis | – | Mouse isolate | Julie Pfeiffer |
| Bacillus subtilus | – | ATCC 6633 | Julie Pfeiffer |
| Bacteroides acidifaciens | – | Mouse isolate | Julie Pfeiffer |
| Burkholderia multivorans | – | ATCC 17616 | David Greenberg |
| Campylobacter jejuni GFP | – | DRH3123 | David Hendrixson |
| Deinococcus sp. | – | Environmental isolate | This study |
| Enterococcus cloacae | – | Mouse isolate | Julie Pfeiffer |
| Enterococcus faecium | – | Mouse isolate | Julie Pfeiffer |
| Escherichia coli BW25113 | – | Datsenko and Wanner, 2000 | David Greenberg |
| Escherichia coli DH5a GFP | – | David Hendrixson | |
| Escherichia coli ECC-1470 | – | Leimbach et al., 2015 | Julie Pfeiffer |
| Escherichia coli K12 | – | ATCC 10798 | Julie Pfeiffer |
| Flavobacterium sp. | – | King et al., 2008 | Isolated from ATCC PRA-258 |
| Lactobacillus johnsonii | – | Mouse isolate | Julie Pfeiffer |
| Pseudoalteromonas sp. | – | Environmental isolate | This study |
| Pseudomonas aeruginosa PA-14 | + | Rahme et al., 1995 | Andrew Koh |
| Pseudomonas aeruginosa PAO1 | + | ATCC 15692 | David Greenberg |
| Pseudomonas aeruginosa PAO1-GFP | + | Bloemberg et al., 1997 | David Greenberg |
| Pseudomonas granadensis | – | Environmental isolate | This study |
| Staphylococcus aureus | – | ATCC 23235 | Julie Pfeiffer |
| Staphylococcus sp. | – | Mouse isolate | Julie Pfeiffer |
| Vibrio alginolyticus | – | Environmental isolate | Kim Orth |
| Vibrio furnissii | – | Environmental isolate | This study |
| Vibrio parahaemolyticus | – | Environmental isolate | This study |
| Vibrio parahaemolyticus RimD-GFP | – | Ritchie et al., 2012 | Kim Orth |
| Vibrio ruber | – | Environmental isolate | This study |
| Vibrio sp. | – | Environmental isolate | This study |
Table 2
P. aeruginosa deletion strains.
| Effects on M. brevicollis | ||||
|---|---|---|---|---|
| Strain name | Gene | Putative ORF function | Truncated Flagellum/Settling | Cell Death |
| MPAO1 | parent to library stain | + | + | |
| PW5035 | pvdE | pyoverdine biosynthesis protein PvdE | + | + |
| PW5034 | pvdE | pyoverdine biosynthesis protein PvdE | + | + |
| PW1059 | exoT | exoenzyme T | + | + |
| PW3078 | toxA | exotoxin A precursor | + | + |
| PW3079 | toxA | exotoxin A precursor | + | + |
| PW4736 | exoY | adenylate cyclase ExoY | + | + |
| PW4737 | exoY | adenylate cyclase ExoY | + | + |
| PW6886 | rhlA | rhamnosyltransferase chain A | + | + |
| PW6887 | rhlA | rhamnosyltransferase chain A | + | + |
| PW7478 | exoS | exoenzyme S | + | + |
| PW7479 | exoS | exoenzyme S | + | + |
| PW7303 | lasB | elastase LasB | + | + |
| PW7302 | lasB | elastase LasB | + | + |
| PW3252 | aprA | alkaline metalloproteinase precursor | + | + |
| PW3253 | aprA | alkaline metalloproteinase precursor | + | + |
| PW4282 | lasA | LasA protease precursor | + | + |
| PW4283 | lasA | LasA protease precursor | + | + |
| RP436 | popB | T3SS translocase | + | + |
| RP576 | exoS, exoT, exoY | T3SS effector molecules | + | + |
Table 3
M. brevicollis response to P. aeruginosa factors.
| Treatment | Cell Death | Interpretation |
|---|---|---|
| Live P. aeruginosa | ++ | |
| P. aeruginosa conditioned media (CM) | ++ | Factor(s) are secreted by P. aeruginosa |
| P. aeruginosa outer membrane vesicles | – | Factor(s) are not present in outer membrane vesicles |
| CM, boiled 20 min | ++ | Factor(s) are not heat labile |
| CM+ proteinase K, followed by 80 C for 30 min | ++ | Factor(s) are not proteins |
| CM+ DNAse and RNAse | ++ | Factor(s) are not nucleic acids |
| CM MeOH extraction | ++ | Factor(s) are organic compounds |
Key resources table
| Reagent type (species) or resource | Designation | Source or reference | Identifiers | Additional information |
|---|---|---|---|---|
| Strain, strain background (M. brevicollis) | M. brevicollis | ATCC PRA-258 | PMID:18276888 | |
| Genetic reagent, (M. brevicollis) | M. brevicollis STING– | This study | STING–knockout strain; cell line maintained by A. Woznica | |
| Transfected construct (M. brevicollis) | pEFL5’-pac-P2A-STING-mTFP-3'act | This study | Construct to express M, brevicollis STING fused to mTFP; can be obtained from A. Woznica | |
| Transfected construct (M. brevicollis) | pEFL5’-pac-P2A-mCherry-Atg8-–3'act | This study | Construct to express mCherry fused to M. brevicollis Atg8; can be obtained from A. Woznica | |
| Strain, strain background (Flavobacterium) | Flavobacterium sp. | This study | Isolated from MX1 (ATCC PRA-258) culture; can be obtained from A. Woznica | |
| Strain, strain background (Pseudomonas aeruginosa) | PAO1 | ATCC 15692 | PMID:13961373 | |
| Strain, strain background (P. aeruginosa, transgenic strain) | PAO1-GFP | ATCC 15692GFP | PMID:9361441 | |
| Antibody | anti-choano STING (rabbit polyclonal) | This study | Generated by Pacific Immunology; dilution (1:200) for IF, (1:2000) dilution for WB; can be obtained from A. Woznica | |
| Antibody | Anti-mCherry 16D7 (rat monoclonal) | Invitrogen | Cat# M11217 | (1:2000) dilution for WB |
| Antibody | Anti-human Tubulin E7 (Mouse monoclonal) | Developmental Studies Hybridoma Bank | Cat# AB_2315513 | (1:200) dilution for IF |
| Antibody | Alpha-human tubulin (Mouse monoclonal) | Sigma Aldrich | Cat # T64074 | (1:7000) dilution for WB |
| Chemical compound, drug | 2’3’ cGAMP | Cayman Chemical | Cat# 19,887 | |
| Chemical compound, drug | 3’3’ cGAMP | Cayman chemical | Cat# 17,966 | |
| Sequence-based reagent | STING556 gRNA | This study | Guide RNA | TTTCGGGATTCAGATGTGGG |
| Sequence-based reagent | STING locus PCR primers | This study | PCR primers | F: 5’ ATG ATG GTT AAT CTC TCT GAT CTT TCA CAT C 3’ R: 5’ TTA TGG CAT CGC ATA CTG GTC C 3’ |
| Commercial assay or kit | SG Cell Line 4D-NucleofectorTM X Kit S | Lonza, | Cat# V4XC-3032 |
Additional files
-
Transparent reporting form
- https://cdn.elifesciences.org/articles/70436/elife-70436-transrepform1-v2.pdf
-
Supplementary file 1
Extended key resource tables.
- https://cdn.elifesciences.org/articles/70436/elife-70436-supp1-v2.xlsx
-
Source data 1
Extended key resources.
- https://cdn.elifesciences.org/articles/70436/elife-70436-supp2-v2.zip
Download links
A two-part list of links to download the article, or parts of the article, in various formats.
Downloads (link to download the article as PDF)
Open citations (links to open the citations from this article in various online reference manager services)
Cite this article (links to download the citations from this article in formats compatible with various reference manager tools)
STING mediates immune responses in the closest living relatives of animals
eLife 10:e70436.
https://doi.org/10.7554/eLife.70436


