New fossils of Australopithecus sediba reveal a nearly complete lower back

  1. Scott A Williams  Is a corresponding author
  2. Thomas Cody Prang
  3. Marc R Meyer
  4. Thierra K Nalley
  5. Renier Van Der Merwe
  6. Christopher Yelverton
  7. Daniel García-Martínez
  8. Gabrielle A Russo
  9. Kelly R Ostrofsky
  10. Jeffrey Spear
  11. Jennifer Eyre
  12. Mark Grabowski
  13. Shahed Nalla
  14. Markus Bastir
  15. Peter Schmid
  16. Steven E Churchill
  17. Lee R Berger
  1. Center for the Study of Human Origins, Department of Anthropology, New York University, United States
  2. New York Consortium in Evolutionary Primatology, United States
  3. Centre for the Exploration of the Deep Human Journey, University of the Witwatersrand, South Africa
  4. Evolutionary Studies Institute, University of the Witwatersrand, South Africa
  5. Department of Anthropology, Texas A&M University, United States
  6. Department of Anthropology, Chaffey College, United States
  7. Western University of Health Sciences, College of Osteopathic Medicine of the Pacific, Department of Medical Anatomical Sciences, United States
  8. Department of Chiropractic, Faculty of Health Sciences, University of Johannesburg, South Africa
  9. Centro Nacional de Investigación sobre la Evolución Humana (CENIEH), Spain
  10. Departamento de Biodiversidad, Ecología y Evolución, Universidad Complutense de Madrid (UCM), Spain
  11. Department of Anthropology, Stony Brook University, United States
  12. Department of Anatomy, College of Osteopathic Medicine, New York Institute of Technology, United States
  13. Department of Anthropology, Bryn Mawr College, United States
  14. Research Centre in Evolutionary Anthropology and Palaeoecology, Liverpool John Moores University, United Kingdom
  15. Department of Human Anatomy and Physiology, Faculty of Health Sciences, University of Johannesburg, South Africa
  16. Departamento de Paleobiología, Museo Nacional de Ciencias Naturales (CSIC), Spain
  17. Anthropological Institute and Museum, University of Zurich, Switzerland
  18. Department of Evolutionary Anthropology, Duke University, United States

Abstract

Adaptations of the lower back to bipedalism are frequently discussed but infrequently demonstrated in early fossil hominins. Newly discovered lumbar vertebrae contribute to a near-complete lower back of Malapa Hominin 2 (MH2), offering additional insights into posture and locomotion in Australopithecus sediba. We show that MH2 possessed a lower back consistent with lumbar lordosis and other adaptations to bipedalism, including an increase in the width of intervertebral articular facets from the upper to lower lumbar column (‘pyramidal configuration’). These results contrast with some recent work on lordosis in fossil hominins, where MH2 was argued to demonstrate no appreciable lordosis (‘hypolordosis’) similar to Neandertals. Our three-dimensional geometric morphometric (3D GM) analyses show that MH2’s nearly complete middle lumbar vertebra is human-like in overall shape but its vertebral body is somewhat intermediate in shape between modern humans and great apes. Additionally, it bears long, cranially and ventrally oriented costal (transverse) processes, implying powerful trunk musculature. We interpret this combination of features to indicate that A. sediba used its lower back in both bipedal and arboreal positional behaviors, as previously suggested based on multiple lines of evidence from other parts of the skeleton and reconstructed paleobiology of A. sediba.

eLife digest

One of the defining features of humans is our ability to walk comfortably on two legs. To achieve this, our skeletons have evolved certain physical characteristics. For example, the lower part of the human spine has a forward curve that supports an upright posture; whereas the lower backs of chimpanzees and other apes – which walk around on four limbs and spend much of their time in trees – lack this curvature. Studying the fossilized back bones of ancient human remains can help us to understand how we evolved these features, and whether our ancestors moved in a similar way.

Australopithecus sediba was a close-relative of modern humans that lived about two million years ago. In 2008, fossils from an adult female were discovered at a cave site in South Africa called Malapa. However, the fossils of the lower back region were incomplete, so it was unclear whether the female – referred to as Malapa Hominin 2 (MH2) – had a forward-curving spine and other adaptations needed to walk on two legs.

Here, Williams et al. report the discovery of new A. sediba fossils from Malapa. The new fossils are mainly bones from the lower back, and they fit together with the previously discovered MH2 fossils, providing a nearly complete lower spine. Analysis of the fossils suggested that MH2 would have had an upright posture and comfortably walked on two legs, and the curvature of their lower back was similar to modern females. However, other aspects of the bones’ shape suggest that as well as walking, A. sediba probably spent a significant amount of time climbing in trees.

The findings of Williams et al. provide new insights in to our evolutionary history, and ultimately, our place in the natural world around us. Our lower back is prone to injury and pain associated with posture, pregnancy and exercise (or lack thereof). Therefore, understanding how the lower back evolved may help us to learn how to prevent injuries and maintain a healthy back.

Introduction

Bipedal locomotion is thought to be one of the earliest and most extensive adaptations in the hominin lineage, potentially evolving initially 6–7 million years (Ma) ago. Human-like bipedalism evolved gradually, however, and early hominins appear to have been facultative bipeds on the ground and competent climbers in the trees (Senut et al., 2001; White et al., 2015; Prang, 2019; Prang et al., 2021). How long climbing adaptations persisted in hominins and when adaptations to obligate terrestrial bipedalism evolved are major outstanding questions in paleoanthropology. Australopithecus sediba – an early Pleistocene (~2 Ma) hominin from the site of Malapa, Gauteng province, South Africa – has featured prominently in these discussions, as well as those concerning the origins of the genus Homo (Berger et al., 2010; Berger, 2012; Irish et al., 2013; Dembo et al., 2015; Kimbel and Rak, 2017; De Ruiter et al., 2018; Williams et al., 2018a; Du and Alemseged, 2019).

Previous studies support the hypothesis that A. sediba possessed adaptations to arboreal locomotion and lacked traits reflecting a form of obligate terrestriality observed in later hominins (Schmid et al., 2013; Prang, 2015a; Prang, 2015b; Prang, 2016; Holliday et al., 2018). Malapa Hominin 2 (MH2) metacarpals are characterized by trabecular density most similar to orangutans, which suggests power grasping capabilities (Dunmore et al., 2020), and the MH2 ulna was estimated to reflect a high proportion of forelimb suspension in the locomotor repertoire of A. sediba (Rein et al., 2017). Evidence from the lower limb also suggests that A. sediba lacked a robust calcaneal tuber (Prang, 2015a) and a longitudinal arch (Prang, 2015b), both thought to be adaptations to obligate, human-like bipedalism, and demonstrates evidence for a mobile subtalar joint proposed to be adaptively significant for vertical climbing and other arboreal locomotor behaviors (Prang, 2016; DeSilva et al., 2013; Zipfel et al., 2011; DeSilva et al., 2018). The upper thorax (Schmid et al., 2013), scapula (Churchill et al., 2013; Churchill et al., 2018), and cervical vertebrae (Meyer et al., 2017) of A. sediba suggest shoulder and arm elevation indicative of arboreal positional behaviors requiring overhead arm positions, and the limb joint size proportions are ape-like (Prabhat et al., 2021). Furthermore, analysis of dental calculus from Malapa Hominin 1 (MH1) indicates that this individual’s diet was high in C3 plants like fruit and leaves, similar to savannah chimpanzees and Ardipithecus ramidus (Henry et al., 2012).

Despite the presence of climbing adaptations, A. sediba also demonstrates clear evidence for bipedal locomotion. The knee and ankle possess human-like adaptations to bipedalism, demonstrating a valgus angle of the femur and a human-like ankle joint (Zipfel et al., 2011; DeSilva et al., 2013; DeSilva et al., 2018). Evidence for strong dorsal (lordotic) wedging of the two lower lumbar vertebrae suggests the presence of a lordotic (ventrally convex) lower back (Williams et al., 2013; Williams et al., 2018b). However, the initial recovery of just the last two lumbar vertebrae of MH2 limited interpretations of spinal curvature, and a study of the MH2 pelvis reconstruction (Kibii et al., 2011) suggests that A. sediba was characterized by a small lordosis angle estimated from calculated pelvic incidence (Been et al., 2014). A separate pelvis reconstruction of MH2 produces a pelvic incidence angle more in line with other hominins (Tardieu et al., 2017). The presence of a long, mobile lower back and a Homo-like lower thorax morphology indicating the presence of a waist further suggest bipedal adaptations in A. sediba (Schmid et al., 2013; Williams et al., 2013). However, missing and incomplete lumbar vertebrae prevented comparative analysis of overall lower back morphology and allowed only limited interpretations of A. sediba back posture and implications for positional behavior.

Here, we report the discovery of portions of four lumbar vertebrae from two ex situ breccia blocks that were excavated from an early 20th century mining road and dump at Malapa. The former mining road is represented by a trackway located in the northern section of the site approximately 2 m north of the main pit that yielded the original A. sediba finds (Dirks et al., 2010; Figure 1). The trackway traverses the site in an east-west direction and was constructed using breccia and soil removed from the main pit by the historic limestone miners. Specimens U.W.88–232, −233,–234, and –281 were recovered in 2015 from the upper section of layer 2 (at a depth of 10 cm) and formed part of the foundation layer of the mining road. The trackway can be distinguished from the surrounding deposits by a section of compacted soil (comprising quartz, cherts, and flowstone) and breccia that extends between layers 1 and 2. Breccia recovered from the trackway, including the block containing U.W.88–232, −233,–234, and –281 similarly presented with quantities of embedded quartz fragments and grains. The breccia block containing specimen U.W.88–280, along with U.W.88–43, –44, and –114 (Williams et al., 2013; Williams et al., 2018b), were recovered from the miner’s dump comprised of excess material (soil and breccia) used for the construction of the miner’s road. The composition of the road matrix and associated breccia, as well as the breccia initially recovered from the mine dump, corresponds to the facies D and E identified in the main pit (Dirks et al., 2010). Facies D includes a fossil-rich breccia deposit that contained the fossil material associated with MH2 (Dirks et al., 2010; Val et al., 2018). Therefore, the geological evidence suggests that the material used for the construction of the miner’s road was sourced on-site, and most probably originated from the northern section of the main pit.

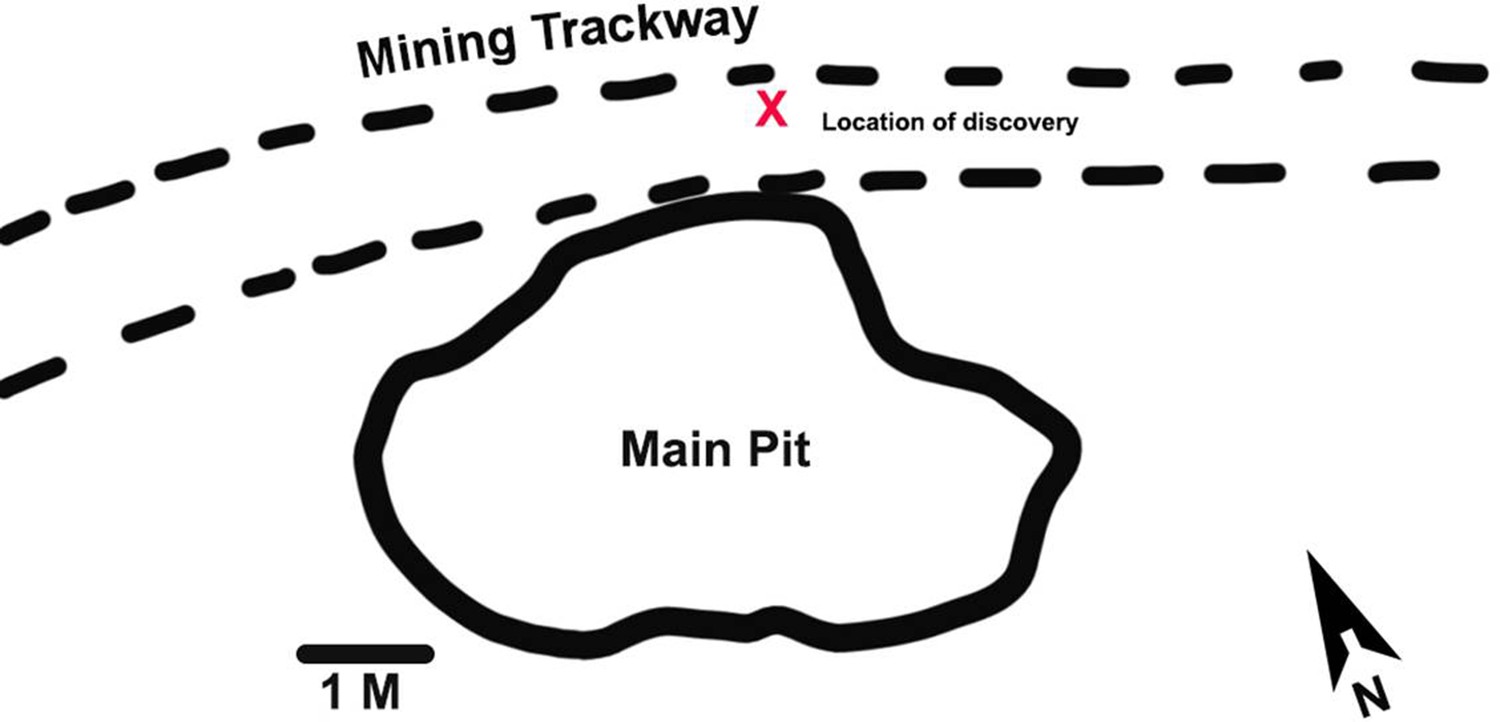
Malapa site map showing the location of the new discoveries.

The new fossils were discovered during excavations of an early 20th century mining road north of the main pit at Malapa. The location of the block containing the new fossils in the mining trackway is shown with a red X.

The newly discovered vertebrae (second and third lumbar) are preserved in articulation with each other (Figure 2, Figure 2—figure supplement 1) and refit at multiple contacts with the previously known penultimate (fourth) lumbar vertebra (Figure 3). Together, the new and previously known (Williams et al., 2013; Williams et al., 2018b) vertebral elements form a continuous series from the antepenultimate thoracic vertebra through the fifth sacral element, with only the first lumbar vertebra missing major components of morphology (Figure 3—figure supplement 1). The presence of a nearly complete lower back of MH2 allows us to more comprehensively evaluate the functional morphology and evolution of purported adaptations to bipedalism in A. sediba and test the hypotheses that the following fundamental features are similar to modern humans (Homo sapiens) and distinct from extant great apes: (1) lumbar lordosis, (2) progressive widening of the articular facets and laminae (pyramidal configuration) of the lower back, and (3) overall middle lumbar vertebra shape. Specifically, for these hypotheses, we predict that measurements of combined lumbar wedging (representing degree of lordosis ascertained from available lumbar vertebrae) will fall within the human range (H1), that the configuration of the articular facets and laminae will progressively widen caudally (rather than remaining constant or becoming increasingly narrow) as seen in modern humans (H2), and that the most complete lumbar vertebra of MH2 (U.W.88–233) will fall within the human range of variation in shape analyses (H3).

Figure 2 with 1 supplement see all
New lumbar vertebrae of Malapa Hominin 2 (MH2).

Vertebrae in (A) superior, (B) inferior, (C) ventral, (D) dorsal, (E) left lateral, and (F) right lateral views. The partial inferior articular facets of the first lumbar vertebra are embedded in matrix (see Figure 2—figure supplement 1). The second lumbar vertebra (U.W.88–232) is in the superior-most (top) position, the third lumbar vertebra (U.W.88–233) is in the middle, and portions of the upper neural arch of the fourth lumbar vertebra (U.W.88–234) are in the inferior-most (bottom) position. These fossils are curated and available for study at the University of the Witwatersrand.

Figure 3 with 1 supplement see all
The lower back of Malapa Hominin 2 in ventral (left) and dorsal (right) views.

New second and third lumbar vertebrae (U.W.88–232, U.W.88–233) are positioned at the top, and U.W.88–234 contributes to the upper portion of the fourth lumbar vertebra (U.W.88–127/153/234). The fifth lumbar vertebra (U.W.88–126/138) sits atop the sacrum (U.W.88–137/125). The lower back elements are preserved together in four blocks, each containing multiple elements held together in matrix and/or in partial articulation: (1) The vertebral body fragment of L1 (U.W.88–280) is preserved within the matrix of a block containing the lower thoracic vertebrae (U.W.88–43/114 and U.W.88–44) (Figure 2—figure supplement 1, Figure 3—figure supplement 1); (2) L1 inferior neural arch (U.W.88–281; concealed in matrix), L2 (U.W.88–232), L3 (U.W.88–233), and upper neural arch of L4 (U.W.88–234); (3) the L4 (U.W.88–127) and L5 (U.W.88–126) vertebral bodies, and partial S1 body (U.W.88–125); (4) most of the sacrum (U.W.88–137), the neural arch of L5 (U.W.88–153), the inferior portion of the neural arch of L4 (U.W.88–138).

Results

The five new fossils, U.W.88–232, U.W.88–233, U.W.88–234, U.W.88–280, and U.W.88–281, are described below and shown in Figure 4. Measurements are included in Table 1. A depiction of the anatomical features mentioned in the descriptions below and throughout the manuscript is shown in Figure 4—figure supplement 1.

Figure 4 with 1 supplement see all
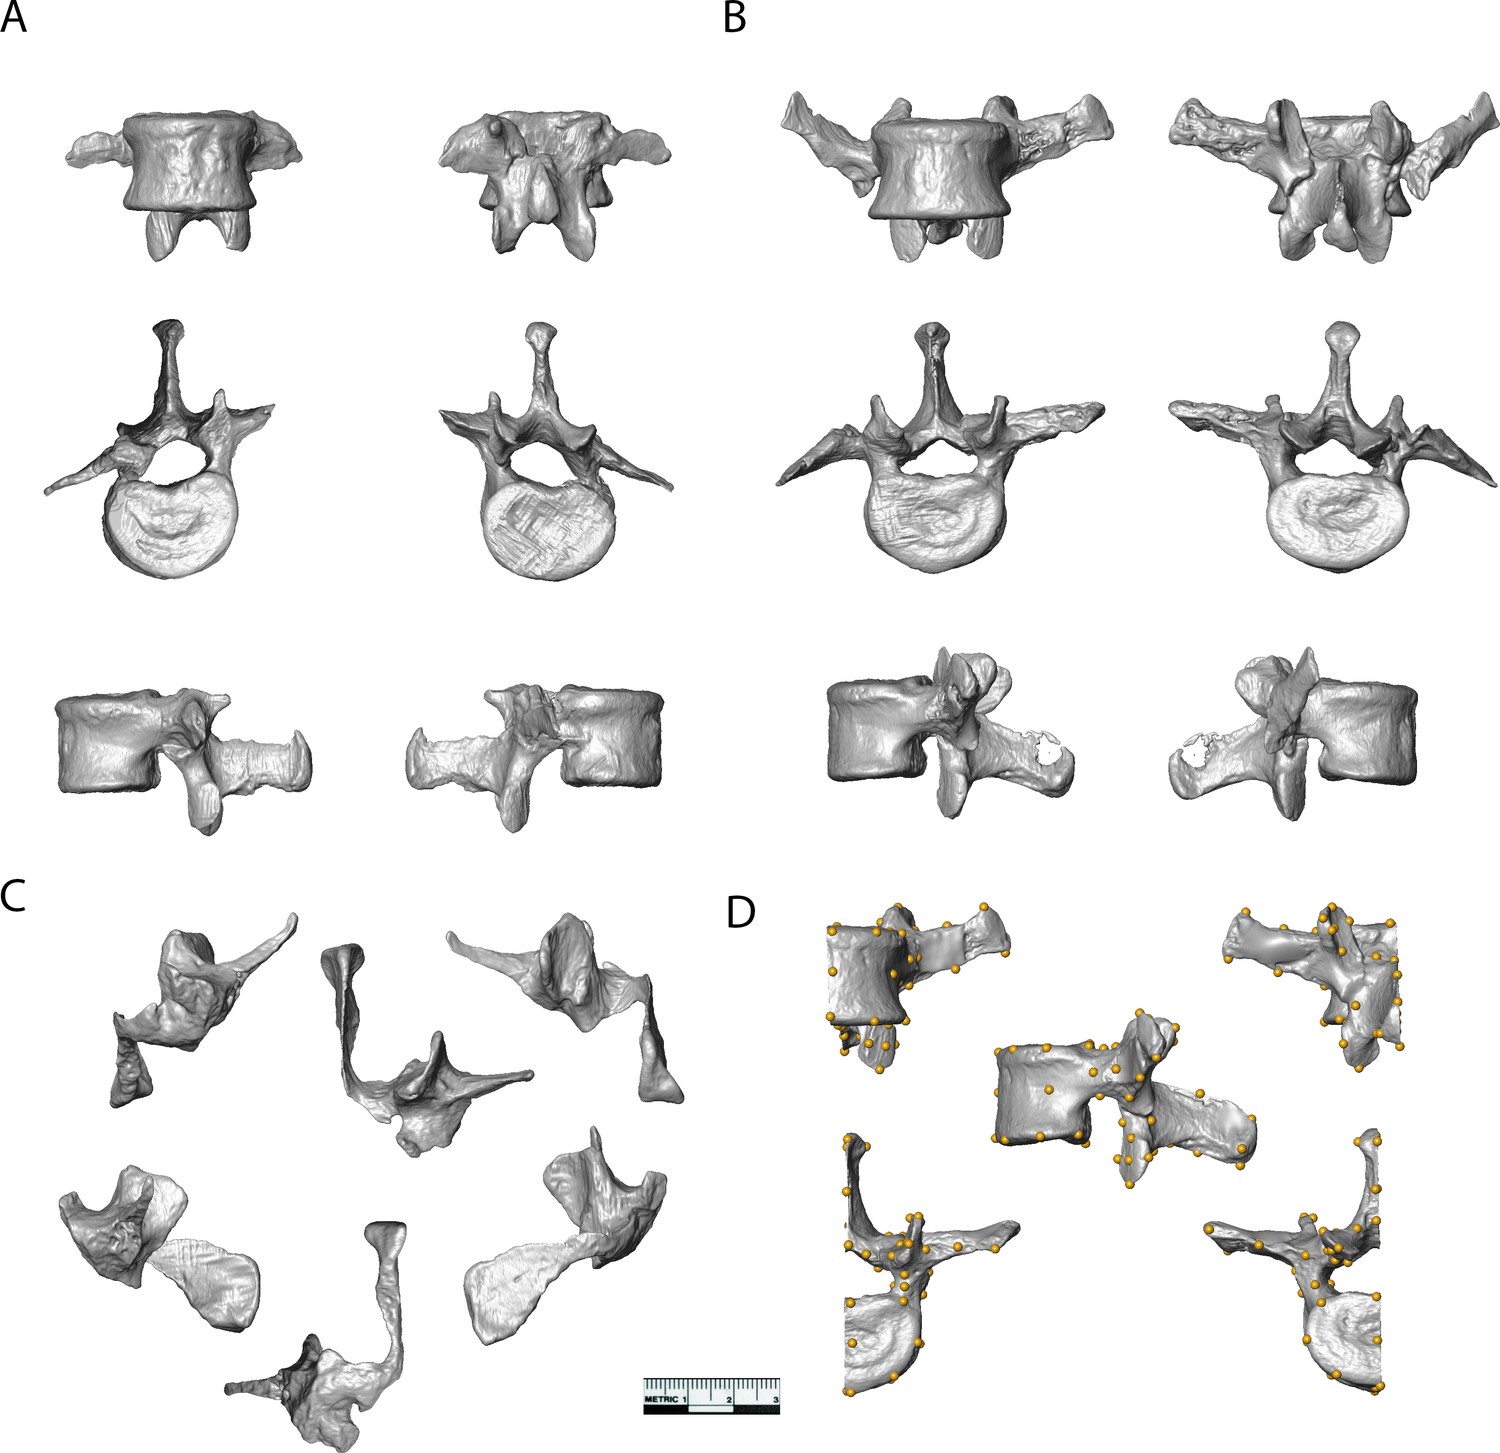
Surface models of vertebrae from the new lumbar block.

(A) U.W.88–232 (L2) and (B) U.W.88–233 (L3) shown in ventral (top left), dorsal (top right), superior (middle left), inferior (middle right), left lateral (bottom left), and right lateral (bottom right) views. (C) U.W.88–234 (L4) in ventral (top left), dorsal (top right), superior (top middle), left lateral (bottom left), right lateral (bottom right), and inferior (bottom middle) views. (D) Left half of U.W.88–233 showing the 48 landmarks used in the three-dimensional geometric morphometric (3D GM) analyses.

Table 1
Measurements on lumbar vertebrae in mm for linear data and degrees for angles (measurement definitions are included in the supplementary material).
U.W.88–232(L2)U.W.88–233(L3)U.W.88-127/
153/234(L4)
U.W.88-126/138(L5)
1. Body sup. transv. width29.530.131.432.8
2. Body sup. dorsoven. dia.20.821.422.221.4
3. Body inf. transv. width29.031.432.428.8
4. Body inf. dorsoven. dia.21.121.021.219.8
5. Body ventral height21.021.7522.121.0
6. Body dorsal height22.522.2521.517.0
7. Body wedging angle (calculated)4.1°1.3°–1.6°–10.7°
8. Vertebral foramen dorsoven. dia.10.58.8523.0
9. Vertebral foramen transv. dia.17.617.316.3
10. Sup.-inf. inter-AF height37.032.631.5
11. Max. inter-SAF dist.24.028.5
12. Min. inter-SAF dist.14.5
13. Max. inter-IAF dist.23.025.0(28.0)*(33.0)
14. Min. inter-IAF dist.11.09.511.615.6
15. SAF sup.-inf. dia.12.813.4
16. SAF transv. dia.11.510.8
17. IAF sup.-inf. dia.11.511.514.714.4
18. IAF transv. dia.8.18.99.211.7
19. Spinous process angle176°160°163°166°
20. Spinous process length27.028.028.023.6
21. Spinous process terminal trans. width6.97.48.16.85
22. Spinous process terminal sup.-inf. height13.811.7512.77.15
23. Costal process base sup.-inf. height11.512.213.9
24. Costal process angle78°82°50°
25. Costal process length31.0
26. SAF orientation (in degrees)31°33°26°
27. Pedicle sup.-inf. height10.910.611.2
28. Pedicle transv. width5.97.19.010.9
29. Pedicle dorsoven. length5.05.66.57.0
30. Lamina sup.-inf. height16.115.414.0
31. Lamina transv. width20.022.030.5
  1. *

    Parentheses indicate that the structure is incomplete and its measurement if estimated.

Descriptions of new fossil material

We determine the seriation of the vertebrae described here based on their direct articulation with one another and refits with previously known vertebrae. Most of the sacrum (U.W.88–137) is preserved in articulation with the neural arch of the last lumbar vertebra (U.W.88–138), which articulates in turn with the inferior portion of the neural arch of the penultimate lumbar vertebra (U.W.88–154). Corresponding vertebral bodies (U.W.88–126 and U.W.88–127, respectively) are preserved together and can be refitted with the neural arches (Williams et al., 2013). The new lumbar vertebrae are preserved in partial articulation, including an upper neural arch that refits in two places with U.W.88–154. Therefore, portions of five vertebrae are preserved, followed by a sacrum and preceded by at least three lower thoracic vertebrae (Williams et al., 2018b).

U.W.88–280: This is a partial, superior portion of a vertebral body concealed in the matrix of a previously known block containing lower thoracic vertebrae (U.W.88–114, U.W.88–43, and U.W.88–44, antepenultimate, penultimate, and ultimate thoracic vertebrae, respectively, of MH2) (Williams et al., 2018b). U.W.88–280 was revealed in the segmentation of micro-CT (hereafter, µCT) data. U.W.88–280 represents the right side of an upper vertebral body with preservation approaching the sagittal midline. The preserved portions measure 16.5 mm dorsoventrally and 14.0 mm mediolaterally at their maximum lengths. The lateral portion of the vertebral body is only preserved ~5.0 mm inferiorly from the superior surface, but there is no indication of a costal facet on the preserved portion. We identify this as part (along with U.W.88–281) of the first lumbar vertebra of MH2 based on its position below the vertebral body of what is almost certainly the last thoracic vertebra (U.W.88–44) (Williams et al., 2018b; Figure 2—figure supplement 1).

U.W.88–281: This is the partial neural arch of a post-transitional, upper lumbar vertebra concealed in matrix above the subjacent lumbar vertebra (U.W.88–232). It was revealed through the segmentation of µCT data. It consists of the base and caudal portion of the spinous process and parts of the inferior articular processes. The remainder of the vertebra is sheared off and unaccounted for in the block containing the new lumbar vertebrae. U.W.88–281 is fixed in partial articulation with the subjacent second lumbar vertebra (L2), U.W.88–232. Therefore, we identify U.W.88–281 as part of the first lumbar vertebra based on its morphology and position within the block. The left inferior articular facet (IAF) is more complete than the right, with approximately 6.0 mm of its superior-inferior (SI) height preserved, and is complete mediolaterally, measuring ~8.0 mm in width. The minimum distance between the IAF is 12.5 mm, and the maximum preserved distance between them is 21.75 mm. The preserved portion of the spinous process is 12.75 mm in dorsoventral length.

U.W.88–232: This vertebra is the L2 and remains in articulation with the third lumbar vertebra (L3), U.W.88–233, held together with matrix. Some portions of U.W.88–232 are covered by adhering matrix or other fossil elements (U.W.88–281 and U.W.88–282, the latter being the sternal end of a clavicle), so µCT data were used to visualize the whole vertebra (Figure 4). U.W.88–232 is mostly complete, missing the cranial portions of its superior articular processes and distal portions of its costal (transverse) processes. It is distorted due to crushing dorsally from the right side and related breakage and slight displacements of the left superior articular process at the pars interarticularis and the right costal process at its base. Although broken at its base and displaced slightly ventrally, the right costal process is more complete than the left side, which is broken and missing ~10.0 mm from its base. Because of crushing, the neural arch is displaced toward the left side, and the vertebral foramen is significantly distorted. A partial mammillary process is present on the left superior articular process, sheared off along with the remainder of the right superior articular process ~8.0 mm from its base. The left side is similar but much of the mammillary process is sheared off in the same plane as the right side, leaving only its base on the lateral aspect of the right superior articular process. The vertebral body is complete and undistorted, and the spinous process and inferior articular processes are likewise complete but affected by distortion. Standard measurements of undistorted morphologies are reported in Table 1.

U.W.88–233: This is the L3 and the most complete vertebra in the lumbar series, although some aspects of the neural arch are distorted, broken, and displaced. It is held in matrix and partial articulation with U.W.88–234, the subjacent partial fourth lumbar vertebra (L4). Due to its position between articulated elements U.W.88–232 and –234 and some adhering matrix, U.W.88–233 was visualized using µCT data. U.W.88–233 is essentially complete; however, like U.W.88–232, the neural arch is crushed from the dorsal direction, with breaks and displacement across the right pars interarticularis and the right costal process at its base, with additional buckling around the latter near the base of the of the right superior articular process, resulting in a crushing of the vertebral foramen. The vertebral body, pedicles, spinous process, and superior and inferior articular processes are complete, as are the lamina and costal processes aside from the aforementioned breakage. The left costal process is unaffected by taphonomic distortion. Standard measurements of undistorted morphologies are reported in Table 1.

U.W.88–234: This is a partial neural arch of the previously known penultimate lumbar vertebra (L4) (U.W.88-127/153). U.W.88–234 refits in two places with the previously known L4: its partial pedicle with the vertebral body (U.W.88–127) and its spinous process with the inferior base of the spinous process and inferior articular processes (U.W.88–153) (Figures 23). Only the spinous process and right pedicle, costal process, superior articular processes, and partial lamina are present and in articulation with U.W.88–233. Matrix adheres to the spinous process and costal process, so for this element µCT data were used to visualize and virtually refit it with U.W.88-127/153, forming a partial L4 missing the left superior articular process, costal process, most of the pedicle, the right lateral aspect of the inferior articular process, a portion of the lamina, the inferior aspect of the costal process, and a wedge-shaped area of the lateral body-pedicle border. Preserved standard measurements are reported in Table 1.

Wedging angles and inferred lumbar lordosis

Wedging of articulated vertebrae contribute to the multiple sagittal curvatures of the human spine, with dorsal wedging of lower lumbar vertebrae contributing to a ventrally convex curvature of the lumbar spine (lumbar lordosis). This sinusoidal configuration passively balances the upper body over the pelvis and allows for the unique system of weight bearing and force transmission found in members of the human lineage (Davis, 1961; Robinson, 1972; Pal and Routal, 1987; Latimer and Ward, 1993; Shapiro, 1993a; Lovejoy, 2005; Whitcome et al., 2007; Masharawi et al., 2010; Been et al., 2014; Tardieu et al., 2017). Wedging angles for individual lumbar vertebrae (L2-L5) and combined L2-L5 wedging were calculated for A. sediba and the comparative sample and are presented in (Figure 5, Figure 5—figure supplement 1, Figure 5—figure supplement 2) and Table 2 and Table 3. MH2 possesses the greatest (i.e., most negative) combined wedging value of any adult early hominin (–6.8°). Although all fossil hominins fall within the 95% prediction intervals of modern humans, only MH2 falls outside the 95% prediction intervals of great apes in combined L2-L5 wedging (Figure 5).

Table 2
Summary statistics for lumbar wedging angles of the extant comparative sample.
LevelGroup/fossilHuman ♂ (48)Human ♀ (31)Pan (43)Gorilla (31)Pongo (10)
L2Mean (stdev)4.4 (3.3)2.1 (2.1)4.6 (3.0)2.3 (2.7)5.3 (4.7)
95% PI–2.1, 10.9–2.0, 6.2–1.3,10.5–3.0, 7.6–3.9, 14.5
Min, max–3.4, 12.8–2.1, 6.0–1.1, 12.4–4.0, 8.3–0.4, 14.4
L3Mean (stdev)2.4 (3.1)1.3 (2.6)4.5 (3.1)2.6 (2.0)6.1 (2.0)
95% PI–3.7, 8.5–3.8, 6.4–1.6, 10.6–1.3, 6.52.2, 10.0
Min, max–4.8, 11.2–3.4, 6.6–2.4, 10.9–2.2, 7.53.2, 8.6
L4Mean (stdev)–0.5 (2.8)–1.5 (2.9)3.5 (3.4)1.3 (2.5)4.8 (3.8)
95% PI–6.0, 5.0–7.2, 4.2–3.2, 10.2–3.6, 6.2–2.6, 12.2
Min, max–8.3, 4.8–7.9, 4.6–3.6, 10.9–3.9, 7.1–1.0, 11.3
L5Mean (stdev)–5.9 (2.9)–6.5 (3.1)–0.5 (2.8)–0.8 (2.2)2.0 (4.1)
95% PI−11.6,–0.2−12.6,–0.4–6.0, 5.0–5.1, 3.5–6.0, 10.0
Min,max–11.6, 1.8–12.3, 2.2–5.9, 7.0–6.2, 3.5–5.2, 8.0
SumMean (stdev)0.4 (7.8)–4.9 (8.1)12.1 (8.8)5.4 (5.7)18.1 (9.5)
95% PI–15.0, 15.7–20.8, 11.0–5.1, 29.3–5.8, 16.68.6, 27.6
Min, max–15.6, 15.5–18.2, 11.2–5.2, 31.7–8.1, 15.70.04, 36.0
Figure 5 with 2 supplements see all
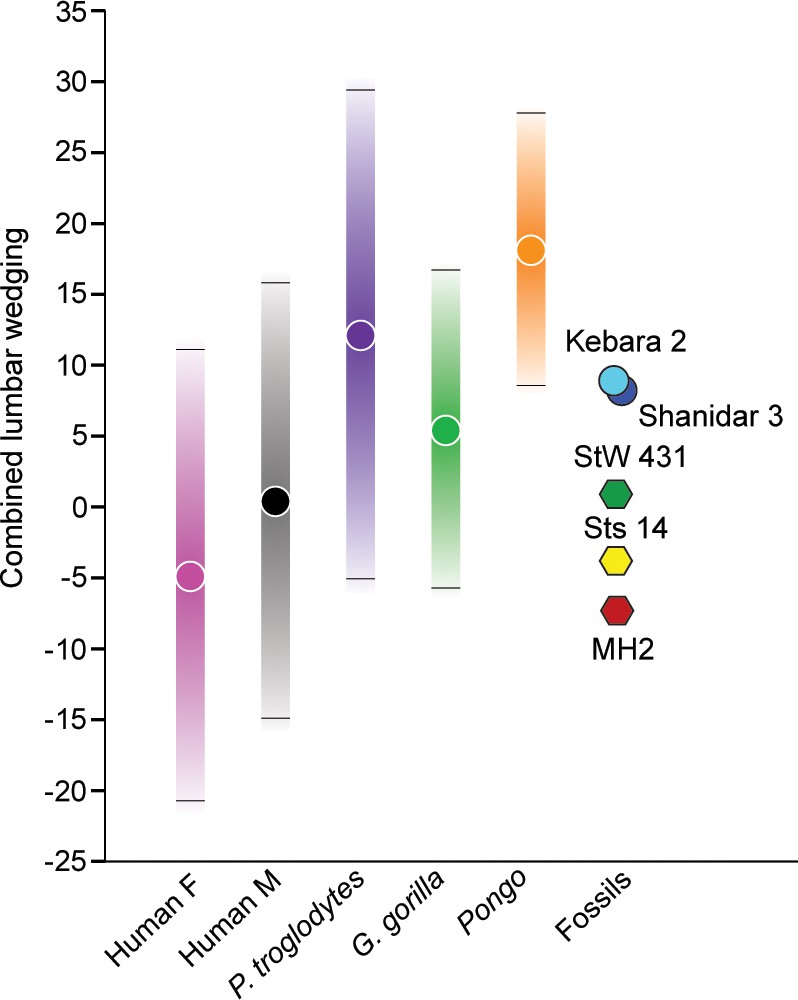
Combined L2-L5 vertebral body wedging angles.

Lumbar vertebral body wedging angles are summed from levels L2 through L5. Only fossil specimens preserving the last four lumbar vertebrae are included (Australopithecus africanus: Sts 14, StW 431; Australopithecus sediba: MH2; Neandertals: Kebara 2, Shanidar 3). For the extant taxa, 95% prediction intervals are shown with bars. Table 2 includes summary statistics, Table 3 fossil hominin data, and Figure 5—source data 1 provides the raw data.

Figure 5—source data 1

Lumbar wedging angles and combined wedging angles values of extant taxa (Excel file).

https://cdn.elifesciences.org/articles/70447/elife-70447-fig5-data1-v1.xlsx
Table 3
Lumbar wedging angles and combined wedging of fossil hominin specimens.
L2L3L4L5Combined
Kebara 28.16.94.5–10.68.9
Shanidar 38.05.10.1–4.98.3
La Chapelle-aux-Saints 14.70.0–7.8
KNM-WT 15000–8.3–11.8
LES13.0
SK 3981b–3.5
MH24.11.4–1.6–11.2–7.3
Sts 142.31.7–0.9–6.9–3.8
StW 4312.02.30.9–4.21.1
StW 85.23.6
StW 5724.8
StW 656/6004.2–6.2
A.L. 288–17.2
A.L. 333–732.8

Patterns of change across lumbar levels demonstrate that MH2’s vertebrae transition from ventral (kyphotic) to dorsal (lordotic) wedging between the L3 and L4 levels; however, all adult fossil hominins fall within the 95% prediction intervals of modern humans (Figure 5, Figure 5—figure supplement 1). As shown previously (Williams et al., 2013), the last lumbar vertebra of MH2 is strongly dorsally wedged like that of the Kebara 2 Neandertal and the juvenile specimen KNM-WT 15000, whereas other fossil hominins do not demonstrate this pattern. Although vertebral wedging is characterized by high levels of variation within groups, especially in combined L2-L5 wedging (Figure 5, Table 2), the pattern of lumbar wedging angles observed in MH2 (i.e., transition from penultimate to ultimate lumbar level) and its combined L2-L5 wedging fall within the modern human 95% PIs and outside those of great apes (Figure 5, Figure 5—figure supplement 1, Figure 5—figure supplement 2). The hypothesis that A. sediba is human-like in lumbar wedging, therefore, cannot be rejected.

Configuration of the neural arch

The recovery of new lumbar vertebrae of MH2 allows for the quantification and comparison of inter-articular facet width increase in A. sediba. Humans are characterized by a pyramidal configuration of the articular facets such that they increase in transverse width progressively down the lumbar column (i.e., from cranial to caudal) (Latimer and Ward, 1993; Ward and Latimer, 2005). Using an index of the last lumbar-sacrum inter-articular maximum distance relative to that of lumbar vertebrae three levels higher (L2-L3 in hominins, L1-L2 in chimpanzees and gorillas), we show that Australopithecus africanus (Sts 14 and StW 431; average = 1.42) and A. sediba (1.43) fall at the low end of the range of modern human variation in this trait (Figure 6). We note that A.L. 288–1 (Australopithecus afarensis) falls at the low end of human variation near other australopiths if the preserved lumbar vertebra (A.L. 288-1aa/ak/al) is treated as an L3 (Latimer and Ward, 1993; Lovejoy, 2005; Johanson et al., 1982; Meyer et al., 2015), but outside the range of human variation and within that of orangutans if it is treated as an L2 (Cook et al., 1983). Homo erectus and Neandertals fall well within the range of modern human variation. The presence of a pyramidal configuration of the lumbar articular facets is therefore present in MH2, supporting our hypothesis that A. sediba was adapted to a human-like configuration of the neural arch.

Pyramidal configuration of articular facet spacing in hominids.

The inter-articular facets of the last lumbar/sacrum and those of lumbar vertebrae three elements higher in the column (L1-L2 in chimpanzees and gorillas with four lumbar vertebrae; L2-L3 in hominins) are included as the numerator and denominator, respectively, in a lumbar inter-articular facet index. These levels are highlighted on the left in red in both a human (top) and a chimpanzee (bottom). The gray box highlights the range of variation observed in the modern human sample. All great apes are significantly different from modern humans (<0.001). The ratio data for inter-articular facet spacing can be found in Figure 6—source data 1.

Figure 6—source data 1

Inter-articular facet ratios of fossil hominins and extant taxa (Excel file).

https://cdn.elifesciences.org/articles/70447/elife-70447-fig6-data1-v1.xlsx

Middle lumbar vertebra (L3) comparative morphology

The new middle lumbar vertebra, U.W.88–233, is complete, and although the neural arch is compressed ventrally into the vertebral foramen space, it can be reasonably reconstructed from µCT data (see Materials and methods). We used three-dimensional geometric morphometrics (3D GM) to evaluate the shape affinities of U.W.88–233 among humans, great apes, and fossil hominins. The results of our principal components analysis (PCA) on Procrustes-aligned shape coordinates reveal that A. sediba falls within or near the human distribution on the first three principal components (PC1–3) (Figure 7). PC1 explains 31% of the variance in the dataset, and along it hominins are characterized by more sagittally oriented and concave superior articular facets (SAF), more dorsally oriented costal processes, a dorsoventrally shorter and cranially oriented spinous process, craniocaudally shorter, dorsoventrally longer vertebral body, and more caudally positioned SAF and IAF relative to the vertebral body compared to great apes.

Figure 7 with 3 supplements see all
Principal components analysis (PCA) on middle lumbar vertebra three-dimensional (3D) landmark data.

(A–C) PCA on the full set of 48 landmarks, including Sts 14 (Australopithecus africanus), U.W.88–233 (Australopithecus sediba), and Shanidar 3 (Neandertal). (A–B) Hominins separate from great apes on PC1 (wireframes in lateral view), African apes and hominins separate from orangutans on PC2 (wireframes in lateral view), and (C) Australopithecus species separate from other hominids on PC4 (wireframes in posterior view). Note that spinous and costal process lengths and orientations drive much of the variance in middle lumbar vertebrae. (D) PCA on a reduced landmark set (excluding spinous and costal process landmarks) to include A.L. 288–1 (Australopithecus afarensis), StW 431 (A. africanus), and Kebara 2 (Neandertal). Notice that Australopithecus specimens fall outside the modern human convex hulls, with Sts 14 and MH2 close to those of the African apes. 3D landmark data were subjected to Procrustes transformation.

PC2 explains 13% of the variance and contrasts long spinous processes and relatively neutrally wedged (~0° ± 1°) vertebral bodies of hominins and African apes with the shorter spinous processes and strongly ventrally wedged vertebral bodies of orangutans. PC3 explains 8% of the variance and largely contrasts dorsoventrally longer vertebral bodies with caudally oriented spinous processes in gorillas with dorsoventrally shorter vertebral bodies and less caudally oriented spinous processes in chimpanzees and orangutans; hominins fall intermediate between these groups.

PC4 explains 5% of the variance, and contrasts A. sediba and A. africanus with both humans and great apes. Sts 14 and especially U.W.88–233 are characterized by longer, taller, more cranially oriented costal processes that do not taper distally and more sagittally oriented (as opposed to more coronally oriented) articular facets (Figure 7, Figure 7—figure supplement 1). We removed great apes and reran the PCA to ensure that their presence is not affecting the relationship of fossil hominins to modern humans. This hominin-only PCA essentially reproduced the results of PC4 on PC2 (Figure 7—figure supplement 2), confirming that Sts 14 and U.W.88–233 are distinct from modern humans in costal process morphology. Therefore, although the A. sediba middle lumbar vertebra is somewhat human-like in overall shape, its vertebral body is intermediate in shape between great apes and modern humans and its costal processes are robust, cranially oriented, and cranially positioned on the pedicles.

To provide a more in-depth comparison of the morphometric affinities of U.W.88–233, we plot Procrustes distances between U.W.88–233 and Sts 14, Shanidar 3, the modern human sample, and the chimpanzee sample (Figure 7—figure supplement 1A). We also show pairwise comparisons of Procrustes distances for middle lumbar vertebra shape within both human and chimpanzee samples, and between human and chimpanzee samples (Figure 7—figure supplement 1C). These analyses demonstrate that U.W.88–233 is most similar to Sts 14 among fossil and extant specimens included.

To include other fossil hominins with broken processes, we ran a second 3D GM analysis excluding the majority of costal process and spinous process landmarks. This analysis, which includes landmarks on the vertebral body, SAF and IAF, and the bases of the costal and spinous processes, produces a similar pattern compared to the analysis on the full landmark set (Figure 7). Humans and great apes separate along PC1, which is largely explained by vertebral body heights (including vertebral wedging) and SI position of the articular facets relative to the vertebral body. U.W.88–233, like other early hominins included in this study, falls intermediately between modern humans and great apes along PC1.

We used a Procrustes distance-based analysis of variance (ANOVA) to evaluate the effect of centroid size on lumbar shape (Goodall, 1991). The results show significant effects of centroid size (F = 9.83; p < 0.001), genus (with hominins pooled; F = 27.7; p < 0.001), and an interaction between genus and centroid size (F = 1.48; p = 0.01), implying unique shape allometries within genera (Table 4). We plotted standardized shape scores derived from a multivariate regression of shape on centroid size against centroid size to visualize shape changes (Drake and Klingenberg, 2008; Figure 7—figure supplement 3). In general, larger centroid sizes are associated with 3D shape changes including dorsoventrally longer and more caudally projecting spinous processes, more cranially oriented and less sagittally oriented costal processes, and less caudally projecting IAF. Importantly, however, the cranially oriented costal processes of U.W.88–233 (and Sts 14) appear not to be explained by centroid size given its relatively small size and overlap with Pan in standardized shape scores (Figure 7—figure supplement 3).

Table 4
Procrustes analysis of variance (ANOVA) results of centroid size and middle lumbar vertebra shape.
DfSSMSR2FZPr (>F)
Centroid size10.119170.119170.04529.82525.5237<0.0001
Genus31.007930.335980.3823427.700912.0794<0.0001
Centroid size:genus30.05370.01790.020371.47592.28580.0109
Residuals1201.455450.012130.55209
Total1272.63626

Discussion

The recovery of two new lumbar vertebrae and portions of other lumbar vertebrae of the adult female A. sediba (MH2), together with previously known vertebrae, form a nearly complete lumbar column (Figure 3, Figure 3—figure supplement 1) and allows us to test hypotheses based on more limited material. As we outline below, A. sediba demonstrates evidence for lumbar lordosis in the combined pattern of bony wedging of lumbar vertebral bodies, as well as progressive widening of neural arch structures moving caudally (‘pyramidal configuration’) of lumbar vertebrae and the sacrum, which does not allow us to reject the hypotheses that A. sediba has human-like adaptations to bipedalism. However, the hypothesis that A. sediba’s middle lumbar vertebra (L3) is human-like is not fully supported: although U.W.88–233 is somewhat human-like in overall shape, its costal processes are long and cranially oriented, unlike modern humans, and its vertebral body is intermediate in shape between those of modern humans (and Neandertals) and great apes.

Williams et al., 2013, predicted strong lumbar lordosis (‘hyperlordosis’) in MH2 based on the combined wedging values of the penultimate and ultimate lumbar vertebrae. In contrast, Been et al., 2014, estimated lumbar lordosis angle using pelvic incidence from a pelvis reconstruction (Kibii et al., 2011) and found MH2 to produce the least lordotic lumbar column of the sampled members of the genus Australopithecus in their sample, falling well below modern human values and within the distribution of Neandertals. Neandertals are thought to be ‘hypolordotic’, or characterized by a relatively straight, non-lordotic lumbar column (Been et al., 2014; Been et al., 2017; but see Haeusler et al., 2019). However, Tardieu et al., 2017, report a human-like degree of pelvic incidence (and therefore lumbar lordosis) in a new reconstruction of the MH2 pelvis. Therefore, current interpretations of lumbar curvature of A. sediba range from hyperlordotic to hypolordotic. Here, we report that the pattern of vertebral wedging of MH2 and most other fossil hominins are similar to both modern humans and extant great apes except at the last lumbar level, where MH2 is markedly more dorsally wedged (Figure 5, Figure 5—figure supplement 1, Figure 5—figure supplement 2). Like the Neandertal Kebara 2, the strong dorsal (lordotic) wedging of MH2’s last lumbar vertebra is likely countering a strong ventral (kyphotic) wedging in the upper lumbar column (Figure 5). However, MH2 demonstrates much less ventral wedging than Neandertals and produces a human-like combined wedging angles value, falling outside the 95% prediction intervals of great apes. Therefore, it seems likely that MH2 and possibly the juvenile H. erectus individual KNM-WT 15000 demonstrate strong dorsal wedging at the last lumbar level for different reasons than Kebara 2. It was suggested previously that the morphology of the MH2 last lumbar is part of a kinematic chain linked to hyperpronation of the foot (DeSilva et al., 2013; Williams et al., 2013). With the absence of soft tissue contributions to the kinematic chain (i.e., intervertebral discs), formal biomechanical testing is beyond the scope of the current paper; however, our results suggest that MH2 was probably neither hypolordotic nor hyperlordotic and produces a combined wedging angles value more similar to modern humans than great apes.

Modern humans are characterized by a pyramidal configuration of the lumbar inter-articular facet joints such that the upper lumbar articular facet joints (and associated laminae) are transversely more narrowly spaced than those of the lower lumbar vertebrae and especially compared to the lumbosacral inter-articular facet joints (Latimer and Ward, 1993; Sanders, 1998; Ward and Latimer, 2005). Together with vertebral body and intervertebral disc wedging, this progressive widening facilitates the adoption of lordotic posture during ontogeny and allows for the imbrication of the IAF of a superjacent vertebra onto the laminae of the subjacent vertebra during hyperextension of the lower back (Latimer and Ward, 1993; Williams et al., 2013). Like modern humans, known fossil hominin lumbar vertebrae bear ‘imbrication pockets’, mechanically induced fossae positioned just caudal to the SAF on the lamina (Latimer and Ward, 1993; Williams et al., 2013), providing direct evidence for lumbar hyperextension and lordosis. Inadequate spacing of lower lumbar inter-articular facets in modern humans can result in spondylolysis, fracture of the pars interarticularis, and potential separation of the affected vertebra’s spinous process and inferior articular processes (Ward and Latimer, 2005). Lack of the progressive widening of inter-articular facets of lower lumbar vertebrae in our closest living relatives, the African apes, begs the question of when the pyramidal configuration evolved and to what extent various fossil hominins demonstrated this trait. Although a human-like pattern of interfacet distance was once claimed for the European late Miocene ape Oreopithecus (Köhler and Moya-Sola, 1997), Russo and Shapiro, 2013, demonstrated that measures for changes in both interfacet distance and laminar width in this extinct ape fall within ranges of extant apes (and other suspensory mammals) and outside those of humans. Among hominins, Latimer and Ward, 1993, documented the presence of a pyramidal configuration in H. erectus. It has also been demonstrated qualitatively in A. afarensis and A. africanus (Robinson, 1972; Lovejoy, 2005), and its presence in A. sediba could be inferred previously based on the articulated penultimate and ultimate lumbar vertebrae and sacrum of MH2 (Williams et al., 2013). Here, we show that MH2 and other Australopithecus specimens fall at the low end of modern human variation and differ from great apes in having significantly wider inter-articular facets at the lumbosacral junction than higher in the lumbar column (Figure 6).

The overall morphologies of lumbar vertebrae are informative with regard to locomotion and posture in primates (Slijper, 1946; Shapiro, 1993b; Sanders and Bodenbender, 1994; Granatosky et al., 2014; Williams and Russo, 2015). Hominoids are characterized by derived vertebral morphologies related to orthogrady and antipronograde positional behaviors, and early hominins have been found to largely resemble modern humans in lumbar vertebra shape, with some retained primitive morphologies (Robinson, 1972; Schmid, 1991; Shapiro, 1993a). Our 3D GM results show that the middle lumbar vertebra of A. sediba (U.W.88–233; L3) falls with modern humans (L3) to the exclusion of great apes (L2) in overall shape (Figure 7A–B). However, it bears long, cranially and ventrally oriented costal processes unlike those of modern humans (Figure 7C, Figure 7—figure supplement 1, Figure 7—figure supplement 2), and the vertebral body is somewhat intermediate in shape between modern humans and great apes (Figure 7D).

To evaluate the potential effect of centroid size in driving differences in middle lumbar vertebra shape, we ran a Procrustes distance-based ANOVA on generalized Procrustes analysis (GPA) shape scores to test whether shape differences between this fossil specimen and any extant taxon, such as H. sapiens, could be explained by differences in size (‘allometry’). Since body mass scales as the cube of linear dimensions and the physiological cross-sectional area of skeletal muscle – a major determinant of isometric force production – scales as the square of linear dimensions, larger-bodied individuals should be relatively weaker with all else held equal. Thus to compensate, we would expect to see changes in bony morphology based on differences in body size. We find that the spinous and costal processes are longer in specimens with larger centroid sizes (Figure 7—figure supplement 3). These changes would increase the moment arms of the erector spinae and quadratus lumborum muscles, respectively, resulting in greater moments that contribute to lumbar extension, ventral flexion, and lateral flexion to cope with increases in body mass. Our results suggest that, while we detect a statistically significant effect of centroid size on middle lumbar vertebral shape within each group, the differences in costal process size and orientation observed between A. sediba and modern humans appear not to be explained by size alone.

Long costal processes give the psoas major and quadratus lumborum muscles an effective leverage in acting on the vertebral column, increasing their moment arms and torque generation capabilities to assist the erector spinae in lateral flexion of the spine, back extension, and stabilizing the trunk during upright posture and bipedalism and ape-like vertical climbing (Robinson, 1972; Waters and Morris, 1972; Schmid, 1991; Sanders, 1998; Figure 7—figure supplement 2). Psoas major acts with iliacus as a powerful flexor of the thigh and trunk, while quadratus lumborum is a trunk extensor and a lateral flexor of the vertebral column and pelvis unilaterally (Robinson, 1972; Drake et al., 2019). The lumbar vertebral morphology of A. sediba, therefore, is that of a biped equipped with especially powerful trunk musculature for stabilizing the hip and back during walking and/or vertical climbing. Further work on back morphology and function in A. sediba and other early hominins is required to explore the efficacy of these possible functional explanations for the observed morphology of MH2’s lumbar vertebrae.

Previous work has shown that the adult, presumed female individual from Malapa (MH2) demonstrates clear adaptations to bipedal locomotion (Zipfel et al., 2011; DeSilva et al., 2013; DeSilva et al., 2018; Williams et al., 2013; Williams et al., 2018b), as do other Australopithecus specimens, despite their retention of features linked to suspensory behavior and other arboreal proclivities (Zipfel et al., 2011; Henry et al., 2012; Churchill et al., 2013; Churchill et al., 2018; DeSilva et al., 2013; DeSilva et al., 2018; Prang, 2015a; Prang, 2015b; Prang, 2016; Meyer et al., 2017; Rein et al., 2017; Holliday et al., 2018; Prabhat et al., 2021). The new fossils here reinforce these conclusions, signaling a lower back in MH2 as that of an upright biped equipped with powerful trunk musculature potentially used in both terrestrial and arboreal locomotion. The recovery and study of new fossil material, including juvenile material such that the ontogeny of bipedal features can be examined (Ward et al., 2017; Nalley et al., 2019), along with experimental biomechanical work and additional comparative analyses, will allow for testing hypotheses of form and function in the hominin fossil record.

Materials and methods

Wedging angle and neural arch configuration

Request a detailed protocol

Original fossil material was studied in all cases with the exception of two Neandertal specimens (Kebara 2 and Shanidar 3), for which high-quality casts were used. The A. sediba fossils belonging to MH2 (U.W.88-280/281, L1; U.W.88–232, L2; U.W.88–233, L3; U.W.88-127/153/234, L4; U.W.88-126/138, L5) were studied at the University of the Witwatersrand (Johannesburg), as was LES1 Homo naledi (U.W.102a-154B, L1) and fossils purportedly belonging to A. africanus: StW 431 (StW 431r, L1; StW 431s, L2; StW 431t, L3; StW 431u, L4; StW 431v, L5), StW 8 (StW8a, L1; StW8b, L2; StW8c, L3; StW8d, L4), StW 572 (L2), StW 656 (L3), and StW 600 (L5). The A. africanus specimen Sts 14 (Sts 14e, L1; Sts 14d, L2; Sts 14c, L3; Sts 14b, L4; Sts 14a, L5) and possible Paranthropus robustus or early Homo specimen SK 3981b (L5) were studied at the Ditsong National Museum of Natural History, A. afarensis specimens (A.L. 288-1aa/ak/al, L3; A.L. 333–73, L3) at the National Museum of Ethiopia, the H. erectus juvenile individual KNM-WT 15000 (AV/AA, L1; Z/BW, L2; AB, L3; BM, L4; AC, L5) at the National Museums of Kenya, and La Chapelle-aux-Saints 1 at Musée de l’Homme (Paris).

Our comparative sample consisted in total of 43 chimpanzees (Pan troglodytes), 31 western gorillas (Gorilla gorilla), 14 orangutans (Pongo sp.), and 54 modern humans (H. sapiens). To ensure that adequate space between elements was taken into account, we only included great apes with four lumbar vertebrae. Eastern gorillas (Gorilla beringei), which mostly possess just three lumbar vertebrae (Williams et al., 2019), are not included here, nor are other great ape individuals with only three lumbar vertebrae. The human sample includes data from an archaeological sample representing individuals from Africa, Asia-Pacific, and South America studied at the American Museum of Natural History (New York City), Musée de l’Homme, the Natural History Museum (London), and the University of the Witwatersrand. Measurements (listed in Appendix 1) were collected with Mitutoyo digital calipers (Mitutoyo Inc, Japan) and recorded at 0.01 mm; however, we report measurements at 0.1 mm.

Following Digiovanni et al., 1989, we calculated wedging angles for lumbar vertebrae 2–5 using the arctangent of difference between the dorsal and ventral height of the vertebral body and its dorsoventral length (see Appendix 1). We also summed those values into a combined lumbar wedging value. For both great apes and male and female humans, 95% prediction intervals of the mean (1.96 * standard deviation) were calculated for each vertebral level and for the combined wedging values.

Inter-articular facet spacing was measured across the lateral borders of the IAF of lumbar vertebrae three levels apart: on the last lumbar vertebra and on L1 in great apes with four lumbar vertebrae and on L2 in hominins. This is done to estimate the difference in inter-articular facet width at upper and lower lumbar levels and thus quantify neural arch configuration. Due to preservation, this measurement was estimated from the SAF of the L3 vertebra and/or the sacrum in a selection of fossils (A.L. 288–1, Sts 14). In instances of partial preservation, the relevant adjacent elements were articulated to estimate the measurement (MH2, StW 431; KNM-WT 15000). An index was created by dividing the last lumbar-sacrum interarticular facet mediolateral width by that of the upper lumbar vertebrae.

3D reconstruction and geometric morphometric analysis

Request a detailed protocol

For 3D GM analyses, we used subsets of middle lumbar vertebrae that were scanned at the aforementioned institutions using an Artec Space Spider 3D scanner (Source Graphics, Anaheim, CA). The middle lumbar vertebra of hominins with five lumbar vertebrae is the third lumbar vertebra, and that of chimpanzees and gorillas with three lumbar vertebrae is L2. Many chimpanzees and bonobos, western gorillas, and orangutans have four lumbar vertebrae (Williams et al., 2019), and we use L2 in these individuals as well for consistency. Thirty-six modern humans, 28 chimpanzees, 26 western gorillas, and 8 orangutans were included. For this analysis, we also utilized a sample of 23 bonobos (Pan paniscus) and 7 eastern gorillas (G. beringei).

U.W.88–233 is a complete third lumbar vertebra, but it is partially encased in breccia, which obscures some morphologies. The lumbar new vertebrae (U.W.88-232-234) were µCT scanned in partial articulation (Figure 2, Figure 2—figure supplement 1) at the University of the Witwatersrand using a Nikon Metrology XTH 225/320 LC system. Scan settings were 70 kV, 120 μA, 1 s exposure time, and 3000 projections. Voxel size was 0.049 mm and scans included 2000 voxels. The high-resolution µCT scans were processed to yield virtual 3D models. Each vertebra was segmented using Amira 6.2 (Thermo Fisher Scientific, Waltham, MA). After importing µCT scan slices (TIFF files) and creating a volume stack file (.am), an Edit New Label Field module was attached to the stack file. Voxels were selected and assigned to each model separately using the magic wand and brush tools after verification in all three orthogonal views. A Generate Surface module was used to produce a labels file (.labels.am) once an individual element was completely selected. A 3D surface model was created from the labels file using an unconstrained smoothing setting of 5. Models of each element were then saved as polygon (.ply) files. Using GeoMagic Studio software (3D Systems, Rock Hill, SC), broken portions of U.W.88–233 were refitted and the specimen was reconstructed accordingly. The affected portions of the neural arch were pulled dorsally to refit the fractured portion of the left lamina; additionally, the broken and deflected costal process was refitted. The result is a reconstructed 3D model (Figure 4).

Due to crushing of the right SAF, we collected landmarks on the left side of U.W.88–233 and our comparative sample of middle lumbar vertebrae (Table 1). Our 3D landmark set consisted of 48 landmarks distributed across the vertebra to reflect the gross morphology (Appendix 1). Landmarks were collected using the Landmarks tool in Amira on the surface model of U.W.88–233 and on 3D models of middle lumbar vertebrae produced using Artec Studio 14 software (Source Graphics, Anaheim, CA).

We used ‘geomorph’ package version 4.0 (Adams et al., 2021) in R version 4.0.2 (Core Team, 2020) to carry out 3D GM analyses. The geomorph package was then used to subject the raw landmark data to GPA to correct for position, rotation, and size adjustment. The GPA shape scores were then subjected to PCA using the covariance matrix. We evaluated the effects of centroid size on shape using Procrustes distance-based ANOVA on GPA shape scores as implemented in the geomorph package (Goodall, 1991; Adams et al., 2021). Specifically, we evaluated the effect of centroid size as a predictor of middle lumbar shape coordinates within each genus by including a genus interaction term (shape~centroid size * genus). Finally, we analyzed two datasets: one on the full set of 48 landmarks in which only complete (reconstructed) fossils (U.W.88–233, Sts 14c, Shanidar 3) were included, and one on a 37 landmark subset with 11 landmarks on the costal and spinous processes removed so that additional, less well-preserved fossils could be included (A.L. 288-1aa/ak/al, StW 431, Kebara 2).

Appendix 1

Linear and angular measurements

The following measurements were taken on original fossil material or rendered surface models generated from high-resolution µCT scans (see descriptions in Results). Below:

  1. Vertebral body superior transverse width (Martin measurement #7; M7): defined in Bräuer, 1988, as the superior vertebral body transverse diameter at the most laterally projecting points.

  2. Vertebral body superior dorsoventral length (M4): defined in Bräuer, 1988, as the superior vertebral body DV diameter measured at the sagittal midline.

  3. Vertebral body inferior transverse width (M8): defined in Bräuer, 1988, as the inferior vertebral body transverse diameter at the most laterally projecting points.

  4. Vertebral body inferior dorsoventral length (M5): defined in Bräuer, 1988 as the inferior vertebral body DV diameter measured at the sagittal midline.

  5. Vertebral body SI ventral height (M1): defined in Bräuer, 1988, as the ventral SI height of the vertebral body at the sagittal midline.

  6. Vertebral body SI dorsal height (M2): defined in Bräuer, 1988, as the dorsal SI height of the vertebral body at the sagittal midline.

  7. Vertebral body wedging angle: calculation provided in Digiovanni et al., 1989, as [arctangent ((((SI dorsal height-superior DV length)/2)/SI ventral height)*2)].

  8. Vertebral foramen dorsoventral length (M10): defined in Bräuer, 1988, as DV vertebral foramen diameter measured at the sagittal midline.

  9. Vertebral foramen transverse width (M11): defined in Bräuer, 1988, as transverse vertebral foramen diameter measured at the roots of the vertebral arch.

  10. SI inter-articular facet height: SI inter-articular facet distance, measured from the most superior aspect of the SAF to the most inferior aspect of the IAF on the same side. The right side is measured unless it is broken or pathological, in which case the left side is measured. If the two sides are asymmetrical and one is not pathological, the mean is recorded.

  11. Maximum inter-SAF transverse width: maximum (max.) inter-SAF distance, measured from the lateral aspect of one SAF to the lateral aspect of the other.

  12. Minimum inter-SAF transverse width: minimum (min.) inter-SAF distance, measured from the medial aspect of one SAF to the medial aspect of the other.

  13. Maximum inter-IAF transverse width: maximum (max.) inter- IAF distance, measured from the lateral aspect of one IAF to the lateral aspect of the other.

  14. Minimum inter-IAF width: minimum (min.) inter-IAF distance, measured from the medial aspect of one IAF to the medial aspect of the other.

  15. SAF SI height: SAF SI diameter, measured at the sagittal midline. The right side is measured unless it is broken or pathological, in which case the left side is measured. If the two sides are asymmetrical and one is not pathological, the mean is recorded.

  16. SAF transverse width: SAF transverse diameter, measured from the most medial to the most lateral border of the articular surface. The right side is measured unless it is broken or pathological, in which case the left side is measured. If the two sides are asymmetrical and one is not pathological, the mean is recorded.

  17. IAF SI height: IAF SI diameter, measured at the sagittal midline. The right side is measured unless it is broken or pathological, in which case the left side is measured. If the two sides are asymmetrical and one is not pathological, the mean is recorded.

  18. IAF transverse width: IAF transverse diameter, measured from the most medial aspect to the most lateral border of the articular surface. The right side is measured unless it is broken or pathological, in which case the left side is measured. If the two sides are asymmetrical and one is not pathological, the mean is recorded.

  19. Spinous process angle (M12): defined in Bräuer, 1988, as the angle that is formed from the superior surface of the vertebral body and the upper edge of the spinous process. We modify this measurement slightly by measuring the angle along its long axis, which allows for the inclusion of fossils with a damaged or missing superior edge of the spinous process. An angle of 180° is equivalent to a spinous process with a long axis parallel to the superior surface of the vertebral body (i.e., horizontal or neutral in orientation).

  20. Spinous process length (M13): defined in Bräuer, 1988, as the distance from the top edge of the vertebral arch to the most dorsal tip of the spinous process.

  21. Spinous process terminal transverse width: transverse breadth of the dorsal tip of the spinous process, measured at its maximum dimension.

  22. Spinous process terminal SI height: SI diameter of the dorsal tip of the spinous process, measured at the mediolateral midline of the spinous process.

  23. Costal (transverse) process SI base height: SI diameter of the costal process at its medial origin from the pedicle and/or vertebral body.

  24. Costal process dorsoventral angle: the dorsoventral angle that is formed from the sagittal midplane of the vertebra to the long axis of the costal process, along the middle from its base to its tip. The right side is measured unless it is broken or pathological, in which case the left side is measured. If the two sides are asymmetrical and one is not pathological, the mean is recorded.

  25. Costal process length: the distance from the internal edge of the vertebral foramen at its closest point to the base of the costal process to the tip of the costal process. The right side is measured unless it is broken or pathological, in which case the left side is measured. If the two sides are asymmetrical and one is not pathological, the mean is recorded.

  26. SAF orientation: the angle formed between the sagittal midplane of the vertebra to the medial and lateral edges of the SAF. The right side is measured unless it is broken or pathological, in which case the left side is measured. If the two sides are asymmetrical and one is not pathological, the mean is recorded.

  27. Pedicle SI height: SI diameter of the pedicle, measured at its midpoint. The right side is measured unless it is broken or pathological, in which case the left side is measured. If the two sides are asymmetrical and one is not pathological, the mean is recorded.

  28. Pedicle transverse width: transverse breadth of the pedicle, measured at its midpoint. The right side is measured unless it is broken or pathological, in which case the left side is measured. If the two sides are asymmetrical and one is not pathological, the mean is recorded.

  29. Pedicle dorsoventral length: DV diameter of the pedicle, measured anterior from its junction with the superior articular process to its junction with the dorsal edge of the vertebral body. The right side is measured unless it is broken or pathological, in which case the left side is measured. If the two sides are asymmetrical and one is not pathological, the mean is recorded.

  30. Lamina SI height: SI dimension of the lamina, measured on one side between the spinous process and the SAF and the IAF. The right side is measured unless it is broken or pathological, in which case the left side is measured. If the two sides are asymmetrical and one is not pathological, the mean is recorded.

  31. Lamina transverse width: transverse dimension of the lamina, measured at its minimum breadth across the pars interarticularis.

List of 3D landmarks

The following 3D landmarks were collected on middle lumbar vertebrae using AMIRA:

  1. Superior vertebral body – ventral transverse midline

  2. Superior vertebral body – central transverse midline

  3. Superior vertebral body – dorsal transverse midline

  4. Superior vertebral body – lateral sagittal midline

  5. Superior vertebral body – ventro-lateral point

  6. Superior vertebral body – dorso-lateral point (at ventral pedicle base)

  7. Pedicle – superior midpoint

  8. Pedicle – superior dorsal point (at ventral base of prezygapophysis)

  9. Pedicle – medial midpoint

  10. Pedicle – lateral midpoint

  11. Pedicle – inferior midpoint

  12. Pars interarticularis – dorsal midpoint

  13. Pars interarticularis – ventral midpoint

  14. Inferior vertebral body – ventral transverse midline

  15. Inferior vertebral body – central transverse midline

  16. Inferior vertebral body – dorsal transverse midline

  17. Inferior vertebral body – lateral sagittal midline

  18. Inferior vertebral body - ventro-lateral point

  19. Inferior vertebral body – dorso-lateral point

  20. Costal process – superior medial point (based of costal process at pedicle)

  21. Costal process – inferior medial point (based of costal process at pedicle)

  22. Costal process – superior mediolateral midpoint

  23. Costal process – inferior mediolateral midpoint

  24. Costal process – superior lateral point

  25. Costal process – inferior lateral point

  26. SAF – cranial-most point

  27. Mammillary process – dorsal-most extension

  28. SAF – midpoint

  29. SAF – caudal-most point

  30. Spinous process – superior ventral point (at spinous process base)

  31. Spinous process – superior sagittal midpoint

  32. Spinous process – superior dorsal point (tip of spinous process)

  33. Spinous process – inferior dorsal point (tip of spinous process)

  34. Spinous process – inferior sagittal midpoint

  35. Spinous process – inferior ventral point (at spinous process base)

  36. Lamina – inferior midpoint

  37. IAF – cranial-most point

  38. IAF – midpoint

  39. IAF – caudal-most point

  40. IAF – medial-most point

  41. IAF – lateral-most point

  42. SAF – medial-most point

  43. SAF – lateral-most point

  44. Vertebral body – ventral midpoint

  45. Vertebral body – lateral midpoint

  46. Costal process – ventral extension of costal process base at its midpoint

  47. Spinous process – lateral-most extension of the spinous process tip

  48. Lamina – superior midpoint

Data availability

All data generated or analyzed during this study are included in the manuscript and supporting files. Source data files have been provided for Figures 5 and 6 (Figure 5-source data 1, Figure 6-source data 2), and raw XYZ coordinate files for each specimen are available for download on Dryad (https://doi.org/10.5061/dryad.6m905qg0x).

The following data sets were generated
    1. Williams SA
    2. Thomas P
    (2021) Dryad Digital Repository
    XYZ coordinates of middle lumbar vertebrae - 3D GM analysis for: A nearly complete lower back of Australopithecus sediba.
    https://doi.org/10.5061/dryad.6m905qg0x

References

  1. Book
    1. Been E
    2. Gómez-Olivencia A
    3. Kramer PA
    4. Barash A
    (2017) 3D reconstruction of spinal posture of the Kebara 2 Neanderthal
    In: Marom A, editors. Human Paleontology and Prehistory: Contributions in Honor of Yoel Rak. Springer. pp. 239–251.
    https://doi.org/10.1007/978-3-319-46646-0_18
    1. Berger L
    (2012) Australopithecus sediba and the earliest origins of the genus Homo
    Journal of Anthropological Sciences = Rivista Di Antropologia 90:117–131.
    https://doi.org/10.4436/jass.90009
    1. Bräuer G
    (1988)
    Anthropologie. Handbuch Der Vergleichenden Biologie Des Menschen
    Osteometrie, Anthropologie. Handbuch Der Vergleichenden Biologie Des Menschen, Stuttgart, Gustav Fischer Verlag.
    1. Davis PR
    (1961)
    Human lower lumbar vertebrae: some mechanical and osteological considerations
    Journal of Anatomy 95:337–344.
  2. Book
    1. Drake R
    2. Vogl AW
    3. Mitchell A
    (2019)
    Gray’s Anatomy for Students (4th edition.)
    Elsevier.
  3. Book
    1. Latimer B
    2. Ward CV
    (1993)
    The thoracic and lumbar vertebrae
    In: Walker A, Leakey R, editors. The Nariokotome Homo Erectus Skeleton. Cambridge, MA: Harvard University Press. pp. 266–293.
  4. Book
    1. Schmid P
    (1991)
    The trunk of the australopithecines
    In: Senut B, Coppens Y, editors. Origine (s) de La Bipédie Chez Les Hominidés. Paris: Editions du CNRS. pp. 225–234.
    1. Senut B
    2. Pickford M
    3. Gommery D
    4. Mein P
    5. Cheboi K
    6. Coppens Y
    (2001) First hominid from the Miocene (Lukeino Formation, Kenya)
    Comptes Rendus de l’Académie Des Sciences - Series IIA - Earth and Planetary Science 332:137–144.
    https://doi.org/10.1016/S1251-8050(01)01529-4
  5. Book
    1. Shapiro L
    (1993b)
    Functional morphology of the vertebral column in primates
    In: Gebo DL, editors. Postcranial Adaptation in Nonhuman Primates. Dekalb, IL: Northern Illinois University Press. pp. 121–149.
  6. Book
    1. Slijper EJ
    (1946)
    Comparative Biologic-Anatomical Investigations on the Vertebral Column and Spinal Musculature of Mammals
    Amsterdam: North-Holland Publishing Company.
    1. Waters RL
    2. Morris JM
    (1972)
    Electrical activity of muscles of the trunk during walking
    Journal of Anatomy 111:191–199.
  7. Book
    1. Williams SA
    2. Gómez-Olivencia A
    3. Pilbeam DR
    (2019) Numbers of vertebrae in hominoid evolution
    In: Been E, Gómez-Olivencia A, Kramer PA, editors. Spinal Evolution. Springer. pp. 97–124.
    https://doi.org/10.3390/biomimetics4030060

Decision letter

  1. Min Zhu
    Reviewing Editor; Chinese Academy of Sciences, China
  2. Detlef Weigel
    Senior Editor; Max Planck Institute for Developmental Biology, Germany
  3. Martin Hauesler
    Reviewer

Our editorial process produces two outputs: (i) public reviews designed to be posted alongside the preprint for the benefit of readers; (ii) feedback on the manuscript for the authors, including requests for revisions, shown below. We also include an acceptance summary that explains what the editors found interesting or important about the work.

Acceptance summary:

Williams et al. present new fossil remains from the lower back of one of the specimens of Australopithecus sediba, the Malapa Hominin 2 (MH2), so that now almost the complete lumbar spine of this important australopithecine specimen is known. This paper is a very valuable contribution to paleoanthropology especially to those who study the evolution of the vertebral column in hominins.

Decision letter after peer review:

Thank you for submitting your article "New fossils of Australopithecus sediba reveal a nearly complete lower back" for consideration by eLife. Your article has been reviewed by 2 peer reviewers, and the evaluation has been overseen by a Reviewing Editor and Detlef Weigel as the Senior Editor. The following individual involved in review of your submission has agreed to reveal their identity: Martin Hauesler (Reviewer #2).

The reviewers have discussed their reviews with one another, and the Reviewing Editor has drafted this to help you prepare a revised submission.

Essential revisions:

Considering that your conclusions regarding human-like bipedalism are not completely supported by your results, we ask that you state your interpretations related to the locomotor behavior of this specimen in a more cautious manner.

Reviewer #1 (Recommendations for the authors):

This study aims to present new fossil remains from the lower back of one of the specimens of A. sediba (MH2). The authors identified portions of four lumbar vertebrae (L1-L4). The L3 is near complete, and they focussed most of the analyses on this vertebra.

Overall, this is a very interesting and valuable contribution to paleoanthropology. However, I have some major concerns that should be addressed before acceptance. In general, the methods need to be explained in more detail, and some of the analyses need to be revised. Also, another concern is that in some parts of the paper, the authors try to demonstrate that the lower back of MH2 is human-like instead of describing more neutrally these very valuable fossils. In this sense, I think this is where the authors try to do more than it is directly set up to do. If the authors want to test if the lower back of MH2 shows more or less human-like traits that might suggest a kind of bipedal locomotion, the inclusion of hypotheses to test are necessary. I will be happy to review any other versions.

Specific comments:

Line 47: I agree based on the morphology of the fossils, that A. sediba used its lower back in a kind of bipedalism. However, the mosaic of features shown in the lower back tells us that we should be cautious to affirm that was a “human-like bipedalism”. The authors should find another way to define it, human-like bipedalism (which is an obligated or complete bipedalism) is not demonstrated here.

Lines 84-103: A figure representing the site, road, the site, etc, indicating where the fossils were found, would be very helpful to understand the context. This is necessary when new fossils are presented.

Line 110: Please, specify here the hypotheses you test in this work.

Line 116: As I comment (see below), these measurements could have been used to test/compare MH2 with other hominin fossils and extant hominids as a complementary analysis to GMM. However, I appreciate you included the measurements and the 3D digital models.

Line 141: Please clarify why do identify these vertebrae as L2 and L3. Some arguments are needed to assign anatomical identification to new fossils. If is just because they refit with the previously known vertebrae, say it, if you have other anatomical arguments, describe them.

Line 189: You have used the 95 % of confidence for other analyses (see Line 244), but here you have included the 100 % of the modern human variability. Also, morphological differences between hominins and great apes are very large and therefore, differences between modern humans and fossils can be diluted. I would suggest repeating this PCA including only modern humans and the three fossil remains with a 95% confidence ellipse. I am not saying to remove these plots from the manuscript, but an extra analysis to zoom on what is the most interesting comparative. We do not doubt that MH2 is going to plot closer to modern humans than to orangutans.

Lines 205-206: I don't agree with the statement referring to the vertebral body shape. I think the second analysis, that excluding the spinous process and transverse process, is a better proxy for analyzing differences or similarities of the vertebral shape. The results from that analysis (Lines 213-215) contradict this affirmation and suggest that the vertebral shape of U.W.88-233 (and that of Sts 14) is not within the modern human's variability. Said that I appreciate the effort of including more fossil remains in the sample.

Line 219: There exist specific functions inside geomorph package to test for allometry. This ANOVA is not enough to affirm that all the groups present the same (parallel) allometric vector. If the authors want to affirm this, please, test it properly.

Line 275: I would like to know which hypotheses are you testing here, and discuss the results of these tests in this section.

Line 276: These three characteristics are a demonstration of modern human-like morphology rather than bipedal primary adaptations. For example, Neandertals were also bipeds and did not show that degree of lumbar lordosis. I understand that a human-like lumbar morphology might suggest a similar locomotor behavior, but state that “demonstrates” is going too far.

Line 352: Analyses based on linear or angular variables, are not 2D analyses. Indeed, are univariate variables and therefore unidimensional analyses.

Line 354: High-quality what? If is a scanned 3D model, please specify the technical characteristics of it (resolution, etc.).

Lines 354-357: Please, this is the “Materials” section, be specific with the fossil remains used in this study as you do with the comparative sample. Also, indicate whether the fossil remains are a second, third, fourth, or fifth lumbar vertebra.

Line 357: Why varied among analyses?

Line 370: What do you mean by "we only include well sampled chimpanzees and western gorillas from the comparative sample”? What about the other analyses, aren't they well sampled?

Line 373: Specify how (software, function) did you perform this resampling.

Line 375: Clarify why you used different vertebral elements to measure this distance.

Line 383: I guess I know why, but please, explain why you use L2 as a middle lumbar vertebra in great apes and not L3.

Lines 384-386: For the 3D analyses, did you also select exclusively those individuals with four lumbar vertebrae? Eastern gorillas have a vertebral formula of 7:13:3:6, that is, they usually have three lumbar vertebrae. Also, in Line 386, add graueri to Gorilla beringei, otherwise, that could also refer to mountain gorillas (Gorilla beringei beringei).

Line 387: Be specific with the anatomical determination of the vertebra, “U.W.88-233 is a complete third lumbar vertebra”.

Line 388: Lumbar block is not appropriated. It could be the block including the fossil lumbar vertebrae or something similar.

409: I don't think a PCA is a good method to detect outliers. Your sample includes very diverse species, and an outlier may not be detected in such a huge variability. There are other, more specific, and appropriate methods to detect outliers. Please, modify this, and apply other functions such as plotOutliers from geomorph, or find.outliers from Morpho (or any other similar to these). The latter also includes a visual interface to detect possible mistakes in landmarking that are difficult to detect simply by plotting the sample looking for outliers.

412: Do you also use geomorph to perform the PCA? I am a bit confused with the plots you obtained. Also, I never saw those wireframes to visualize shape changes. Clarify where did you get them from. In addition, why don't you use those 3D models you have to obtain a more clear and visual representation of the shape's extreme morphologies? In the list of co-authors, some researchers usually represent shape variation showing modified 3D models.

Line 412: Here I miss the goal of the regression analysis. This goes together with the lack of hypotheses to test, which could justify the methodological procedure of this work. Also, there is a very important lack of information about how this analysis was carried out. In the Results section, there is more information about the procedure than in the section “Methods” itself. Please, explain here step by step how did you perform this analysis. Also, in the Results section you mention that you grouped the species into genera pooling hominins together, but to perform a regression analysis including different species pooled into genera, previously you should remove the within-group variation.

Line 415: In the same vein, you mention you carried out two analyses. But these are not analyses themselves. You used a different number of landmark coordinates to perform different analyses, which in addition you do not mention here. Please rewrite this paragraph and explain what you did.

Line 595: Please describe the first “block” either from caudal to cranial or vice versa, but following an anatomical order. You start by the sacrum, then L5, then L4, L5 again, and finally S1.

In the second block you follow the cranial-caudal direction for describing it, please, be consistent (same for the first block).

Line 628: This is my concern about MH2 human-like vertebral body morphology. Once you remove the spinous process and the transverse processes, basically what we have is the vertebral body and the articular facets. The results indicate that australopiths are outside the modern humans' range of variation.

Lines 637-642: All this information should be in a table. It is difficult to compare and follow all the information you show here.

Line 645: Regarding the column with the values of gorillas and chimpanzees, clarify what Table are you referring to (Excel Table with the raw data for Figure 6 I guess).

Line 655: Thanks for providing all this information. This is just my point of view, and I will leave it in the hands of the AE, but I think a simple non-parametric analysis (e.g. Mann-Whitney u test) comparing these traits between extinct and extant species would have been very useful to assess specific significant differences (or similarities) between MH2 lumbar vertebrae and those of other australopiths, Neanderthals, modern humans, and great apes. The results could have (or not) demonstrate in specific traits (e.g. vertebral body) the similarities between modern humans and MH2 you propose as demonstrated by other methods (and I have my doubts after your results).

Line 856: Describe the views as in the other A, B, and C figures. Also, provide the number of the landmarks, if not all because of the lack of space, at least most of them.

Line 859: These analyses are not explained in the Methods section. Neither the obtained results. Include or remove them.

Line 860: “between U.W. 88-233 and extant and fossil middle lumbar vertebrae” Here only some of the extant species included in the sample are analyzed. Why? Specify which species you included.

Line 863: Could you please explain what is this within (Homo, Pan) (mean Procrustes distance?), or better said, the purpose of comparing that mean? Also, in this Figure 3 (B), why there is not lateral view as in Figure 3 (C)?

Line 868: Here it would be interesting to comment that both australopiths plot within the chimpanzees' range of variation, and the Neandertal within (or in the limit) of modern humans.

Reviewer #2 (Recommendations for the authors):

Please always use the correct anatomical terms according to the current version of the Terminologia anatomica. The "lumbar transverse process" is an erroneous, antiquated and obsolete term that needs to be replaced by "costal process" throughout the paper. See also Strzelec, B., Chmielewski, P.P., Gworys, B., 2017. The Terminologia Anatomica matters: examples from didactic, scientific, and clinical practice. Folia Morphologica 76, 340-347.

Likewise, the term "spinal canal" designates the canal that is formed by the vertebral foramina of several subsequent vertebrae for the spinal cord, but in the individual vertebra it would be termed "vertebral foramen".

A more stylistic issue is the use of the colloquial term "australopith". This word represents a sloppy mutilation of "pithekos", the Greek word for "ape". The syllable "pith" in australopith is nonsensical. Some people say they prefer this slang because they claim that the "australopithecine" would imply monophyly of the genera Australopithecus and Paranthropus. This is, however, not correct. Australopithecines is not only the English term for the former subfamily "Australopithecinae", but also for the subtribe "Australopithecina" of modern systematics. Therefore, I strongly urge the authors to replace "australopiths" with "australopithecines"

The authors compare the morphology of the newly described, complete third lumbar vertebra U.W. 88-233 of A. sediba to the "middle lumbar vertebrae" of modern humans, chimpanzees and gorillas. It is for me, however, unclear, what they exactly mean with "middle lumbar vertebra" because australopithecines and modern humans possess on average 5 lumbar vertebrae and chimpanzees and gorillas generally have (3-) 4. Could the authors therefore shortly discuss the issue of homology and how the outcome would be affected if U.W. 88-233 and the human L3 would be compared to L2 vs. L3 in the great apes.

L213 "Humans and great apes separate along PC1, which is largely explained by vertebral body height": isn't it rather vertebral wedging?

L214 "U.W.88-233 and Sts 14 fall intermediately between modern humans and great apes along PC1": This should be changed to say that this applies to all australopithecines.

L237 "a ventral curvature of the lumbar spine": a lordotic curve cannot be described as a ventral curvature-it is a ventrally convex curvature.

L241 "sum L2-L5 wedging" is awkward. Consider something like "total L2-L5 wedging angle"

L248 "see Figure 6 caption": Unfortunately, I don't see the data for chimpanzees in in Figure 6., and also the caption to Figure 6 does not provide more relevant information. On the other hand, I don't think it is a good option to use figure captions to present additional information that is otherwise not contained within the manuscript.

L249 "Patterns of change across lumbar levels demonstrate that MH2's vertebrae transition from ventral (kyphotic) wedging at the L2 (most similar to male modern humans) and L3 (most similar to female modern humans) levels to dorsal (lordotic) wedging at L4. At the L4 level MH2 is most similar to female modern humans and female…": In my opinion, inferences for a greater similarity of the vertebral wedging patterns of fossil hominins to a specific modern humans sex is overinterpreting the data. Thus, the considerable variability of these wedging patterns within modern humans needs to be taken into account. In fact, the data presented in Figure 6 suggest that both males and females transition from ventral to dorsal wedging between L3 and L4. This also relates to the quite misleading use of the 95% confidence intervals of the means in Figure 6 rather than the 95% confidence intervals of the sample data (see my comment to Figure 6).

L270 Maybe the authors can briefly discuss the functional significance of the pyramidal configuration for lumbar lordosis and cite the corresponding literature. It would also be good to discuss Oreopithecus in this context, for which a similar pyramidal configuration has been reported (Köhler, M., Moyà-Solà, S., 1997. Ape-like or hominid-like – the positional behavior of Oreopithecus bambolii reconsidered. Proceedings of the National Academy of Sciences of the United States of America 94, 11747-11750.)

L288 "ample surface area": isn't the length of the lever arm of the costal processes more relevant than the relatively moderate increase in surface area (if at all) compared to that of modern humans? And why do australopithecines need more powerful trunk musculature than modern humans? I also don't understand, why a cranial orientation of the costal processes should increase the "moment arms and torque generation capabilities of psoas major and quadratus lumborum". Isn't the lever arm only related to its length perpendicular to the force vector? I therefore think that the cranial orientation of the costal process must have another explanation.

L290 There is no "middle lumbar fascia", but the anterior and middle layers of the thoracolumbar fascia insert on the costal processes. On the other hand, the m. obliquus externus abdominis has generally no contact to the thoracolumbar fascia in modern humans as far as I know.

L295 Please rephrase. Muscles cannot "support" the pelvis. Support means "bear all or part of the weight of something", but as muscles cannot counteract compressive forces they cannot bear weight. Moreover, the support of a structure must be below the structure itself.

L299 Please also see Tardieu et al. (2017. How the pelvis and vertebral column became a functional unit in human evolution during the transition from occasional to permanent bipedalism? Anatomical Record 300, 912-931) who show that the pelvic incidence of alternative pelvic reconstructions of MH2 falls well within the range of modern humans.

L303 The analysis of La Chapelle-aux-Saints demonstrated that Neanderthals possessed a well-developed lordosis similar to modern humans, see Haeusler et al. (2019. Morphology, pathology and the vertebral posture of the La Chapelle-aux-Saints Neandertal. Proceedings of the National Academy of Sciences of the United States of America 116, 4923-4927). Moreover, the reported low pelvic incidence of SH1 is probably misleading because it is due to a lumbosacral transitional anomaly, see Haeusler, M., 2019. Spinal pathologies in fossil hominins, in: Been et al.. (Eds.), Spinal Evolution: morphology, function, and pathology of the spine in hominoid evolution. Springer, Cham, pp. 213-245.

L308 Please see my other comments. I don't think it is possible to differentiate the sex based on the wedging values.

L309 This is not true. Schiess et al. (2014. Revisiting scoliosis in the KNM-WT 15000 Homo erectus skeleton. Journal of Human Evolution 67, 48-59.) demonstrated that KNM-WT 15000 (Homo erectus) possesses an even slightly stronger dorsally wedged L5 vertebra than MH2. Nevertheless, it was still within the 95% range of variation of modern humans (see their Table 4 and Figure 5D)

L337 Please mention also that its presence has been claimed for Oreopithecus (see above)

L354 „high-quality" seems to miss "scans" or something similar. It would be useful if the authors could indicate where they come from. At least the scans of Shanidar3 that are distributed by the Smithsonian can nowadays hardly be called "high quality". Please also note that the Shanidar vertebrae are extensively reconstructed.

L357 I'm not aware that any of the fossils used in the present study are curated at the NHM London. Please check.

L365 I wasn't aware that also modern human skeletons are curated at the Musée Royale de l'Afrique Centrale. Please check.

L368 Please note that this is a basic trigonometry approach that has been used by DiGiovanni et al., and I therefore recommend to say this rather than citing DiGiovanni et al. There is also no fancy "wedging angle equation" necessary, but the simple use of the tangent. On the other hand, this equation is not provided in Table 1 as the text suggests, so it might be good to rephrase this sentence.

L372 Why this? What is needed here is the 95% range of variation or more precisely, the 3rd to 97th inter-percentile range.

Figure 6 Please show the 95% confidence intervals of the sample data, not the 95% confidence intervals of the means for modern humans males and females. This misleading and does not acknowledge the considerable range variation that is typical for these wedging data (see e.g., Figure 5D in Schiess et al. 2014).

L637-642 Please consider to report these values in a table rather than in the figure caption

Figure 7 Please use the correct scientific abbreviations! On the other hand I don't think it is still fine to use H. neanderthalensis for the Neanderthals since genetic data clearly demonstrate interbreeding with modern humans

[Editors' note: further revisions were suggested prior to acceptance, as described below.]

Thank you for resubmitting your work entitled "New fossils of Australopithecus sediba reveal a nearly complete lower back" for further consideration by eLife. Your revised article has been evaluated by 2 reviewers and the evaluation has been overseen by a Reviewing Editor and Detlef Weigel as the Senior Editor.

The manuscript has been improved but there are few remaining issues that need to be addressed.

One of the issues concerns the wedging angles. The authors compare the wedging angles of the MH2 lumbar vertebrae with the 95% confidence intervals of the mean female and the mean male modern human wedging angles. Generally, these 95% confidence intervals about the means are useful if the purpose is to compare two samples and to explore whether their means are different. However, the mean values are unknown for A. sediba as a species (or any other fossil hominin species). Only those of a single A. sediba individual, MH2, are known, and a comparison of the means of A. sediba with those of modern humans is therefore unwarranted. We can only compare the MH2 specimen with the modern human sample by hypothesizing that there is no difference between A. sediba and H. sapiens for this trait in terms of the distribution of the data points of the entire species (=H1a). This means that individual data points will of course differ from the mean and form a Gaussian distribution about the hypothetical mean value. Under this assumption, the data point for A. sediba would therefore fall with a 95% probability within a certain range. This is represented by the 95% confidence interval of the sample (also known as the 95% prediction interval). Thus, the 95% prediction interval represents the range of values that likely contains the value of a new observation given the distribution of the comparative sample. This 95% prediction interval can be approximated by 2 standard deviations (more precisely, it would be 1.96×standard deviations), and the authors now also show this range in their Figure 5, but unfortunately, they do not use this interval further and do not discuss it in the text, but inappropriately base their discussion and conclusion on the 95% confidence intervals about the mean.

Reviewer #1 (Recommendations for the authors):

I am satisfied that the authors have addressed most of my concerns, especially those regarding the interpretation of their results. I am also glad about the inclusion of the hypotheses, which I think help to better understand and follow the purpose of this work. The authors have explained in greater detail some methodological aspects that needed some clarification. All in this, the discussion is much more solid and coherent with the results than the previous version. In general, the authors have done a great good job. As I assessed in my first revision, these fossils are a great contribution to paleoanthropology, especially to the study of the evolution of the vertebral column in hominins. Thus, I recommend the publication of this manuscript after correcting a few details.

First, I have some doubts about one aspect of the rebuttal document:

The only point I think was not clarified in my previous revision referred to Supplementary Figure 3 (from the first version). I wrote: "Line 859: These analyses are not explained in the Methods section. Neither the obtained results. Include or remove them.".

The authors have clarified that: "It was in fact referenced in both the Methods (penultimate paragraph) and in the Discussion (p. 10):. In the main text, we wrote, "We plotted standardized shape scores derived from a multivariate regression of shape on centroid size against centroid size to visualize shape changes (Drake and Klingenberg, 2008) (Supplementary Figure 4)."

But this refers to Supplementary figure 4 (Line 868), and not to Supplementary figure 3, which corresponds with Line 859. I appreciate they clarified this part, but the analyses and results from this Supplementary Figure 3 are still not explained in the manuscript. This figure reads "Procrustes distances and mean differences…" but neither a reference to Procrustes distances nor to mean differences appear in the entire manuscript apart from this footnote. In the rebuttal to my concern about Line 863, which also refers to this figure, they explain in detail what this figure means, and I appreciate it, but this should also be in the manuscript.

Reviewer #2 (Recommendations for the authors):

The revised manuscript has improved in many aspects. Particularly, it is now more than a simple exploratory study, having a greater focus on hypothesis testing. However, the wrong use of statistics in the analysis and hypothesis testing of the wedging angles still represents a major issue that needs to be addressed.

Thus, the first hypothesis (H1a) of the current study is that there is no difference between the wedging angles of MH2 and modern humans, and another hypothesis, which I call H1b, is that they are distinct from extant great apes. To test hypothesis H1a, the authors compare the wedging angles of the MH2 lumbar vertebrae with the 95% confidence intervals of the mean female and the mean male modern human wedging angles. Generally, the 95% confidence intervals about the means are useful if the purpose is to compare two samples and to explore whether their means are different. However, the distribution of the wedging angles and thus their mean values are unknown for A. sediba (or any other fossil hominin species). Only those of a single A. sediba individual, MH2, are known, and a comparison of the means of A. sediba with those of modern humans is therefore not possible. We can only compare the MH2 specimen with the modern human sample by hypothesizing that there is no difference between A. sediba and H. sapiens for this trait (=H1a). Under this assumption, the data point for A.sediba would therefore fall with a 95% probability within a certain range. This is represented by the 95% confidence interval of the sample (also known as the 95% prediction interval). Thus, the 95% prediction interval represents the range of values that likely contains the value of a new observation given the distribution of the comparative sample. This 95% prediction interval can be approximated by 2 standard deviations (more precisely, it would be 1.96×standard deviations), and the authors now also show this range in their Figure 5, but unfortunately they don't use this interval further and don't discuss it within the text.

In fact, Figure 5 shows that the wedging angles of all lumbar vertebrae of MH2 fall within the 95% prediction intervals of both modern human males and females. The same is true for all other analysed fossil hominins, except for Shanidar 3 and Kebara 2, whose wedging angles of L2 fall only within the male range of the current sample. Because we don't know the 95% confidence intervals about the means of the A. sediba wedging angles (or those of A. africanus, etc.), it is irrelevant whether MH2 (or Sts 14 or StW 431) lies closer to the female or the male means of modern humans for some vertebrae, as they are only some individuals. The corresponding sections in the text (L316-319 and L350-366) should therefore be rephrased accordingly. Likewise, the right side of Figure 5 needs to be adapted to show the 95% prediction intervals rather the 95% confidence intervals of the means.

Hypothesis H1b (that the wedging angles of MH2 are distinct from extant great apes) is only marginally addressed as far as I can see. Thus, wedging angles are only reported in Table 2 for chimpanzees (and thus only for one of three great ape genera). Nevertheless, it seems that the wedging angles of vertebrae L2-L4 of MH2 are well within the 95% prediction intervals for chimpanzees (as approximated by the means {plus minus} 2 SD). Does this therefore mean that lumbar lordosis of MH2 or other fossil hominins cannot statistically be differentiated from that of chimpanzees? Can the authors expand on this? It also would be helpful if the means and the 95% prediction intervals for chimpanzees (and if possible gorillas and orangutans) are included in figure 5 (or in an additional figure).

Regarding my suggestion to include KNM-WT 15000 into the study, I agree with the authors that this is not so easy for the 3D GM analyses due to its subadult age. However, I still maintain that the addition of KNM-WT 15000 would be fundamental to the interpretation of the wedging angles as it shows that the strong lordotic wedging of L5 is not exceptional in MH2 and Kebara 2 (see Schiess et al. 2014). The subadult age of KNM-WT 15000 explains of course the missing vertebral ring apophyses, but this does not affect the wedging angles of the vertebral bodies since the ring apophyses are flat.

https://doi.org/10.7554/eLife.70447.sa1

Author response

Reviewer #1 (Recommendations for the authors):

This study aims to present new fossil remains from the lower back of one of the specimens of A. sediba (MH2). The authors identified portions of four lumbar vertebrae (L1-L4). The L3 is near complete, and they focussed most of the analyses on this vertebra.

Overall, this is a very interesting and valuable contribution to paleoanthropology. However, I have some major concerns that should be addressed before acceptance. In general, the methods need to be explained in more detail, and some of the analyses need to be revised. Also, another concern is that in some parts of the paper, the authors try to demonstrate that the lower back of MH2 is human-like instead of describing more neutrally these very valuable fossils. In this sense, I think this is where the authors try to do more than it is directly set up to do. If the authors want to test if the lower back of MH2 shows more or less human-like traits that might suggest a kind of bipedal locomotion, the inclusion of hypotheses to test are necessary. I will be happy to review any other versions.

We greatly appreciate the reviewer’s time in providing detailed comments and lending their time to help improve our manuscript. We think their requests are reasonable (although we think poor word choice on our part is to blame rather than our desire to “try” to make MH2 look more human-like, and we have made changes where appropriate), and we have explained the methods in more detail and revised the analyses and presentation of results as requested.

Specific comments:

Line 47: I agree based on the morphology of the fossils, that A. sediba used its lower back in a kind of bipedalism. However, the mosaic of features shown in the lower back tells us that we should be cautious to affirm that was a “human-like bipedalism”. The authors should find another way to define it, human-like bipedalism (which is an obligated or complete bipedalism) is not demonstrated here.

We understand the point the reviewer makes here and think our use of “human-like” was misunderstood. We clarify that we do not think MH2 or any early hominin engaged in modern human-like bipedalism. Instead, we were mainly referring to “human-like” bipedalism to contrast with ape-like bipedalism. Our comparisons of MH2 to modern humans are done because we are the only extant hominins for which we can gather large samples to compare to fossil hominins. We fully agree that MH2 and other early hominins were not fully modern human-like in bipedalism; in fact, we suspect that many modern human adaptations have to do with endurance walking and even running, which would be absent in tree-climbing early hominins like A. sediba.

Lines 84-103: A figure representing the site, road, the site, etc, indicating where the fossils were found, would be very helpful to understand the context. This is necessary when new fossils are presented.

We have now included a new supplementary figure showing the location of the mining road at Malapa.

Line 110: Please, specify here the hypotheses you test in this work.

We have now added hypotheses throughout the manuscript. Thank you for this suggestion.

Line 116: As I comment (see below), these measurements could have been used to test/compare MH2 with other hominin fossils and extant hominids as a complementary analysis to GMM. However, I appreciate you included the measurements and the 3D digital models.

We appreciate this suggestion and address it below.

Line 141: Please clarify why do identify these vertebrae as L2 and L3. Some arguments are needed to assign anatomical identification to new fossils. If is just because they refit with the previously known vertebrae, say it, if you have other anatomical arguments, describe them.

It is based in part of their morphology, but largely on the fact that they refit with known elements, the penultimate lumbar vertebra of MH2, which is preserved in articulation with the ultimate lumbar vertebra and the sacrum. In other words, the morphology of the new vertebrae does not contradict their apparent numeration and association with previously known lower lumbar vertebrae. We have made this more clear in the manuscript.

Line 189: You have used the 95 % of confidence for other analyses (see Line 244), but here you have included the 100 % of the modern human variability. Also, morphological differences between hominins and great apes are very large and therefore, differences between modern humans and fossils can be diluted. I would suggest repeating this PCA including only modern humans and the three fossil remains with a 95% confidence ellipse. I am not saying to remove these plots from the manuscript, but an extra analysis to zoom on what is the most interesting comparative. We do not doubt that MH2 is going to plot closer to modern humans than to orangutans.

Thank you for the suggestion. We repeated the 3D GM analysis using only humans with the ‘geomorph’ package version 4.0 in R version 4.0.2. The patterns observed along the first two principal components are very similar to the patterns we detected along PC1 and PC4 in our original analysis (Figure 7c; Figure 7—figure supplement 2). You will see that figure now includes 95% CIs of the human data. We have contextualized this with our functional interpretation of costal processes.

Lines 205-206: I don't agree with the statement referring to the vertebral body shape. I think the second analysis, that excluding the spinous process and transverse process, is a better proxy for analyzing differences or similarities of the vertebral shape. The results from that analysis (Lines 213-215) contradict this affirmation and suggest that the vertebral shape of U.W.88-233 (and that of Sts 14) is not within the modern human's variability. Said that I appreciate the effort of including more fossil remains in the sample.

The reviewer is correct that the spinous and costal processes are driving a lot of the variation in the first PCA and we should focus on the second PCA (without those processes) for vertebral body differences. We have modified the text to reflect the points the reviewer has made.

Line 219: There exist specific functions inside geomorph package to test for allometry. This ANOVA is not enough to affirm that all the groups present the same (parallel) allometric vector. If the authors want to affirm this, please, test it properly.

In general, analysis of variance (ANOVA) is an extension of ordinary least-squares (OLS) regression, but it enables one to examine and partition variance in a response variable in a more intuitive way given that we can examine the extent to which predictor variables (e.g., centroid size) “soak up” variance in a response variable (i.e., lumbar vertebra shape) by examining the F statistic, mean square, sum of squares, and residual sum of squares. Both ANOVA and OLS fall under the umbrella of linear modeling.

The only way to test for the effects of centroid size on shape (i.e., “allometry”) in the geomorph package is through the use of the procD.lm function (which can be expanded to include a phylogenetic tree as a variance-covariance matrix in the error term of the linear model in a large comparative study using the function ‘procD.pgls’). According to the geomorph package.PDF: “Prior to geomorph 3.0.0, the function, plotAllometry, was used to perform linear regression of shape variables and size, and produce plots to visualize shape allometries. […] This function coalesces a few plotting options found in other functions, as a wrapper, for the purpose of retaining the plot.procD.allometry options in one place.”

We used the function ‘procD.lm’ in geomorph to evaluate the effect of centroid size on lumbar shape with a genus interaction (i.e., testing whether the estimated effect of centroid size on lumbar shape differed by genus). This function uses an approach that is known as a Procrustes ANOVA (Goodall, 1991), which is equivalent to distance-based ANOVA designs (Anderson, 2001). Another way to interpret the inclusion of the interaction term into the model is that in a simpler univariate model (i.e., response variable ~ predictor variable), the slope and intercept would be estimated separately for each genus. As reported in the manuscript, “The results show significant effects of centroid size (F = 9.83; p < 0.001), genus (with hominins pooled; F = 27.7; p < 0.001), and an interaction between genus and centroid size (F = 1.48; p = 0.01), implying unique shape allometries within genera (Table 4).” In other words, we found that centroid size predicts shape changes in lumbar vertebrae across each genus, and that the way in which shape changes according to changes in centroid size differs across each group. We did not find support for the hypothesis that the “allometric” changes are the same (which could be, but do not necessarily have to be, represented by parallel “allometric vectors”).

Line 275: I would like to know which hypotheses are you testing here, and discuss the results of these tests in this section.

We have now added hypotheses throughout the manuscript. Thank you for this suggestion.

Line 276: These three characteristics are a demonstration of modern human-like morphology rather than bipedal primary adaptations. For example, Neandertals were also bipeds and did not show that degree of lumbar lordosis. I understand that a human-like lumbar morphology might suggest a similar locomotor behavior, but state that “demonstrates” is going too far.

We understand the reviewer’s points here and have modified how we talk about this throughout.

Line 352: Analyses based on linear or angular variables, are not 2D analyses. Indeed, are univariate variables and therefore unidimensional analyses.

We have changed the subtitle.

Line 354: High-quality what? If is a scanned 3D model, please specify the technical characteristics of it (resolution, etc.).

“Casts” was accidentally dropped. Casts of Kebara 2 and Shanidar 3 were borrowed from Erik Trinkaus, as mentioned in the acknowledgments. We have added “casts” back in. Thank you.

Lines 354-357: Please, this is the “Materials” section, be specific with the fossil remains used in this study as you do with the comparative sample. Also, indicate whether the fossil remains are a second, third, fourth, or fifth lumbar vertebra.

We now mention all fossil specimens included in the study by museum, specimen number, and vertebral level.

Line 357: Why varied among analyses?

We have dropped this misleading phrase that we used to indicate that not all chimpanzees, for example, were included in all of the analyses. Those with three lumbar vertebrae, for example, were excluded from the vertebral wedging analyses. This is already indicated in the manuscript elsewhere.

Line 370: What do you mean by “we only include well sampled chimpanzees and western gorillas from the comparative sample”? What about the other analyses, aren't they well sampled?

We are emphasizing that they are well-sampled taxa. Other taxa are not well-sampled for some analyses. For example, we did not collect some caliper measurements on eastern gorillas, bonobos, and orangutans, although we do have other measurements and some 3D models of select lumbar vertebrae.

Line 373: Specify how (software, function) did you perform this resampling.

We used PAST 4 to run Bootstrap. We now list PAST 4 version 4.06b and cite Hammer et al. (2001).

Line 375: Clarify why you used different vertebral elements to measure this distance.

It is the coverage of levels that needs to be standardized. Great apes have fewer lumbar vertebrae, so, in humans L2-L5 is used (equivalent to L1-L4 in great apes). There is also a practical reason – L1 is largely not preserved in MH2.

Line 383: I guess I know why, but please, explain why you use L2 as a middle lumbar vertebra in great apes and not L3.

In humans, L3 is obviously the middle of a 5-element lumbar column. L2 is the middle lumbar for many chimps and gorillas with 3 lumbar vertebrae; either 2 or 3 is middle for columns with 4 lumbar vertebrae, so we decided to use L2 for consistency.

Lines 384-386: For the 3D analyses, did you also select exclusively those individuals with four lumbar vertebrae? Eastern gorillas have a vertebral formula of 7:13:3:6, that is, they usually have three lumbar vertebrae. Also, in Line 386, add graueri to Gorilla beringei, otherwise, that could also refer to mountain gorillas (Gorilla beringei beringei).

No, since middle lumbar vertebrae were being analyzed, we used L2 for all great apes. We realize this includes the antepenultimate lumbar vertebra of many western gorillas, chimps, and orangs, but the penultimate lumbar vertebra of most eastern gorillas (and some western gorillas and chimps), but we did not see evidence for separation between specimens with 3 and 4 lumbar vertebrae. Regarding eastern gorillas, we refer to the species Gorilla beringei and not specific subspecies. Our samples include both G. beringei graueri and G. b. beringei.

Line 387: Be specific with the anatomical determination of the vertebra, “U.W.88-233 is a complete third lumbar vertebra”.

“third” added.

Line 388: Lumbar block is not appropriated. It could be the block including the fossil lumbar vertebrae or something similar.

We have taken the reviewer’s advice and changed our references to both the “lumbar block” and the “lower thoracic block.”

409: I don't think a PCA is a good method to detect outliers. Your sample includes very diverse species, and an outlier may not be detected in such a huge variability. There are other, more specific, and appropriate methods to detect outliers. Please, modify this, and apply other functions such as plotOutliers from geomorph, or find.outliers from Morpho (or any other similar to these). The latter also includes a visual interface to detect possible mistakes in landmarking that are difficult to detect simply by plotting the sample looking for outliers.

We agree and have dropped this altogether.

412: Do you also use geomorph to perform the PCA? I am a bit confused with the plots you obtained. Also, I never saw those wireframes to visualize shape changes. Clarify where did you get them from. In addition, why don't you use those 3D models you have to obtain a more clear and visual representation of the shape's extreme morphologies? In the list of co-authors, some researchers usually represent shape variation showing modified 3D models.

Geomorph was used to perform the PCA. Wireframes were plotted using R. We prefer to use wireframes to display shape changes here for two reasons. First, wireframes display shape changes in landmarks directly, whereas the use of a 3D model involves interpolating the parts of the 3D model that were not explicitly quantified using landmarks. Second, the use of wireframes is also somewhat more practical since we would have to mirror the landmarks and the 3D template mesh to produce warped models. Finally, the authors you mention are not carrying out the 3D GM analyses in this case.

Line 412: Here I miss the goal of the regression analysis. This goes together with the lack of hypotheses to test, which could justify the methodological procedure of this work. Also, there is a very important lack of information about how this analysis was carried out. In the Results section, there is more information about the procedure than in the section “Methods” itself. Please, explain here step by step how did you perform this analysis. Also, in the Results section you mention that you grouped the species into genera pooling hominins together, but to perform a regression analysis including different species pooled into genera, previously you should remove the within-group variation.

The goal of the Procrustes distance-based analysis of variance (ANOVA) on GPA shape scores is to evaluate the effect of centroid size on middle lumbar vertebra shape (“allometry”). This goal fits into the larger purpose of the 3D GM analysis of the new Australopithecus sediba middle lumbar vertebra (U.W. 88-233) since shape differences between this fossil specimen and any extant taxon, such as Homo sapiens, could be explained by differences in size (“allometry”). Our results suggest that, while we detect a statistically significant effect of centroid size on middle lumbar vertebral shape within each group, the differences observed between Au. sediba and modern humans appears not to be explained by size alone. We have tried to explain this better. The model formula is: gpa cords ~ centroid size * genus. We have added a new sentence clarifying this and have attempted to better incorporate this portion of the analyses generally.

Line 415: In the same vein, you mention you carried out two analyses. But these are not analyses themselves. You used a different number of landmark coordinates to perform different analyses, which in addition you do not mention here. Please rewrite this paragraph and explain what you did.

We have reworded this part.

Line 595: Please describe the first “block” either from caudal to cranial or vice versa, but following an anatomical order. You start by the sacrum, then L5, then L4, L5 again, and finally S1. In the second block you follow the cranial-caudal direction for describing it, please, be consistent (same for the first block).

We have reorganized the caption to Figure 2.

Line 628: This is my concern about MH2 human-like vertebral body morphology. Once you remove the spinous process and the transverse processes, basically what we have is the vertebral body and the articular facets. The results indicate that australopiths are outside the modern humans' range of variation.

The reviewer makes a good point here and we have adjusted the results and discussion accordingly. Specifically, we state that our third hypothesis (about middle lumbar vertebra shape) is not fully supported due to both the costal process morphology and vertebral body shape.

Lines 637-642: All this information should be in a table. It is difficult to compare and follow all the information you show here.

We have created two new tables, which contain the extant comparative data (Table 2) and the fossil data (Table 3).

Line 645: Regarding the column with the values of gorillas and chimpanzees, clarify what Table are you referring to (Excel Table with the raw data for Figure 6 I guess).

We have modified the way we describe the combined wedging angle data.

Line 655: Thanks for providing all this information. This is just my point of view, and I will leave it in the hands of the AE, but I think a simple non-parametric analysis (e.g. Mann-Whitney u test) comparing these traits between extinct and extant species would have been very useful to assess specific significant differences (or similarities) between MH2 lumbar vertebrae and those of other australopiths, Neanderthals, modern humans, and great apes. The results could have (or not) demonstrate in specific traits (e.g. vertebral body) the similarities between modern humans and MH2 you propose as demonstrated by other methods (and I have my doubts after your results).

I understand why the reviewer would request such analyses, but they would be extraordinarily numerous – each of the 31 measurements would need to be compared in pairwise group comparisons (Mann-Whitney U test is a two sample test to my knowledge; Kruskall-Wallis would be the appropriate non-parametric test for multiple groups, but even still, 31 test would need to be run to include all measurements) – and more significantly, they would either need to be corrected for body mass (i.e., using estimated body mass or a geometric mean of some measurements, both of which are somewhat problematic) or would be largely arbitrary comparisons since of course MH2 and other female Australopithecus are smaller than gorillas, humans, and even chimpanzees in most measurements. Multivariate analyses that adjust data for size (i.e., Procrustes analysis in 3D GM, which we employ in our paper) are one way of circumventing the problematic nature of numerous univariate comparisons among groups characterized by size differences.

Line 856: Describe the views as in the other A, B, and C figures. Also, provide the number of the landmarks, if not all because of the lack of space, at least most of them.

We are not sure how the reviewer wants the figure caption reorganized, but think the description of the views is accurate. We also think the reviewer is asking for us to label the 48 landmarks (or at least most of them) in each of the five views (so adding upwards of 240 numbers). We tried but it becomes very full and we think distracting and impractical, so we have not added the landmark numbers. We think that interested readers will be able to match the landmark descriptions provided in Suppl Note 2 with the landmarks shown in what is now Figure 4. As with the choice to show wireframes rather than warped 3D models, we think this is a matter of preference. Thank you for the suggestion though.

Line 859: These analyses are not explained in the Methods section. Neither the obtained results. Include or remove them.

It was in fact referenced in both the Methods (penultimate paragraph) and in the Discussion (p. 10):

In the main text, we wrote, “We plotted standardized shape scores derived from a multivariate regression of shape on centroid size against centroid size to visualize shape changes (Drake and Klingenberg, 2008) (Supplementary Figure 4).” We have modified this sentence, which now says, “We plotted standardized shape scores derived from a multivariate regression of shape on centroid size against centroid size to visualize shape changes(24) using the RegScore method implemented in the ‘plotAllometry’ function in the ‘geomorph’ package (Supplementary Figure 4).”

This is simply one of a few ways to visualize shape allometries presented in the geomorph package.

Here is selected text from the geomorph pdf file:

“…describing a linear model (with procD.lm) that has an explicit definition of how shape allometries vary by group can be more informative. The following are the three most general models:

simple allometry: shape ~ size

common allometry, different means: shape ~ size + groups

unique allometries: shape ~ size * groups

[…] Either PredLine or RegScore can help elucidate divergence in allometry vectors among groups.”

Our analysis uses the “unique allometries” model formula (middle lumbar shape ~ centroid size * genus). The inclusion of the “interaction term” in the model formula above (* genus) enables us to evaluate size effects within each genus. In a simpler univariate context, including the interaction term specifies that we would estimate separate slopes and separate intercepts for each genus. The “common allometry, different means” model design would estimate a single slope (i.e., a “common allometry”) with different intercepts.

In total, the purpose and key takeaway of this analysis (Figure 7—figure supplement 1) is that the difference between U.W. 88-233 and the modern human sample cannot be explained by the smaller size of U.W. 88-233. We include this analysis to be as thorough as possible in the evaluation of morphometric affinities.

Line 860: “between U.W. 88-233 and extant and fossil middle lumbar vertebrae” Here only some of the extant species included in the sample are analyzed. Why? Specify which species you included.

We included these specific comparisons of the new Au. sediba specimen (U.W. 88-233) to Homo sapiens and Pan troglodytes for two reasons. First, the extant taxon to which Au. sediba is most closely related is H. sapiens, and obviously they are both bipeds, so that is a natural comparison, followed by Pan troglodytes. We could include P. paniscus as well, but our P. troglodytes sample size is larger, which is more ideal. We could pool P. paniscus and P. troglodytes, but that may falsely inflate the variance within Pan since the two groups differ slightly. Second, there is a practical issue of conducting pairwise comparisons of Procrustes distances across many groups.

Line 863: Could you please explain what is this within (Homo, Pan) (mean Procrustes distance?), or better said, the purpose of comparing that mean? Also, in this Figure 3 (B), why there is not lateral view as in Figure 3 (C)?

Supplementary Figure 3A shows the Procrustes distances between U.W. 88-233 and Sts 14, Shanidar 3, all modern humans sampled, and all chimpanzees sampled. It shows that U.W. 88-233 is most similar to Sts 14 in shape.

Supplementary Figure 3C shows pairwise comparisons of Procrustes distances for middle lumbar shape within our human and chimpanzee samples, and between our human and chimpanzee samples. The ‘within’ comparisons show the shape variation observed within humans and chimpanzees. The ‘between’ comparisons show the shape differences observed between our human and chimpanzee samples. This analysis shows that U.W. 88-233 has small shape differences from Sts 14 that are typically observed within humans or chimpanzees (i.e., they are not very different). In contrast, this analysis shows that U.W. 88-233 is much more distinct from Shanidar 3, with a magnitude of shape difference similar to that observed between humans and chimpanzees (i.e., they are very different).

This analysis provides a more in-depth comparison of the morphometric affinities of U.W. 88-233 that is a supplement to the main 3D GM analyses presented in the main text using PCA. We did not include a lateral view in Supplementary Figure 3B because the differences observed here were not very dramatic. In other words, we included a lateral view in 3D because, for example, the shape and orientation of the spinous and superior and inferior processes and vertebral body differ considerably between U.W. 88-233 and the average chimpanzee in lateral view (which comes as no surprise since one is a biped and the other is not).

Line 868: Here it would be interesting to comment that both australopiths plot within the chimpanzees' range of variation, and the Neandertal within (or in the limit) of modern humans.

The important thing to take away from Supplementary Figure 3 is that these are comparisons of shape differences represented by Procrustes distances. They are not comparisons of shape itself, which is only depicted in the 3D GM analysis in the main text. So, the line “UW 88-233-Sts14” in 3C is the Procrustes distance observed between U.W. 88-233 and Sts 14 (somewhere > 0.1), which falls within the ranges observed within humans and chimpanzees. The line “U.W. 88-233-Shanidar 3” in 3C is the Procrustes distance observed between U.W. 88-233 and Shanidar 3, which falls within the range of the Procrustes distances observed between humans and chimpanzees in our sample (i.e., the Au. sediba vertebra is as different from the Neandertal vertebra as is the typical human and chimpanzee; they are very different).

Reviewer #2 (Recommendations for the authors):Please always use the correct anatomical terms according to the current version of the Terminologia anatomica. The "lumbar transverse process" is an erroneous, antiquated and obsolete term that needs to be replaced by "costal process" throughout the paper. See also Strzelec, B., Chmielewski, P.P., Gworys, B., 2017. The Terminologia Anatomica matters: examples from didactic, scientific, and clinical practice. Folia Morphologica 76, 340-347.

We have read Strzelec et al. and consulted Terminologia Anatomica and understand the reviewer’s point here. Perhaps erroneously or inappropriately, we have published previously using “lumbar transverse process,” as have most researchers in biological anthropology and paleoanthropology. White et al. (2012) and Aiello and Dean (1990) similarly use “transverse process” in reference to this structure. However, we have now changed all cases to “costal process.” Due to the usage of transverse process in our field, we use “transverse” in parentheses in the first uses of costal process in our abstract and in the main text of the manuscript.

Likewise, the term "spinal canal" designates the canal that is formed by the vertebral foramina of several subsequent vertebrae for the spinal cord, but in the individual vertebra it would be termed "vertebral foramen".

We have changed “spinal canal” to “vertebral foramen” throughout.

A more stylistic issue is the use of the colloquial term "australopith". This word represents a sloppy mutilation of "pithekos", the Greek word for "ape". The syllable "pith" in australopith is nonsensical. Some people say they prefer this slang because they claim that the "australopithecine" would imply monophyly of the genera Australopithecus and Paranthropus. This is, however, not correct. Australopithecines is not only the English term for the former subfamily "Australopithecinae", but also for the subtribe "Australopithecina" of modern systematics. Therefore, I strongly urge the authors to replace "australopiths" with "australopithecines".

We would like to avoid a debate about colloquial terms in taxonomy, so we have replaced “australopith” with phrases like “members of the genus Australopithecus” and “early hominins included in this study.”

The authors compare the morphology of the newly described, complete third lumbar vertebra U.W. 88-233 of A. sediba to the "middle lumbar vertebrae" of modern humans, chimpanzees and gorillas. It is for me, however, unclear, what they exactly mean with "middle lumbar vertebra" because australopithecines and modern humans possess on average 5 lumbar vertebrae and chimpanzees and gorillas generally have (3-) 4. Could the authors therefore shortly discuss the issue of homology and how the outcome would be affected if U.W. 88-233 and the human L3 would be compared to L2 vs. L3 in the great apes.

The reviewer is correct that great apes with four lumbar vertebrae do not have a “middle” lumbar vertebra like those with three (L2) or humans with five lumbar vertebrae (L3). We chose to use the second lumbar vertebra to represent a hypothetical middle lumbar vertebra because it is “closer” to a human middle lumbar vertebra (L3) in that it is the penultimate lumbar vertebra. Additionally, for all great apes, L2 is used (vs. L2 in some and L3 in other individuals).

L213 "Humans and great apes separate along PC1, which is largely explained by vertebral body height": isn't it rather vertebral wedging?

The reviewer is correct that it is not just uniform height but also the added effect of wedging, so we have added wedging to the text.

L214 "U.W.88-233 and Sts 14 fall intermediately between modern humans and great apes along PC1": This should be changed to say that this applies to all australopithecines.

We have added “like other early hominins included in this study” to clarify this point.

L237 "a ventral curvature of the lumbar spine": a lordotic curve cannot be described as a ventral curvature-it is a ventrally convex curvature.

We have added “convex” here and elsewhere to make this correction. Thanks.

L241 "sum L2-L5 wedging" is awkward. Consider something like "total L2-L5 wedging angle".

We have changed this to “combined L2-5 wedging” and “combined wedging” throughout.

L248 "see Figure 6 caption": Unfortunately, I don't see the data for chimpanzees in in Figure 6., and also the caption to Figure 6 does not provide more relevant information. On the other hand, I don't think it is a good option to use figure captions to present additional information that is otherwise not contained within the manuscript.

Leaving chimpanzees out of the caption was an oversight – thank you for catching it. Given this reviewer’s requests and those of the other reviewer, we have converted these statistics to table form. Table 2 now shows all of the summary statistics so that the reader can appreciate the high variation in wedging angles within groups (human males and females and chimpanzees). Regarding Figure 6 itself, we only include chimpanzees in the combined wedging angle column. There are two reasons for this: (1) the figure shows L2-L5, whereas the elements represented by chimpanzees are necessarily L1-L4 (they do not have L5, and we excluded chimpanzees with just three lumbar vertebrae); and (2) if we include chimpanzee 95% confidence intervals and/or other elements (full range of variation for extant taxa), the figure becomes very busy and not easily readable. We prefer it this way and make it very clear that what are presented in the figure are confidence intervals, not the full range of variation. Additionally, Table 3 (formerly the figure caption) includes the standard deviation and range of the data – for both humans and chimpanzees at individual and combined levels – and our Source Data files contain all of the wedging angle data for individual specimens, so the reader can examine these.

L249 "Patterns of change across lumbar levels demonstrate that MH2's vertebrae transition from ventral (kyphotic) wedging at the L2 (most similar to male modern humans) and L3 (most similar to female modern humans) levels to dorsal (lordotic) wedging at L4. At the L4 level MH2 is most similar to female modern humans and female…": In my opinion, inferences for a greater similarity of the vertebral wedging patterns of fossil hominins to a specific modern humans sex is overinterpreting the data. Thus, the considerable variability of these wedging patterns within modern humans needs to be taken into account. In fact, the data presented in Figure 6 suggest that both males and females transition from ventral to dorsal wedging between L3 and L4. This also relates to the quite misleading use of the 95% confidence intervals of the means in Figure 6 rather than the 95% confidence intervals of the sample data (see my comment to Figure 6).

The reviewer’s point is well taken. In fact, males and females are not significantly different at the L3-5 levels, which can be appreciated by the overlap of 95% confidence intervals of the mean. We have left the 95% CIs so readers can appreciate this, but we have also added in 2 standard deviations of the mean. At L2 and in combined wedging, human males and females are significantly different, apparent from non-overlapping 95% confidence intervals. We strongly prefer to show 95% CIs of the mean along with 2 standard deviations of the mean for that reason. We also report the standard deviation and range of all the data in Table 2 so that readers understand that the data are characterized by a high degree of variation. NOTE: we caught a mistake in the original figure and corrected it in the revision. Although our data in Source Data were correct, we used incorrect data for the combined wedging values for Neandertals. Although their positions do not change much, they are different now. We regret the oversight and wanted to bring it to your attention. It was in revisiting this figure that we noticed the mistake, so thank you.

L270 Maybe the authors can briefly discuss the functional significance of the pyramidal configuration for lumbar lordosis and cite the corresponding literature. It would also be good to discuss Oreopithecus in this context, for which a similar pyramidal configuration has been reported (Köhler, M., Moyà-Solà, S., 1997. Ape-like or hominid-like – the positional behavior of Oreopithecus bambolii reconsidered. Proceedings of the National Academy of Sciences of the United States of America 94, 11747-11750.)

We have added this reference along with Russo and Shapiro’s (2013) refutation of it.

L288 "ample surface area": isn't the length of the lever arm of the costal processes more relevant than the relatively moderate increase in surface area (if at all) compared to that of modern humans? And why do australopithecines need more powerful trunk musculature than modern humans? I also don't understand, why a cranial orientation of the costal processes should increase the "moment arms and torque generation capabilities of psoas major and quadratus lumborum". Isn't the lever arm only related to its length perpendicular to the force vector? I therefore think that the cranial orientation of the costal process must have another explanation.

The question of why A. sediba would “need” more powerful trunk musculature than modern humans is an interesting one, but the biomechanical effect of elongated and differently oriented costal processes in A. sediba seems clear. The overall morphology of the A. sediba costal processes is consistent with increased moment arms for both psoas major and quadratus lumborum; this includes their length and more cranial and ventral orientations. It’s not the cranial orientation per se that creates a longer moment arm, but in our view, this trait is probably not morphologically independent of other costal process traits. Furthermore, we don’t consider this interpretation to be a complete explanation for the expression of this trait, and there could be additional, non-mutually exclusive explanations. We have provided a new supplementary figure (Figure 7—figure supplement 2) that depicts hypothetical muscle force vectors and moment arms. We state in the main text that more work needs to be done in this area.

L290 There is no "middle lumbar fascia", but the anterior and middle layers of the thoracolumbar fascia insert on the costal processes. On the other hand, the m. obliquus externus abdominis has generally no contact to the thoracolumbar fascia in modern humans as far as I know.

We have made this correction. Thank you.

L295 Please rephrase. Muscles cannot "support" the pelvis. Support means "bear all or part of the weight of something", but as muscles cannot counteract compressive forces they cannot bear weight. Moreover, the support of a structure must be below the structure itself.

We have rephrased this part of the sentence.

L299 Please also see Tardieu et al. (2017. How the pelvis and vertebral column became a functional unit in human evolution during the transition from occasional to permanent bipedalism? Anatomical Record 300, 912-931) who show that the pelvic incidence of alternative pelvic reconstructions of MH2 falls well within the range of modern humans.

We have incorporated this reference into our discussion and regret missing it originally.

L303 The analysis of La Chapelle-aux-Saints demonstrated that Neanderthals possessed a well-developed lordosis similar to modern humans, see Haeusler et al. (2019. Morphology, pathology and the vertebral posture of the La Chapelle-aux-Saints Neandertal. Proceedings of the National Academy of Sciences of the United States of America 116, 4923-4927). Moreover, the reported low pelvic incidence of SH1 is probably misleading because it is due to a lumbosacral transitional anomaly, see Haeusler, M., 2019. Spinal pathologies in fossil hominins, in: Been et al.. (Eds.), Spinal Evolution: morphology, function, and pathology of the spine in hominoid evolution. Springer, Cham, pp. 213-245.

We do include a “but see” and cite Haeusler et al. (2019), and we are sympathetic to this perspective; however, it is currently not the consensus view.

L308 Please see my other comments. I don't think it is possible to differentiate the sex based on the wedging values.

Two sets of co-authors on this manuscript have published manuscripts showing significant differences between human sexes in lumbar wedging (Ostrofsky and Churchill, 2015; García-Martínez et al., 2020). We also demonstrate significant differences here, at least at the L2 level and combined L2-L5 levels. Another subset of authors, including the first author, has recently completed a study on lumbar wedging and inferior articular facet angles and finds strong evidence for sex differences. Therefore, we acknowledge that vertebral wedging, in particular, are characterized by high variation within sex, but this variation does not swamp the differences between sexes, which are frequently significant.

L309 This is not true. Schiess et al. (2014. Revisiting scoliosis in the KNM-WT 15000 Homo erectus skeleton. Journal of Human Evolution 67, 48-59.) demonstrated that KNM-WT 15000 (Homo erectus) possesses an even slightly stronger dorsally wedged L5 vertebra than MH2. Nevertheless, it was still within the 95% range of variation of modern humans (see their Table 4 and Figure 5D).

Solved by adding “adult”.

L337 Please mention also that its presence has been claimed for Oreopithecus (see above).

We now discuss Oreopithecus in this area.

L354 „high-quality" seems to miss "scans" or something similar. It would be useful if the authors could indicate where they come from. At least the scans of Shanidar3 that are distributed by the Smithsonian can nowadays hardly be called "high quality". Please also note that the Shanidar vertebrae are extensively reconstructed.

Address from R1. High-quality casts from E. Trinkaus.

L357 I'm not aware that any of the fossils used in the present study are curated at the NHM London. Please check.

Correct, thanks. Likewise for Musée de l’Homme. Both removed.

L365 I wasn't aware that also modern human skeletons are curated at the Musée Royale de l'Afrique Centrale. Please check.

Right again. Removed. These were errors and we appreciate the reviewer bringing them to our attention.

L368 Please note that this is a basic trigonometry approach that has been used by DiGiovanni et al., and I therefore recommend to say this rather than citing DiGiovanni et al. There is also no fancy "wedging angle equation" necessary, but the simple use of the tangent. On the other hand, this equation is not provided in Table 1 as the text suggests, so it might be good to rephrase this sentence.

Understood, and we have reworded this part while retaining the citation. The “equation” was included in Supplementary Note 1 (now the Appendix) as Linear and Angular Measurements #7.

L372 Why this? What is needed here is the 95% range of variation or more precisely, the 3rd to 97th inter-percentile range.

As stated in more detail below, we now show 2 standard deviations of the mean, which encapsulates 95% of the data by definition. We do not show these in the combined column because they are very large and would require expanding the size of the y-axis significantly, but we do make clear that (1) what are shown are 95% confidence intervals of the mean and (2) we provide the standard deviation and range for human males and females and for chimpanzees in Table 3. In addition, the data for each individual are provided in the Source Data file.

Figure 6 Please show the 95% confidence intervals of the sample data, not the 95% confidence intervals of the means for modern humans males and females. This misleading and does not acknowledge the considerable range variation that is typical for these wedging data (see e.g., Figure 5D in Schiess et al. 2014).

As stated previously, we have added 2 standard deviations of the mean to each sex at each vertebral level (L2-L5). We did not include the 95% confidence intervals of the means to be misleading, but rather to make the figure more readable. Previously, we had included the full range of variation (as boxplots essentially), but the figure looked very crowded. We think we have found a way to present 95% of the data and still keep it readable. We do think it is interesting that two female Australopithecus fall within the 95% CIs of the female human mean, whereas one male Australopithecus falls within that of the male human mean. However, we realize that larger samples are required to say anything definitive about sexual dimorphism in fossil hominin lumbar wedging.

L637-642 Please consider to report these values in a table rather than in the figure caption.

We now include the extant data in Table 2 and the fossil data in Table 3.

Figure 7 Please use the correct scientific abbreviations! On the other hand I don't think it is still fine to use H. neanderthalensis for the Neanderthals since genetic data clearly demonstrate interbreeding with modern humans.

We have corrected the abbreviations and refer to “Neandertals” and “Modern humans” rather than H. neanderthalensis and H. sapiens, although we do retain the latter in the main text to refer to modern humans only.

[Editors' note: further revisions were suggested prior to acceptance, as described below.]

Reviewer #1 (Recommendations for the authors):

I am satisfied that the authors have addressed most of my concerns, especially those regarding the interpretation of their results. I am also glad about the inclusion of the hypotheses, which I think help to better understand and follow the purpose of this work. The authors have explained in greater detail some methodological aspects that needed some clarification. All in this, the discussion is much more solid and coherent with the results than the previous version. In general, the authors have done a great good job. As I assessed in my first revision, these fossils are a great contribution to paleoanthropology, especially to the study of the evolution of the vertebral column in hominins. Thus, I recommend the publication of this manuscript after correcting a few details.

First, I have some doubts about one aspect of the rebuttal document:

The only point I think was not clarified in my previous revision referred to Supplementary Figure 3 (from the first version). I wrote: "Line 859: These analyses are not explained in the Methods section. Neither the obtained results. Include or remove them.".

The authors have clarified that: "It was in fact referenced in both the Methods (penultimate paragraph) and in the Discussion (p. 10):. In the main text, we wrote, "We plotted standardized shape scores derived from a multivariate regression of shape on centroid size against centroid size to visualize shape changes (Drake and Klingenberg, 2008) (Supplementary Figure 4)."

But this refers to Supplementary figure 4 (Line 868), and not to Supplementary figure 3, which corresponds with Line 859. I appreciate they clarified this part, but the analyses and results from this Supplementary Figure 3 are still not explained in the manuscript. This figure reads "Procrustes distances and mean differences…" but neither a reference to Procrustes distances nor to mean differences appear in the entire manuscript apart from this footnote. In the rebuttal to my concern about Line 863, which also refers to this figure, they explain in detail what this figure means, and I appreciate it, but this should also be in the manuscript.

We apologize for addressing the wrong issue in our last revision. We fully understand what the reviewer is asking for and have added a paragraph to the Results section explaining what is now Figure 7—figure supplement 1. Thank you for taking the time to bring this issue to our attention again.

Reviewer #2 (Recommendations for the authors):

The revised manuscript has improved in many aspects. Particularly, it is now more than a simple exploratory study, having a greater focus on hypothesis testing. However, the wrong use of statistics in the analysis and hypothesis testing of the wedging angles still represents a major issue that needs to be addressed.

Thus, the first hypothesis (H1a) of the current study is that there is no difference between the wedging angles of MH2 and modern humans, and another hypothesis, which I call H1b, is that they are distinct from extant great apes. To test hypothesis H1a, the authors compare the wedging angles of the MH2 lumbar vertebrae with the 95% confidence intervals of the mean female and the mean male modern human wedging angles. Generally, the 95% confidence intervals about the means are useful if the purpose is to compare two samples and to explore whether their means are different. However, the distribution of the wedging angles and thus their mean values are unknown for A. sediba (or any other fossil hominin species). Only those of a single A. sediba individual, MH2, are known, and a comparison of the means of A. sediba with those of modern humans is therefore not possible. We can only compare the MH2 specimen with the modern human sample by hypothesizing that there is no difference between A. sediba and H. sapiens for this trait (=H1a). Under this assumption, the data point for A.sediba would therefore fall with a 95% probability within a certain range. This is represented by the 95% confidence interval of the sample (also known as the 95% prediction interval). Thus, the 95% prediction interval represents the range of values that likely contains the value of a new observation given the distribution of the comparative sample. This 95% prediction interval can be approximated by 2 standard deviations (more precisely, it would be 1.96×standard deviations), and the authors now also show this range in their Figure 5, but unfortunately they don't use this interval further and don't discuss it within the text.

In fact, Figure 5 shows that the wedging angles of all lumbar vertebrae of MH2 fall within the 95% prediction intervals of both modern human males and females. The same is true for all other analysed fossil hominins, except for Shanidar 3 and Kebara 2, whose wedging angles of L2 fall only within the male range of the current sample. Because we don't know the 95% confidence intervals about the means of the A. sediba wedging angles (or those of A. africanus, etc.), it is irrelevant whether MH2 (or Sts 14 or StW 431) lies closer to the female or the male means of modern humans for some vertebrae, as they are only some individuals. The corresponding sections in the text (L316-319 and L350-366) should therefore be rephrased accordingly. Likewise, the right side of Figure 5 needs to be adapted to show the 95% prediction intervals rather the 95% confidence intervals of the means.

Hypothesis H1b (that the wedging angles of MH2 are distinct from extant great apes) is only marginally addressed as far as I can see. Thus, wedging angles are only reported in Table 2 for chimpanzees (and thus only for one of three great ape genera). Nevertheless, it seems that the wedging angles of vertebrae L2-L4 of MH2 are well within the 95% prediction intervals for chimpanzees (as approximated by the means {plus minus} 2 SD). Does this therefore mean that lumbar lordosis of MH2 or other fossil hominins cannot statistically be differentiated from that of chimpanzees? Can the authors expand on this? It also would be helpful if the means and the 95% prediction intervals for chimpanzees (and if possible gorillas and orangutans) are included in figure 5 (or in an additional figure).

We have extensively revised this figure and removed the 95% CIs. To accommodate great apes and 95% PIs for all extant groups, we split Figure 5 into a main figure and two supplementary figures.

Regarding my suggestion to include KNM-WT 15000 into the study, I agree with the authors that this is not so easy for the 3D GM analyses due to its subadult age. However, I still maintain that the addition of KNM-WT 15000 would be fundamental to the interpretation of the wedging angles as it shows that the strong lordotic wedging of L5 is not exceptional in MH2 and Kebara 2 (see Schiess et al. 2014). The subadult age of KNM-WT 15000 explains of course the missing vertebral ring apophyses, but this does not affect the wedging angles of the vertebral bodies since the ring apophyses are flat.

We have added KNM-WT 15000 (the “Nariokotome Boy”) to the wedging angle figures. Please note that we have also corrected data points in the figures and in Table 3 that previously represented errors, the most major of which was our source data on combined Pan and Gorilla wedging values. We had previously inadvertently used only the last three lumbar vertebrae, whereas now we present – in the Figure 5 and its supplements and in Table 2 and its source data file – the combined value for all four lumbar vertebrae.

https://doi.org/10.7554/eLife.70447.sa2

Article and author information

Author details

  1. Scott A Williams

    1. Center for the Study of Human Origins, Department of Anthropology, New York University, New York, United States
    2. New York Consortium in Evolutionary Primatology, New York, United States
    3. Centre for the Exploration of the Deep Human Journey, University of the Witwatersrand, Johannesburg, South Africa
    4. Evolutionary Studies Institute, University of the Witwatersrand, Johannesburg, South Africa
    Contribution
    Conceptualization, Data curation, Formal analysis, Funding acquisition, Investigation, Methodology, Project administration, Visualization, Writing – original draft, Writing – review and editing
    For correspondence
    sawilliams@nyu.edu
    Competing interests
    No competing interests declared
    ORCID icon "This ORCID iD identifies the author of this article:" 0000-0001-7860-8962
  2. Thomas Cody Prang

    Department of Anthropology, Texas A&M University, College Station, United States
    Contribution
    Data curation, Formal analysis, Investigation, Methodology, Visualization, Writing – original draft, Writing – review and editing
    Competing interests
    No competing interests declared
    ORCID icon "This ORCID iD identifies the author of this article:" 0000-0003-3032-8309
  3. Marc R Meyer

    Department of Anthropology, Chaffey College, Rancho Cucamonga, United States
    Contribution
    Data curation, Formal analysis, Investigation, Methodology, Visualization, Writing – original draft, Writing – review and editing
    Competing interests
    No competing interests declared
    ORCID icon "This ORCID iD identifies the author of this article:" 0000-0002-3938-0173
  4. Thierra K Nalley

    Western University of Health Sciences, College of Osteopathic Medicine of the Pacific, Department of Medical Anatomical Sciences, Pomona, United States
    Contribution
    Data curation, Investigation, Methodology, Visualization, Writing – review and editing
    Competing interests
    No competing interests declared
    ORCID icon "This ORCID iD identifies the author of this article:" 0000-0002-4296-2940
  5. Renier Van Der Merwe

    Centre for the Exploration of the Deep Human Journey, University of the Witwatersrand, Johannesburg, South Africa
    Contribution
    Data curation, Writing – original draft, Writing – review and editing
    Competing interests
    No competing interests declared
  6. Christopher Yelverton

    1. Evolutionary Studies Institute, University of the Witwatersrand, Johannesburg, South Africa
    2. Department of Chiropractic, Faculty of Health Sciences, University of Johannesburg, Johannesburg, South Africa
    Contribution
    Data curation, Writing – review and editing
    Competing interests
    No competing interests declared
    ORCID icon "This ORCID iD identifies the author of this article:" 0000-0001-5108-3641
  7. Daniel García-Martínez

    1. Centre for the Exploration of the Deep Human Journey, University of the Witwatersrand, Johannesburg, South Africa
    2. Centro Nacional de Investigación sobre la Evolución Humana (CENIEH), Burgos, Spain
    3. Departamento de Biodiversidad, Ecología y Evolución, Universidad Complutense de Madrid (UCM), Madrid, Spain
    Contribution
    Data curation, Investigation, Methodology, Writing – review and editing
    Competing interests
    No competing interests declared
    ORCID icon "This ORCID iD identifies the author of this article:" 0000-0001-7518-3866
  8. Gabrielle A Russo

    Department of Anthropology, Stony Brook University, Stony Brook, United States
    Contribution
    Formal analysis, Methodology, Writing – original draft, Writing – review and editing
    Competing interests
    No competing interests declared
    ORCID icon "This ORCID iD identifies the author of this article:" 0000-0002-2203-1831
  9. Kelly R Ostrofsky

    Department of Anatomy, College of Osteopathic Medicine, New York Institute of Technology, Old Westbury, United States
    Contribution
    Data curation, Writing – review and editing
    Competing interests
    No competing interests declared
    ORCID icon "This ORCID iD identifies the author of this article:" 0000-0002-7158-546X
  10. Jeffrey Spear

    1. Center for the Study of Human Origins, Department of Anthropology, New York University, New York, United States
    2. New York Consortium in Evolutionary Primatology, New York, United States
    Contribution
    Investigation, Methodology, Writing – review and editing
    Competing interests
    No competing interests declared
    ORCID icon "This ORCID iD identifies the author of this article:" 0000-0002-0290-7090
  11. Jennifer Eyre

    1. Center for the Study of Human Origins, Department of Anthropology, New York University, New York, United States
    2. Department of Anthropology, Bryn Mawr College, Bryn Mawr, United States
    Contribution
    Data curation, Writing – review and editing
    Competing interests
    No competing interests declared
    ORCID icon "This ORCID iD identifies the author of this article:" 0000-0001-6418-6113
  12. Mark Grabowski

    Research Centre in Evolutionary Anthropology and Palaeoecology, Liverpool John Moores University, Liverpool, United Kingdom
    Contribution
    Data curation, Methodology, Writing – review and editing
    Competing interests
    No competing interests declared
    ORCID icon "This ORCID iD identifies the author of this article:" 0000-0001-7045-9472
  13. Shahed Nalla

    1. Centre for the Exploration of the Deep Human Journey, University of the Witwatersrand, Johannesburg, South Africa
    2. Department of Human Anatomy and Physiology, Faculty of Health Sciences, University of Johannesburg, Johannesburg, South Africa
    Contribution
    Data curation, Writing – review and editing
    Competing interests
    No competing interests declared
    ORCID icon "This ORCID iD identifies the author of this article:" 0000-0002-0957-1067
  14. Markus Bastir

    1. Centre for the Exploration of the Deep Human Journey, University of the Witwatersrand, Johannesburg, South Africa
    2. Departamento de Paleobiología, Museo Nacional de Ciencias Naturales (CSIC), Madrid, Spain
    Contribution
    Data curation, Methodology, Writing – review and editing
    Competing interests
    No competing interests declared
    ORCID icon "This ORCID iD identifies the author of this article:" 0000-0002-3141-3401
  15. Peter Schmid

    1. Centre for the Exploration of the Deep Human Journey, University of the Witwatersrand, Johannesburg, South Africa
    2. Anthropological Institute and Museum, University of Zurich, Zurich, Switzerland
    Contribution
    Project administration, Writing – review and editing
    Competing interests
    No competing interests declared
  16. Steven E Churchill

    1. Centre for the Exploration of the Deep Human Journey, University of the Witwatersrand, Johannesburg, South Africa
    2. Department of Evolutionary Anthropology, Duke University, Durham, United States
    Contribution
    Project administration, Writing – review and editing
    Competing interests
    No competing interests declared
  17. Lee R Berger

    Centre for the Exploration of the Deep Human Journey, University of the Witwatersrand, Johannesburg, South Africa
    Contribution
    Conceptualization, Data curation, Funding acquisition, Project administration, Visualization, Writing – review and editing
    Competing interests
    No competing interests declared
    ORCID icon "This ORCID iD identifies the author of this article:" 0000-0002-0367-7629

Funding

Leakey Foundation

  • Scott A Williams

Agencia Estatal de Investigación (Museo Nacional de Ciencias Naturales CSIC PID2020-115854GB-I00)

  • Markus Bastir

The funders had no role in study design, data collection and interpretation, or the decision to submit the work for publication.

Acknowledgements

We thank the University of the Witwatersrand and the Evolutionary Studies Institute, as well as the South African National Centre of Excellence in PalaeoSciences and Bernhard Zipfel and Sifelani Jirah for curating the A. sediba material and allowing us access to it and to fossil comparative material in the Phillip V Tobias Fossil Primate and Hominid Laboratory. We are grateful to Kudakwashe Jakata and Kristian Carlson for µCT scanning the A. sediba fossils, and Kristian, Morgan Hill, and Erik Mazelis for help processing the µCT scans. We thank the South African Heritage Resource agency for the permits to work at Malapa, and the Nash family for granting access to the site and continued support of research on their reserve, along with the South African Department of Science and Technology, the Gauteng Provincial Government, the Gauteng Department of Agriculture, Conservation and Environment and the Cradle of Humankind Management Authority, the South African National Research Foundation and the African Origins Platform, the National Geographic Society, the Palaeontological Scientific Trust (PAST), and the University of Witwatersrand’s Schools of Geosciences and Anatomical Sciences and the Bernard Price Institute for Paleontology for support and facilities, as well as our respective universities. We thank the following individuals for curating and providing access to comparative materials in their care: Mirriam Tawane, Stephany Potze, and Lazarus Kgasi (Ditsong National Museum of Natural History); Brendon Billings and Anja Meyer (Dart Collection, University of the Witwatersrand); Yonas Yilma, Tomas Getachew, Jared Assefa, and Getachew Senishaw (National Museum of Ethiopia and Authority for Research and Conservation of Cultural Heritage); Emma Mbua (National Museums of Kenya); Véronique Laborde, Liliana Huet, Dominique Grimaud-Hervé, and Martin Friess (Musée de l’Homme); Rachel Ives (the Natural History Museum, London); Wim Wendelen and Emmanuel Gilissen (Musée Royal de l’Afrique Centrale); Lyman Jellema and Yohannes Haile-Selassie (Cleveland Museum of Natural History); and Gisselle Garcia, Ashley Hammond, Eileen Westwig, Eleanor Hoeger, Aja Marcato, Brian O’Toole, Marisa Surovy, Sarah Ketelsen, and Neil Duncan (American Museum of Natural History). Bill Kimbel and Chris Stringer facilitated access to fossils, and Erik Trinkaus shared high-quality casts of Kebara 2 and Shanidar 3.

Senior Editor

  1. Detlef Weigel, Max Planck Institute for Developmental Biology, Germany

Reviewing Editor

  1. Min Zhu, Chinese Academy of Sciences, China

Reviewer

  1. Martin Hauesler

Version history

  1. Received: May 17, 2021
  2. Preprint posted: May 29, 2021 (view preprint)
  3. Accepted: October 19, 2021
  4. Version of Record published: November 23, 2021 (version 1)

Copyright

© 2021, Williams et al.

This article is distributed under the terms of the Creative Commons Attribution License, which permits unrestricted use and redistribution provided that the original author and source are credited.

Metrics

  • 7,132
    Page views
  • 544
    Downloads
  • 9
    Citations

Article citation count generated by polling the highest count across the following sources: Crossref, PubMed Central, Scopus.

Download links

A two-part list of links to download the article, or parts of the article, in various formats.

Downloads (link to download the article as PDF)

Open citations (links to open the citations from this article in various online reference manager services)

Cite this article (links to download the citations from this article in formats compatible with various reference manager tools)

  1. Scott A Williams
  2. Thomas Cody Prang
  3. Marc R Meyer
  4. Thierra K Nalley
  5. Renier Van Der Merwe
  6. Christopher Yelverton
  7. Daniel García-Martínez
  8. Gabrielle A Russo
  9. Kelly R Ostrofsky
  10. Jeffrey Spear
  11. Jennifer Eyre
  12. Mark Grabowski
  13. Shahed Nalla
  14. Markus Bastir
  15. Peter Schmid
  16. Steven E Churchill
  17. Lee R Berger
(2021)
New fossils of Australopithecus sediba reveal a nearly complete lower back
eLife 10:e70447.
https://doi.org/10.7554/eLife.70447

Further reading

    1. Evolutionary Biology
    2. Genetics and Genomics
    Alex Mas Sandoval, Sara Mathieson, Matteo Fumagalli
    Research Article

    Cultural and socioeconomic differences stratify human societies and shape their genetic structure beyond the sole effect of geography. Despite mating being limited by sociocultural stratification, most demographic models in population genetics often assume random mating. Taking advantage of the correlation between sociocultural stratification and the proportion of genetic ancestry in admixed populations, we sought to infer the former process in the Americas. To this aim, we define a mating model where the individual proportions of the genome inherited from Native American, European and sub-Saharan African ancestral populations constrain the mating probabilities through ancestry-related assortative mating and sex bias parameters. We simulate a wide range of admixture scenarios under this model. Then, we train a deep neural network and retrieve good performance in predicting mating parameters from genomic data. Our results show how population stratification shaped by socially constructed racial and gender hierarchies have constrained the admixture processes in the Americas since the European colonisation and the subsequent Atlantic slave trade.

    1. Ecology
    2. Evolutionary Biology
    Hannah J Williams, Vivek H Sridhar ... Amanda D Melin
    Review Article

    Groups of animals inhabit vastly different sensory worlds, or umwelten, which shape fundamental aspects of their behaviour. Yet the sensory ecology of species is rarely incorporated into the emerging field of collective behaviour, which studies the movements, population-level behaviours, and emergent properties of animal groups. Here, we review the contributions of sensory ecology and collective behaviour to understanding how animals move and interact within the context of their social and physical environments. Our goal is to advance and bridge these two areas of inquiry and highlight the potential for their creative integration. To achieve this goal, we organise our review around the following themes: (1) identifying the promise of integrating collective behaviour and sensory ecology; (2) defining and exploring the concept of a ‘sensory collective’; (3) considering the potential for sensory collectives to shape the evolution of sensory systems; (4) exploring examples from diverse taxa to illustrate neural circuits involved in sensing and collective behaviour; and (5) suggesting the need for creative conceptual and methodological advances to quantify ‘sensescapes’. In the final section, (6) applications to biological conservation, we argue that these topics are timely, given the ongoing anthropogenic changes to sensory stimuli (e.g. via light, sound, and chemical pollution) which are anticipated to impact animal collectives and group-level behaviour and, in turn, ecosystem composition and function. Our synthesis seeks to provide a forward-looking perspective on how sensory ecologists and collective behaviourists can both learn from and inspire one another to advance our understanding of animal behaviour, ecology, adaptation, and evolution.