Patched 1 reduces the accessibility of cholesterol in the outer leaflet of membranes
- Department of Biochemistry and Medicine, Stanford University School of Medicine, United States
- Department of Physiological Chemistry, Genentech, United States
- Division of Structural Biology, Wellcome Centre for Human Genetics, University of Oxford, United Kingdom
- Lee Kong Chian School of Medicine, Nanyang Technological University, Singapore
- Department of Molecular Genetics, University of Texas Southwestern Medical Center, United States
Figures
Figure 1 with 1 supplement

PTCH1 activity increases inner leaflet cholesterol.
(A) Total internal reflection fluorescence microscopy (TIRFM) was used to measure the recruitment of two different fluorescent cholesterol sensors (TdTomato-PFOD4H or GFP-GRAM1b) to the inner leaflet of the basal plasma membrane adjoining the coverslip. TIRFM only excites the sensor molecules (dark green) present in the ~100-nm-wide illumination zone, thus excluding fluorescence from the majority of sensor molecules present in the cytoplasm or bound to internal organelles (light green). (B, C) Steady-state TdTomato-PFOD4H (B) or GFP-GRAM1b (C) fluorescence at the inner leaflet of the plasma membrane in HEK293T cells with or without PTCH1 expression induced by the addition of Doxycycline (Dox). SHH (1 μM) was used to inactivate PTCH1 where indicated. Each circle represents the average intensity of fluorescence from a single cell membrane (n>65 cells), with the horizontal line representing the median and the vertical line denoting the interquartile range. Statistical significance was determined with a Mann-Whitney test. p-values in (B) are: −Dox vs. +Dox<0.0001, +Dox vs. +Dox + SHH<0.0001 and −Dox vs. +Dox + SHH=0.0127. p-values in (C) are: −Dox vs. +Dox<0.0001, +Dox vs. +Dox + SHH<0.0001 and −Dox vs. +Dox + SHH=0.0002. Experiments in (B) and (C) were repeated three independent times with similar results.
Figure 1—figure supplement 1
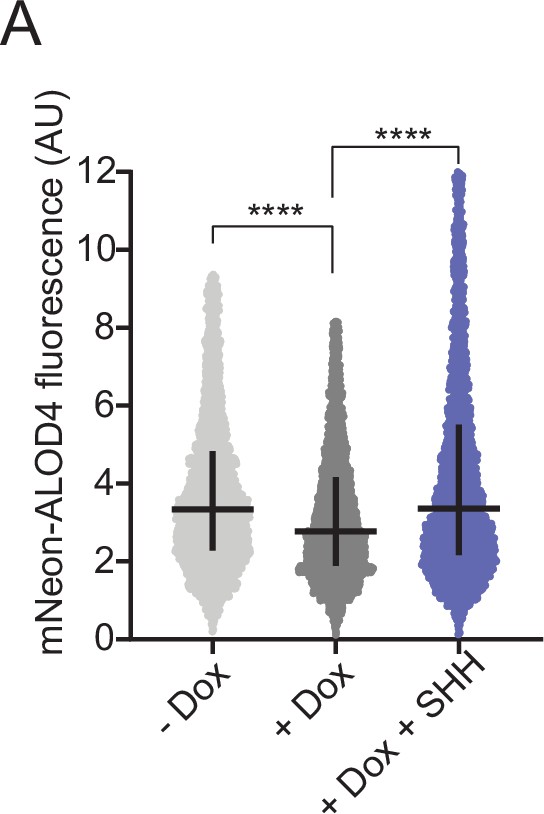
PTCH1 activity decreases outer leaflet cholesterol.
(A) Steady-state mNeon-ALOD4 binding to the outer leaflet of the plasma membrane of HEK293T cells expressing PTCH1 under the control of a Dox-inducible promoter. SHH (1 μM) was added to inactivate PTCH1. Each circle represents the fluorescence measured from a single cell using flow cytometry (n>3000 cells per condition). The horizontal line represents the median and the vertical line denotes the interquartile range. Statistical significance was determined with a Mann-Whitney test. p-values were<0.0001 for both comparisons shown.
Figure 2 with 1 supplement
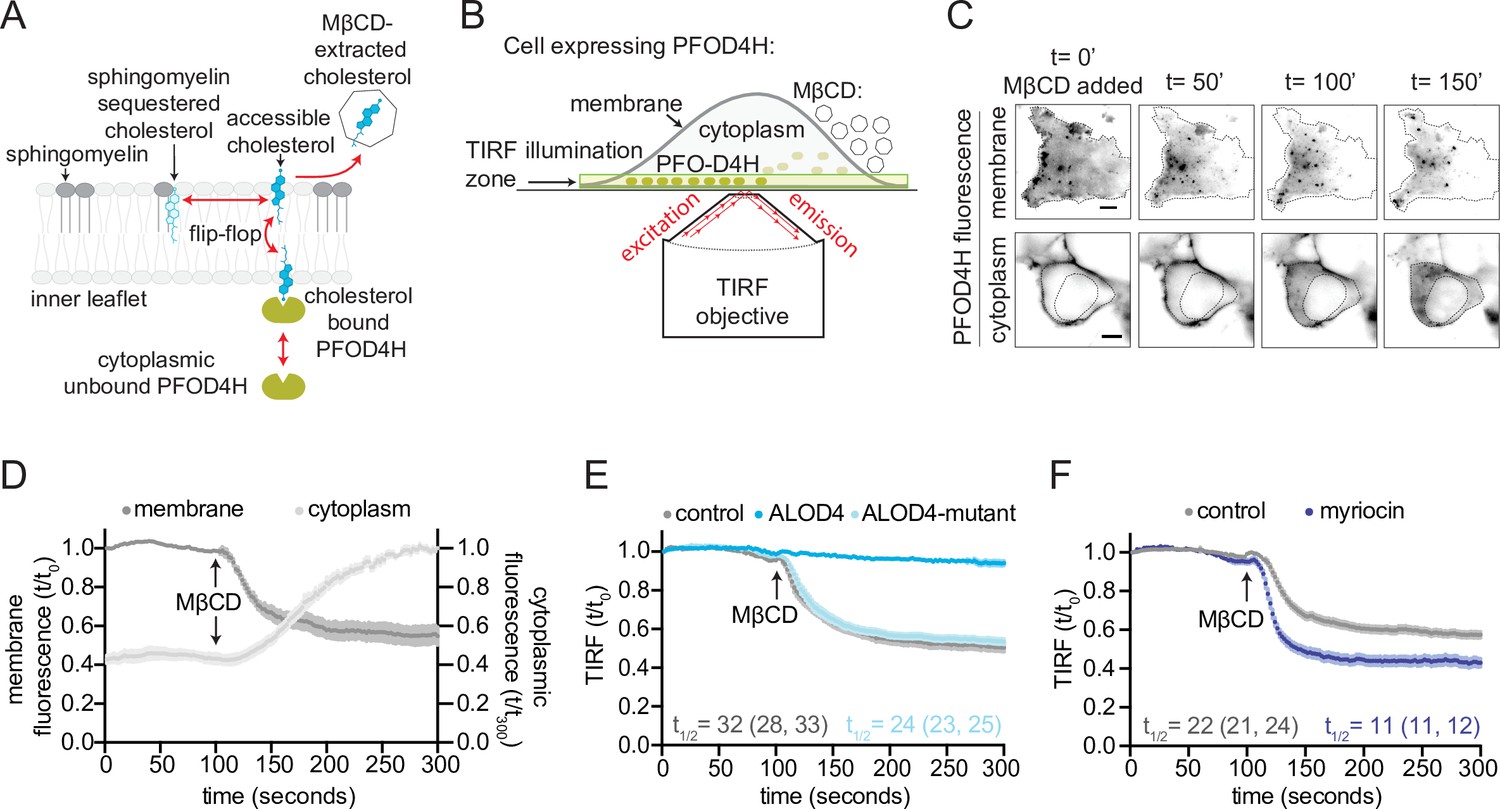
Measurement of outer leaflet accessible cholesterol in live cells with total internal reflection fluorescence microscopy (TIRFM).
(A) Extraction of outer leaflet accessible cholesterol by MβCD results in detachment of TdTomato-PFOD4H from the inner leaflet of the plasma membrane due to flip-flop of cholesterol between the two leaflets. Outer leaflet cholesterol can exchange between two pools: accessible cholesterol (dark blue) or sequestered cholesterol (light blue). Sphingomyelin (dark gray), present exclusively in the outer leaflet, plays a dominant role in sequestering cholesterol. Accessible cholesterol (drawn as projecting further out of the surface of the membrane into the aqueous boundary layer) has higher chemical activity and thus greater propensity to interact with proteins or to be transferred to a soluble acceptor like MβCD. (B) Schematic of the assay to detect outer leaflet accessible cholesterol using TIRFM. TdTomato-PFOD4H (green ovals) expressed intracellularly in HEK293T cells is recruited to the inner leaflet of the basal plasma membrane by binding to cholesterol (see (A)), bringing it into the TIRF illumination zone. MβCD added to the media (right) extracts outer leaflet accessible cholesterol, resulting in depletion of inner leaflet cholesterol and detachment of TdTomato-PFOD4H from the membrane. (C) Images of TdTomato-PFOD4H at the membrane (top panel, TIRFM) or in the cytoplasm (bottom panel, epifluorescence microscopy) of a single cell after MβCD addition (316 μM). Dotted lines mark the cell border (top row) or nuclear border (bottom row). Scale bar is 5 µm. (D) Time course of the change in TdTomato-PFOD4H membrane and cytoplasmic fluorescence (measured every 2 s by TIRFM or epifluorescence microscopy, respectively) after MβCD addition (316 μM) (quantified from images of the type shown in (C)). Black arrows mark the time point in the experiment when MβCD was added. Each curve represents the mean fluorescence from six or more cells, with standard error of the mean (SEM) shown in lighter shading around each curve. Fluorescence is depicted relative to the starting fluorescence (t/t0) for the TIRFM data (left y-axis) and relative to the ending fluorescence (t/t300) for the epifluorescence microscopy data (right y-axis). This experiment was repeated five independent times with similar results. (E, F) Time course of the change in TdTomato-PFOD4H membrane fluorescence measured by TIRFM after MβCD addition (316 μM, arrow) in control cells or in cells subjected to two treatments. In (E), cells were pre-incubated with ALOD4 or an ALOD4 mutant defective in cholesterol binding (added at 5 μM for 45 min prior to the assay). In (F), cells were treated with 80 μM myriocin for 3 days to deplete cellular SM. Each curve shows the mean fluorescence measured from >20 cells taken from at least three biological replicates, with SEM depicted in lighter shading around each curve. Fluorescence is depicted relative to the starting fluorescence (t/t0) for the TIRFM data. Curves showing data without normalization to baseline fluorescence values are provided in Figure 2—figure supplement 1C, D. In (E) and (F), curve fits (see Materials and methods) were used to determine the time required for TdTomato-PFOD4H fluorescence at the plasma membrane to drop by one-half of its starting value (t1/2), with the 95% confidence interval (CI) shown in parentheses. The experiment was repeated three independent times with similar results.
Figure 2—figure supplement 1

Characterization of a kinetic assay to measure outer leaflet accessible cholesterol.
(A) Steady-state TdTomato-PFOD4H fluorescence at the basal plasma membrane measured by TIRFM in cells incubated with or without ALOD4 (2 μM or 5 μM for 45 min prior to assay). Each circle represents the average intensity of fluorescence from a single cell membrane (n>70 cells), with the horizontal line representing the median and the vertical line denoting the interquartile range. Statistical significance was determined with a Mann-Whitney test, p-values are: control vs. 2 μM ALOD4=0.506 and control vs. 5 μM ALOD4=0.0023. (B) Steady-state TdTomato-PFOD4H fluorescence at the basal plasma membrane in cells pretreated with myriocin (80 μM) for 3 days to deplete SM. Each circle represents the average intensity of fluorescence from a single cell membrane (n>100 cells), with the horizontal line representing the median and the vertical line denoting the interquartile range. Statistical significance was determined with a Mann-Whitney test, p-value<0.0001. (C, D) Curves showing data without normalization to baseline fluorescence values corresponding to Figure 2E and F. TIRFM, total internal reflection fluorescence microscopy.
Figure 3 with 2 supplements

PTCH1 depletes outer leaflet accessible cholesterol.
(A) Cartoon representations of PTCH1 bound to SHH and PTCH1-ᐃL2. Deletion of the second extracellular loop (L2) in PTCH1-ᐃL2 abolishes both SHH binding and a putative tunnel through PTCH1 that has been proposed to form a conduit for cholesterol transport. (B) Immunoblot showing Doxycycline (Dox)-inducible expression of stably expressed PTCH1 and PTCH1-ᐃL2 in HEK293T cells. (C) Time course of the change in TdTomato-PFOD4H membrane fluorescence after MβCD addition (316 μM, arrow) in the presence (+Dox) or absence (−Dox) of PTCH1 expression. SHH is added (1 μM, red curve only) during imaging to inactivate PTCH1. (D, E) The experiment in (C) was performed at various concentrations of MβCD either without (D, −Dox) or with (E, +Dox) PTCH1 expression. (F) The maximum rate of change in TdTomato-PFOD4H membrane fluorescence (dF/dt) is depicted as a function of MβCD concentration. At each MβCD concentration, the max dF/dt was calculated from the curves shown in (D) and (E). (G) The maximum rate of cholesterol extraction (dF/dt) by MβCD (316 μM) was measured at increasing concentrations of SHH in cells expressing PTCH1. The individual curves used to measure the max dF/dt values are shown in Figure 3—figure supplement 1B. (H) Time course of the change in TdTomato-PFOD4H membrane fluorescence after MβCD addition (316 μM, arrow) in PTCH1-expressing cells (+Dox) with or without SHH addition (1 μM, red and pink curves only). Cells were treated with either ALOD4 or an ALOD4 mutant defective in cholesterol binding (added at 5 μM for 45 min prior to assay). (I) Time course of the change in TdTomato-PFOD4H membrane fluorescence after MβCD addition (316 μM, arrow) in the presence (+Dox) or absence (−Dox) of PTCH1-ᐃL2 expression. Red curve depicts the effect of SHH addition (1 μM, arrow) in PTCH1-ᐃL2 expressing cells. For (C–E), (H), and (I), each curve shows the mean fluorescence measured from >20 cells taken from at least three biological replicates, with SEM depicted in lighter shading around each curve. Fluorescence is depicted relative to the starting fluorescence (t/t0) for the TIRFM data. For (C) and (I), curves showing data without normalization to baseline fluorescence values are provided in Figure 3—figure supplement 2A B. The t1/2, along with the 95% CI, is shown for each curve. All experiments were repeated three independent times, with the exception of (D) and (E) which were performed two times. CI, confidence interval; SEM, standard error of the mean.
-
Figure 3—source data 1
Dotted lines mark the cropped region of the immunoblot that was used to generate panel Figure 3B.
As denoted on the left immunoblot PTCH1 (ptc) samples were run in duplicate.
- https://cdn.elifesciences.org/articles/70504/elife-70504-fig3-data1-v2.pdf
Figure 3—figure supplement 1

Effect of PTCH1-ᐃL2 on membrane cholesterol accessibility.
(A) Immunoblotting was used to measure the abundance of cytoplasmically expressed TdTomato-PFOD4H in HEK293T cells incubated in media without Dox or with Dox to induce PTCH1 expression. See Figure 3—figure supplement 1—source data 1. (B) Time course of the change in TdTomato-PFOD4H membrane fluorescence after MβCD addition (316 μM, arrow) in cells treated with various concentrations of SHH. PTCH1 was induced prior to the experiment by Dox treatment. These curves were used to calculate the max dF/dt values shown in Figure 3G. (C–D) Time course of the change in TdTomato-PFOD4H membrane fluorescence after the addition of various concentrations of MβCD in the absence (C), (−Dox) or presence (D), (+Dox) of PTCH1-ᐃL2 expression. Each curve shows the mean fluorescence measured from >20 cells taken from at least three biological replicates, with SEM depicted in lighter shading around each curve. Fluorescence is depicted relative to the starting fluorescence (t/t0) for the TIRFM data. The t1/2, along with the 95% CI, is shown for each curve. This experiment was repeated two independent times with similar results. (E) The maximum rate of change in TdTomato-PFOD4H membrane fluorescence (dF/dt) is depicted as a function of MβCD concentration. At each MβCD concentration, the max dF/dt was calculated from the curves shown in (C) and (D). (F) The maximum rate of change in TdTomato-PFOD4H membrane fluorescence (dF/dt) is depicted as a function of MβCD concentration. At each MβCD concentration, the max dF/dt was calculated from the curves shown in (D) and Figure 3. CI, confidence interval; SEM,standard error of the mean.
-
Figure 3—figure supplement 1—source data 1
Uncropped original scans of films used for immunoblots shown in Figure 3—figure supplement 1A.
Dotted lines mark the cropped region of the immunoblot that was used to generate panel Figure 3—figure supplement 1A.
- https://cdn.elifesciences.org/articles/70504/elife-70504-fig3-figsupp1-data1-v2.zip
Figure 3—figure supplement 2
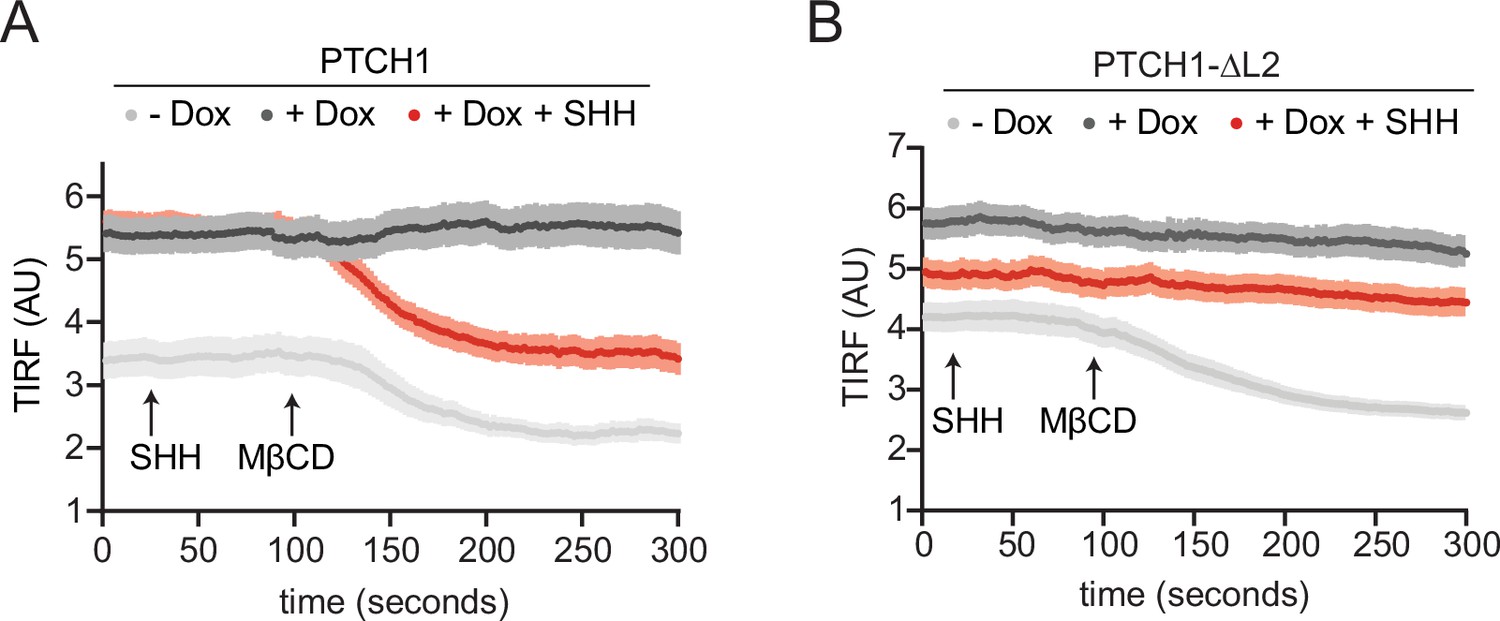
PTCH1 and PTCH1-ᐃL2 reduce outer leaflet cholesterol accessibility.
(A, B) Curves showing data without normalization to baseline fluorescence values corresponding to Figure 3C and I.
Figure 4
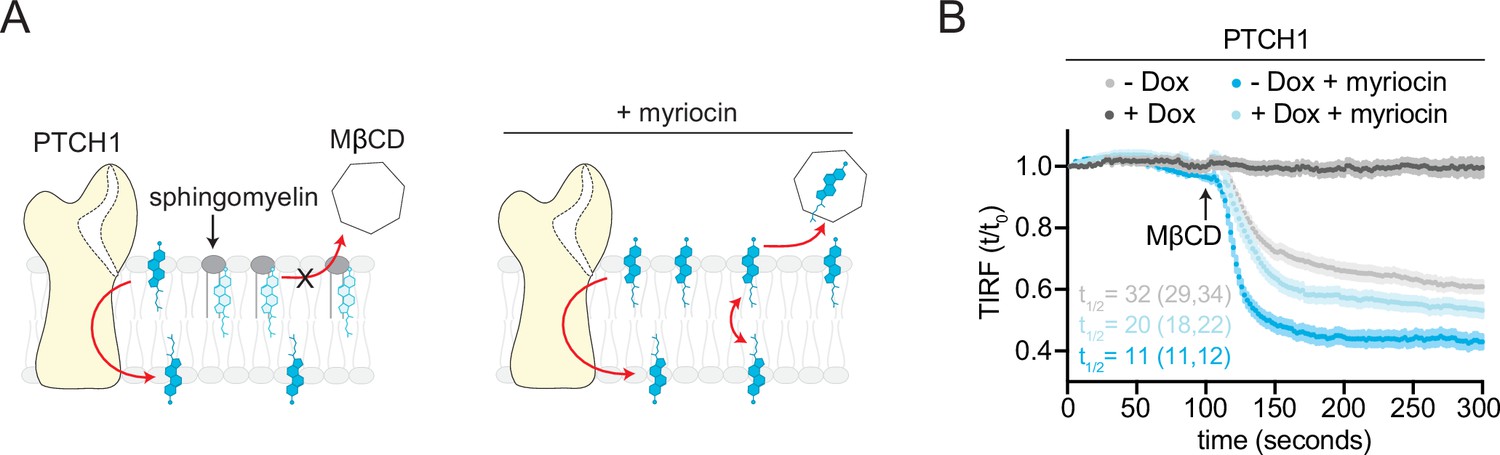
Opposing effects of PTCH1 and sphingomyelin (SM) depletion on outer leaflet accessible cholesterol.
(A) Cartoon showing that depletion of SM with myriocin increases accessible cholesterol in the membrane outer leaflet, increasing the transport load on PTCH1 and preventing it from depleting accessible cholesterol from the outer leaflet. (B) Time course of the change in TdTomato-PFOD4H membrane fluorescence after MβCD addition (316 μM, arrow) in the presence (+Dox) or absence (−Dox) of PTCH1 expression and with or without myriocin treatment (80 μM, 3 days) to deplete SM. Each curve shows the mean fluorescence measured from >15 cells taken from at least three biological replicates, with SEM depicted in lighter shading around each curve. Fluorescence is depicted relative to the starting fluorescence (t/t0) for the TIRFM data. The t1/2, along with the 95% CI, is shown for each curve. The experiment was repeated three independent times with similar results. CI, confidence interval; SEM, standard error of the mean.
Figure 5
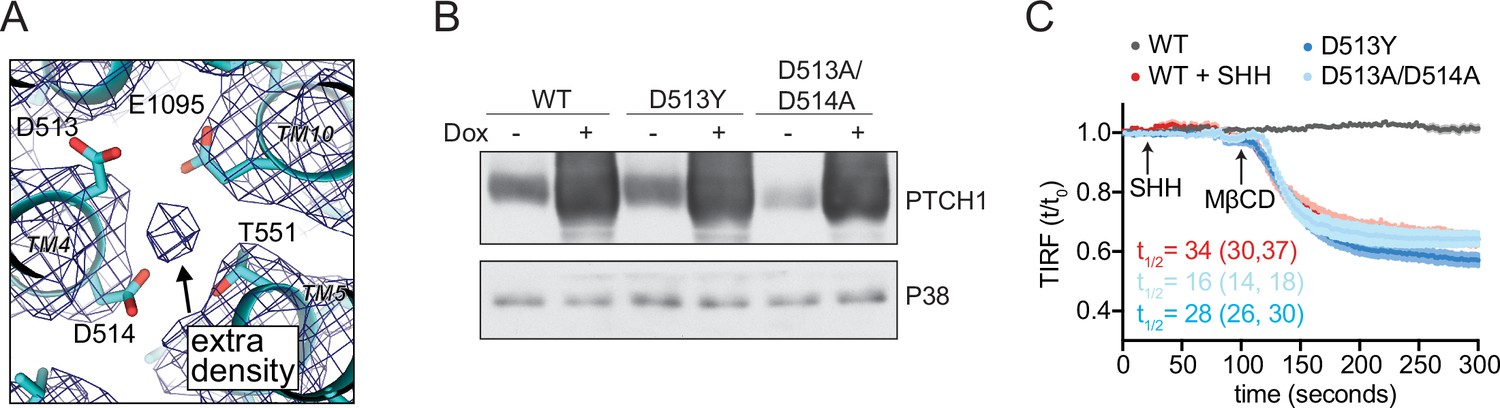
PTCH1 cation binding site mutants fail to reduce accessible cholesterol.
(A) A view of the potential ion binding site in the middle of the PTCH1 transmembrane (TM) domain observed in the human SHH-PTCH1 complex (PDB 6DMY4) (Gong et al., 2018). The blue mesh represents the 3.6 Å cryo-EM map (EMD-7968) and shows an extra density, consistent with a potential ion, within binding distance to a cluster of negatively charged residues (D513, D514, and E1095). Two acidic TM residues (present within a GxxxDD motif in TM4 and GxxxE motif in TM10) are conserved in RND family proteins (Petrov et al., 2020; Taipale et al., 2002; Zhang et al., 2018). (B) Western blot showing Doxycycline (Dox)-inducible expression of PTCH1 wild-type (WT) or the D513Y and D513A/D514A mutants. (C) Time course of the change in TdTomato-PFOD4H membrane fluorescence after MβCD addition (316 μM, arrow) in cells expressing the indicated PTCH1 variants (+Dox). The inactivating effect of SHH (1 μM) on WT PTCH1 (red curve) is shown as a control. Each curve shows the mean fluorescence measured from >20 cells taken from at least three biological replicates, with SEM depicted in lighter shading around each curve. Fluorescence is depicted relative to the starting fluorescence (t/t0) for the TIRFM data. The t1/2, along with the 95% CI, is shown for each curve. The experiment was repeated three independent times with similar results. CI, confidence interval; SEM, standard error of the mean.
-
Figure 5—source data 1
Uncropped original scans of films used for immunoblots shown in Figure 5B.
Dotted lines mark the cropped region of the immunoblot that was used to generate panel Figure 5B.
- https://cdn.elifesciences.org/articles/70504/elife-70504-fig5-data1-v2.pdf
Figure 6 with 1 supplement
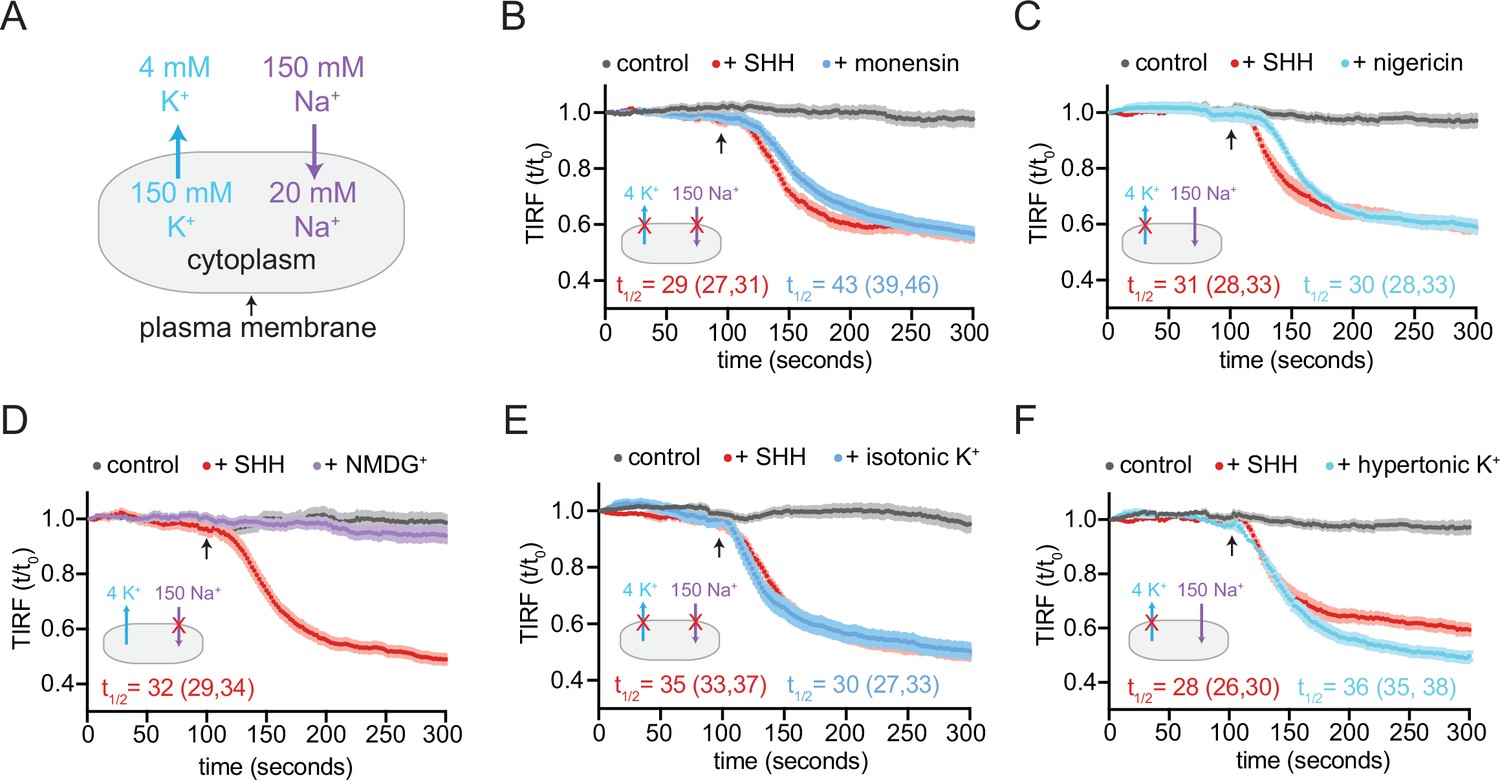
PTCH1 activity requires the cellular potassium gradient.
(A) The sodium and potassium gradients present across the plasma membrane of mammalian cells. In each of the panels a red ‘X’ is used to mark the gradient that is disrupted by the treatment used in the panel. Panels (B–F) show time courses of the change in TdTomato-PFOD4H membrane fluorescence after MβCD addition (316 μM, arrow) in cells expressing PTCH1 in control media (gray curves) or in media with the indicated additions or substitutions. In each case, SHH has been added (1 μM, red curve) to show the effect of PTCH1 inactivation in control media. (B, C) Effect of monensin (B, 100 μM, 1 hr) or nigericin (C, 80 nM, 30 min). (D, E) Effect of isotonic media in which 150 mM NaCl is replaced with an equal concentration of NMDG-Cl (D) or KCl (E). (F) Effect of hypertonic media containing 150 mM KCl in addition to 150 mM NaCl. Each curve shows the mean fluorescence measured from >20 cells taken from at least three biological replicates, with SEM depicted in lighter shading around each curve. Fluorescence is depicted relative to the starting fluorescence (t/t0) for the TIRFM data. The t1/2, along with the 95% CI, is shown for each curve. The experiment was repeated three independent times with similar results. CI, confidence interval; SEM, standard error of the mean.
Figure 6—figure supplement 1

Effect of rubidium and cesium ions on PTCH1 activity.
(A) Effect of isotonic media in which 150 mM NaCl is replaced with an equal concentration of choline-Cl (see also Figure 6D). (B) Time course of the change in TdTomato-PFOD4H membrane fluorescence after MβCD addition (316 μM, black arrow) in cells expressing PTCH1 and incubated in isotonic media where 150 mM NaCl is replaced with 150 mM RbCl. The inactivating effect of SHH (1 μM) on PTCH1 (red curve) is shown as a control. (C) Time course of the change in TdTomato-PFOD4H membrane fluorescence after MβCD addition (316 μM, black arrow) in cells expressing PTCH1 incubated in isotonic media where different amounts of NaCl are replaced with CsCl (shown in chart on right). For (A) and (B), each curve shows the mean fluorescence measured from >20 cells taken from at least three biological replicates, with SEM depicted in lighter shading around each curve. Fluorescence is depicted relative to the starting fluorescence (t/t0) for the TIRFM data. The t1/2, along with the 95% CI, is shown for each curve. This experiment was repeated two independent times with similar results. CI, confidence interval; SEM, standard error of the mean.
Figure 7

Models for how PTCH1 inhibits SMO by reducing membrane cholesterol.
(A) Three proposed mechanisms by which PTCH1 depletes outer leaflet accessible cholesterol (see text for details). In models 1 and 2, inner leaflet cholesterol is predicted to be reduced, but in model three inner leaflet cholesterol will increase. (B) PTCH1 inhibits SMO by utilizing the cellular potassium gradient to transport outer leaflet accessible cholesterol to the cytoplasmic leaflet (left). When SHH binds to PTCH1, outer leaflet accessible cholesterol rises and activates SMO by binding to its extracellular cysteine-rich domain (right).
Author response image 1
Anti-PTCH1 antibodies were used to measure the fluorescence of PTCH1 at primary cilia in mouse embryonic fibroblasts (MEFs) stably expressing PTCH1 (left) or at the plasma membrane of HEK293T cells used in our manuscript after Dox treatment (16 hours, 1 micromolar). Each dot represents one cilium (MEFs) or one cell (HEK293T cells). To show that the anti-PTCH1 IF signal is specific, PTCH1 measurements were also performed in MEFs treated with SHH (100 nM) for 16 hours (which is known to clear PTCH1 from cilia) and in HEK293T cells without Dox exposure.
Author response image 2
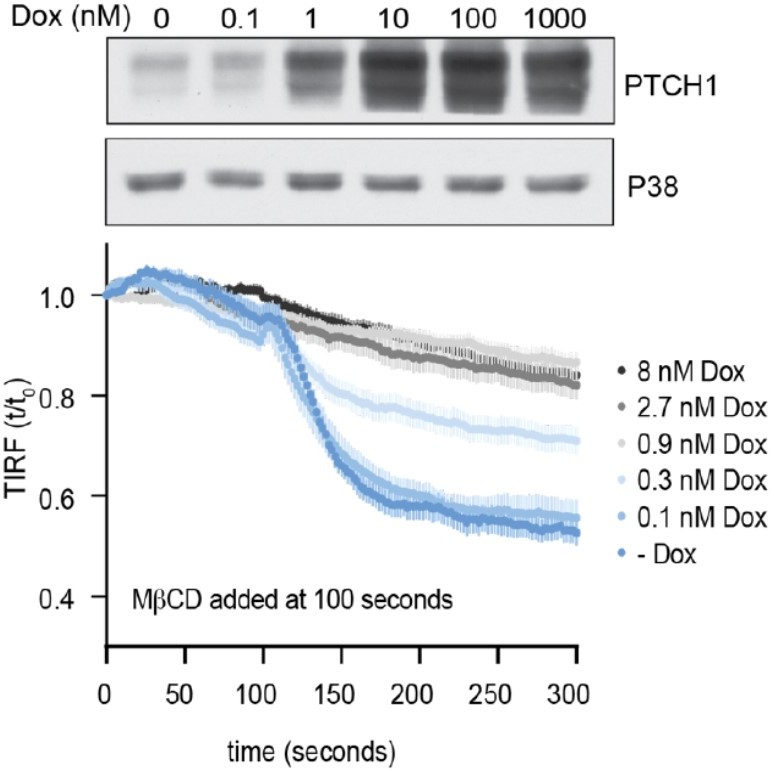
Time course of the change in TdTomato-PFOD4H membrane fluorescence after MβCD addition to HEK293T cells treated with increasing concentrations of Dox to induce the expression of progressively greater amounts of PTCH1.
The immunoblot (top) shows whole cell PTCH1 abundance after treatment with increasing concentrations of Dox.
Tables
Key resources table
| Reagent type (species) or resource | Designation | Source or reference | Identifiers | Additional information |
|---|---|---|---|---|
| Genetic reagent (Escherichia coli) | BL21 Rosetta DE3 pLYS | MilliporeSigma | Cat# 71403-3 | |
| Cell line (Homo sapiens) | 293T-REx Flp-In | Invitrogen | Cat# R780-07;RRID:CVCL_U427 | |
| Cell line (H. sapiens) | 293T-REx Flp-In: PTCH1-1D4 | This paper | Dr. Rajat Rohatgi (Stanford University) | |
| Cell line (H. sapiens) | 293T-REx Flp-In: PTCH1-ᐃL2-1D4 | This paper | Dr. Rajat Rohatgi (Stanford University) | |
| Cell line (H. sapiens) | 293T-REx Flp-In: PTCH1-1D4, D513Y | This paper | Dr. Rajat Rohatgi (Stanford University) | |
| Cell line (H. sapiens) | 293T-REx Flp-In: PTCH1-1D4, D513A/514 A | This paper | Dr. Rajat Rohatgi (Stanford University) | |
| Antibody | Anti-PTCH1(Rabbit polyclonal) | PMID:17641202 | Dr. Rajat Rohatgi (Stanford University)WB (1:500) | |
| Antibody | Anti-RFP (Mouse monoclonal) | Thermo Fisher Scientific | Cat# MA5-15257; RRID:AB_10999796 | WB (1:2000) |
| Antibody | Anti-P38(Rabbit polyclonal) | Abcam | Cat# ab7952; RRID: AB_306166 | WB (1:2000) |
| Antibody | Anti-mouse IgG (H + L)(Peroxidase AffiniPure Donkey) | Jackson ImmunoResearch Laboratories | Cat# 715-035-150; RRID: AB_2340770 | WB (1:10,000) |
| Antibody | Anti-rabbit IgG (H + L) (Peroxidase AffiniPure Donkey) | Jackson ImmunoResearch Laboratories | Cat# 111-035-144; RRID: AB_2307391 | WB (1:10,000) |
| Recombinant DNA reagent | mNeon-ALOD4 in pRSETB (plasmid) | PMID:33712199 | Dr. Arun Radhakrishnan (University of Texas, Southwestern Medical Center) | |
| Recombinant DNA reagent | mNeon-ALOD4- mutant in pRSETB (plasmid) | PMID:33712199 | Dr. Arun Radhakrishnan (University of Texas, Southwestern Medical Center) | |
| Recombinant DNA reagent | pcDNA5-FRT-TO Flp-In (plasmid) | Thermo Fisher Scientific | Cat# V652020 | |
| Recombinant DNA reagent | PTCH1-1D4 in pcDNA5-FRT-TO Flp-In (plasmid) | This paper | Dr. Rajat Rohatgi (Stanford University) | |
| Recombinant DNA reagent | dL2-PTCH1-1D4 in pcDNA5-FRT-TO Flp-In (plasmid) | This paper | Dr. Rajat Rohatgi (Stanford University) | |
| Recombinant DNA reagent | PTCH1-1D4, D513Y in pcDNA5-FRT-TO Flp-In (plasmid) | This paper | Dr. Rajat Rohatgi (Stanford University) | |
| Recombinant DNA reagent | PTCH1-1D4, D513A/D514A in pcDNA5-FRT-TO Flp-In (plasmid) | This paper | Dr. Rajat Rohatgi (Stanford University) | |
| Recombinant DNA reagent | TdTomato-PFO-D4H in pGEX-6P1 (plasmid) | PMID:25663704 | Dr. Gregory Fairn (University of Toronto) | |
| Recombinant DNA reagent | GFP-Gram1b in pEGFP-C1 (plasmid) | PMID:31724953 | Dr. Yasunori Saheki (Nanyang Technological University, Singapore) | |
| Recombinant DNA reagent | POG44 Flp-Recombinase expression vector (plasmid) | Thermo Fisher Scientific | Cat# V600520 | |
| Peptide, recombinant protein | Sonic Hedgehog | PMID:19561611 | Dr. Christian Siebold (Oxford University) | |
| Chemical compound, drug | Methyl beta cyclodextrin | Sigma-Aldrich | Cat# C4555-5G | |
| Chemical compound, drug | Myriocin | Cayman Chemicals | Cat# 35891-70-4 | |
| Chemical compound, drug | Doxycycline | Sigma-Aldrich | Cat# D9891 | |
| Chemical compound, drug | Monensin | Thermo Fisher Scientific | Cat# 461450010 | |
| Chemical compound, drug | Nigericin | Sigma-Aldrich | Cat# 481990 | |
| Chemical compound, drug | Dulbecco’s modified Eagle’s medium | Thermo Fisher Scientific | Cat# SH30081FS | |
| Chemical compound, drug | Fetal bovine serum | Sigma-Aldrich | Cat# S11150 | |
| Chemical compound, drug | Sodium pyruvate | Gibco | Cat# 11-360-070 | |
| Chemical compound, drug | L-glutamine | Gemini Bio-products | Cat# 400106 | |
| Chemical compound, drug | Penicillin/ streptomycin | Gemini Bio-products | Cat# 400109 | |
| Chemical compound, drug | Nonessential amino acids | Gibco | Cat# 11140076 | |
| Chemical compound, drug | Essential amino acids | Thermo Fisher Scientific | Cat# 11130051 | |
| Chemical compound, drug | Vitamins | Thermo Fisher Scientific | Cat# 11120052 | |
| Chemical compound, drug | Glucose | Thermo Fisher Scientific | Cat# A2494001 | |
| Chemical compound, drug | HEPES | Lonza | Cat# 17-737E | |
| Chemical compound, drug | Sodium pyruvate | Gibco | Cat# 11-360-070 | |
| Chemical compound, drug | HT supplement | Thermo Fisher Scientific | Cat# 11067030 | |
| Chemical compound, drug | Optimem | Thermo Fisher Scientific | Cat# 31985-070 | |
| Chemical compound, drug | Polyethylenimine | Polysciences | Cat# 23966-1 | |
| Chemical compound, drug | Matrigel | Thermo Fisher Scientific | Cat# CB-40234A | |
| Chemical compound, drug | SigmaFast Protease inhibitor cocktail, EDTA-free | Sigma-Aldrich | Cat# S8830 | |
| Chemical compound, drug | Hygromycin B | VWR Life Science | Cat# 97064-454 | |
| Chemical compound, drug | Nikon Immersion Oil, Type NF 50 cc, nd = 1.515 (23°C) | Nikon | Cat# MXA22024 | |
| Chemical compound, drug | Cesium chloride | Sigma-Aldrich | Cat# C4036 | |
| Chemical compound, drug | Rubidium chloride | Sigma-Aldrich | Cat# R2252 | |
| Chemical compound, drug | NMDG chloride | Sigma-Aldrich | Cat# 66,930 | |
| Chemical compound, drug | Choline chloride | Research Products International | Cat# C41040 | |
| Others | Chambered #1.5 German Coverglass, 8 well | Lab-Tek II | Cat# 155409 |
Additional files
Download links
A two-part list of links to download the article, or parts of the article, in various formats.
Downloads (link to download the article as PDF)
Open citations (links to open the citations from this article in various online reference manager services)
Cite this article (links to download the citations from this article in formats compatible with various reference manager tools)
Patched 1 reduces the accessibility of cholesterol in the outer leaflet of membranes
eLife 10:e70504.
https://doi.org/10.7554/eLife.70504


