AP-2α and AP-2β cooperatively function in the craniofacial surface ectoderm to regulate chromatin and gene expression dynamics during facial development
- Iowa Institute for Oral Health Research, College of Dentistry & Dental Clinics, University of Iowa, United States
- Department of Periodontics, College of Dentistry & Dental Clinics, University of Iowa, United States
- Department of Anatomy and Cell Biology, Carver College of Medicine, University of Iowa, United States
- Department of Craniofacial Biology, University of Colorado Anschutz Medical Campus, United States
- Department of Pediatrics, Section of Hematology, Oncology, and Bone Marrow Transplant, University of Colorado School of Medicine, University of Colorado Anschutz Medical Campus, United States
- Department of Cell and Developmental Biology, University of Colorado Anschutz Medical Campus, United States
- Department of Pediatrics, University of Colorado Anschutz Medical Campus, Children's Hospital Colorado, United States
Figures
Figure 1 with 2 supplements
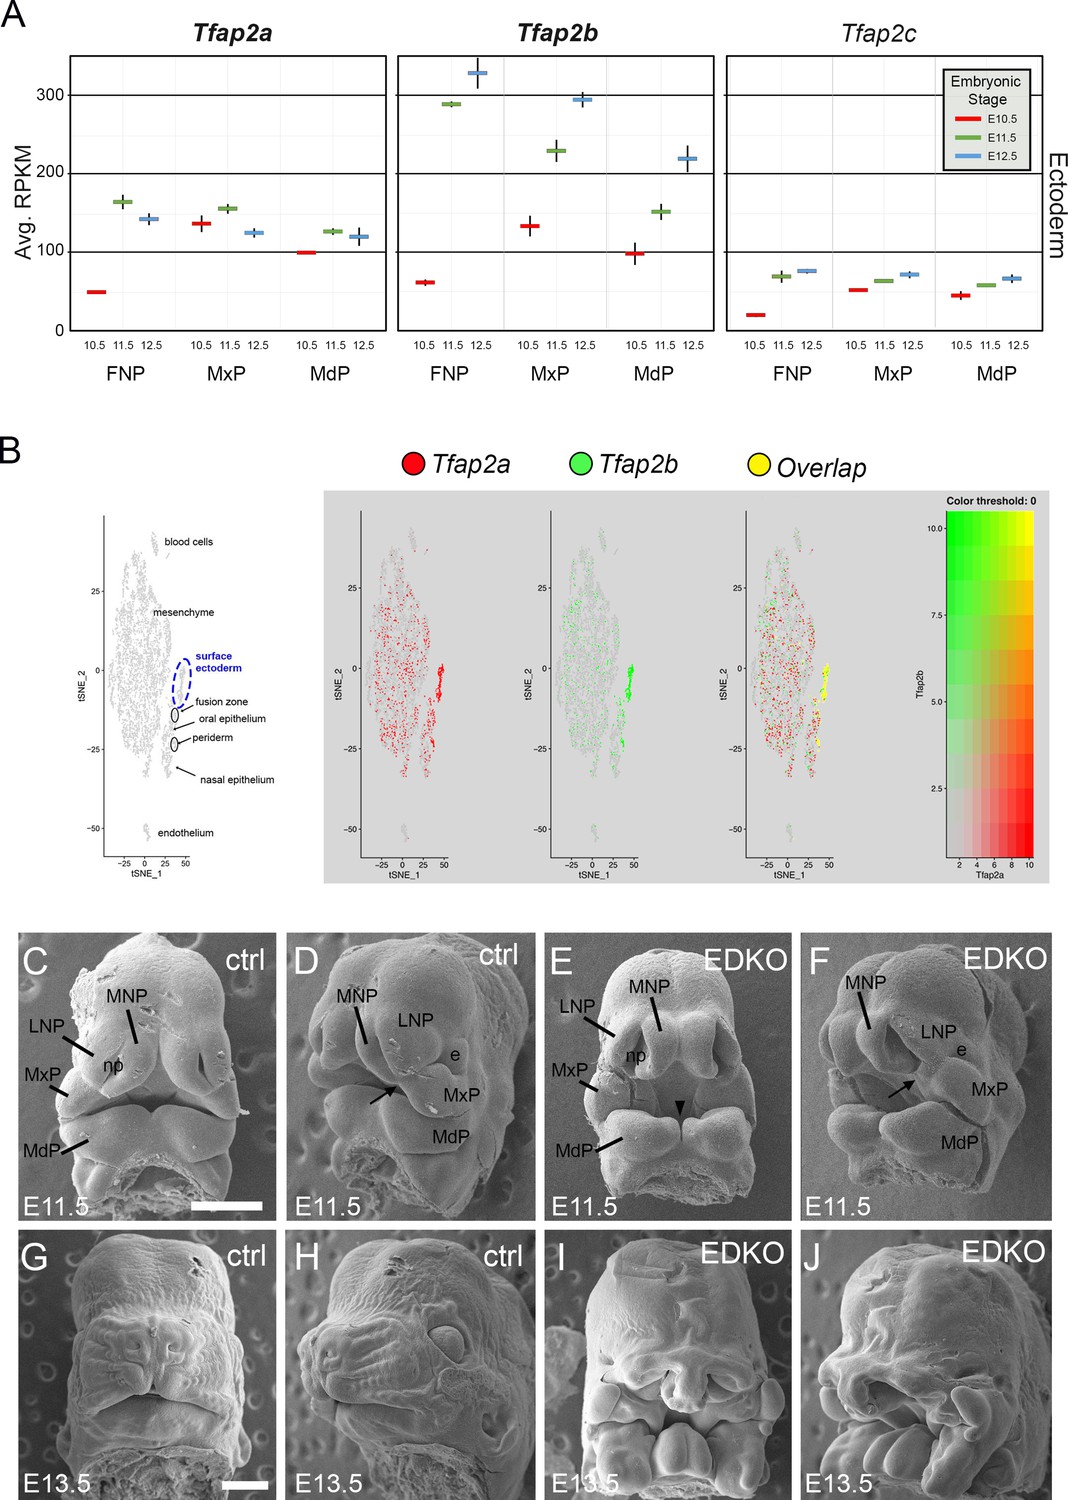
Expression and function of Tfap2a and Tfap2b in embryonic mouse facial ectoderm.
(A) Chart depicting Tfap2a, Tfap2b, and Tfap2c expression in the three regions of the mouse ectoderm between E10.5 and E12.5 (data adapted from Hooper et al., 2020). The lines represent the standard deviation between three biological replicates. (B) Left panel shows tSNE plot of E11.5 single cell RNAseq data from the region surrounding the lambdoid junction with various cell populations labeled adapted from Li et al., 2019a. Feature plots for Tfap2a, Tfap2b, and the cells in which their expression overlaps are shown in the adjacent panels. (C–J) Scanning electron microscope images of E11.5 (C–F) or E13.5 (G–J) control (C, D, G, H) or EDKO (E, F, I, J) heads shown in frontal (C, E, G, I) and angled (D, F, H, J) view. Abbreviations: e, eye; FNP, combined nasal prominences; LNP, lateral nasal process; MdP, mandibular prominence; MNP, medial nasal process; MxP, maxillary prominence; np, nasal pit. Arrow shows position of lambdoid junction; arrowhead shows medial cleft between mandibular prominences in EDKO mutant. Ctrl embryos are Tfap2aflox/+; Tfap2bflox/+ and EDKO embryos are Crect; Tfap2aflox/flox; Tfap2bflox/flox. N = 3 for each genotype. Scale bar = 500 µm.
Figure 1—figure supplement 1
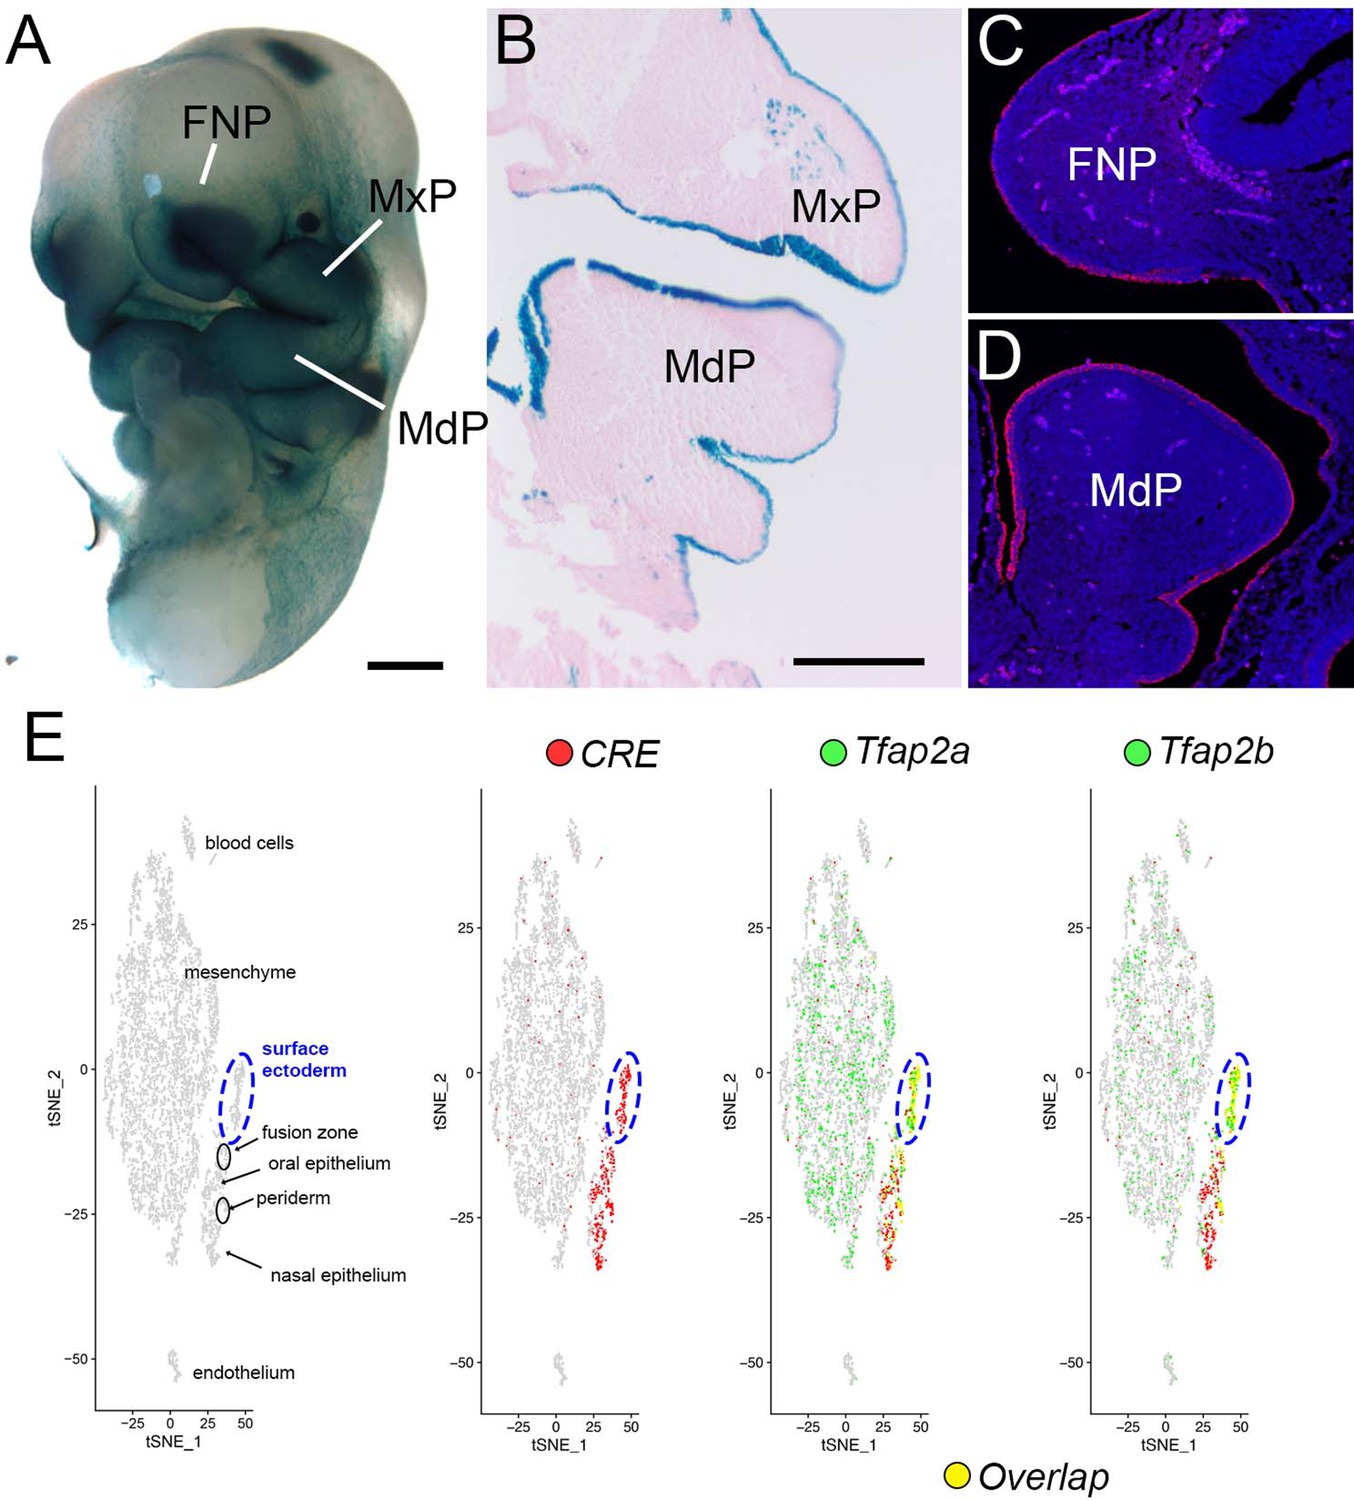
Confirmation of Crect expression domains in the craniofacial ectoderm.
(A–D) Images of E10.5 Crect +embryos that are positive for either the r26r (A–B) or the mT/mG (C–D) reporter alleles. (A) Whole-mount ß-gal staining of Crect+/r26r + embryo highlights strong ectoderm expression in the craniofacial prominences. (B) A representative coronal section through a ß-gal stained Crect+/r26r + embryo, highlighting robust epithelial expression. Section is counterstained with eosin. (C, D) Representative sagittal Crect+/mT/mG + sections through the FNP (C) or MdP (D) labeled with an anti-eGFP antibody and a fluorescent secondary antibody. Fluorescent signal is detected throughout the epithelium. Note, light signal in the underlying mesenchyme is autofluorescence from red blood cells. Nuclei are counterstained with DAPI. (E) tSNE plot of E11.5 single cell RNAseq data from region surrounding lambdoid junction, with identity of cell populations marked in the first panel (adapted from Li et al., 2019a). Note, surface ectoderm cells have been circled in a dashed blue line. The final three panels include feature plots highlighting: first, Crect expression (red); second, Tfap2a expression (green) and its overlap with Cre expression (yellow); and third, Tfap2b expression (green) and its overlap with Cre expression (yellow). Note, both Tfap2a and Tfap2b expression overlap highly with Cre expression in the surface ectoderm cell population. In contrast, while expression of Tfap2a and Tfap2b is detected within the mesenchyme, Cre expression is nearly absent. Individual feature plots for Tfap2a and Tfap2b are shown in Figure 1B. Abbreviations: FNP, frontonasal prominence; MdP, mandibular prominence; MxP, maxillary prominence. Scale bars = 500 µM.
Figure 1—figure supplement 2

IGV browser screenshot of RNA-seq tracks from E11.5 control (black) or EDKO (red) facial ectoderm.
(A) At the Tfap2a locus, nearly all reads mapping to exons 5 and 6 (those flanked by the loxP recombination sites) have been lost in the EDKO’s, as compared to the controls. (B) Likewise, reads mapping to the single exon (exon 6) flanked by loxP sites at the Tfap2b locus are absent in EDKO’s, as compared to controls. These findings are consistent with a near 100% recombination rate in the facial surface ectoderm of EDKO’s.
Figure 2
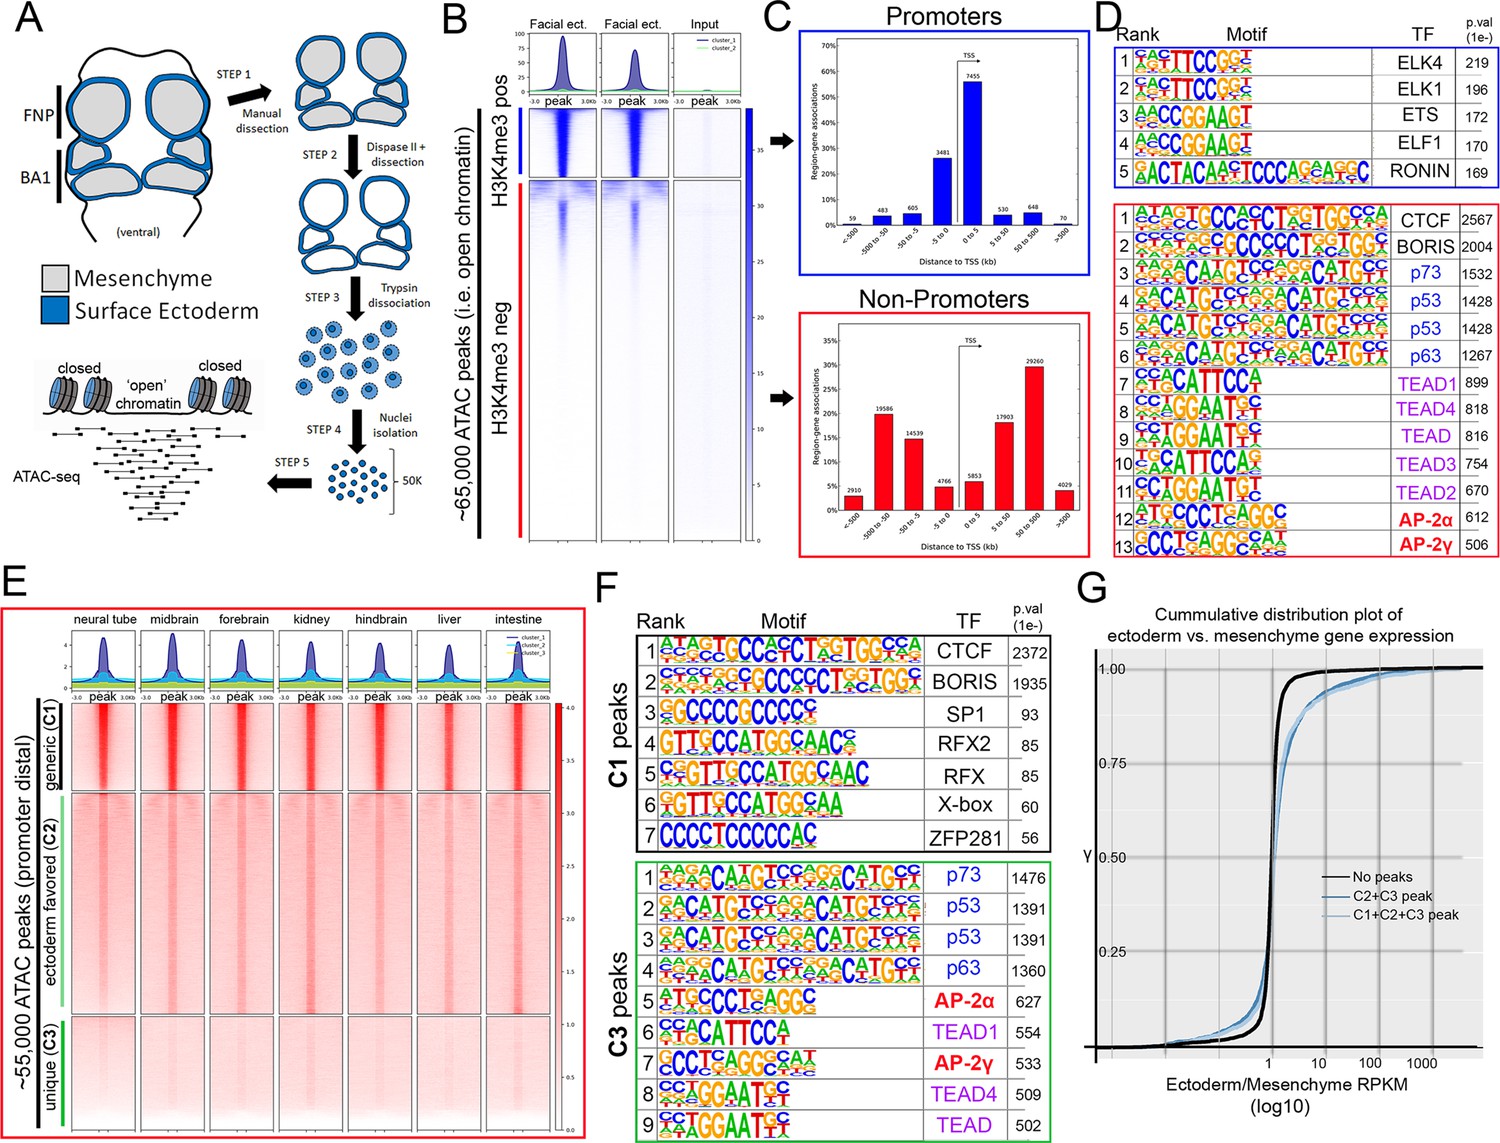
ATAC-seq of control E11.5 craniofacial surface ectoderm reveals nucleosome free regions.
(A) A schematic outlining the general workflow of craniofacial surface ectoderm isolation and subsequent ATAC-seq to identify open chromatin regions. (B) Density plot of ~65,000 open chromatin regions identified in the control surface ectoderm (Y-axis), +/- 3 Kb (X-axis), overlaid with the H3K4me3 promoter mark from similar tissue at E10.5 (column 1), E11.5 (column 2), or non-enriched input control (column 3). (C) Distribution, relative to the transcriptional start site (TSS, arrow) of the elements subset in (B). (D) Transcription factor motif enrichment analysis of the 2 subset clusters identified in (B). (E) Density plot of ~55,000 non-promoter, open chromatin regions [bottom cluster in (B) replotted on Y-axis], +/- 3 Kb (X-axis) overlaid with ENCODE ATAC-seq datasets from various mouse embryonic tissues/organs. (F) Transcription factor motif enrichment analysis of 2 (C1 and C3) of the three subset clusters identified in (E) (C2 not shown). (G) A cumulative distribution plot of gene expression in craniofacial surface ectoderm versus mesenchyme. The groups of genes include those with no peaks (black line), those with C1, C2, and C3 peaks (light blue line), and those with C2 and C3 peaks only (dark blue line)—with ‘peaks’ being those defined by subclusters in (E).
-
Figure 2—source data 1
Summary of motif enrichment found within H3K4me3 + ATAC seq elements (i.e., Figure 2D, top).
- https://cdn.elifesciences.org/articles/70511/elife-70511-fig2-data1-v2.pdf
-
Figure 2—source data 2
Summary of motif enrichment found within H3K4me3- ATAC-seq elements (i.e., Figure 2D, bottom).
- https://cdn.elifesciences.org/articles/70511/elife-70511-fig2-data2-v2.pdf
-
Figure 2—source data 3
Summary of GREAT analysis of H3K4me3 + ATAC seq elements.
- https://cdn.elifesciences.org/articles/70511/elife-70511-fig2-data3-v2.pdf
-
Figure 2—source data 4
Summary of GREAT analysis of H3K4me3- ATAC-seq elements.
- https://cdn.elifesciences.org/articles/70511/elife-70511-fig2-data4-v2.pdf
-
Figure 2—source data 5
Summary of motif enrichment found within C1 ATAC-seq elements (i.e., Figure 2E, top).
- https://cdn.elifesciences.org/articles/70511/elife-70511-fig2-data5-v2.pdf
-
Figure 2—source data 6
Summary of GREAT analysis of C1 ATAC-seq elements (i.e., Figure 2E, top).
- https://cdn.elifesciences.org/articles/70511/elife-70511-fig2-data6-v2.pdf
-
Figure 2—source data 7
Summary of motif enrichment found within C3 ATAC-seq elements (i.e., Figure 2E, bottom).
- https://cdn.elifesciences.org/articles/70511/elife-70511-fig2-data7-v2.pdf
-
Figure 2—source data 8
Summary of GREAT analysis of C3 ATAC-seq elements (i.e., Figure 2E, bottom).
- https://cdn.elifesciences.org/articles/70511/elife-70511-fig2-data8-v2.pdf
-
Figure 2—source data 9
Summary of motif enrichment found within C2 ATAC-seq elements (i.e., Figure 2E, middle).
- https://cdn.elifesciences.org/articles/70511/elife-70511-fig2-data9-v2.pdf
-
Figure 2—source data 10
Summary of GREAT analysis of C2 ATAC-seq elements (i.e., Figure 2E, middle).
- https://cdn.elifesciences.org/articles/70511/elife-70511-fig2-data10-v2.pdf
-
Figure 2—source data 11
A cumulative distribution plot graphing E11.5 craniofacial gene expression enrichment (ectoderm/mesenchyme, X-axis) relative to the total number of C2 and C3 ATAC-seq elements associated with that gene.
- https://cdn.elifesciences.org/articles/70511/elife-70511-fig2-data11-v2.pdf
Figure 3
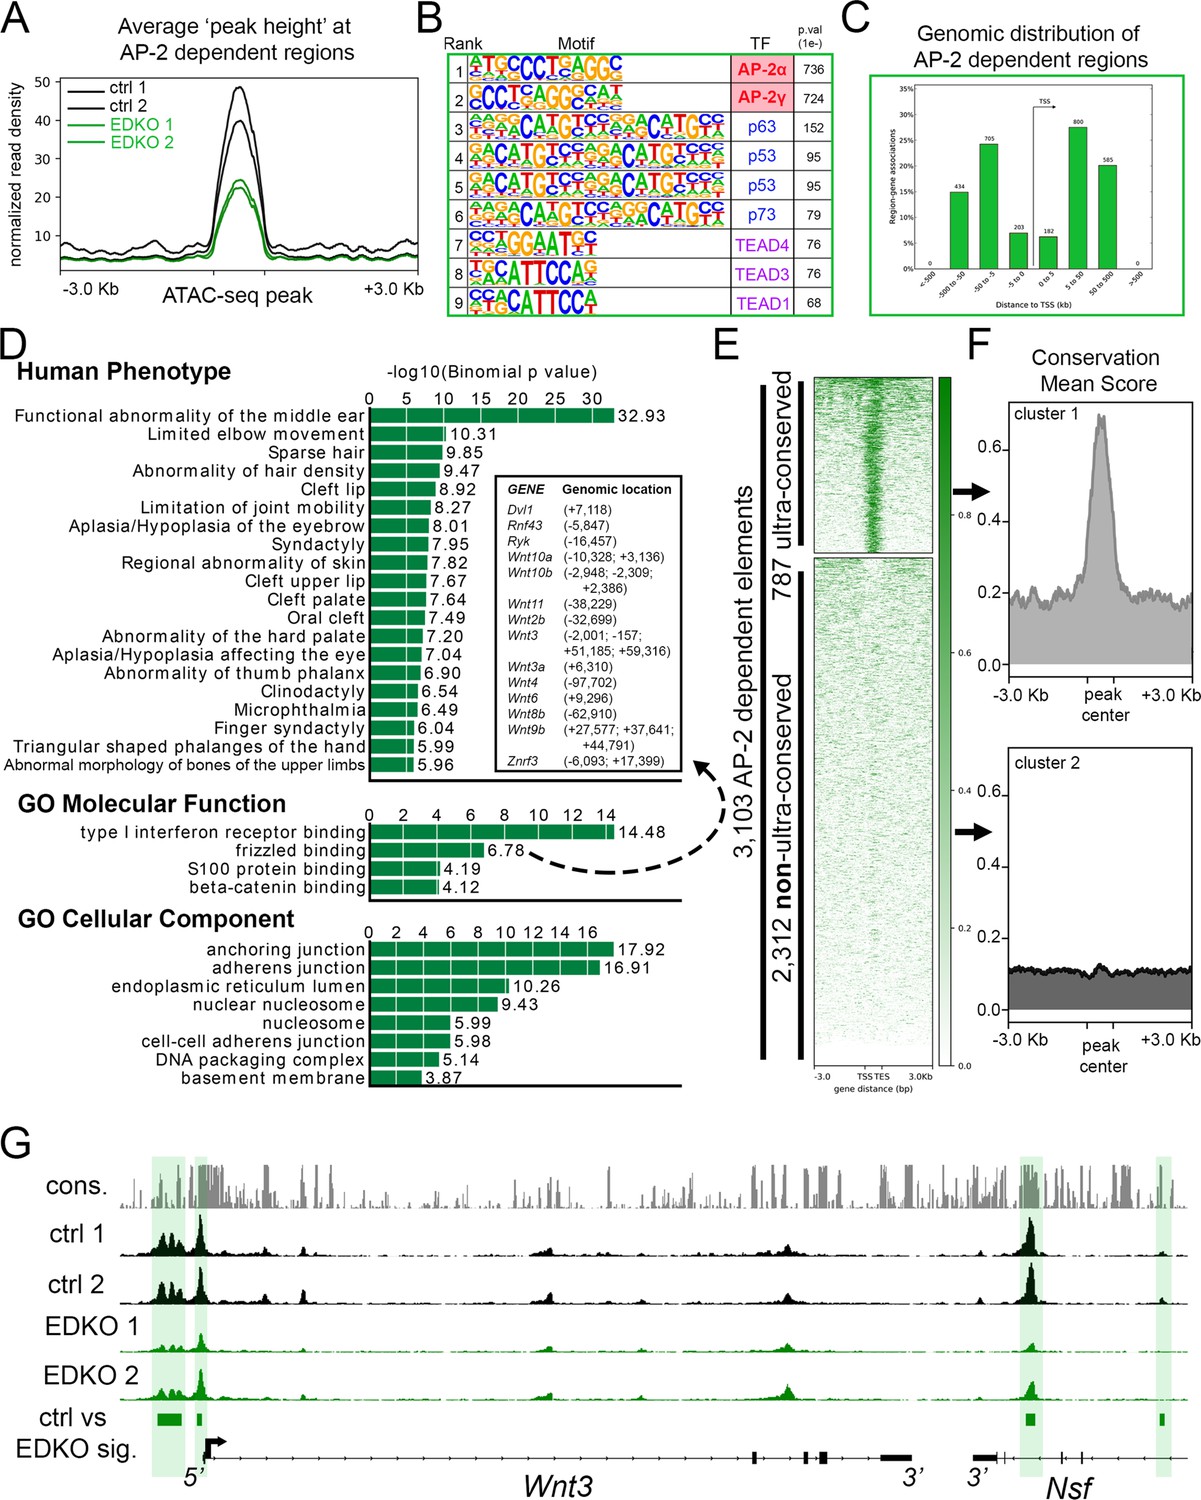
ATAC-seq analysis of EDKO mutants reveals AP-2 craniofacial surface ectoderm dependent nucleosome free regions.
(A) Average normalized read density for control (black lines) and Tfap2a/Tfap2b ectoderm mutant (green lines) ATAC-seq datasets at AP-2-dependent nucleosome-free regions ( +/- 3.0 Kb). (B) Transcription factor motif enrichment analysis of AP-2-dependent nucleosome-free regions. (C) Distribution, relative to the transcriptional start site (TSS, arrow) of AP-2 dependent nucleosome-free regions. (D) GO/pathway enrichment analysis, using GREAT, of genes located near AP-2 dependent nucleosome-free regions. Note, the inset highlights the genes associated with the GO Molecular Function annotation ‘frizzled binding’ and the genomic location (relative to the TSS) of the associated AP-2-dependent nucleosome-free region. (E) Density plot of ~3100 AP-2-dependent elements (Y-axis), +/- 3 Kb (X-axis) overlaid with conservation score (e.g. darker green = more conserved) identifies ‘ultra-conserved’ and ‘non-ultra-conserved’ subclusters. (F) Mean conservation score of elements identified in each subcluster in (E). (G) IGV browser view of tracks at the Wnt3 locus. Tracks for conservation (grey, labeled cons.), control ATAC-seq replicates (black, labeled ctrl 1 and ctrl 2), AP-2 mutant ATAC-seq replicates (green, labeled EDKO1 and EDKO2), and coordinates of significantly altered elements between control and AP-2 mutant datasets (green bars, labeled ctrl vs EDKO sig.). The Wnt3 transcription unit is schematized at the bottom, along with the 3’ exons of the flanking Nsf gene, representing ~60 kb of genomic DNA.
-
Figure 3—source data 1
Summary of motif enrichment found within ATAC-seq elements remaining in EDKO mutant surface ectoderm.
- https://cdn.elifesciences.org/articles/70511/elife-70511-fig3-data1-v2.pdf
-
Figure 3—source data 2
Summary of motif enrichment found within ATAC-seq elements that are AP-2 -dependent (i.e., present in control, but gone in EDKO) in the craniofacial surface ectoderm.
- https://cdn.elifesciences.org/articles/70511/elife-70511-fig3-data2-v2.pdf
-
Figure 3—source data 3
Summary of GREAT analysis using ATAC-seq elements that are AP-2 dependent (i.e., present in control, but gone in EDKO) in the craniofacial surface ectoderm.
- https://cdn.elifesciences.org/articles/70511/elife-70511-fig3-data3-v2.pdf
-
Figure 3—source data 4
Summary of GREAT analysis using ATAC-seq elements that are AP-2 dependent (i.e., present in control, but gone in EDKO) in the craniofacial surface ectoderm and are ‘ultra-conserved’ (i.e., Figure 3E, Top).
- https://cdn.elifesciences.org/articles/70511/elife-70511-fig3-data4-v2.pdf
-
Figure 3—source data 5
Summary of GREAT analysis using ATAC-seq elements that are AP-2 dependent (i.e., present in control, but gone in EDKO) in the craniofacial surface ectoderm and are ‘non-ultra-conserved’ (i.e., Figure 3E, Bottom).
- https://cdn.elifesciences.org/articles/70511/elife-70511-fig3-data5-v2.pdf
-
Figure 3—source data 6
Summary of motif enrichment found within ATAC-seq elements that are gained upon loss of AP-2 in the craniofacial surface ectoderm (i.e., element not found in control, but present in EDKO).
- https://cdn.elifesciences.org/articles/70511/elife-70511-fig3-data6-v2.pdf
Figure 4 with 5 supplements

WNT-pathway related gene expression changes at E11.5 correlate with Tfap2 gene dosage.
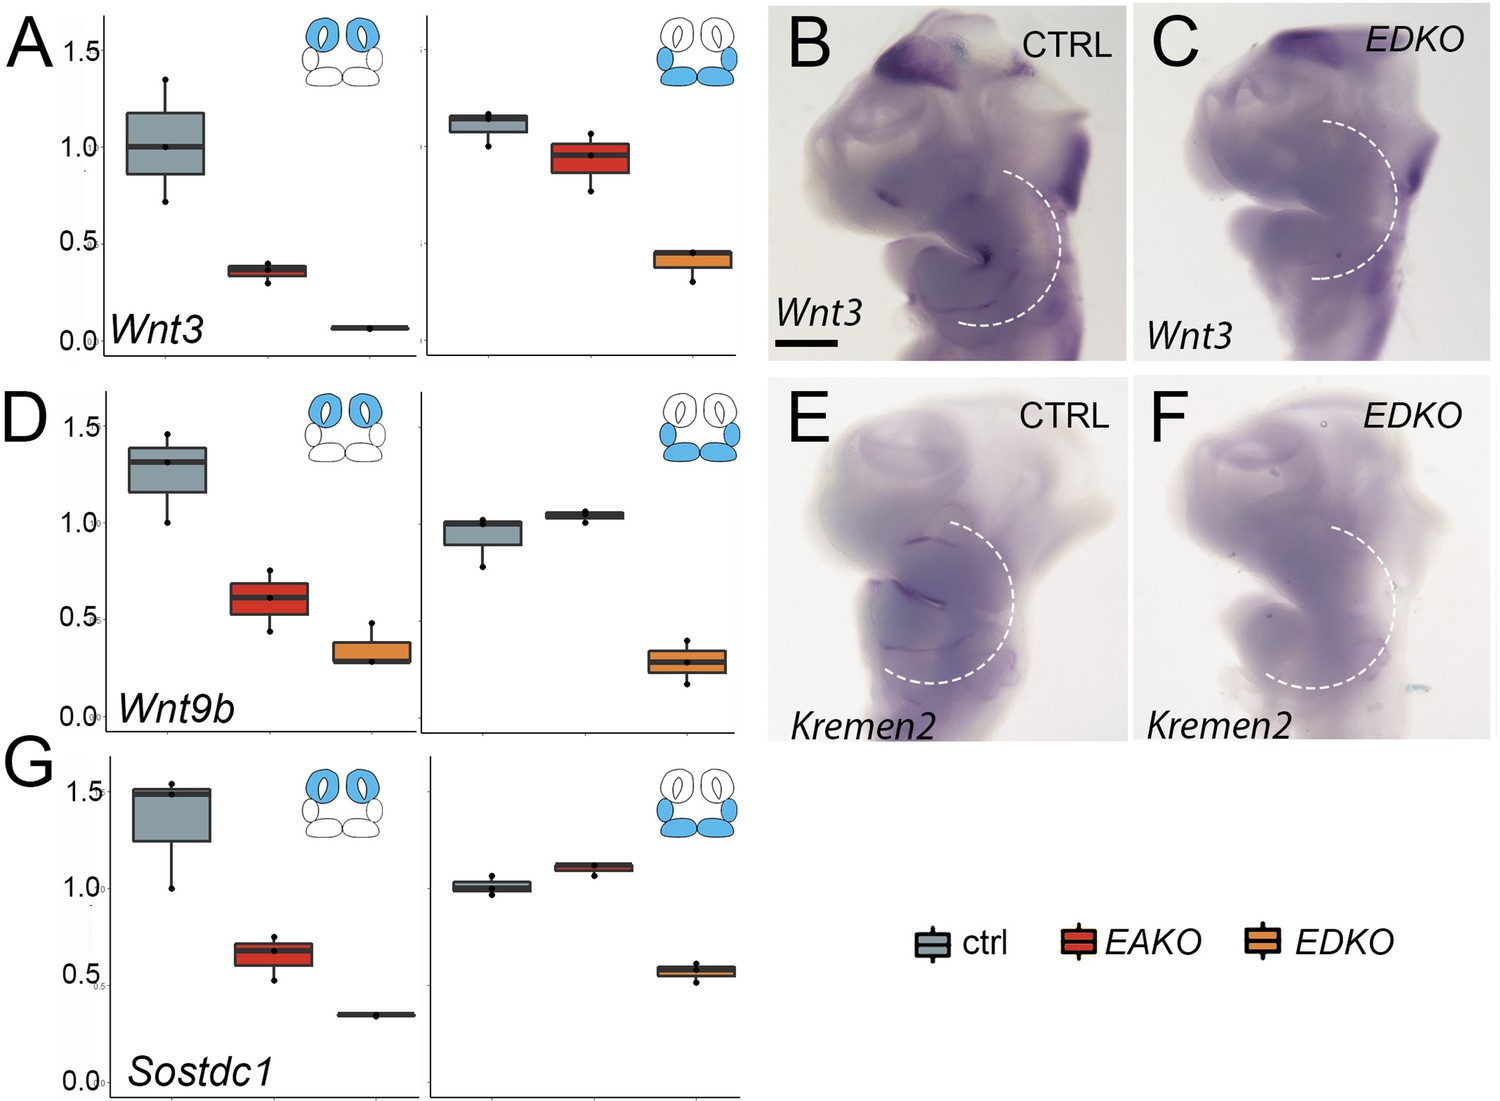
(A–D). Analysis of Wnt3 expression. (A–C) Lateral facial views of whole mount in situ hybridization analyses of E11.5 control (A), EAKO (B), and EDKO (C) embryos stained for Wnt3. (D) Quantitative RT-PCR analysis of Wnt3 expression for biological duplicates of control (grey), EAKO (red), or EBKO (yellow) and EDKO (orange) samples. The boxplots represent technical triplicates, including upper, lower, and median values. Note, RNA was derived from whole facial prominences that is, ectoderm and mesenchyme, as shown in schematic at top left of (D). The Y-axis represents relative gene expression normalized to ß-actin. (E–H) Panels show equivalent whole mount and qRT-PCR analyses to (A–D) for Wnt9b expression. (I–L) Quantitative RT-PCR analysis for Wnt10b (I), Axin2 (J), Dkk4 (K) and Sostdc1 (L) as in panel (D). (M) IGV screenshot showing tracks for ATAC-seq analysis in control (top two tracks, black, ctrl 1 and ctrl 2) or EDKO (bottom two tracks, green, EDKO 1 and EDKO 2), and regions of significant difference between the two genotypes (green bar). An ‘AP-2-dependent’ nucleosome-free region is highlighted in green ~6 kb upstream of the 4 kb mouse Dkk4 transcription unit. MxP, maxillary prominence. Ctrl embryos are Tfap2aflox/+; Tfap2bflox/+, EAKO embryos are Crect; Tfap2aflox/flox; Tfap2bflox/+, EBKO embryos are Crect; Tfap2aflox/+; Tfap2bflox/flox, and EDKO embryos are Crect; Tfap2aflox/flox; Tfap2bflox/flox. A minimum of three embryos per genotype were used for in situ analysis, while real-time PCR was conducted with two biological replicates (each with technical triplicates). Scale bar = 500 µM.
Figure 4—figure supplement 1
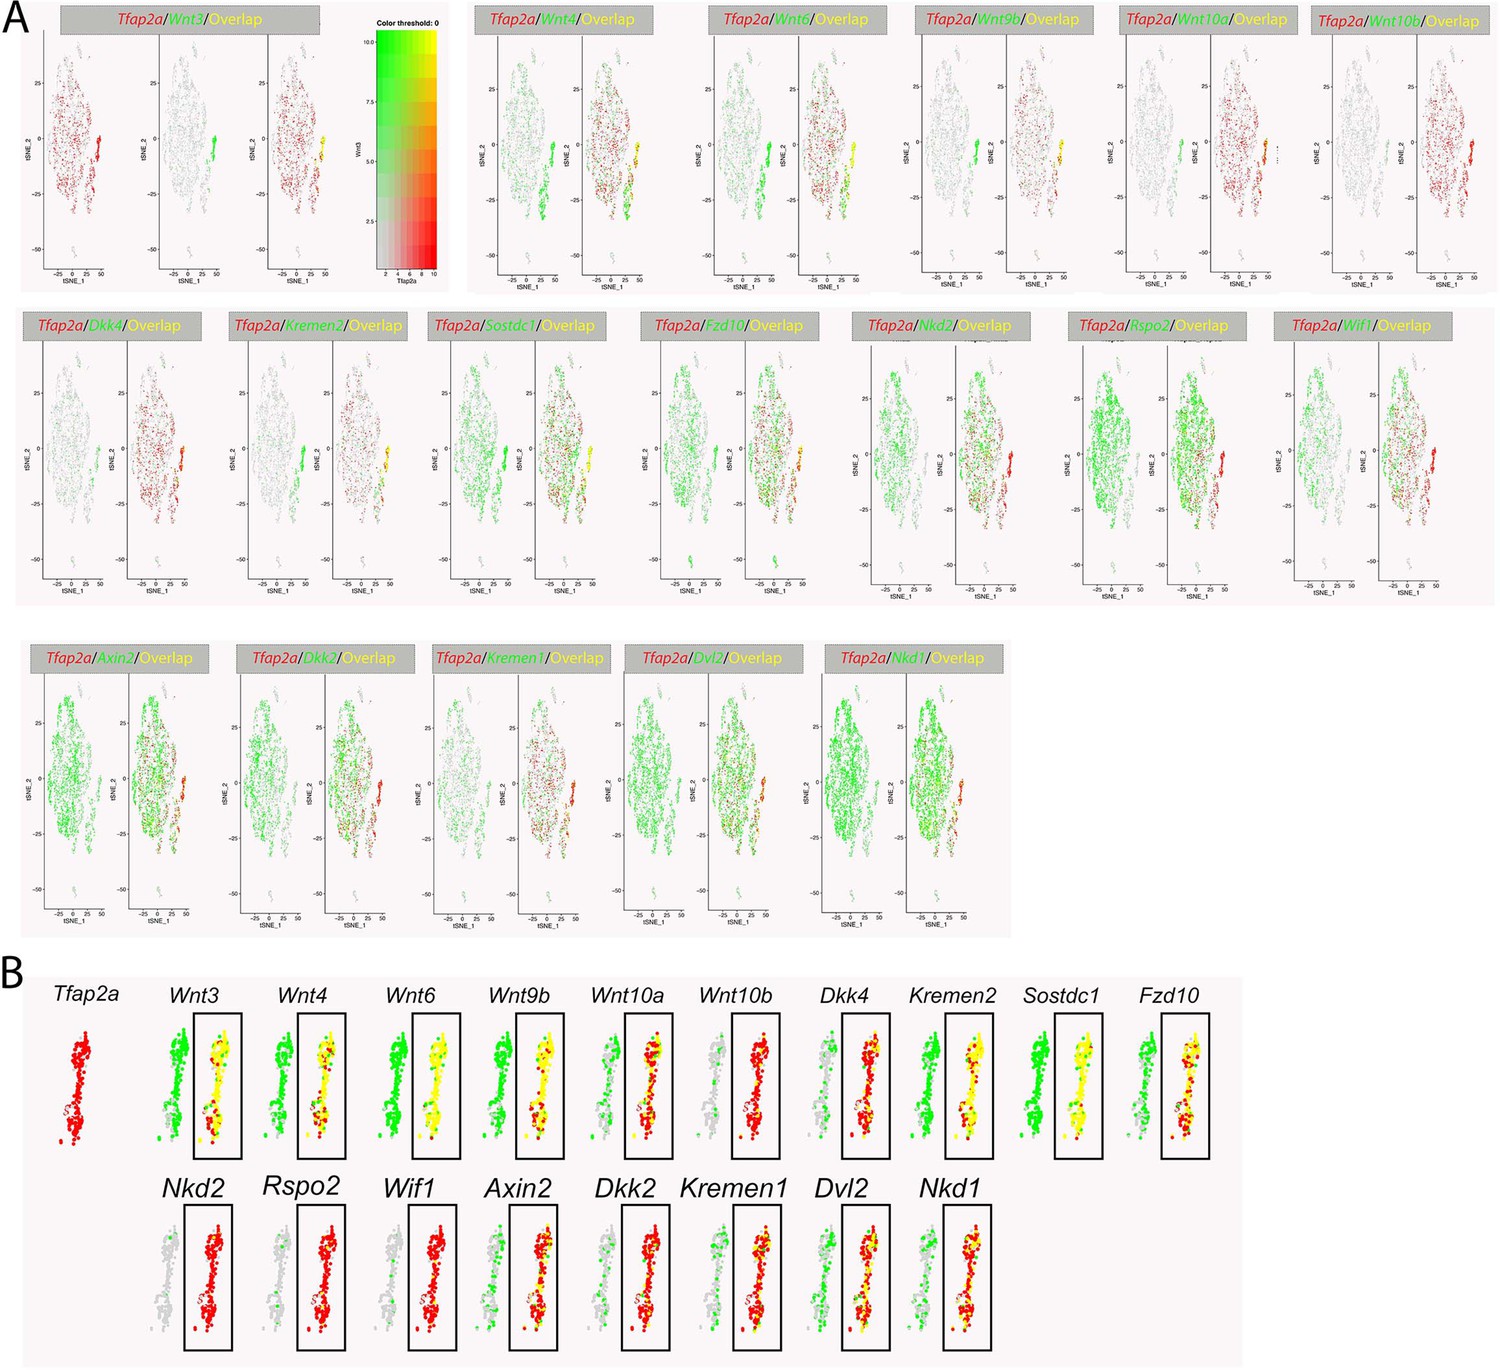
Co-expression analysis between Tfap2a and multiple WNT-signaling components.
(A) tSNE plot of E11.5 single-cell RNAseq data from the region surrounding the lambdoid junction with cell populations arranged as labeled in Figure 1B (adapted from Li et al., 2019a). Features plots for Tfap2a expression (very top left panel, red) and Wnt pathway component expression (green). Focusing on the first 3 feature plots, Tfap2a expression (red) is shown first, Wnt3 expression (green) is shown second, and their overlap (red +green = yellow) is shown last. Note, subsequent groupings only show expression of the Wnt-associated gene and the corresponding overlap with Tfap2a expression. While some genes show high expression overlap with Tfap2a in the surface ectoderm (e.g. Wnt3) others are not expressed in the surface ectoderm (e.g. Nkd2). (B) Higher magnification of the tSNE plot, focusing on cells of the surface ectoderm. Tfap2a expression is shown first (in red), followed by expression of various Wnt-pathway components (in green). Boxed regions highlight their degree of expression overlap in these cells (e.g. yellow equals high overlap).
Figure 4—figure supplement 2
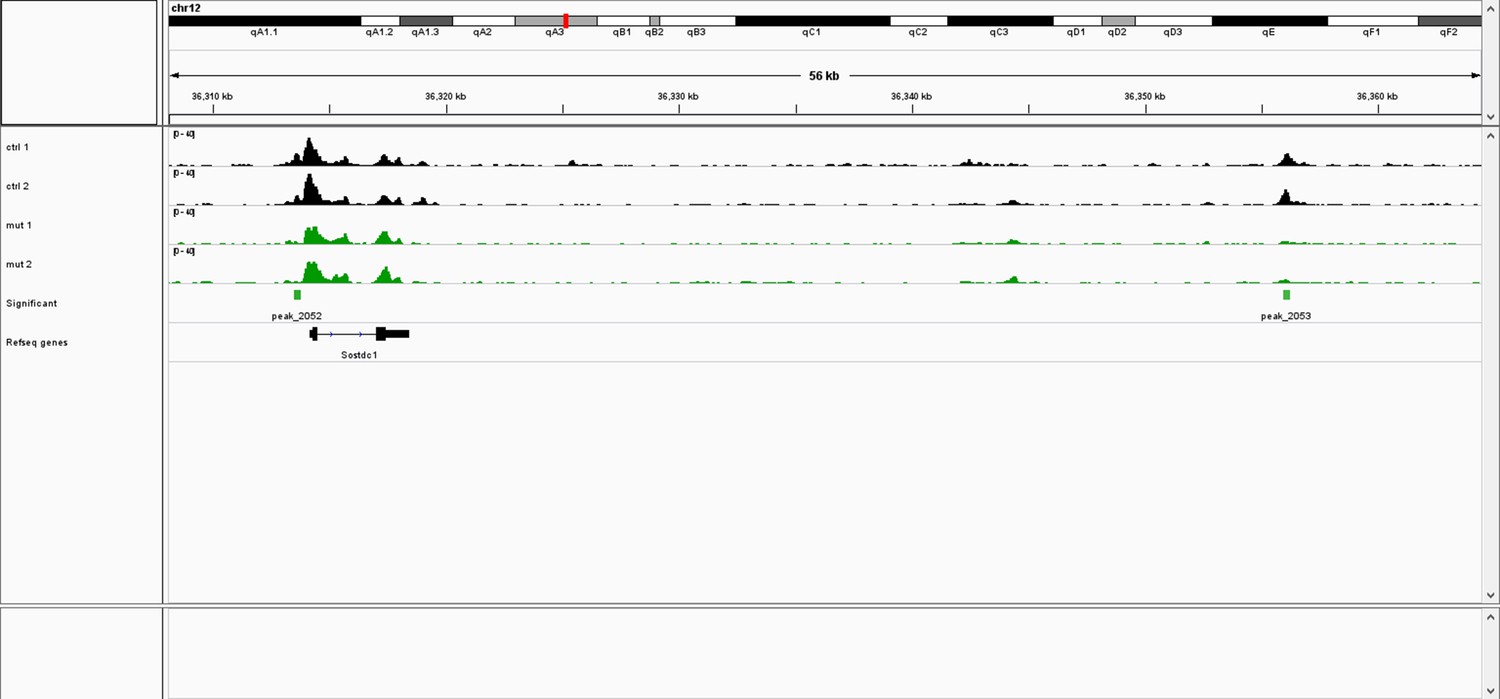
IGV browser screenshot of ATAC-seq tracks at the Sostdc1 locus.
Black tracks are control samples (e.g., ctrl 1, ctrl 2), while green tracks are EDKO samples (e.g., mut 1, mut2). Green boxes below EDKO samples represent ATAC-seq regions that are significantly reduced in EDKO’s vs controls.
Figure 4—figure supplement 3
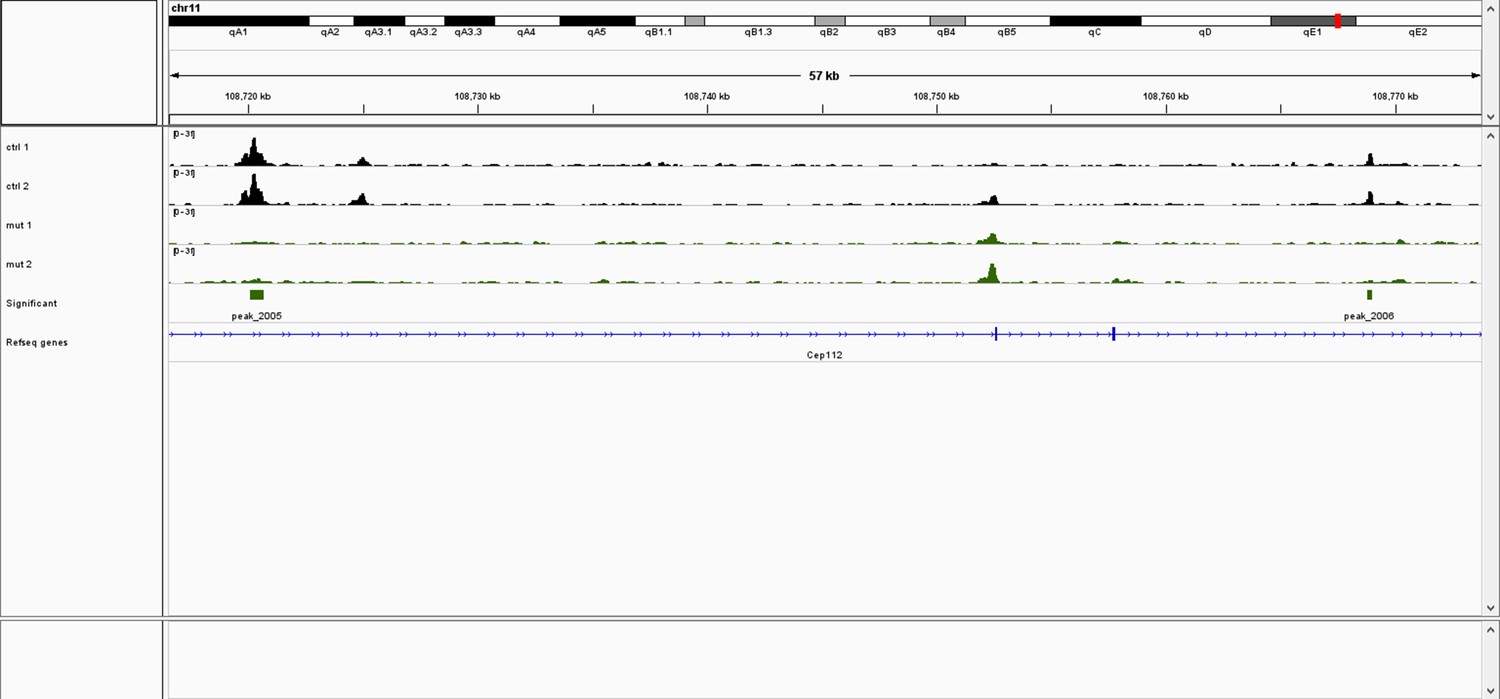
IGV browser screenshot of ATAC-seq tracks near the Axin2 locus.
AP-2 dependent peaks are located ~160 kb upstream of the Axin2 promoter (located at ~108,920) within introns of the adjacent Cep112 gene. Black tracks are control samples (e.g. ctrl 1, ctrl 2), while green tracks are EDKO samples (e.g. mut 1, mut2). Green boxes below EDKO samples represent ATAC-seq regions that are significantly reduced in EDKO’s vs controls.
Figure 4—figure supplement 4
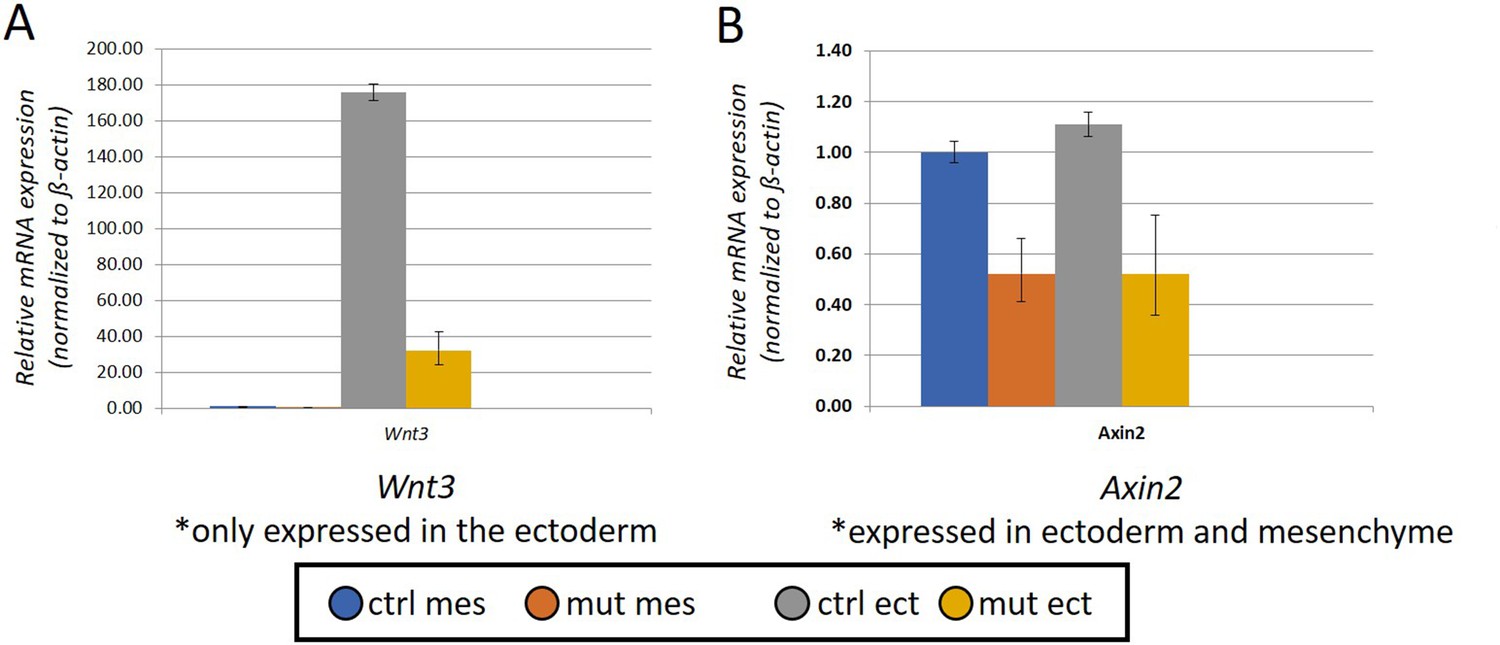
Bar-charts summarizing real-time RT-PCR analysis of cDNA generated from RNA collected from E11.5 craniofacial mesenchyme (mes) or surface ectoderm (ect) of a control or EDKO (mut) sample.
Relative expression (normalized to ß-actin) is shown for both Wnt3 (expressed only in the ectoderm) and Axin2 (expressed in both ectoderm and mesenchyme).
Figure 4—figure supplement 5
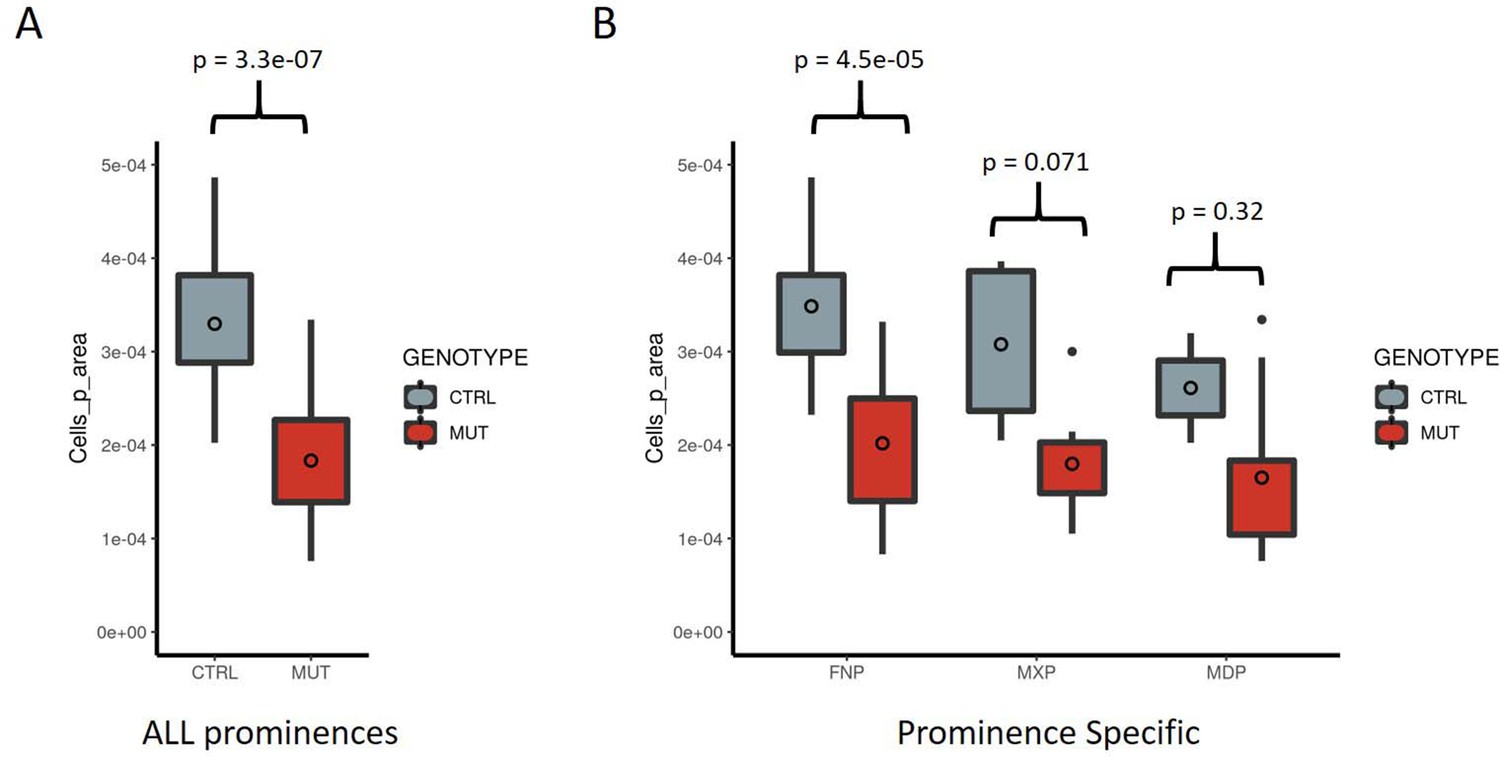
Quantification of cell proliferation in the facial prominences of control and EDKO embryos.
(A–B) Boxplots summarizing quantification of the number of anti-phospho histone H3 + cells per area, of either control (grey) or EDKO (red) E11.5 embryos, either collectively within a section of the face (i.e. all prominences) (A) or by each prominence individually (B). The mean is indicated by the unfilled circle, 75th and 25th percentiles by the limits of the box, and the largest or smallest value within 1.5 times the interquartile range by the lines. Outliers are indicated by the isolated points. A standard two-tailed t-test was conducted to calculate significance.
Figure 5
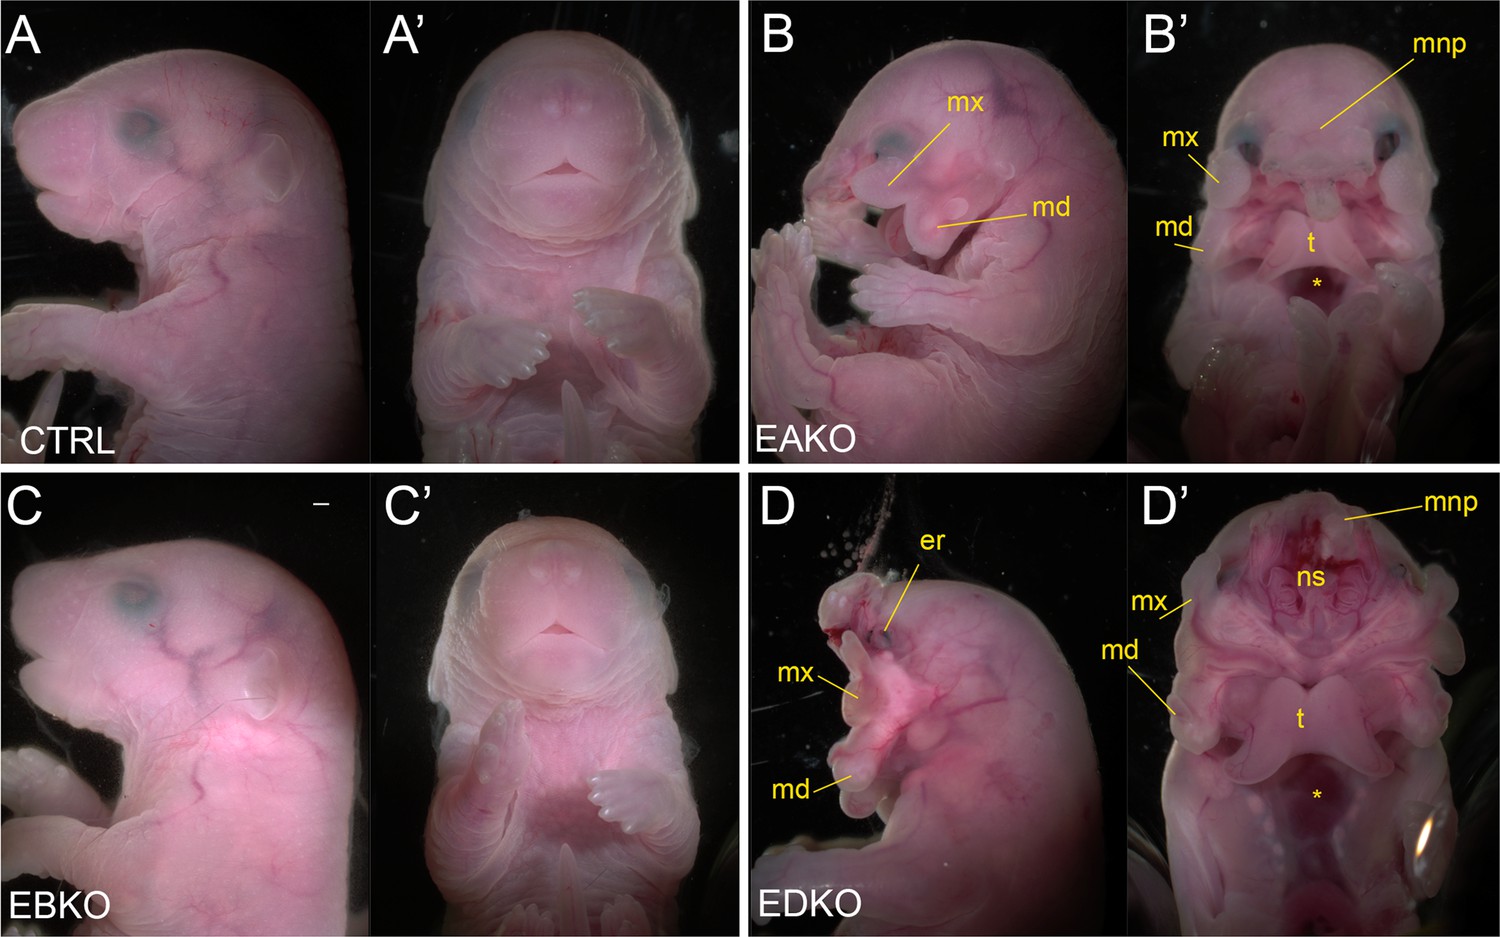
Gross morphological phenotypes of E18.5 control, EAKO, EBKO, and EDKO mutants.
Lateral (A–D) or ventral (A’-D’) views of an E18.5 control (A, A’), EAKO (B, B’), EBKO (C, C’), or EDKO (D, D’) embryo. Abbreviations: md, mandible; mnp, medial nasal prominence; mx, maxillary prominence; er, eye remnant; ns, nasal septum; t, tongue. Asterisks in B’ and D’ indicates ventral body wall closure defect. Ctrl embryos are Tfap2aflox/+; Tfap2bflox/+, EAKO embryos are Crect; Tfap2aflox/null; Tfap2bflox/+, EBKO embryos are Crect; Tfap2aflox/+; Tfap2bflox/null, and EDKO embryos are Crect; Tfap2aflox/null; Tfap2bflox/null. A minimum of at least three embryos per genotype were examined. Mandibular clefting and failure of facial fusion was fully penetrant in EDKO embryos. Scale bar = 500 µM.
Figure 6
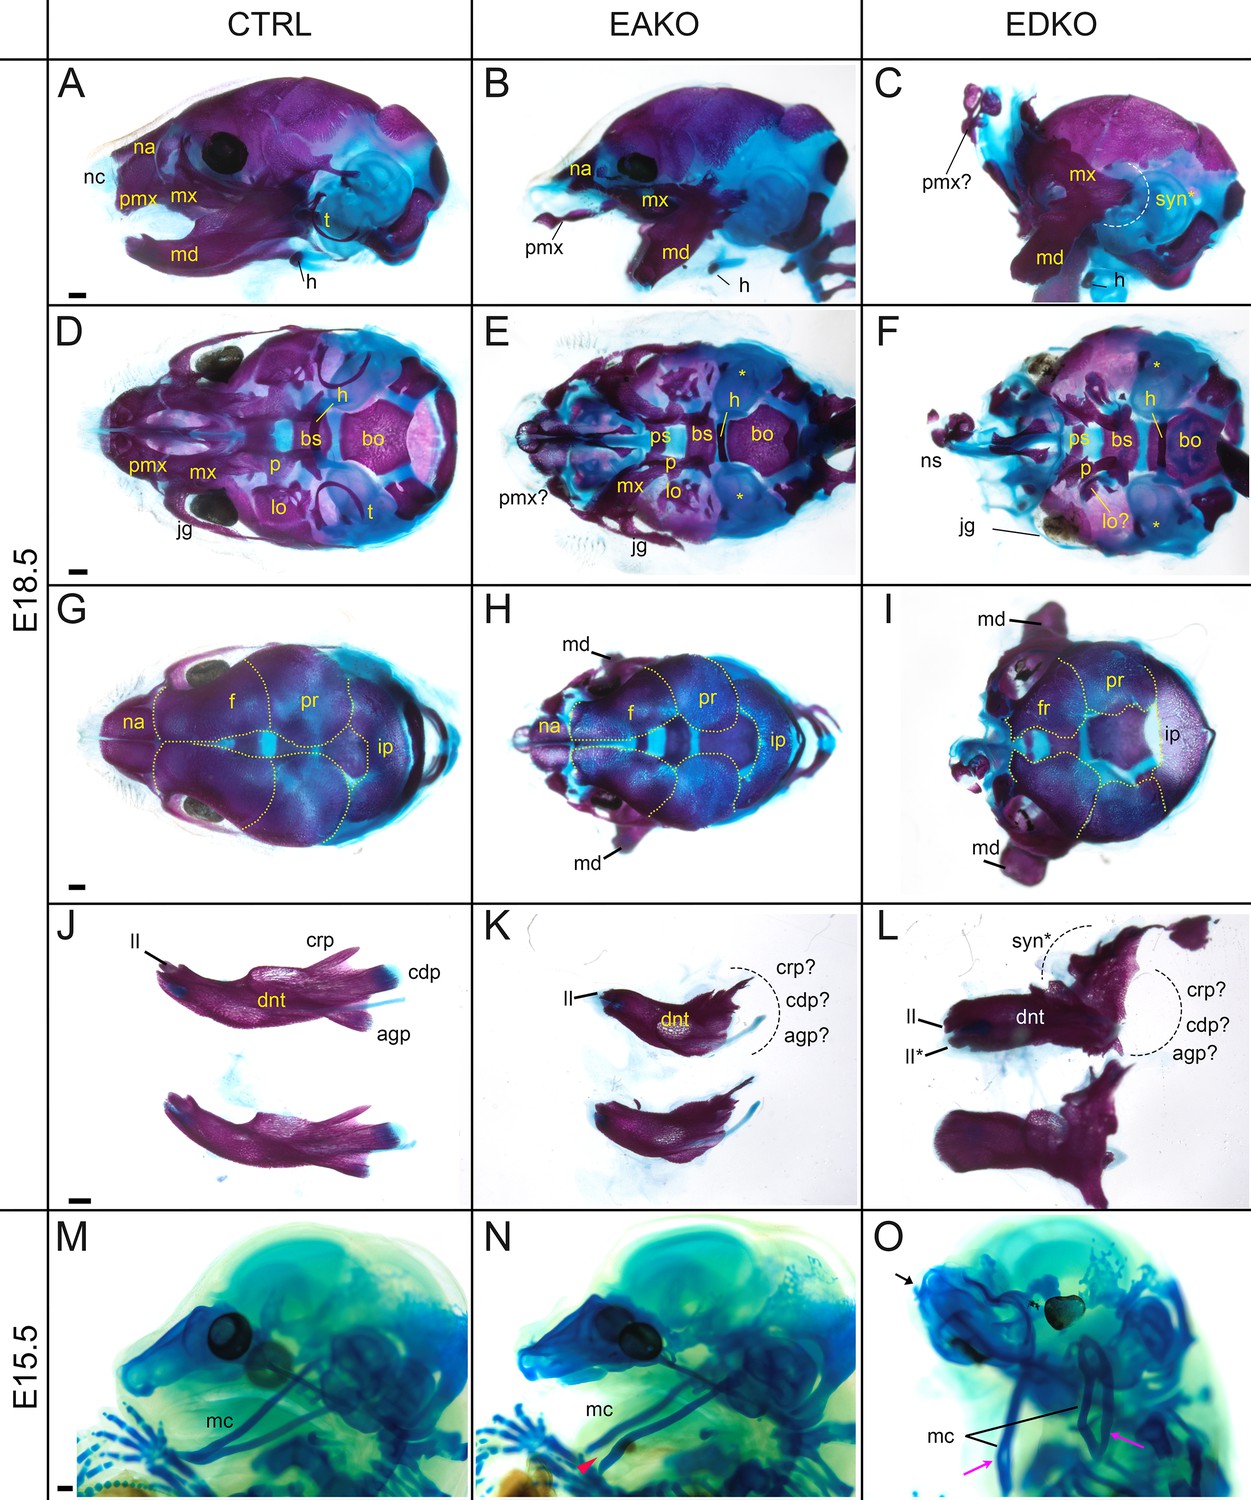
Craniofacial skeleton and chondrocranium defects vary with Tfap2 gene dosage.
(A–L) E18.5 alizarin red and alcian blue stained craniofacial elements. Lateral (A–C), ventral (D–F), dorsal (G–I) views of the craniofacial skeleton, and lateral views of the left and right hemi-mandibles in isolation (J–L) in control (A, D, G, J), EAKO (B, E, H, K), and EDKO (C, F, I, L) embryos. Note that the mandibles have been removed in (D–F) for clearer visualization of the cranial base, and the calvaria are outlined with yellow dashed lines in (G–I). The white dashed line in (C) highlights fusion of the upper and lower jaw (syngnathia), also indicated by the black dashed lines in (L). (M–O) E15.5 alcian blue stained chondrocraniums from a control (M), EAKO (N), or EDKO (O) embryo. A cleft Meckel’s cartilage is highlighted by the red arrowhead in (N) or by black lines in (O). Note, Meckel’s cartilage is also duplicated (pink arrows) along the proximodistal axis of the lower jaw in (O) and upturned nasal cartilages are highlighted by the black arrow. Abbreviations: agp, angular process; bs, basisphenoid; bo, basioccipital; cdp, condylar process; crp, coronoid process; dnt, dentary; f, frontal; h, hyoid; ii, inferior incisor; ii*, duplicated incisor; ip, interparietal; jg, jugal; lo, lamina obturans; mc, Meckel’s cartilage; md, mandible; mx, maxillary; na, nasal; nc, nasal cartilage; ns, nasal septum; p, palatine; pmx, premaxillary; pr, parietal; ps, presphenoid; syn*, syngnathia; t, tympanic ring;? indicates possible identity of dysmorphic structure; * in (E, F) indicates missing tympanic ring. Ctrl embryos are Tfap2aflox/+; Tfap2bflox/+, EAKO embryos are Crect; Tfap2aflox/null; Tfap2bflox/+, and EDKO embryos are Crect; Tfap2aflox/null; Tfap2bflox/null. A minimum of at least three cranial skeletons per genotype were examined. Scale bar = 500 µM.
Figure 7 with 3 supplements
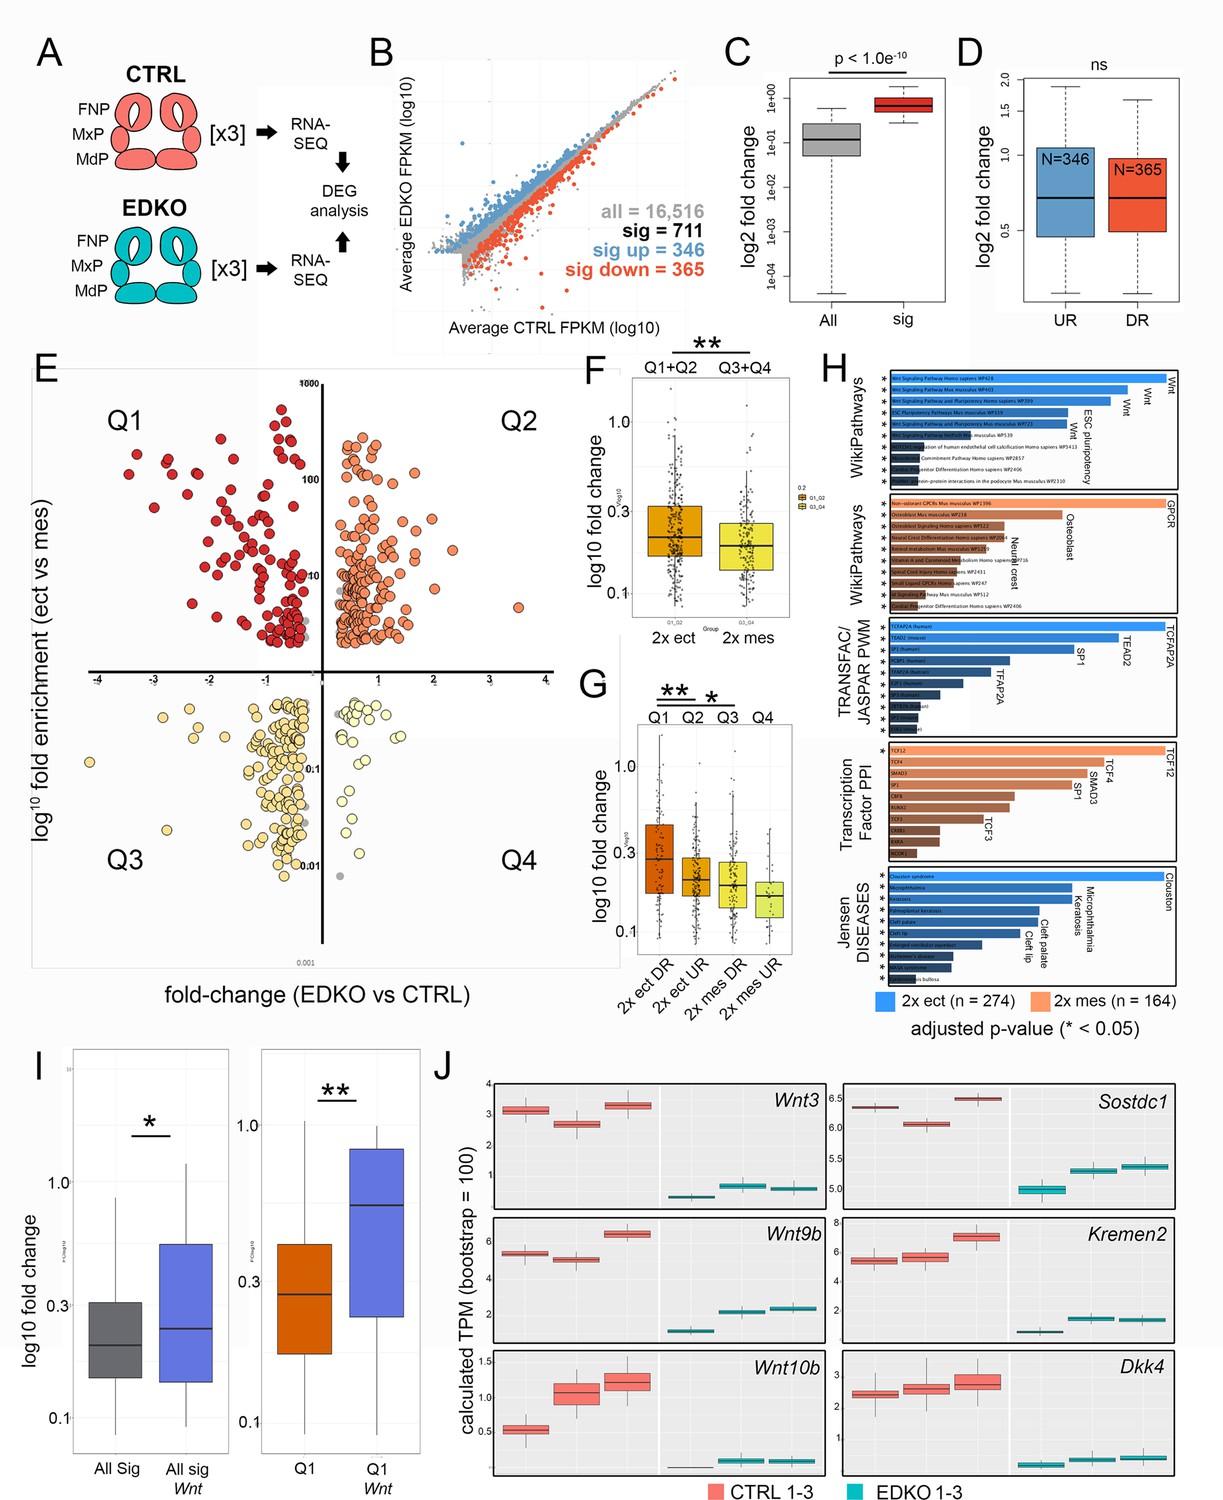
RNA-seq analysis of E10.5 control and EDKO mutant craniofacial prominences.
(A) Schematic depicting regions isolated and general workflow for RNA-seq analysis. (B) Scatterplot of gene mean expression values (FPKM) for control (X-axis) and EDKO mutant (Y-axis) samples, blue or orange dots representing genes significantly upregulated or down-regulated in mutants versus controls, respectively. (C) Boxplot of mean fold-change values (mutant versus control) for all expressed genes (grey) or those that were significantly altered (red). (D) Boxplot of mean gene expression fold-change values (mutant versus control) for down-regulated (orange) or up-regulated (blue) genes. (E) Scatterplot of mean gene expression fold-change between mutant and control samples (X-axis) and mean gene expression fold-change between craniofacial ectoderm and mesenchyme (Y-axis). (F) Boxplot of mean gene expression fold-change values (mutant versus control) for ‘ectoderm enriched’ (orange) or ‘mesenchyme enriched’ (yellow) genes. (G) As in (F) but further subset into each quadrant. (H) Gene-set enrichment analysis (using ENRICHR) for ‘AP-2-dependent’ ectoderm (blue) or mesenchyme (orange) enriched genes. (I) Boxplots of mean gene expression fold-change values (mutant versus control) for all significantly altered genes (grey) versus those found specifically in the WNT-pathway (blue) or all significantly down-regulated ectoderm genes (Q1 genes, red) versus WNT-pathway associated genes down-regulated in the ectoderm (Q1 Wnt, blue). (J) RNA-seq based, computed gene expression values (TPM) for a subset of WNT-related genes, shown as biological triplicates in control (salmon) or EDKO mutant (teal). For all boxplots, the median is indicated by the horizontal line, 75th and 25th percentiles by the limits of the box, and the largest or smallest value within 1.5 times the interquartile range by the lines. A standard two-tailed t-test was conducted to calculate significance in C, D, F, G, and I (* = p-value < 0.05; ** = p-value < 0.005). Abbreviations: DEG, differentially expressed genes; DR, down-regulated; FNP, nasal processes; MdP, mandibular prominence; MxP, maxillary prominence; ns, not significant; TPM, transcripts per million; UR, up-regulated. Samples used for RNA-seq analysis included, 2 Tfap2aflox/+; Tfap2bflox/+ and 1 Tfap2aflox/+; Tfap2bflox/null control embryos and 3 Crect; Tfap2aflox/null; Tfap2bflox/null EDKO embryos.
Figure 7—figure supplement 1
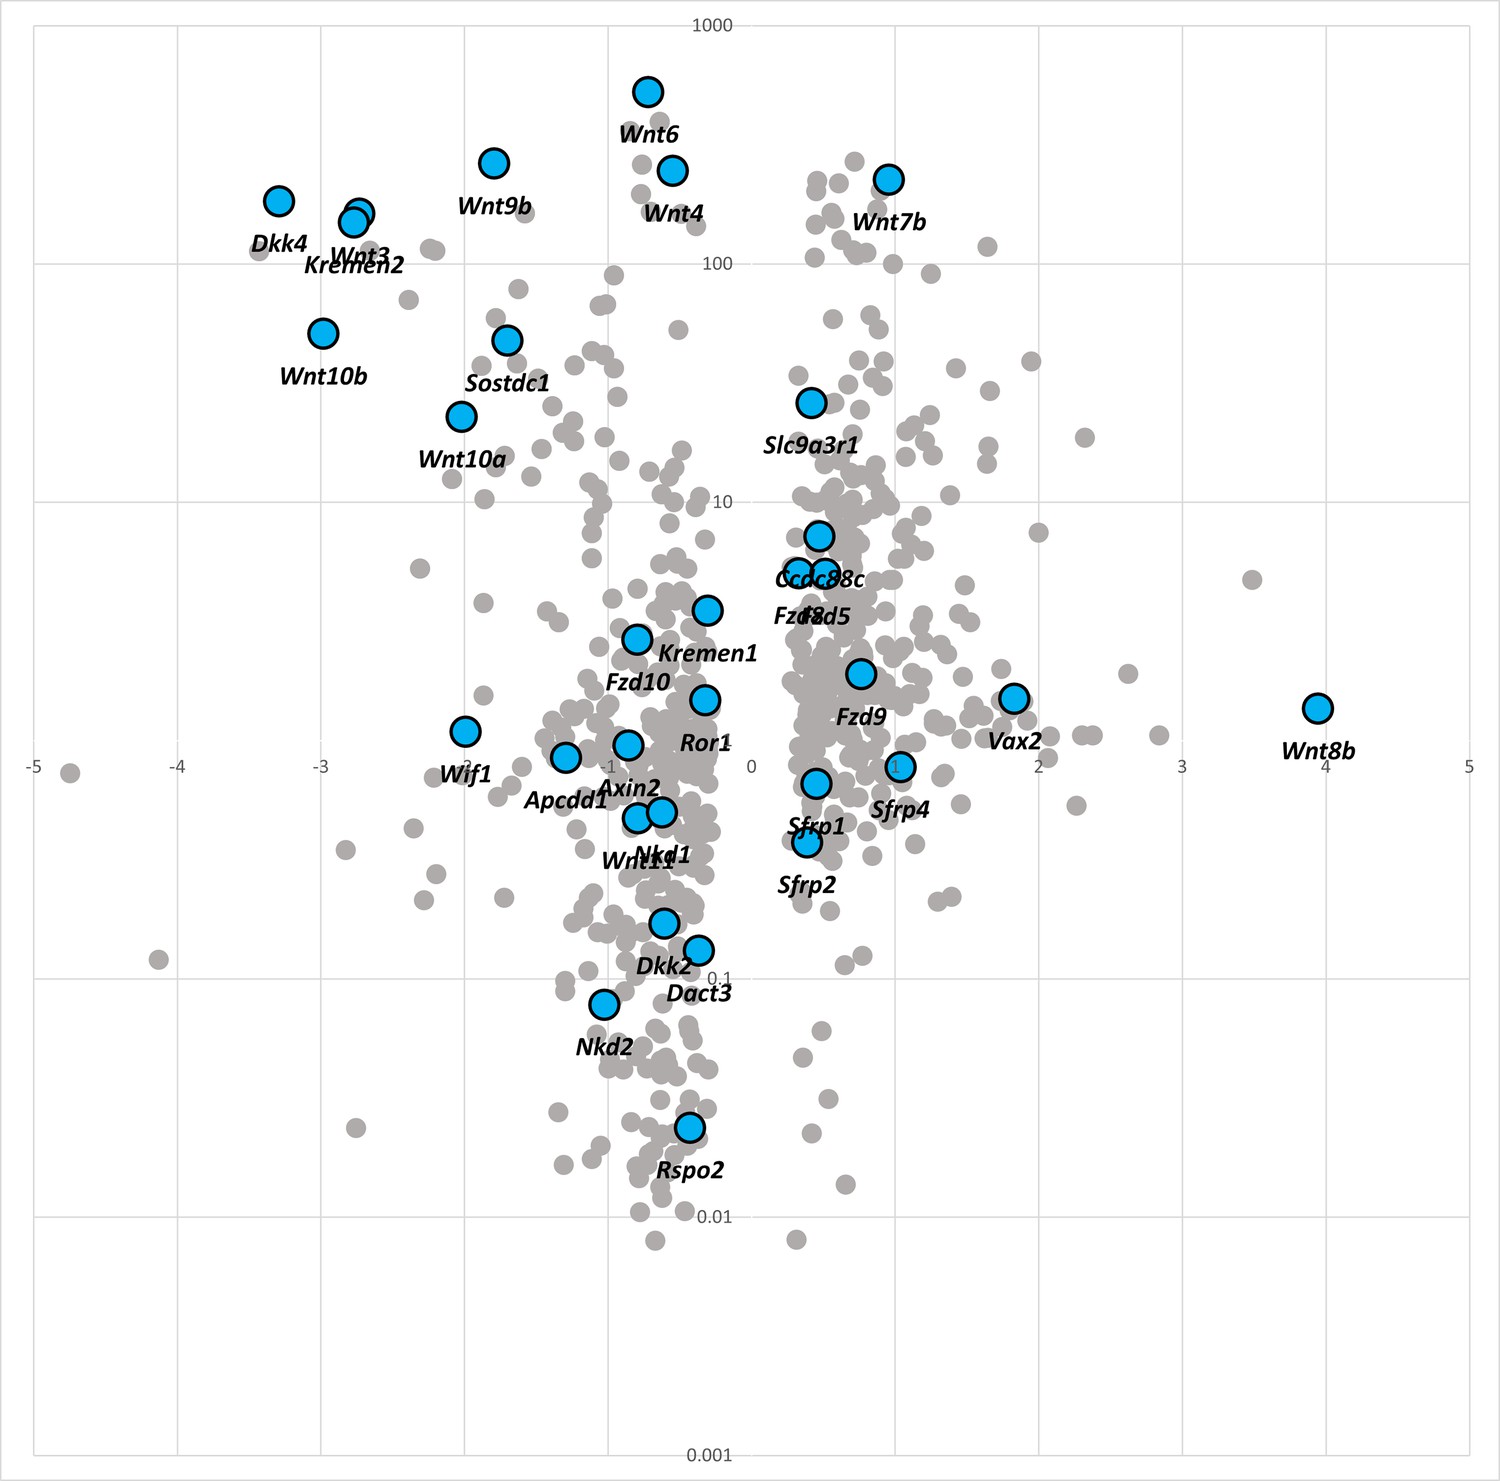
Scatterplot as described for Figure 7E.
Briefly, the plot highlights gene expression changes (X-axis) in the facial prominences of EDKO (α/ßCRECT) versus control (CTRL) samples. Genes are further stratified based on their given enrichment in the surface ectoderm versus mesenchyme (Y-axis) in a control embryo. All WNT-pathway components (as defined by DAVID pathway analysis) have been labeled sky-blue.
Figure 7—figure supplement 2
Real-time RT-PCR (A, D, G) or in situ hybridization (B, C, E, F) of various Wnt pathway components in E10.5 control (ctrl), EAKO, or EDKO embryos.
cDNA for real-time PCR was generated from RNA collected from either the medial and lateral nasal prominences or the combined MxP and MnP portions of the face as diagrammed, from the given genotype. The boxplots represent technical triplicates from a single embryo.
In situ hybridization images show a representative E10.5 embryo in a lateral view of the head.
Figure 7—figure supplement 3

Bar-charts summarizing real-time RT-PCR analysis of cDNA generated from RNA collected from E11.5 craniofacial mesenchyme of a control or EDKO sample.
Relative expression (normalized to B2m) is shown for Wif1, Dkk2, Kremen1, Dvl2, and Nkd1. Experiments were done with biological duplicates, and technical triplicates.
Figure 8 with 1 supplement

Genetic interaction between Tfap2 and the Wnt pathway.
(A–C) Lateral views of E10.5 β-galactosidase stained control (A), EAKO (B) and EDKO (C) embryos harboring the Axin2-lacZ reporter allele. The black arrow marks the position of the hinge region. (D) Schematic of genetic cross used to elevate Wnt1 expression levels in control, EAKO, or EDKO mutant embryos. (E–G) Ventral craniofacial view of E13.5 EAKO mutants that lack (E) or contain (F, G) the Wnt1 over-expression allele. The blue chevrons indicate the bilateral cleft present in (E). The white arrow indicates the lack of lens development previously noted from an excess of WNT signaling (Smith et al., 2005). (H–J) Ventral craniofacial view of E13.5 EDKO mutants that lack (H) or contain (I, J) the Wnt1 over-expression allele. Abbreviations: BA2, branchial arch 2; e, eye; md, mandibular prominence; mx, maxillary prominence; n, nasal pit. In A-C, in addition to being Axin2-lacZ+, Ctrl embryos are Tfap2aflox/+; Tfap2bflox/+, EAKO embryos are Crect; Tfap2aflox/null; Tfap2bflox/+, and EDKO embryos are Crect; Tfap2aflox/null; Tfap2bflox/null (n = 3/genotype).
Figure 8—figure supplement 1
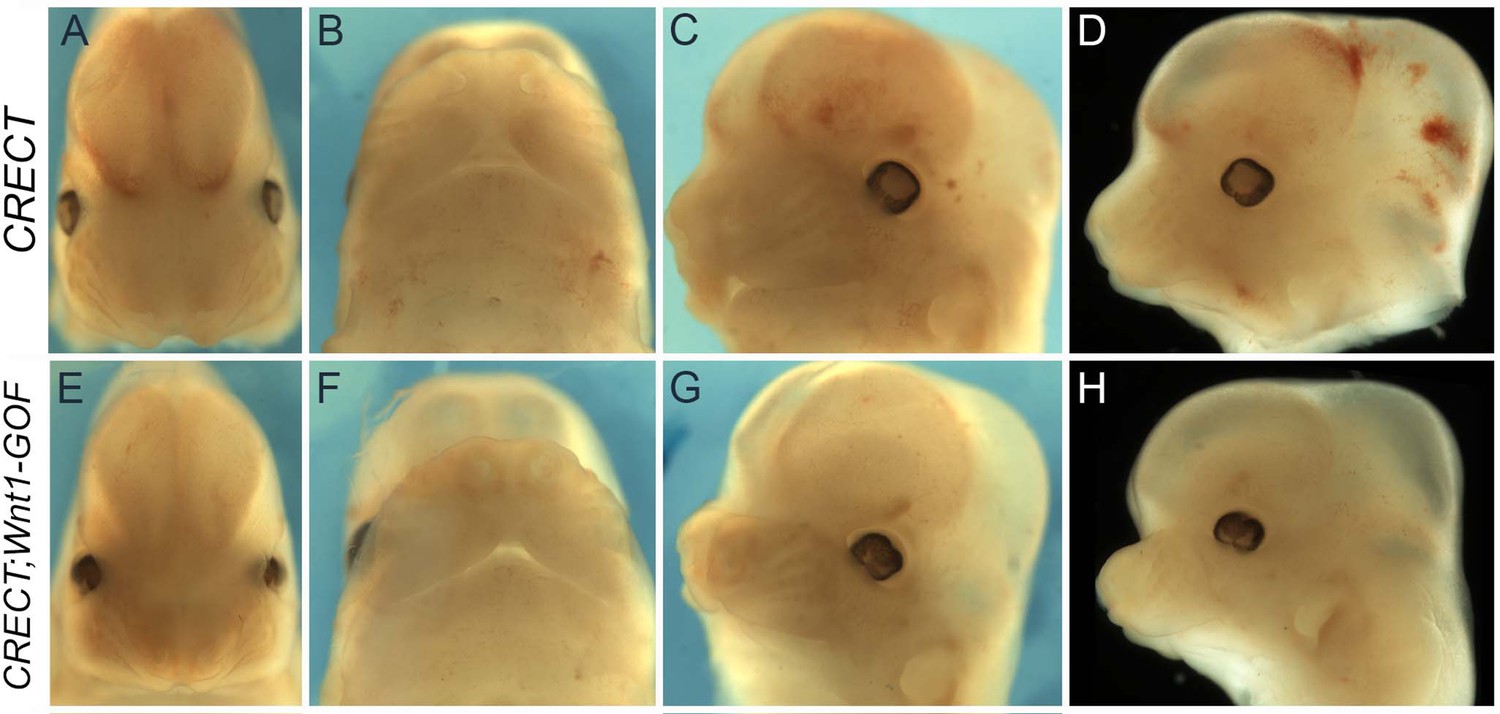
Morphological changes associated with CRECT-mediated Wnt1 over-expression.
(A–H) Gross morphological phenotypes of E12.5 control (i.e. Crect+) (A–D) or Crect Wnt1OX embryos (E–H). Heads are shown in either a top-down (A, E), ventral (B, F), or lateral, anterior to the left (C, D, G, H) view.
Tables
Table 1
Curated list of differentially expressed genes identified in E10.5 EDKO facial prominences vs control facial prominences, with the presence or absence of associated ATAC-seq peaks based on GREAT.
| Gene category | Gene | Average expression in control | Average expression in mutant | Fold changeMutant vs Control | AP-2 dependentATAC-seq peak |
|---|---|---|---|---|---|
| Epithelial Development and Function | Krt5 | 3.25 | 0.52 | 0.16 | Yes |
| Bnc1 | 2.46 | 0.50 | 0.20 | No | |
| Krt15 | 3.74 | 0.81 | 0.22 | Yes | |
| Tgm1 | 0.82 | 0.23 | 0.28 | No | |
| Hr | 0.63 | 0.27 | 0.43 | No | |
| Nectin4 | 2.73 | 1.40 | 0.51 | No | |
| Krt14 | 11.40 | 6.36 | 0.56 | Yes | |
| Perp | 16.49 | 9.72 | 0.59 | Yes | |
| Grhl3 | 4.45 | 2.61 | 0.59 | Yes | |
| Trp63 | 11.09 | 7.12 | 0.64 | Yes | |
| Krt8 | 26.20 | 39.97 | 1.53 | Yes | |
| Krt18 | 33.05 | 53.98 | 1.63 | No | |
| Epithelial Junction Complexes | Gjb6 | 1.48 | 0.40 | 0.27 | Yes |
| Gjb2 | 2.65 | 0.86 | 0.32 | Yes | |
| Gjb3 | 1.86 | 0.63 | 0.34 | No | |
| Col17a1 | 0.74 | 0.26 | 0.35 | Yes | |
| Tns4 | 1.05 | 0.48 | 0.48 | No | |
| Periderm | Gabrp | 1.23 | 0.03 | 0.02 | No |
| Zfp750 | 0.85 | 0.18 | 0.21 | Yes | |
| Rhov | 0.73 | 0.17 | 0.23 | No | |
| Krt19 | 6.93 | 12.96 | 1.87 | Yes | |
| Signaling | Dkk4 | 1.96 | 0.20 | 0.10 | Yes |
| Wnt10b | 0.84 | 0.11 | 0.13 | Yes | |
| Kremen2 | 3.98 | 0.58 | 0.15 | No | |
| Wnt3 | 2.09 | 0.31 | 0.15 | Yes | |
| Cxcl14 | 18.02 | 3.45 | 0.19 | Yes | |
| Wnt10a | 0.48 | 0.12 | 0.25 | Yes | |
| Wif1 | 1.94 | 0.49 | 0.25 | Yes | |
| Wnt9b | 3.86 | 1.12 | 0.29 | Yes | |
| Sostdc1 | 8.95 | 2.76 | 0.31 | Yes | |
| Cxcl13 | 6.55 | 2.65 | 0.40 | No | |
| Ednra | 15.93 | 9.44 | 0.59 | No | |
| Dll1 | 8.96 | 13.88 | 1.55 | Yes | |
| Fgfr3 | 5.10 | 10.10 | 1.98 | Yes | |
| Transcription factors | Foxi2 | 1.38 | 0.02 | 0.01 | Yes |
| Irx4 | 1.67 | 0.15 | 0.09 | Yes | |
| Gbx2 | 4.06 | 0.60 | 0.15 | Yes | |
| Osr2 | 3.34 | 0.83 | 0.25 | No | |
| Irx2 | 4.02 | 1.17 | 0.29 | Yes | |
| Lmx1b | 2.75 | 1.05 | 0.38 | Yes | |
| Twist2 | 29.64 | 13.73 | 0.46 | No | |
| Vgll3 | 2.15 | 1.01 | 0.47 | Yes | |
| Hand1 | 11.26 | 5.36 | 0.48 | Yes | |
| Irx5 | 8.40 | 4.03 | 0.48 | Yes | |
| Twist1 | 135.74 | 79.38 | 0.58 | No | |
| Msx1 | 102.04 | 61.27 | 0.60 | Yes | |
| Sox21 | 4.56 | 7.94 | 1.74 | No | |
| Pax6 | 9.36 | 29.27 | 3.13 | Yes | |
| Other | Ass1 | 2.26 | 1.30 | 0.58 | No |
| Hapln1 | 8.59 | 5.07 | 0.59 | Yes | |
| Smoc2 | 6.72 | 2.22 | 0.33 | Yes | |
| Cdkn1a | 8.46 | 15.22 | 1.80 | No | |
| Tagln | 6.85 | 13.35 | 1.95 | No | |
| Lin28a | 9.29 | 20.20 | 2.17 | No |
Key resources table
| Reagent type (species) or resource | Designation | Source or reference | Identifiers | Additional information |
|---|---|---|---|---|
| Genetic reagent (Mus musculus) | Tfap2atm1Will | Zhang et al., 1996 | Tfap2a null allele | In-house |
| Genetic reagent (Mus musculus) | Tfap2atm2Will/J | Brewer et al., 2004 | Tfap2a conditional allele | In-house |
| Genetic reagent (Mus musculus) | Tfap2btm1Will | Martino et al., 2016; Van Otterloo et al., 2018 | Tfap2b null allele | In-house |
| Genetic reagent (Mus musculus) | Tfap2btm2Will | Martino et al., 2016; Van Otterloo et al., 2018 | Tfap2b conditional allele | In-house |
| Genetic reagent (Mus musculus) | Crect | Schock et al., 2017 | Crect transgene allele | In-house; Cre-driver line with Cre driven by a Tfap2a intronic enhancer |
| Genetic reagent (Mus musculus) | B6.129P2-Axin2tm1Wbm/J | Lustig et al., 2002 | Axin2lacZ | Obtained from Jackson Laboratory |
| Genetic reagent (Mus musculus) | Gt(ROSA)26Sortm2(Wnt1/Gfp)Amc/J | Carroll et al., 2005 | Wnt1Ox | Obtained from Jackson Laboratory |
| Genetic reagent (Mus musculus) | Gt(ROSA)26Sortm1Sor | Soriano, 1999 | r26r | Obtained from Jackson Laboratory |
| Genetic reagent (Mus musculus) | Gt(ROSA)26Sortm4(ACTB-tdTomato,-EGFP)Luo/J | Muzumdar et al., 2007 | mT/mG | Obtained from Jackson Laboratory |
| Antibody | anti-H3K4Me3 (Rabbit, monoclonal) | Millipore, cat. #04–745 | 2.5 µL/ChIP | |
| Antibody | anti-p-Histone H3 (Rabbit, polyclonal) | sc-8656-R, Santa Cruz Biotechnology | 1:250 dilution | |
| Software, algorithm | NGmerge | Gaspar, 2018 | Read trimming | |
| Software, algorithm | Bowtie2 | Langmead et al., 2009 | Mapping | |
| Software, algorithm | Samtools | Li et al., 2009 | Format conversion | |
| Software, algorithm | Genrich (v0.5) | https://github.com/jsh58/Genrich, Gaspar, 2022 | RRID:SCR_002630 | ATAC-seq peak calling |
| Software, algorithm | Picard (v2.19) | http://broadinstitute.github.io/picard | RRID:SCR_006525 | Duplicate removal |
| Software, algorithm | deepTools | Ramírez et al., 2016 | Read normalization/ visualization | |
| Software, algorithm | GREAT algorithm (v4) | McLean et al., 2010 | Pathway enrichment | |
| Software, algorithm | HOMER | Heinz et al., 2010 | Motif enrichment | |
| Software, algorithm | Trim Galore! | Babraham Bioinformatics, Babraham Institute, Cambridge, UK | Read trimming | |
| Software, algorithm | HISAT2 | Pertea et al., 2016 | Read mapping | |
| Software, algorithm | StringTie | Pertea et al., 2016 | RNA expression quantification | |
| Software, algorithm | CuffDiff2 | Trapnell et al., 2012 | Differential gene expression | |
| Software, algorithm | kallisto | Bray et al., 2016 | RNA expression quantification | |
| Software, algorithm | sleuth | Pimentel et al., 2017 | Differential gene expression and visualization |
Additional files
-
Supplementary file 1
Summary of gene expression values in the craniofacial surface ectoderm versus the facial mesenchyme of wild-type E11.5 mouse embryos and the association of these genes with the ATAC-seq elements identified in Figure 2E, the promoter distal peaks (used for cumulative distribution plotting).
- https://cdn.elifesciences.org/articles/70511/elife-70511-supp1-v2.xlsx
-
Supplementary file 2
Summary of ATAC-seq element gene association for the AP-2 dependent peaks.
For each gene, the total number of elements (both promoter proximal and distal) and genomic location of each element, relative to the transcriptional start site, are indicated.
- https://cdn.elifesciences.org/articles/70511/elife-70511-supp2-v2.xlsx
-
Supplementary file 3
Gene expression summary for E10.5 RNA-seq analysis of control and EDKO facial prominence samples.
Note, each tab of the spreadsheet contains a subset of the larger dataset that was used for further analysis.
- https://cdn.elifesciences.org/articles/70511/elife-70511-supp3-v2.xlsx
-
Supplementary file 4
Summary of primers used for the current study.
- https://cdn.elifesciences.org/articles/70511/elife-70511-supp4-v2.xlsx
-
Transparent reporting form
- https://cdn.elifesciences.org/articles/70511/elife-70511-transrepform1-v2.docx
Download links
A two-part list of links to download the article, or parts of the article, in various formats.
Downloads (link to download the article as PDF)
Open citations (links to open the citations from this article in various online reference manager services)
Cite this article (links to download the citations from this article in formats compatible with various reference manager tools)
AP-2α and AP-2β cooperatively function in the craniofacial surface ectoderm to regulate chromatin and gene expression dynamics during facial development
eLife 11:e70511.
https://doi.org/10.7554/eLife.70511


