Analyzing the brainstem circuits for respiratory chemosensitivity in freely moving mice
Abstract
Regulation of systemic PCO2 is a life-preserving homeostatic mechanism. In the medulla oblongata, the retrotrapezoid nucleus (RTN) and rostral medullary Raphe are proposed as CO2 chemosensory nuclei mediating adaptive respiratory changes. Hypercapnia also induces active expiration, an adaptive change thought to be controlled by the lateral parafacial region (pFL). Here, we use GCaMP6 expression and head-mounted mini-microscopes to image Ca2+ activity in these nuclei in awake adult mice during hypercapnia. Activity in the pFL supports its role as a homogenous neuronal population that drives active expiration. Our data show that chemosensory responses in the RTN and Raphe differ in their temporal characteristics and sensitivity to CO2, raising the possibility these nuclei act in a coordinated way to generate adaptive ventilatory responses to hypercapnia. Our analysis revises the understanding of chemosensory control in awake adult mouse and paves the way to understanding how breathing is coordinated with complex non-ventilatory behaviours.
Editor's evaluation
This paper presents a novel application of endoscopic imaging with miniscopes in awake-behaving mice to address the important problem of analyzing multicellular activity by calcium activity imaging within circumscribed regions of the medulla oblongata that are proposed to have chemosensory functions for the homeostatic regulation of breathing in response to elevated systemic CO2 (hypercapnia). The authors importantly demonstrate chemosensory responses of neurons in the retrotrapezoid nucleus-RTN, Raphe magnus and pallidus nuclei, and lateral parafacial region- pFL, and they describe regional heterogeneity of cellular responses to hypercapnia in these regions with important functional implications. Analyzing chemosensory properties of these medullary regions has been the focus of numerous studies, but the problem of analyzing regional multicellular chemosensory responses in the awake freely behaving rodent has not been previously addressed, so this paper represents an advance for the field. The authors present a novel catalog of neuronal responses, and they illustrate the feasibility of this imaging approach, paving the way for further development/application of this approach, while indicating its limitations.
https://doi.org/10.7554/eLife.70671.sa0Introduction
The precise control of breathing is fundamental to the survival of all terrestrial vertebrates. Breathing fulfils two essential functions: provision of oxygen to support metabolism; and removal of the metabolic by-product, CO2. Rapid and regulated removal of CO2 is essential because its over-accumulation in blood will result in death from the consequent drop in pH. Understanding of the complexity of the brain microcircuit regulating CO2 and pH remains incomplete. Whilst the primacy of the ventral medulla surface (VMS) in central chemoreception was described almost 60 years ago, this region contains multiple chemosensory nuclei that are candidates to mediate adaptive control of breathing (Nattie and Li, 1994; Richerson, 1995). This has led to the idea that central chemosensitivity is mediated by a network of chemosensory nuclei distributed throughout the brainstem and extending as far as the limbic system (Huckstepp and Dale, 2011b). Furthermore, there are multiple phenotypes of neurons within single chemosensory nuclei (Huckstepp et al., 2018; Iceman et al., 2014; Iceman and Harris, 2014; Johansen et al., 2015), and even within previously well-defined subpopulations of neurons (Shi et al., 2017; Stornetta et al., 2009).
Recently, brain imaging techniques have been developed to allow recording of activity of defined cell populations in awake, freely moving animals even in deep brain structures such as the hypothalamus (Ziv and Ghosh, 2015). These methods require: the expression of genetically encoded Ca2+ indicators such as GCaMP6 in the relevant neurons; the implantation of gradient refractive index (GRIN) lenses at the correct stereotaxic position; and a head-mounted mini-epifluorescence microscope to enable image acquisition during the free behaviour of the mouse. We have now adapted these methods to enable recording of defined neuronal populations in the rostral medulla oblongata of mice to analyze the chemosensory control of breathing.
In this paper, we study the activity of neurons in the retrotrapezoid nucleus (RTN) (Mulkey et al., 2004; Nattie and Li, 1994; Ramanantsoa et al., 2011) and the rostral medullary raphe (Bradley et al., 2002; Ray et al., 2011; Richerson, 1995). Evidence strongly favours their involvement in the central chemosensory response, but thorough understanding as to how these nuclei contribute to central chemosensitivity has been hampered by the inability to record the activity of their constituent cells in awake freely behaving adult rodents. Instead, neuronal recordings have been made from young (<14 d) or adult rodents under anaesthesia. Both of these methods have significant drawbacks -the chemosensory control of breathing matures postnatally; and anaesthesia is known to depress the activity of respiratory neurons and reconfigure the circuit.
We also assess the contribution of the lateral parafacial region (pFL) to an often-overlooked aspect of the hypercapnic ventilatory response, active expiration. During resting eupneic breathing, there is little active expiration instead the expiratory step involves elastic rebound of the respiratory muscles to push air out of the lungs. However, when the intensity of breathing is increased for example during exercise or hypercapnia, active expiration (recruitment of abdominal muscles to push air out of the lungs) occurs. Mounting evidence suggests the pFL may contain the expiratory oscillator and that neurons in this nucleus are recruited to evoke active expiration (Huckstepp et al., 2015; Huckstepp et al., 2016; Pagliardini et al., 2011). Nevertheless, the key step of recording activity of these neurons in awake behaving animals and linking it to active expiration has not been achieved.
Our data show the pFL did not undergo sustained activation during hypercapnia, but instead contributed to acute transient high amplitude expiratory events. We found that neurons in the RTN and Raphe exhibited a range of responses to hypercapnia. Many RTN neurons exhibited fast adapting responses. This response type was less common in the Raphe, and many Raphe neurons exhibited a slower graded response. Our data are consistent with a tiered chemosensory network, with the RTN and Raphe responsible for detecting different aspects of the hypercapnic stimulus. These novel findings illuminate the fundamental functional components of chemosensory nuclei and show that neuronal responses to hypercapnia are considerably more complex than anticipated.
Results
Optical characteristics of the recording system
The GRIN lens has a diameter of 600 µm with a focal plane ~300 µm below the lens (Jennings et al., 2015; Resendez et al., 2016). However, the focal plane varies depending upon the distance between the camera and GRIN lens, which can be altered via a manual turret adjustment to optimise the focus on fluorescent cells. To document the range of focal plane depth in our system, we imaged fluorescent beads entrapped in agarose under two conditions: the turret at its lowest (i.e. camera is against the end of the GRIN lens, and the focal plane is at its closest to the lens) and its maximum setting (i.e. the camera is as far from the end of the GRIN lens as it can be, and the focal plane is at its deepest relative to the lens) (Figure 1—figure supplement 1). The focal depth (in which the beads were sharply focussed) was 100 µm at any single setting and the full focal plane ranged from 150 to 450 µm below the end of the lens as the turret moved from its lowest to highest setting. The turret setting is given in all figure legends.
Inclusion/exclusion criteria for cells in the study
Following assessment for inclusion/exclusion criteria, data from 18 mice comprising recordings from 194 cells were included for analysis (Figure 1A). As the mice were unrestrained and able to move freely during the recordings, to visualize physical movements during Ca2+ analysis high-definition videos of mice were synchronized to the simultaneous plethysmograph and Inscopix Ca2+ imaging recordings in Inscopix Data Processing Software and Spike2. Our recordings are performed at a single wavelength (Figure 1B). Therefore, it was essential to verify that any signals result from changes in Ca2+ rather than from movement artefacts.

Experimental approach and movement artefact.
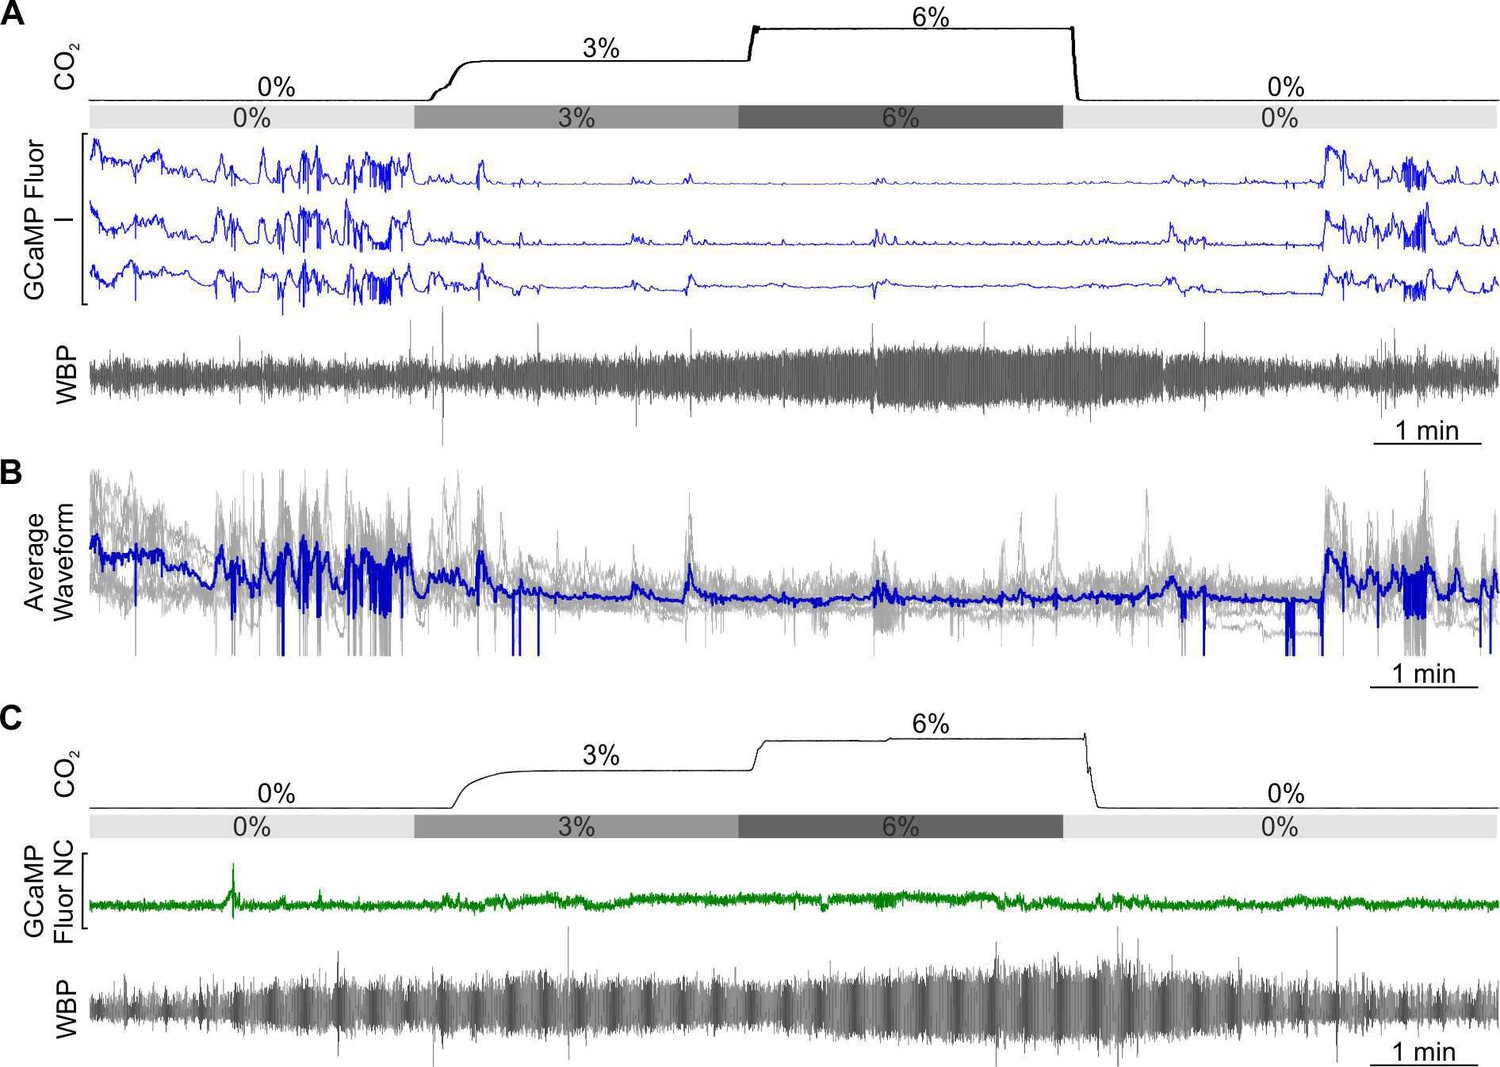
(A) A CONSORT flow diagram for inclusion/exclusion of experiments and cells from the study. (B) Representation of GRIN lens (microendoscope), baseplate, and mini epifluorescence camera placement for recording of brainstem nuclei. (C–D) GFP control. RTN neurons were transduced with AAV-Syn-GFP (not Ca2+ sensitive) and GRIN lens implanted. Fluorescence was recorded going from 0 to 6% inspired CO2 (gray bar). WBP: whole body plethysmography trace showing breathing movements. No signals are seen that resemble the Ca2+ transients observed with GCaMP6. (E) Comparison of Ca2+ fluorescence signals observed with GCaMP6 versus movement from WBP trace (WBP sonogram) and head movement as observed from video recording (Mov sonogram). In expanded traces- a,b, Examples of lack of fluorescence signal during movement of head/body; c,f, examples of fluorescence signal in the absence of movement; d,e, examples of fluorescence signals during movement. (Scalebar- 20 μm) (F) Seizures caused increase in activity of RTN neurons that was corelated with changes in breathing in anaesthetized mouse. Changes in mouse WBP before and after induction of non-behavioural seizures with intraperitoneal injection of kainic acid time matched with the activity of RTN neurons (red). The dotted square is changes in activity of neurons (ROIs) time matched with WBP and expanded in panel G. (G) Increase in the activity of RTN neurons correlated with changes in breathing. The start of the GCaMP6 transient is shown by the dotted line. Ca2+ transients with a fast rise and exponential fall (pink traces); and slower sustained changes (turquoise traces).
We examined the origins of the changes in fluorescence in three ways. Firstly, we transduced RTN neurons of three mice with AAV-syn-GFP and performed imaging during a hypercapnic challenge (Figure 1C–D, Figure 1—video 1). This allowed measurement of comparable levels of fluorescence to GCaMP6 to determine whether movement by itself, in the absence of any Ca2+ reporter activity, could generate confounding fluorescent signals. Analysis of changes in fluorescence showed only small amplitude (often negative-going) fluctuations. In no case did we observe large increases in fluorescence of the type we routinely observed when GCaMP6 was expressed (e.g. Figure 1E), suggesting that movement per se cannot give fluorescence signals that resemble Ca2+ signals.
Secondly, we analyzed the movement of the mouse simultaneously with the Ca2+ recordings (Figure 1E) via two methods. The first was to analyze the headmount movements in the video recordings of the mouse in the plethysmography chamber using AnyMaze tracking software and convert these movements into a colour coded sonogram. The brighter colours in the sonogram indicate headmount movement. The second method analyzed the large excursions on the whole body plethysmography (WBP) trace. These arise artefactually from movement. Comparison of the sonogram based on the WBP trace (WBP Sonogram) and that based on head movement (Mov Sonogram) showed that the two measures correlated well and that large excursions of the WBP trace often coincided with head movement (compare sonograms in Figure 1E). When we examined the GCaMP6 fluorescence in conjunction with the sonograms of head and body movement, we observed that: (i) large movements of the head/body did not evoke noticeable changes in GCaMP6 fluorescence (Figure 1Ea,b); (ii) GCaMP6 Ca2+ signals characterized by a fast rise and exponential decay occurred in the absence of any movement (Figure 1Ec,f); and (iii) similar shaped Ca2+ signals occurred during movement (Figure 1Ed,e). Together this suggests that movement of the head or body of the animal does not prevent the recording of genuine changes in GCaMP6 fluorescence related to changes in intracellular Ca2+.
Thirdly, we used the same paradigm of stimulation for all experiments as can be seen from the records in Figure 1—figure supplements 2–4. This enabled averaging of the responses aligned either to the onset of hypercapnia, or features of the WBP trace. This averaging brought out consistent features of the presumed Ca2+ signals that were temporally related to either the onset of hypercapnia or alterations of breathing. While for the most part we could not record from the same neurons in different recording sessions from the same mouse, we did observe consistent patterns of neuronal firing between recording sessions (Figure 1—figure supplement 5). As movement that could give rise to artefact would not be expected to be similar from recording session to recording session, or from mouse to mouse, the consistency of the patterns of the signals between mice and recording sessions strongly suggests a true biological rather than artefactual origin of the recorded signals.
In some cases, it was possible to identify the same neuron from recording sessions on different days in the same mouse. This was only the case in a minority of sessions perhaps because the brainstem is extracranial and more mobile and thus it is harder to reproduce the same exact focal plane between different recording sessions. When we were able to identify the same neurons their activity patterns were remarkably similar between separate recording sessions (Figure 1—figure supplement 6). This gives further confidence that the observed patterns are a reflection of biological properties.
Finally, we made recordings from anaesthetized mice (Figure 1F and Figure 4—figure supplement 1). In this case movement artefacts cannot be a potential confounding factor. To elicit neural activity, we induced electrographic seizures via intraperitoneal kainic acid injection in mice in the absence of any behavioural seizure movements such as partial (including forelimb or hindlimb) or whole body continuous clonic seizures (Figure 1—video 2). After ~70 min this resulted in perturbations of the WBP trace and correlated Ca2+ activity in the RTN neurons, presumably denoting the invasion of seizures into this nucleus. Detailed examination revealed that the fluorescence changes were of two types: (i) transients with a fast rise and exponential fall; and (ii) slower sustained changes (Figure 1G). This is an important observation as it shows that we expect to see two types of genuine Ca2+ signal in recordings from freely-moving mice: fast transients with an exponential decay phase, that may sum together and slower more gradual rises.
Movements of the visual field, evident during most recordings, were corrected for via the Inscopix motion correction software to allow ROI-based measurement of fluorescence to remain in register with the cells during the recording. Where movement artefacts persisted following motion correction, in some cases it was possible to draw additional ROIs over a high contrast area devoid of fluorescent cells, such as the border of a blood vessel. This allowed for a null signal to be subtracted from the GCaMP signal (Figure 7E) thus providing the neuronal Ca2+ transients free of movement artefact. If there was too much uncompensated motion artefact, so that we could not clearly analyze Ca2+ signals, we excluded these recordings from quantitative analysis (details given in Figure 1A). GCaMP6 signals were only accepted for categorization if the following criteria were met: (1) the features of the cell (e.g. soma, large processes) could be clearly seen; (2) they occurred in the absence of movement of the mouse or were unaffected by mouse movement; (3) fluorescence changed relative to the background; (4) the focal plane had remained constant as shown by other nonfluorescent landmarks (e.g. blood vessels). Applying these criteria left 144/194 cells eligible for study. All of the recordings that were included are shown in Figure 1—figure supplements 2–4. The activity of the cells fell into the following categories:
Inhibited (I)
Displayed spontaneous Ca2+ activity at rest, which was greatly reduced during both 3 and 6% inspired CO2 and could exhibit rebound activity following the end of the hypercapnic episode.
Excited - adapting (EA)
Silent or with low level activity at rest and showed the greatest Ca2+ activity in response to a change in 3% inspired CO2. Following an initial burst of activity, they were either silent or displayed lower level activity throughout the remainder of the hypercapnic episode. These cells often exhibited rebound activity following the end of the hypercapnic episode due to suppression by higher CO2 levels. These cells essentially encoded the beginning and end of hypercapnia.
Excited - graded (EG)
Silent or with low level activity at rest and displayed an increase in Ca2+ activity at 3% inspired CO2 with a further increase in activity at 6% that returned to baseline upon removal of the stimulus. These cells encoded the level of inspired CO2.
Tonic (T)
Displaying spontaneous Ca2+ activity throughout the recording that was unaffected by the hypercapnic episode but could provide tonic drive to the respiratory network.
Sniff-coding (Sn)
Displayed elevated Ca2+ signals correlated with exploratory sniffing.
Expiratory (Exp)
Displayed elevated Ca2+ signals correlated with large expiratory events.
Non-coding (NC)
Displayed low frequency or sporadic Ca2+ activity that was neither tonic in nature nor had any discernable activity that related to the hypercapnic stimulus or any respiratory event.
Non-coding respiratory related (NC-RR)
Displayed Ca2+ activity that did not code the hypercapnic stimulus, but it was instead related to variability in breathing frequency.
Our categorisation of neurons into these types was supported by a two-component analysis in which we plotted the change in Ca2+ activity (from baseline) elicited by 6% inspired CO2 versus the change in Ca2+ activity elicited by 3% inspired CO2. EA neurons as they showed more activity at 3% compared to 6% CO2 should cluster below the line of identity (x=y), whereas EG neurons as they respond more strongly to 6% than 3% should cluster above the line of identity. NC neurons as they did not show a response to hypercapnia should be clustered around the origin (x=y=0), and the I neurons should be clustered in the quadrant where the change in Ca2+ activity to both stimuli is negative. This analysis shows that the different classes of neurons in both the RTN and Raphe do indeed cluster in the appropriate regions of the graph (Figure 1—figure supplement 7).
Chemosensory responses in the RTN
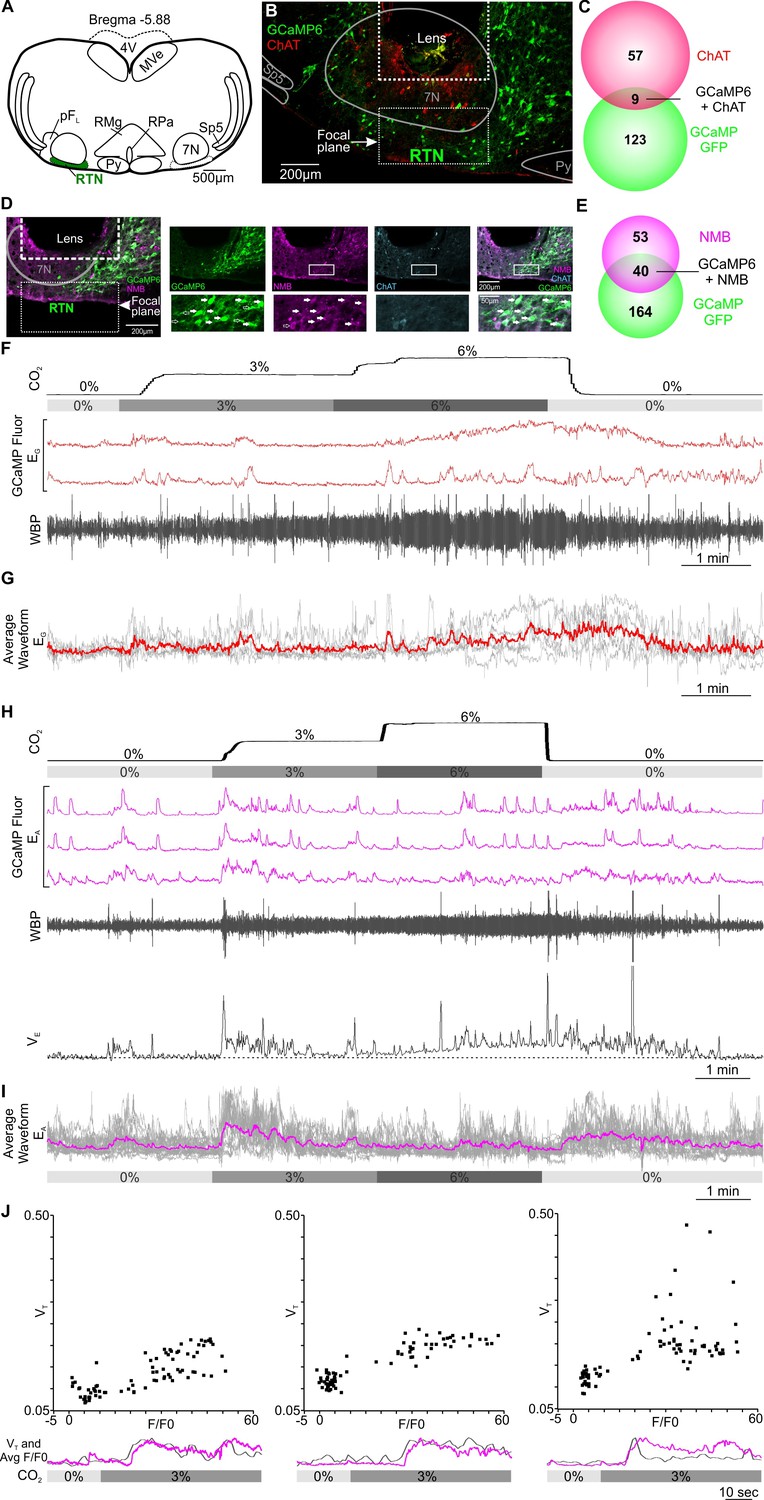
As the RTN contains chemosensitive glia and neurons (Gourine et al., 2010; Mulkey et al., 2004; Nattie and Li, 1994; Ramanantsoa et al., 2011), and is neuroanatomically diverse (Shi et al., 2017; Stornetta et al., 2009), we began by targeting all neurons of the RTN with a synapsin-GCaMP6s AAV (Figure 2A–C); a necessary step to enable their imaging during free behaviour via a mini-headmounted microscope (Figure 1B). The localization of successful and accurate transduction was confirmed posthoc by using choline acetyltransferase (ChAT) staining to define the facial nucleus and the location of the transduced cells (Figure 2B), with ~7% (9/132) of transduced neurons in the focal plane of the microscope co-labelled with ChAT (Figure 2C). The lens track terminated under the caudal pole of the facial nucleus, containing the highest number of neurons (Figure 2B), with the focal plane 150–450 µm below that, covering the dorso-ventral extent of the RTN (Figure 1—figure supplement 1). Therefore, our viral transduction and lens placement allowed us to record from the RTN. In some mice (n=3), we further checked the identity of transduced neurons by examining whether they expressed neuromedin B (NMB), a marker specific to Phox2b chemosensory neurons in the RTN (Figure 2D, Figure 2—figure supplement 2, Li et al., 2016; Shi et al., 2017). We found 43% (40/93) of NMB + cells in the RTN were also transduced with GCaMP6, and 20% (40/204) of GCaMP + neurons in the RTN were NMB+. Thus, we transduced nearly half of the NMB + neurons, and if the fluorescence imaging sampled transduced cells randomly and without bias to cell type, roughly 1 in 5 of cells recorded would have been of this phenotype.

Excitatory chemosensory responses of RTN neurons in awake mice.
(A) AAV9-Syn-GCaMP6s injection into the RTN. (B) Micrograph of lens placement and viral transduction of neurons (green) relative to the facial nucleus (ChAT +neurons red). (C) Venn diagram of cell counts of GCaMP6s transduced (green), and ChAT+ (red), neurons under the GRIN lens (1 representative section from each of 4 mice). (D) Neurons transduced with GCaMP6s also contain NMB confirming their identity as RTN neurons. (E) Venn diagram of cell counts of GCaMP6s transduced (green), and NMB+ (magenta), neurons under the GRIN lens (1 representative section from each of 3 mice). (F) Recording of mouse whole body plethysmography (WBP) in response to hypercapnia time-matched with Inscopix recorded GCaMP6 signals. These show neurons that gave a graded response to CO2 (EG). (G) Average of the graded neuronal responses aligned to the WBP trace in (F). (H) Examples of neurons that showed an adapting response to a change in inspired CO2 (EA). WBP trace aligned to the GCaMP6 fluorescence and instantaneous VE (minute ventilation) shown to demonstrate how the signals in the EA neurons closely correspond to VE. (I) Average waveform of all EA neurons in the RTN aligned to 0, 3 and 6% inspired CO2 (gray bar). (J) A plot of VT versus F/F0 for the Ca2+ signal during the transition from 0 to 3% CO2 in three individual mice showing positive correlation. Underneath each VT vs F/F0 graph is a plot of change in VT (grey) and average of EA neuronal Ca2+ activity (magenta) from respective mouse during transition from baseline to 3% CO2. Note that there is a transient increase in breathing at the beginning of hypercapnia that corresponds to the activation of the EA neurons. Abbreviations: 7 N, facial motor nucleus; Py, pyramidal tract; MVe, medial vestibular nucleus; sp5, spinal trigeminal nucleus: RTN, retrotrapezoid nucleus; RMg, raphe magnus; RPa, raphe pallidus; pFL, parafacial lateral region.
After assessing the quality of recordings, we retained Ca2+ activity traces from 98 RTN neurons in 9 mice (Figure 1A). There was a wide variety of neuronal responses to the hypercapnic challenge (Figure 1—figure supplement 2). While we observed 4/98 neurons exhibited a graded response to hypercapnia (EG, Figure 2F and G, Figure 2—video 1), a much greater number (27/98) were of the adapting subtype (EA, Figure 2H1, Figure 2—video 2). This adapting response may also be physiologically meaningful, as it matched the time course of changes in VE calculated from the WBP records (Figure 2H). In three mice the averaged Ca2+ trace of the EA neurons in each mouse matched the changes in VT for the same mouse and a plot of VT versus F/F0 for the Ca2+ signal gave a positive correlation (Figure 2J, and Supplementary file 1). This correspondence between features of the responses in these neurons and the adaptive ventilatory response, supports the hypothesis that these are a physiologically important class of chemosensitive neurons. An alternative explanation that the rates of Ca2+ sequestration greatly increased during hypercapnia such that Ca2+ levels fell even although firing rates increased can be excluded by examining the dynamics of individual Ca2+ transients. The rise time of these transients reflects the rate of Ca2+ influx, and the exponentially falling decay phase the rate of Ca2+ extrusion or sequestration. Comparison of these transients before, during and after the hypercapnic stimulus shows that these transients do not change in shape (Figure 2H, Figure 2—figure supplement 2).
A further 5/98 neurons were inhibited during hypercapnia (Figure 3A and C, blue traces and Figure 3—video 1). These neurons displayed spontaneous Ca2+ activity during normocapnia, but were abruptly silenced during hypercapnia (Figure 3C). We recorded from sniff-coding (Sn) neurons, 3/98, which showed elevated Ca2+ signals correlated with sniffing (Figure 3A and B). In sniff-coding neurons, Ca2+ activity coincided with perturbations of the plethysmography traces (increase in respiratory frequency, increase of tidal volume, presence of expiration, Figure 3B and Figure 3—video 1). Analysis of the onset of the Ca2+ signal relative to the start of the sniff, showed that, on average, activity in these neurons preceded the sniff by 0.4–0.8 s (Figure 3D). The temporal correlation between the sniff-coding neurons and the sniff was further confirmed by averaging the Ca2+ recordings from multiple sniffs (Figure 3E). Interestingly the different functional types of neuron are clustered adjacent to each other (Figure 3F).

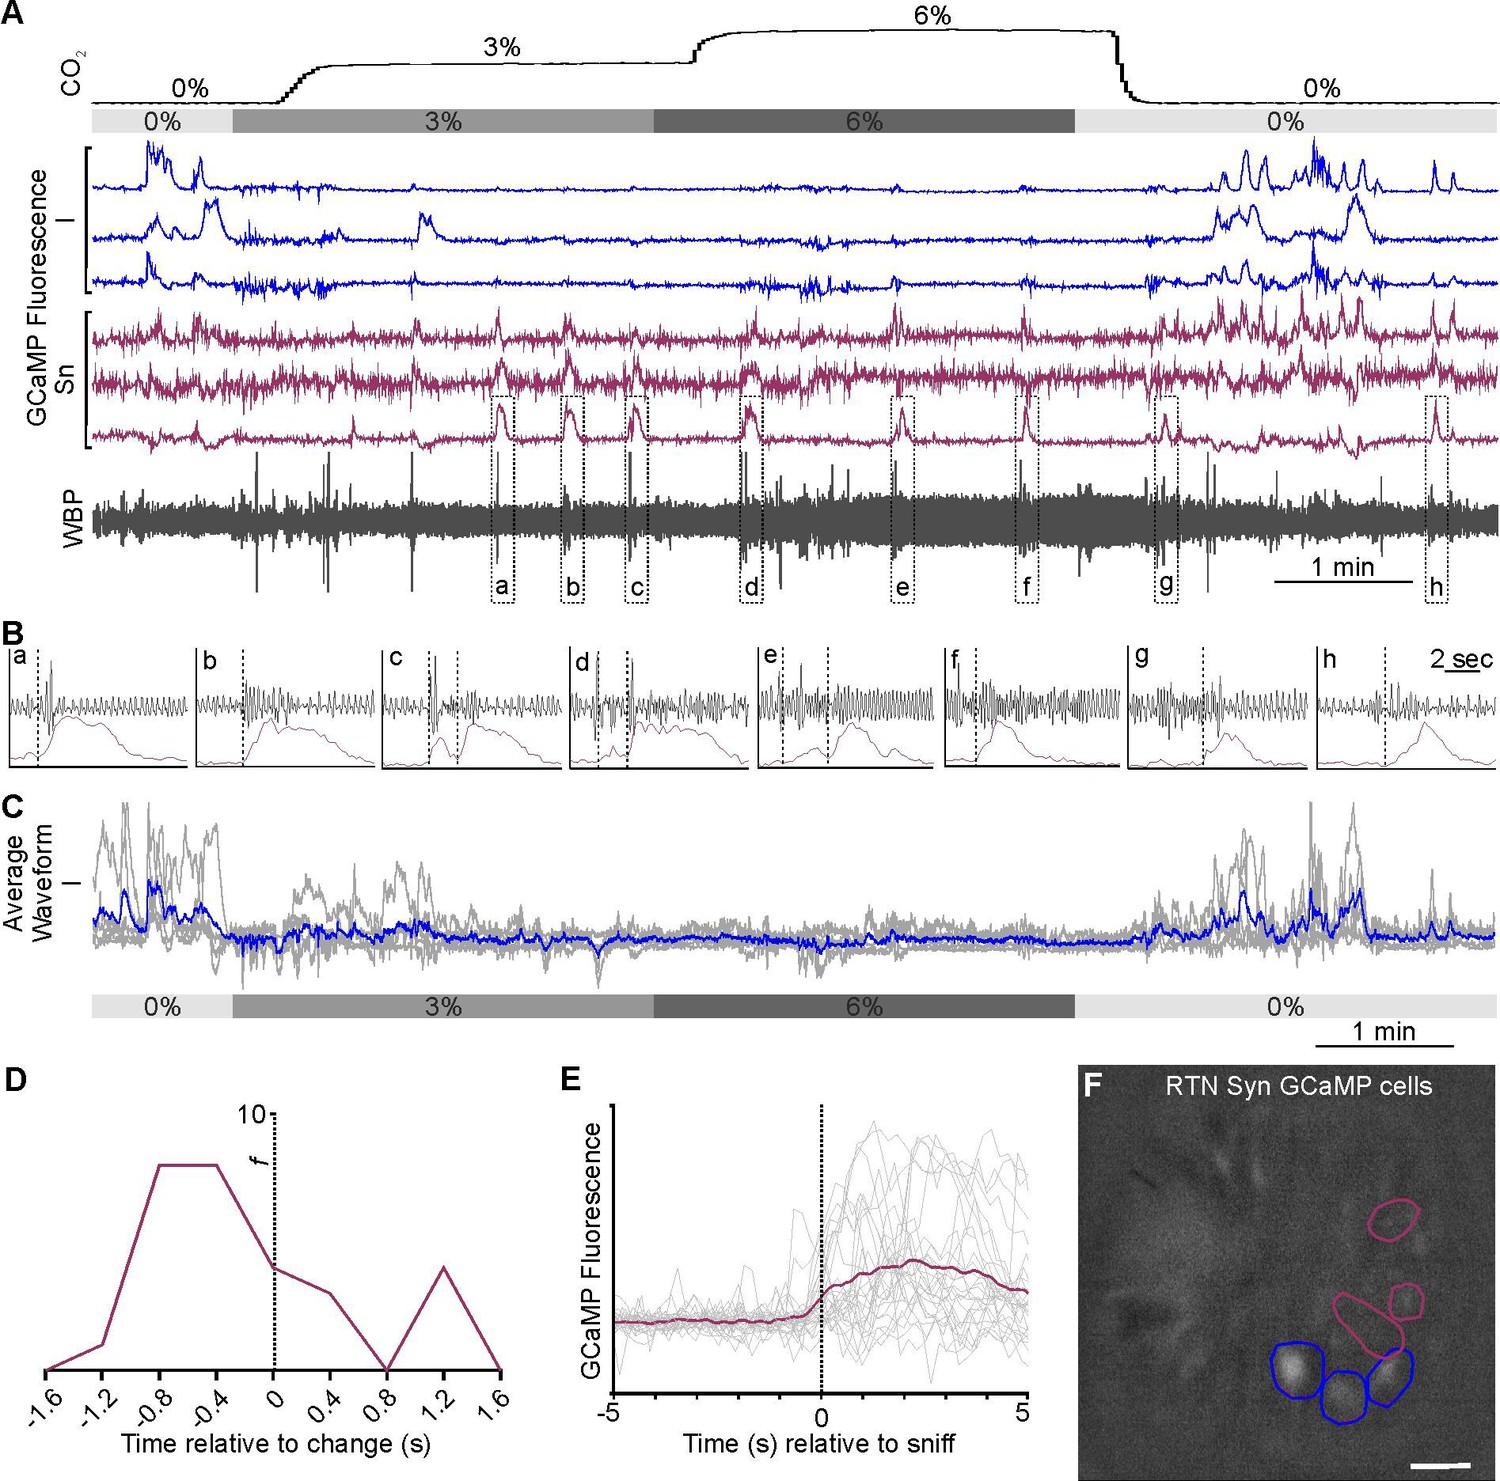
Sniff-coding, and CO2-inhibited RTN neuronal responses in awake mice.
(A) Recording of mouse WBP in response to hypercapnia time-matched with Inscopix recorded GCaMP6 signals. CO2-Inhibited (blue) and sniff-coding (eggplant purple) calcium traces correspond to the neurons shown in panel F. (B) Expanded recordings from (A), the start of the Ca2+ transient is shown by the dotted line. (C) Average waveform of RTN inhibited neurons in response to hypercapnia. (D) Sniff-correlation histogram and (E) Spike triggered average (eggplant purple line) of all Ca2+ events (grey lines) temporally correlated to the beginning of sniff activity (dotted verticle line). (F) GCaMP6s fluorescence of transduced RTN neurons in freely behaving mice. Individual regions of interest (ROIs) drawn around CO2-inhibited (blue) and sniff coactivated (eggplant purple) neurons. (Scalebar- 20 μm).
-
Figure 3—source data 1
Data for Figure 3 panels D and E.
- https://cdn.elifesciences.org/articles/70671/elife-70671-fig3-data1-v2.xlsx
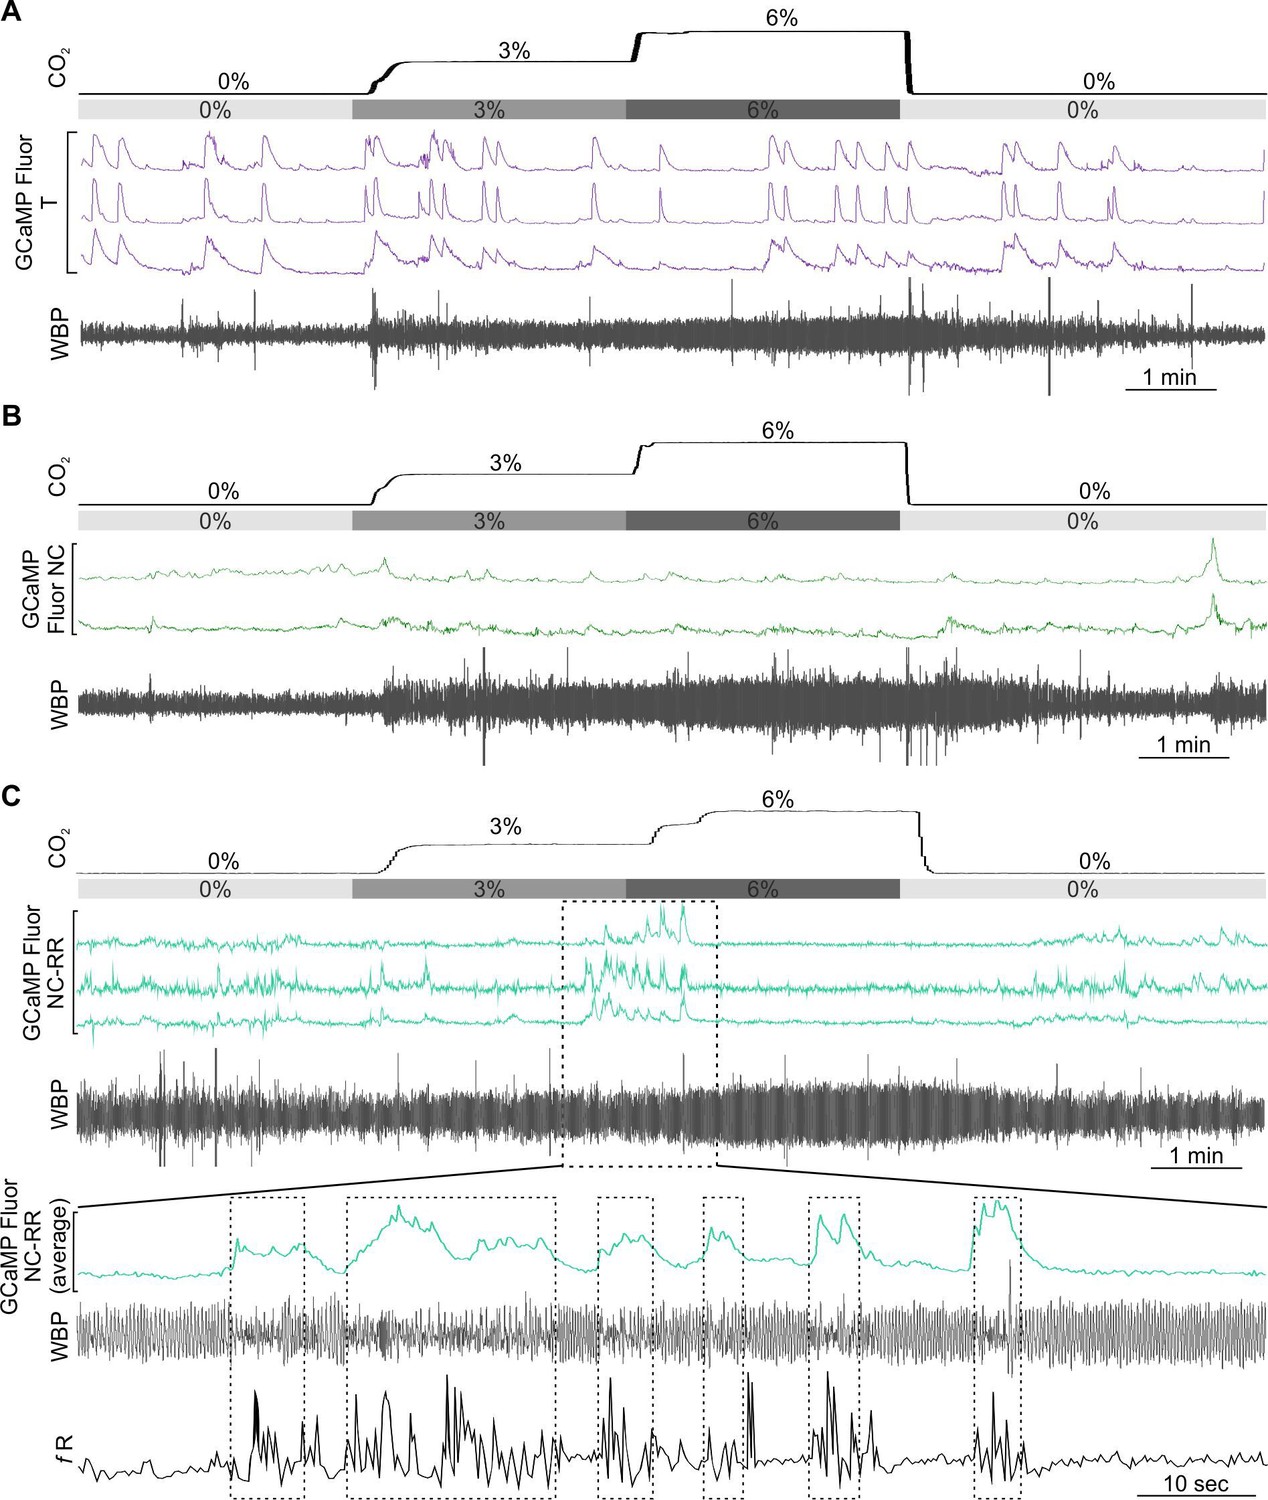
Additionally, 5/98 neurons which were tonically active but did not encode any information about hypercapnia (T, Figure 4A, Figure 4—video 1). Tonically active neurons in the RTN could provide background excitation to the respiratory network. Of 98 neurons, 35 showed sporadic activity that did not correlate with CO2 (NC, Figure 4B) and a further 19/98 neurons that did not encode CO2 levels but displayed Ca2+ signals that were correlated to changes in respiratory frequency and were generally silent when tidal volume was at its greatest (NC-RR, Figure 4C).

Tonically active, non-coding (NC) and NC-respiratory related (NC-RR) RTN neuronal responses in awake mice.
Recording of mouse WBP in response to hypercapnia time-matched with Inscopix recorded GCaMP6 signals (A, B, C). GCaMP fluorescence of RTN (A) tonically active (T; violet blue) (B) non-coding (NC; green) and (C) non-coding respiratory related (NC-RR; shamrock green) neurons. Average of NC-RR neuronal activity (dotted box) expanded under it displayed Ca2+ signals that were correlated to changes in respiratory frequency (fR) and were generally silent when tidal volume (WBP) was at its greatest.
In summary for RTN neurons: ~40% (39/98) had activity patterns that were in some way modulated by CO2. The majority of these neurons, 69% (27/39), displayed an adaptive response to CO2, thus marking the onset of hypercapnia. Only a minority of neurons, 10% (4/39), encoded the magnitude of hypercapnia and a similar minority (13%; 5/39) were active and inhibited throughout the hypercapnic episode. Interestingly, we found a small number of sniff-activated neurons, which may be from the most rostral and ventral aspect of the retrofacial nucleus, which overlaps with the most caudal and dorsal aspect of the RTN (Deschênes et al., 2016; Kurnikova et al., 2018).
Effect of anaesthesia on RTN chemosensory responses
Until now most investigation of RTN chemosensory responses at adult life stages has been in anaesthetised preparations. We therefore examined the effect of deep anaesthesia on the activity of RTN neurons before and during chemosensory stimuli (Figure 4—figure supplement 1). As might be expected, compared to the awake state, urethane anaesthesia had a deeply suppressive effect on the spontaneous activity of all RTN neurons. Whereas almost all neurons displayed spontaneous activity, there was hardly any activity under anaesthesia (Figure 4—figure supplement 1A-B). Furthermore, the responses to hypercapnia were greatly blunted, with many neurons simply being unresponsive. When we examined those neurons that retained a chemosensory response to hypercapnia in the anesthetised state, these responses differed from those that the same neurons showed in the awake state (Figure 4—figure supplement 1C). For example, cells displaying a graded response to hypercapnia under anaesthesia were classified as non-coding respiratory related (NC-RR) or non-coding (NC) in the awake state.
Chemosensory responses in the medullary raphe
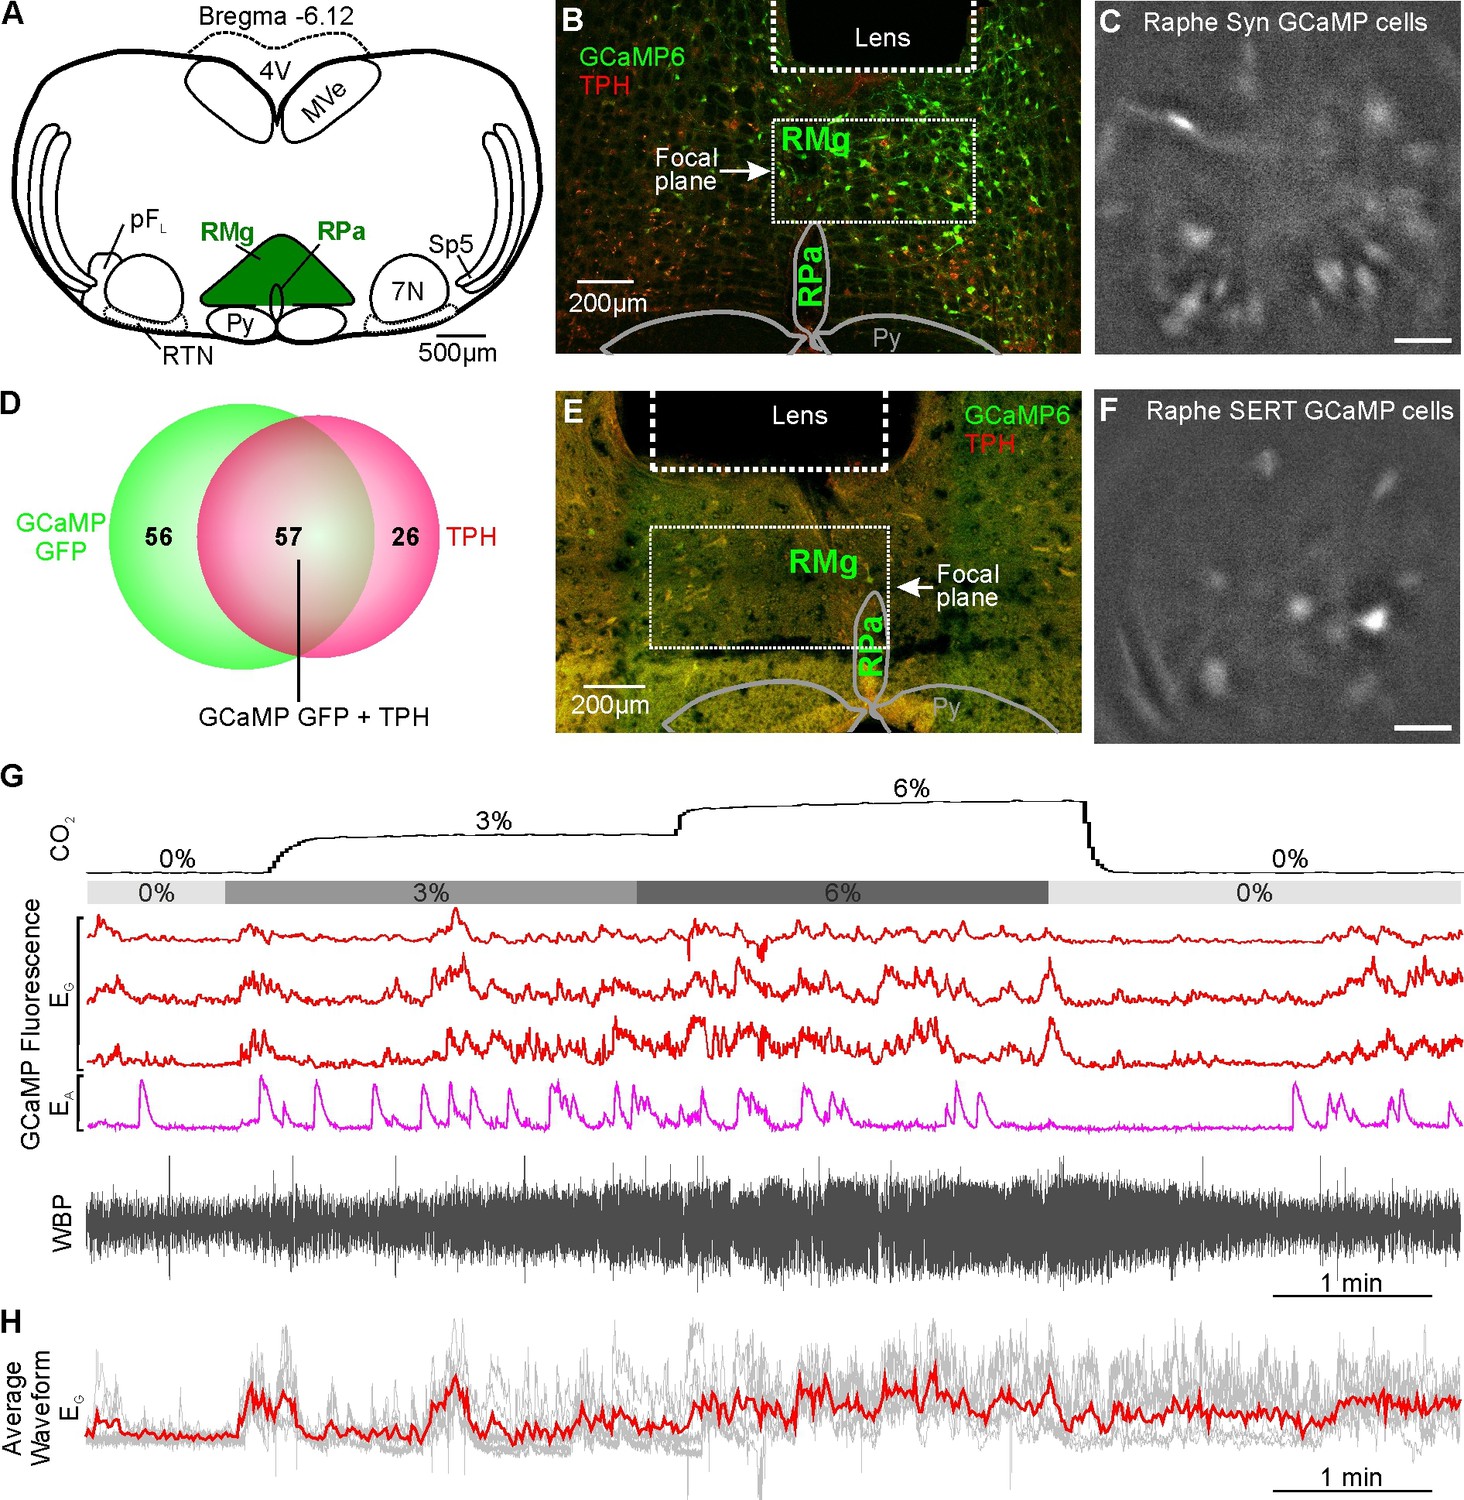
As the medullary Raphe contains multiple neuronal types which display functionally different CO2 responses in vitro (Bradley et al., 2002; Ray et al., 2011; Richerson, 1995) and in vivo (Veasey et al., 1995), we next examined whether the activity of neurons in the rostral Raphe magnus and pallidus could be altered by CO2 (Figure 5). We drove expression of GCaMP6s with a synapsin promoter (n=2 mice; Figure 5A–C). Assessing the ability of this construct to transduce serotonergic neurons in this nucleus, we found that 57/113 (50%) of the transduced neurons in the focal plane of the microscope were TPH+ (tryptophan hydroxylase; a marker of serotonergic neurons) (Figure 5D). As there are also GABAergic neurons (Iceman et al., 2014; Iceman and Harris, 2014), and non-serotonergic NK1R neurons in the Raphe (Hennessy et al., 2017; Iceman and Harris, 2014), we also specifically targeted the serotonergic neurons by driving GCaMP6 expression with a SERT (slc27a4) promoter (n=4 mice, Figure 5E–F). Post-hoc immunocytochemistry showed that all neurons in the optical pathway of the microscope (Figure 5E) which expressed GCaMP6s co-localised with TPH. We recorded 9 synapsin GCaMP6s neurons and 17 SERT GCaMP6s neurons.

CO2-excitated medullary raphe neurons in awake mice.
(A) AAV injection into the Raphe. (B) Micrograph of lens placement and AAV9-Syn-GCaMP6s viral transduction of neurons (green) relative to the Raphe (TPH +neurons red). (C) GCaMP6s fluorescence signal from AAV9-Syn-GCaMP6s transduced raphe neurons in freely behaving mice (Scale bar- 50 μm). (D) Venn diagram of cell counts of AAV9-Syn-GCaMP6s transduced neurons (green) under the GRIN lens with TPH +neurons (red) in the raphe (1 representative section from each of 4 mice). (E) Micrograph of lens placement and AAV9-SERT-GCaMP6s viral transduction of neurons (green) relative to the Raphe (TPH +neurons red). (F) GCaMP6s fluorescence signal from AAV9-SERT-GCaMP6s transduced raphe neurons in freely behaving mice (Scale bar- 50 μm). (G) WBP recording in response to hypercapnia time-matched with Inscopix recorded GCaMP6 signals. GCaMP fluorescence of raphe excitatory graded (EG), and excitatory adapting (EA) neurons in response to hypercapnia. (H–I) Average waveform of raphe EG neuronal responses to hypercapnia aligned to the WBP trace in G. Abbreviations defined in Figure 2.
As in the RTN, we found there were multiple categories of CO2-dependent responses (Figure 1—figure supplement 3). A frequently observed class of neurons (8/26) exhibited a graded response to CO2 (EG, Figure 5G and H and Figure 5—video 1, synapsin). 4/26 neurons showed the adapting response (EA, Figure 5G). The commonest class of neurons in our dataset was inhibited by CO2 (10/26, all from mice transduced with GCaMP under the SERT promoter, Figure 6A and B, Figure 6—video 1 SERT). The remaining 4/26 neurons displayed activity that was unaffected by hypercapnia (NC, Figure 6C).

CO2-inhibited and non-coding raphe neuronal responses in awake mice.
Recording of mouse WBP in response to hypercapnia time-matched with Inscopix recorded GCaMP6 signals. GCaMP fluorescence of raphe CO2 inhibited (I; blue) (A) and non-coding (NC; green) (C) neurons. (B) Average waveform of raphe inhibited neurons in response to hypercapnia aligned to the WBP trace in A.
In summary, 85% (22/26) of Raphe neurons had Ca2+ activity patterns that were modulated by CO2. Interestingly, unlike the RTN which showed considerable bias toward the EA functional type, EA neurons were much less prevalent in the Raphe (only 15%), with EG (31%), and I (38%) being the most common types of response we observed. In the Raphe, there were no tonically active neurons or neurons that were co-active with any non-respiratory related orofacial movements such as sniffing.
Expiratory activity of neurons in the pFL
Neurons of the pFL, lateral and adjacent to the RTN, have been proposed as the expiratory oscillator (Huckstepp et al., 2015; Huckstepp et al., 2016). Under resting conditions, eupneic breathing, with the exception of during REM sleep (Andrews and Pagliardini, 2015), does not involve active expiration, so the neurons of the pFL are largely silent. A hypercapnic stimulus causes an increase in respiratory frequency, tidal volume and also the onset of active expiration (Huckstepp et al., 2015). We therefore transduced neurons of the pFL in 3 mice with the synapsin-GCaMP6f construct (Figure 7A–D) and observed their responses during a hypercapnic stimulus (Figure 7F, Figure 1—figure supplement 4). We found that the Ca2+ activity reflected changes in respiratory frequency and tidal volume with surprising fidelity (compare grey trace (fR) with GCaMP traces in Figure 7F). Closer inspection revealed the temporal relationship between Ca2+ activity and changes in the plethysmographic traces (Figure 7G). Whilst Ca2+ activity in the pFL neurons on average preceded an increase in tidal volume and respiratory frequency by ~0.4 s, some neurons showed Ca2+ activity only after changes in tidal volume and respiratory frequency had occurred (Figure 7H–J). This time separation was independent of the level of inspired CO2 (Figure 7I and J). These characteristics are more compatible with a correlative rather than a causal relationship between the activation of pFL neurons and changes in tidal volume and respiratory frequency.

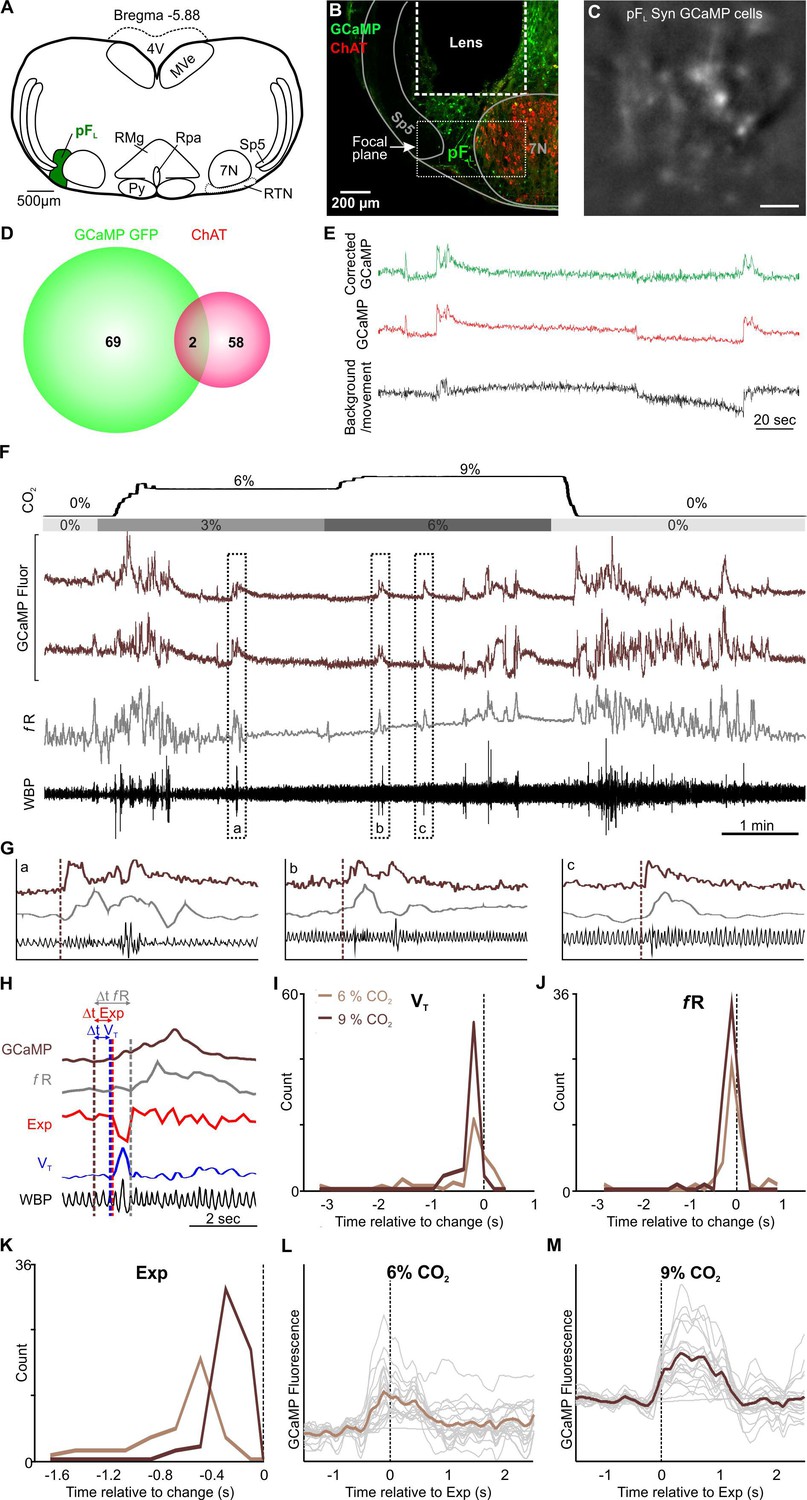
pFL neurons drive active expiration.
(A) AAV9-Syn-GCaMP6f injection into the pFL. (B) Micrograph of lens placement and viral transduction of pFL neurons (green) relative to the facial nucleus (ChAT +neurons red). (C) GCaMP6f fluorescence signal from transduced pFL neurons in freely behaving mice (Scale bar- 50 μm). (D) Venn diagram of cell counts of GCaMP6f transduced (green) and ChAT+ (red) neurons under the GRIN lens (1 representative section from each of 3 mice). (E) Movement artefact subtracted from GCaMP signal extracts a clear Ca2+ transient from pFL neurons. An ROI was placed over the border of a blood vessel (background/movement; black) and the subsequent fluoresence recording was subtracted from the GCaMP signal (uncorrected GCaMP; red) giving rise to neuronal Ca2+ transients of pFL neurons (corrected GCaMP; green) in awake mice that are free from the movement artefact. (F) WBP recording in response to hypercapnia time-matched with Inscopix recorded GCaMP signals. GCaMP6f fluorescence of transient expiratory (Exp; dark brown) pFL neurons. (G) Expanded traces from (F), the start of the Ca2+ transient is shown by the brown dotted line. (H) Measurements of GCaMP6 fluorescence (dark brown) relative to tidal volume (VT, blue), respiratory frequency (fR, grey), and expiration (Exp, red). Verticle dotted lines represent the start of the changes on their respective channels. (I–K) Frequency histograms of timing of changes in GCaMP fluorescence of pFL neurons relative to tidal volume (VT, left), respiratory frequency (fR, centre), and expiration (Exp, right). (L–M) Spike triggered average (brown line) of all Ca2+ events (grey lines) temporally correlated to the beginning of expiratory activity (dotted verticle line) at (L) 6% CO2 and (M) 9% CO2. Abbreviations defined in Figure 2.
-
Figure 7—source data 1
Data for Figure 7 panels I-K.
- https://cdn.elifesciences.org/articles/70671/elife-70671-fig7-data1-v2.xlsx
When we specifically studied the incidence of active expiration, we found that Ca2+ activity in pFL neurons always preceded a change in the expiratory activity (Figure 7H–M). Importantly, the time delay between activity in the pFL neurons and active expiration was sensitive to inspired CO2 (Figure 7K–M). At 6% inspired CO2 this time difference was ~0.5 s. (Figure 7K and L), while at 9% inspired CO2 the time interval shortened to ~0.3 s (Figure 7K and M). In all 20 neurons in the pFL that exhibited activity, this activity preceded active expiration. This timing is consistent with a causal rather than a correlative link between neuronal activity in the pFL and induction of active expiration. Post-hoc immunocytochemistry showed that a small population of neurons which expressed GCaMP6 co-localised with ChAT (2/71, 1.5%, Figure 7B and D) and were located in the focal plane of the microscope (Figure 7B). These neurons either displayed expiratory-linked activity or more likely were silent and would have been excluded from our dataset, given no other responses other than expiratory activity were recorded in this region.
Discussion
Limitations
We have recorded the intracellular Ca2+ signal from neurons present in the RTN and Raphe. The summation and temporal variation of the signal will depend on the Ca2+ buffering/extrusion systems within the cell, the density and activation properties of Ca2+ permeable channels, and whether Ca2+ may additionally be released from intracellular stores. Therefore, this Ca2+ signal cannot tell us the precise firing rates or dynamics of the neuronal activity, and so is an imprecise proxy of neuronal activity. Despite this imperfection, Ca2+ activity of neurons is a widely used to assess their electrical activity (Chen et al., 2013; Dana et al., 2019; Huang et al., 2021). We verified that the rates of Ca2+ influx and extrusion or sequestration do not change with the hypercapnic stimulus by examining individual Ca2+ transients before, during and after hypercapnia to show that their rise times and decay rates remain unaffected (Figure 2—figure supplement 2). This gives further confidence that the pattern of Ca2+ activity reflects the pattern of neuronal firing.
We used GCaMP6s for recording from the RTN and Raphe as this is the most sensitive Ca2+ sensor and we did not expect to need to resolve rapidly changing Ca2+ signals. For the pFL we used faster responding, but less sensitive, GCaMP6f to attempt to document cycle by cycle changes in fluorescence, but these were not resolved in the current experiments.
We made our recordings at a single wavelength as this was the capability of the minimicroscopes available at the time of the study. Dual channel versions are now available and these would assist with the treatment and exclusion of movement artefacts e.g. through use of ratiometric imaging at two wavelengths. Nevertheless, our extensive controls for movement artefacts, and data analysis, show that we have resolved real Ca2+ signals that reflect different patterns of neuronal firing that are reproducible between across the imaged neuronal population in different recording sessions from a single mouse and recordings between multiple mice. These signals are characterised by the well-documented pattern for true Ca2+ signals of a fast onset and a slower exponentially-falling offset.
While we can be confident of the location of the GRIN lens and the volume of tissue in which labelled neurons could have contributed to the observed signals from posthoc analysis, it is important to note that we cannot identify the actual neurons that were recorded in each session. Related to this, we were unable, for the most part, to make consecutive recordings from the same neurons from session to session. We used a genetic targeting strategy that would give broad coverage of all neuronal types within the nuclei. This presents an overview of the different activity patterns that occur during responses to hypercapnia, however it does not allow identification of the responses of specific neuronal subtypes. Now that we have a library of all activity patterns in these regions, more precise genetic targeting of neurons is required to relate phenotype to firing pattern. Given that no single unique genetic marker has yet been identified to mark chemosensory neurons, such an approach would have to utilize intersectional genetics to achieve the necessary level of precision.
Our observations document the different types of neuronal responses to hypercapnia in awake mice. However, we cannot be sure whether these responses were a direct consequence of the chemosensory stimulus, i.e. a direct action of CO2 or pH on the recorded neurons, or an indirect secondary outcome shaped by the synaptic networks present within the medulla. Additionally, recordings from the same neurons in response to repeated periods of hypercapnia would give further assurance that the activity patterns observed are reproducible responses to hypercapnia at a single cell as opposed to population level.
Chemosensory activity in the rostral medulla of adult mice
For many years the RTN was considered to be a homogeneous population of chemosensory neurons (Guyenet et al., 2010; Nattie and Li, 1994). However, recent neuroanatomical (Li et al., 2016; Shi et al., 2017; Stornetta et al., 2009) and pharmacological (Huckstepp et al., 2018; Li et al., 2016) evidence suggests the region may be more heterogenous than first thought and that functional subdivisions of the RTN may exist in adult rodents. In accordance with this, we found 7 functional subpopulations of neurons. There were two classes of neurons that were excited by CO2 and indicated an aspect of the hypercapnic stimulus (Figure 2): EA (the start and end of hypercapnia), and EG (the presence and magnitude of the hypercapnic stimulus). In addition, there were neurons that were inhibited by hypercapnia (I). Inhibition of RTN neuronal firing by hypercapnia has been previously observed (Cleary et al., 2021; Nattie et al., 1993; Ott et al., 2011).
We found the majority of neurons (from five different mice) in our recordings from the RTN were of the EA subtype that is they responded to the initial increase in inspired CO2 but did not maintain their activation. In some of these neurons there could be a further small increase in activity at the transition of inspired CO2 from 3 to 6%. This suggests that in these neurons some aspect of the sensory response adapts or fatigues, or they are subject to delayed CO2-dependent feedback inhibition that depresses their activity. It is notable that in many of these neurons, activity increased following removal of the hypercapnic stimulus. This activation during transitions at the beginning and end of a stimulus is reminiscent of a multitude of rapidly adapting sensory neurons (e.g. rapidly adapting pulmonary receptors Widdicombe, 1954, Pacinian and Meissner corpuscles Vallbo and Johansson, 1984). This could be due to rapid removal of sensory adaptation followed reactivation and rebound activity as the arterial CO2 levels moves back to resting levels.
While adapting responses to hypercapnia have not been recognised before, the Phox2b+neurons of the RTN have been subdivided into types 1 and 2 on the basis of their pH sensitivity (Lazarenko et al., 2009). Examination of the response characteristics of the example type 1 neuron illustrated in this paper shows that it displayed an adapting response to acidification, taking 30–40 s to decline from peak firing to a steady state baseline (Lazarenko et al., 2009). By contrast the example type 2 neuron shows a sustained graded response (Lazarenko et al., 2009), similar to that reported for a Phox2B+neuron in an earlier publication (Stornetta et al., 2006). A similar subdivision has been made for acutely isolated Phox2b+neurons. In vitro, type 1 neurons also appear to display an adapting response to acidification suggesting that it may be an intrinsic property (Wang et al., 2013). We tentatively suggest that the adapting neurons (EA) may therefore correspond to type 1 Phox2b+neurons, however this would require further direct experimental evidence to substantiate this point.
We found only 4 neurons (from 3 different mice) that exhibited a graded response to CO2 (EG). Although these neurons were in the minority, their graded responses to hypercapnia were very similar in time course to those previously described for Phox2b+ RTN neurons in the anaesthetised adult rat (Stornetta et al., 2006) and they might correspond to the type 2 Phox2b+ neurons (Lazarenko et al., 2009). The comparative rarity of the EG neurons was not due to weak responses to hypercapnia which were very robust in the awake mice (note the raw whole body plethysmography [WBP] traces in Figures 2—4 and Figure 4—figure supplement 2A). Nor was it due to a technical issue that prevented us from seeing neural activity, as (1) the lens placement was sufficient to image the most superficial aspect of the RTN where the Phox2b+ neurons lie (Mulkey et al., 2004; Shi et al., 2017; Stornetta et al., 2009), and (2) induction of a seizure in anesthetised mice gave clear Ca2+ activity in the RTN neurons when seizures occurred and altered respiratory activity (Figure 1F and G). The possibility that the serotype of the AAV (AAV-9) did not transduce the chemosensory neurons of the RTN seems remote, as others have demonstrated its efficacy for these neurons (Hérent et al., 2021). Although we recorded from 98 RTN neurons in 9 mice, we cannot completely exclude that some unknown aspect of the recording set up may have prevented us from seeing all types of neurons and might have led to comparative under-representation of the EG subtype in our dataset.
The respiratory network, and with it the hypercapnic ventilatory response, changes with development (Huckstepp and Dale, 2011b). Chemosensory responses become less dependent on Phox2B+ neurons of the RTN by 3 months of age when those neurons are genetically ablated (Ramanantsoa et al., 2011). Acute chemical lesions of the RTN that remove almost all NMB+ neurons, greatly perturbed central chemosensory responses at adult stages, however this was not seen with smaller lesions that preserved a little under half of the NMB+ neurons (Souza et al., 2018). A lesioning strategy, be it chemical or genetic, cannot discriminate between a direct chemosensory function and a relay function of this nucleus. The majority of evidence for the responses of RTN neurons, and in particular the Phox2B+ neurons, to hypercapnic stimuli comes from neonatal or young juvenile animals (Mulkey et al., 2004; Ramanantsoa et al., 2011). Here we are investigating chemosensory mechanism in the adult after the system has fully matured. It is possible that the nature of the chemosensory responses change, and the EA neuronal phenotype emerges at adult stages. It is notable that even in the cells classified as EG there is a transient enhancement of activity immediately following the imposition of hypercapnia (Figure 2F and G) suggesting that detection of change in PCO2 is an important role for RTN neurons.
A second possibility is that much of prior evidence for RTN chemosensory responses depends heavily on recordings from anaesthetized animals and that anaesthesia alters the dynamics of neuronal responses to CO2. When we compared RTN responses in awake and anaesthetized animals we found that deep urethane anaesthesia dramatically changed neuronal firing patterns before and during hypercapnia (Figure 4—figure supplement 1). While the choice of anaesthetic agent and depth of anaesthesia is likely to alter the degree to which RTN neurons retain their natural activity, our recordings suggest that studies of chemosensory responses in anaesthetised preparations should be interpreted with caution.
These possibilities are not mutually exclusive and it is likely that they may all contribute to the relatively low proportion of neurons of the EG subtype in our dataset. Unexpectedly, whilst we recorded from sniff activated neurons, we did not find any neurons with sigh related activity, which may be due to their sparsity in number (Li et al., 2016). Therefore, more recordings may be necessary to uncover further functional subpopulations within the RTN region.
Several lines of evidence have suggested the importance of medullary Raphe serotonergic neurons in mediating respiratory chemosensitivity: the proximity of raphe neuron processes to blood vessels (Bradley et al., 2002); the correspondence of the location of CO2-dependent ATP release at the medullary surface and the raphe neurons (Bradley et al., 2002; Gourine et al., 2005); suppression of the medullary raphe by isofluorane (Johansen et al., 2015; Ray et al., 2011) which matches the reduction in the overall hypercapnic ventilatory response; and most compellingly the observation that inhibition of their activity via inhibitory DREADD receptors removes ~40% of the total adaptive ventilatory response in awake mice (Ray et al., 2011). There were two classes of neuron excited by CO2 and these marked the presence and magnitude of the hypercapnic stimulus (EG) and the start of the hypercapnic episode (EA), supports the hypothesis that the Raphe acts as a primary chemosensory nucleus.
Of the 2 known serotonergic subtypes in the Raphe, NK1R-negative serotonergic neurons project to areas responsible for CO2 integration (Brust et al., 2014), whereas NK1R-positive serotonergic neurons project to motor nuclei responsible for airway patency and co-ordination, and diaphragmatic movements (Hennessy et al., 2017). Interestingly both subtypes project to the preBötC (Brust et al., 2014; Hennessy et al., 2017). Furthermore, both serotonergic and GABAergic raphe neurons project to the pFL (Silva et al., 2020), with serotonergic neurons also innervating areas that influence expiration, namely the C1 (Malheiros-Lima et al., 2020), and NTS (Silva et al., 2019). Therefore, Raphe neurons are well placed to have far-reaching effects on breathing.
While both the RTN and Raphe have a high proportion of neurons that can be activated by CO2, there are interesting differences in the nature of the responses that we observed (Figure 8A). The majority of RTN neurons that we observed were of the EA subtype, thus they will encode a change in inspired CO2 rather than the presence of the entire stimulus. Even the EG neurons responded to a change in inspired CO2 with a transient change in Ca2+ activity in addition to the graded response. By contrast the situations was reversed in the Raphe: we observed a greater number of Raphe neurons were of the EG subtype than the EA subtype. This may suggest a complementarity between the RTN and Raphe, such that the more superficially located RTN rapidly encodes changes in PCO2, with the deeper sitting Raphe providing a more sustained and graded response to encode the magnitude. It is noteworthy that plethysmographic changes in breathing are well-known to partially adapt to step changes in inspired CO2 (illustrated in Figure 2H and J, see also Bravo et al., 2016) suggesting that the EA subtype is physiologically important. The rapid response to a sudden change in inspired CO2 could plausibly be regarded as a trigger to quick behavioural adaptation that could remove the animal from the source of hypercapnia, or trigger a rapid adjustment in breathing that is sufficient to restore normocapnia.

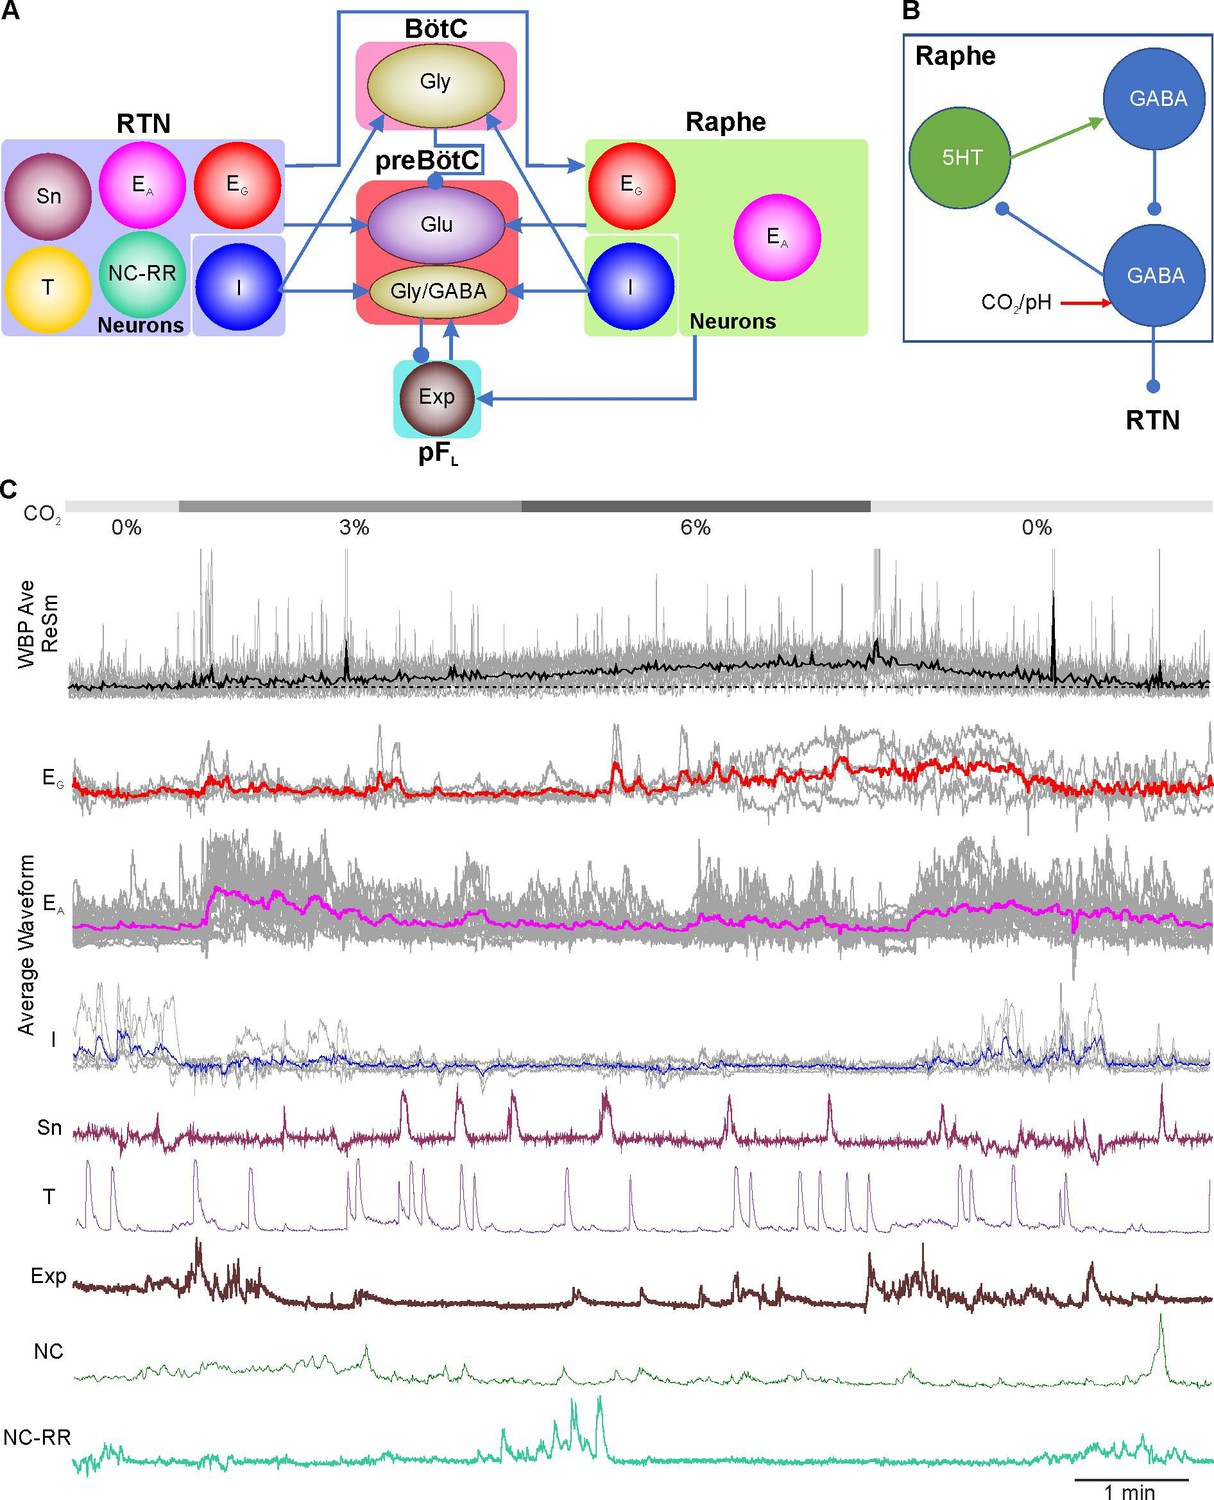
Summary diagram of findings in the paper showing contribution of the RTN, Raphe and pFL neurons to respiratory chemosensitivity and active expiration.
(A) Block diagram showing the types of activity pattern observed in neurons of the RTN, pFL and Raphe. Proposed potential interconnections to the preBötzinger and Bötzinger complexes are speculative and based on regional interactions reported in the literature. (B) Hypothesis for generating CO2 dependent inhibition of serotonergic neurons. CO2 is proposed to activate GABAergic neurons that inhibit tonically active serotonergic neurons which are not directly CO2 sensitive. If these were to activate a separate population of non-CO2 sensitive GABAergic neurons, these could normally silence the CO2 sensitive neurons until an episode of hypercapnia. This mechanism could explain an indirect inhibitory action of CO2 on both serotonergic and GABAergic neurons. (C) Averages of the different types of neuronal activity seen in the RTN, Raphe and pFL during hypercapnia aligned to an average of the WBP trace.
CO2-inhibited neurons in the RTN and Raphe have been previously described (Iceman et al., 2014; Nattie et al., 1993). Our recordings give further evidence for these subtypes in both nuclei. In the Raphe, CO2 inhibited neurons were thought to be exclusively GABAergic. Our finding that serotonergic Raphe neurons can be inhibited by CO2 is unexpected. The mechanism of CO2-dependent inhibition is unclear. One possibility is that a CO2 activated K+ channel is present in these cells. An inward rectifier K+ channel that is activated by CO2 has been described in HeLa cells (Huckstepp and Dale, 2011a), indicating that this mechanism of intrinsic sensitivity is possible. However, a likelier alternative hypothesis is that the inhibitory action of CO2 on the serotonergic and GABAergic neurons is indirect and depends upon synaptic connectivity -for example via CO2-dependent activation of local GABAergic interneurons that are present in the medullary Raphe (Figure 8B).
While the emphasis of chemosensory mechanisms has been on the CO2/pH-dependent activation of excitatory neurons, CO2/pH-dependent inhibition of neurons could also be a powerful contributor to the hypercapnic ventilatory reflex (Figure 8A). While we have not demonstrated synaptic connections from any of the classes of neurons we describe, if CO2-inhibited neurons were to tonically excite neurons that normally inhibit the preBötzinger complex, a process of disinhibition during hypercapnia could result in greater excitation of preBötzinger complex neurons (Figure 8A). RTN and Raphe neurons are known to project to the Bötzinger complex (Morinaga et al., 2019; Rosin et al., 2006), which contains inhibitory neurons (Ezure and Manabe, 1988), whilst RTN neurons are also known to project to inhibitory cells of the preBötC (Yang et al., 2019), which regulate the synchronisation of excitatory bursting and the emergence of the inspiratory rhythm (Ashhad and Feldman, 2020). The CO2-dependent disinhibition of the inhibitory interneurons in the preBötC could contribute to the emergence of more powerful inspiratory bursts and hence an increase in tidal volume (Figure 8A).
Non-chemosensory mechanisms in the RTN
The RTN showed several forms of Ca2+ activity that did not respond to hypercapnia. In support of previous findings (Nattie et al., 1993), we saw a small population of tonically firing neurons that were unaffected by elevating inspired CO2. These neurons might provide tonic drive to the respiratory network that drives tidal volume, which is known to originate at least in part from the RTN (Huckstepp et al., 2015). However, in 67/98 of the RTN neurons, we observed some tonic activity during room air breathing. Therefore, about 2/3 of the RTN neurons we imaged could plausibly contribute to tonic drive at rest. In addition to providing drive to basal breathing, tonic activity in neurons may also provide a level of baseline excitation that permits for the system to be more easily manipulated, allowing other respiratory features to be expressed. For example there is an absolute requirement for network wide activity to enable expiratory motor output to occur (Huckstepp et al., 2016). Furthermore, it is well documented that as respiratory network excitation decreases during sleep, sensitivity to CO2 diminishes leading to lower minute ventilation, a higher resting PaCO2 (Douglas et al., 1982a), and reduced hypercapnic ventilatory responses (Douglas et al., 1982b). Thus, tonic activity in the RTN may be vital to allow a greater sensitivity to CO2 during wakefullness.
We also found non-coding neurons in the RTN. These neurons could be subdivided into those that displayed Ca2+ activity not related to the level of CO2, nor any abstractable feature on the respiratory recording (NC), and those that had Ca2+ activity that matched variations in respiratory output (NC-RR). This latter population were largely silent when VT was at its greatest but displayed activity when the respiratory frequency was high and the faster ventilatory cycle meant that VT was smaller. The NC-RR neurons might therefore provide excitation to increase respiratory frequency. The NC sub-population could represent a novel neuronal type in the RTN, or could be a known non-CO2 coding subpopulation that are likely to have other functions such as those that express high levels neuromedin B (Shi et al., 2017).
Sniffing is a mechanism that allows for olfactory sampling of the air to discern location of smell and to test for irritants before air is taken into the lung. Sniffing is obligatory for odour perception (Mainland and Sobel, 2005), and thus activates the piriform cortex (Sobel et al., 1998a). However, sniffing also causes neuronal activity in the absence of odorants (Sobel et al., 1998a). It activates the hippocampus (Vanderwolf, 2001), and the cerebellum (Sobel et al., 1998b), respectively, likely to prime odour-related memory recall, and co-ordination of movement toward or away from specific odours. Whilst the activation of these brain regions during sniffing has been well documented, the pattern generating microcircuit for sniffing has only recently been identified. Sniffing requires the activation of two sets of muscles (i) the nasal muscles to open the airway and decrease resistance, allowing more rapid movement of air through the nose, and (ii) the respiratory (inspiratory and expiratory) muscles, to draw air in and out of the nasal cavity. The RTN is located adjacent to, and innervates, the facial motor nucleus (Deschênes et al., 2016; Kurnikova et al., 2018). These RTN projections to the facial are directly involved in sniffing (Deschênes et al., 2016) and control of nasal direction during the odour response (Kurnikova et al., 2018). In conjunction the RTN provides significant drive to the preBötC (Rosin et al., 2006), and the pFL (Zoccal et al., 2018), both of which are integral parts of the sniffing microcircuit (Deschênes et al., 2016; Moore et al., 2013). Therefore, it is not surprising that the sniff pathway originates in, or passes through, the RTN.
Active expiration
The pFL is thought to be a subsidiary conditional oscillator for expiration that is normally suppressed at rest (Huckstepp et al., 2016). That all pFL neurons showed the same discharge pattern, supports the hypothesis that the pFL is comprised of a single homogenous group of neurons acting with a single purpose (Huckstepp et al., 2018). Even though the nucleus appears to integrate information from many nuclei -RTN (Zoccal et al., 2018), C1, (Malheiros-Lima et al., 2020), NTS, rostral pedunculopontine tegmental (Silva et al., 2019) and the preBötC (Huckstepp et al., 2016) -the pFL appears to be a simple on-off switch, rather than forming complex outputs as we describe in the RTN.
Surprisingly, we found that pFL neurons were only transiently active during large expiratory efforts, (such as sniffing, sighing, or other forms of brief deep breathing), in contrast to the sustained active expiration previously reported (Huckstepp et al., 2015; Leirão et al., 2018). This may be due to our use of brief periods of graded CO2 in conscious animals, rather than sustained CO2 (~1 hr) (Leirão et al., 2018) or use of the vagotomised anaesthetised preparation in prior studies (Huckstepp et al., 2015). Importantly, in the un-anaesthetised, vagi intact, in situ preparation of young adult rats, pFL neurons only displayed a small number of action potentials (~10) during the latter portion of expiratory phase 2 (approximately the final 20% of the expiratory period) (Magalhães et al., 2021). In our recordings the expiratory period was ~100ms at the highest level of CO2, allowing for 20ms of pFL neuronal discharge during times of active expiration. Thus Ca2+ signals in pFL neurons were likely too small to elicit a recordable change in GCaMP fluorescence, except when expiratory efforts were notably large in terms of both duration and amplitude. Furthermore, in contrast to our expectation that pFL neurons would be phasically active between inspiratory bursts, pFL neurons exhibited elevated intracellular calcium beginning before, and spanning, the expiratory period.
Concluding remarks
Endoscopic imaging of the activity of the brainstem neurons involved in the control of breathing provides a new way to investigate the neural circuitry for the chemosensory control of breathing in awake adult mice, and to understand how breathing is coordinated with complex non-ventilatory behaviours. Some components, such as expiratory activity of the pFL or sniff activity in the RTN, are easy to interpret, whilst others are more complicated. The responses to CO2 were more heterogeneous in both hSyn+ RTN and hSyn+ and serotonergic Raphe neurons than would be expected from the prior literature. Notably, our dataset of RTN chemosensitive neurons contained a preponderance of the EA subtype. The EA neuronal responses are potentially well suited to detect small increases of inspired CO2 outside the normal range that can occur during normal behavioural conditions. In contrast, the Raphe neurons tended to be active during the entire CO2 stimulus and conceivably these neurons could take over from RTN neurons during more sustained episodes of hypercapnia. These data provide an intriguing possibility that the chemosensory network is arranged in a hierarchy with each layer conveying a unique range of CO2.
Materials and methods
Reagent type (species) or resource | Designation | Source or reference | Identifiers | Additional information |
---|---|---|---|---|
Gene (Mus musculus) | Promoter of mouse Slc6a4, Gene Accession: NM_010484 | Genecopoiea | MPRM41232-PG02 | |
Strain, strain background (Mus musculus, male) | wild-type | Jackson Laboratories | C57BL/6 J background | |
Cell line (Homo sapiens) | 293AAV Cell Line | CellBioLabs | AAV-100 | HEK293-T |
Antibody | (Goat polyclonal) anti-cholineacetyl transferase antibody | Millipore | RRID:AB_262156 | (1:100 dilution) |
Antibody | (Rabbit polyclonal) anti-Tryptophan hydroxylase 2 antibody | Millipore Sigma | RRID:AB_10806898 | (1:500 dilution) |
Antibody | (Rabbit polyclonal) anti- NMB (CENTER) antibody | Sigma-Aldrich | RRID:AB_2619620 | (1:1000 dilution) |
Antibody | (donkey polyclonal) anti- rabbit IgG (H+L) Alexa Fluor 680 | Jackson Immunoresearch | RRID:AB_2340627 | (1:250 dilution) |
Antibody | (donkey polyclonal) anti- rabbit IgG (H+L) Alexa Fluor 594 | Jackson Immunoresearch | RRID:AB_2340621 | (1:250 dilution) |
Antibody | (donkey polyclonal) anti- goat IgG (H+L) Alexa Fluor 568 | Abcam | RRID:AB_2636995 | (1:250 dilution) |
Antibody | (donkey polyclonal) anti- goat IgG (H+L) Alexa Fluor 680 | Jackson Immunoresearch | RRID:AB_2340432 | (1:250 dilution) |
Recombinant DNA reagent | AAV-9: pGP-AAV-syn-GCaMP6s-WPRE.4.641 | Addgene, Watertown, MA, USA | BS1-NOSAAV9 | Dilution 1:10 |
Recombinant DNA reagent | AAV-DJ: pAAV-SERT-GCaMP6s | This paper | Raphe neuronal specific virus with calcium indicator | Dilution 1:10 |
Recombinant DNA reagent | AAV-9: pGP-AAV-syn-GCaMP6f-WPRE.24.693 | Addgene, Watertown, MA, USA | BS3-NXFAAV9 | Dilution 1:10 |
Recombinant DNA reagent | pAAV.Syn.GCaMP6s.WPRE.SV40 | Addgene, Watertown, MA, USA | Plasmid#100843 | |
Recombinant DNA reagent | AAV packaging plasmid pAAV-DJ, AAV-DJ Helper Free Expression System | Cellbiolabs | VPK-410-DJ | |
Recombinant DNA reagent | AAV packaging plasmid pHelper, AAV-DJ Helper Free Expression System | Cellbiolabs | VPK-410-DJ | |
Sequence-based reagent | VC327-4 6 s HindIII for | This paper | PCR primers | 5´- TTGACTGCCTAAGCTTgccaccatgcatcatcatcatcatcatg 300 nM |
Sequence-based reagent | VC327-4 6 s Afe rev | This paper | PCR primers | 5’-GATCTCTCGAGCAGCGCTtcacttcgctgtcatcatttgtacaaact 300 nM |
Peptide, recombinant protein | PrimeSTAR GXL DNA Polymerase | Takara Bio Europe SAS | R050A | 1 U·µg-1 |
Commercial assay, kit | In-Fusion HD Cloning Kit | Takara Bio Europe SAS | 639642 | |
Chemical compound, drug | OptiPrep | PROGEN Biotechnik GmbH | 1114542 | Iodixanol |
Commercial assay, kit | 2 x qPCRBIO SyGreen Mix Hi-ROX | PCRBiosystems | PB20.12 | |
Chemical compound, drug | kainic acid | Fisher Scientific | 15467999 | 8 mg·kg–1 IP |
Chemical compound, drug | atropine | Westward Pharmaceutical Co. | 0641-6006-10 | 120 µg·kg–1 |
Chemical compound, drug | meloxicam | Norbrook Inc. | 2 mg·kg–1 | |
Chemical compound, drug | buprenorphine | Reckitt Benckiser | 100 µg·kg-1 | |
Chemical compound, drug | PEI MAX Hydrochloride Transfection Grade Linear 40,000 mwco | Polysciences Europe GmbH | 24765–1 | 1 µg·µL-1 |
Software, algorithm | Inscopix Data Processing Software (IDPS) | Inscopix | Python Tools 2.2.6 for Visual Studio 2015 | Version: 1.6.0.3225 |
Software, algorithm | Spike2 | Cambridge Electronic Design | RRID:SCR_000903 | Version: 8.23 |
Software, algorithm | Prism 9 | GraphPad | RRID:SCR_002798 | Version 9.1.0 |
Software, algorithm | ZEN | Carl Zeiss | RRID:SCR_013672 | Version 11.0.0.190 |
Experiments were performed in accordance with the European Commission Directive 2010/63/EU (European Convention for the Protection of Vertebrate Animals used for Experimental and Other Scientific Purposes) and the United Kingdom Home Office (Scientific Procedures) Act (1986) with project approval from the University of Warwick’s AWERB.
Cell lines
Request a detailed protocolTo produce AAV particles, we obtained a proprietary cell line, HEK293AAV cells, directly from CellBioLabs for this study. The certification from CellBioLabs stated the cells’ identity and that they were free of microbial contamination. These cells were only used to produce the AAV particles and were not used by themselves to generate any of the data in this study.
AAV-DJ: pAAV-SERT-GCaMP6s vector particle production and purification
Request a detailed protocolThe CMV promoter region was excised from pAAV-GFP (Cellbiolabs) by restriction digest with MluI and ClaI, blunting with Klenow Fragment (TheroScientific) and re-ligation with T4 DNA ligase (ThermoScientific) to generate pAAV-GFP without promoter. A SERT promoter clone was purchased from Genecopoiea (Product ID: MPRM41232-PG02, Symbol: Slc6a4, Species: Mouse, Target Gene Accession: NM_010484, Alias: 5-HTT, AI323329, Htt, SertA). The promoter region was cut out with EcoRI and HndIII and introduced by T4 DNA ligation into the previously modified pAAV-GFP to generate pAAV-SERT. Subsequently, a PCR performed using PrimeStar GLX Polymerase (Takara Clontech) with pAAV.Syn.GCaMP6s.WPRE.SV40 (Addgene Plasmid#100843) as a template (forward primer 5´- TTGACTGCCTAAGCTTgccaccatgcatcatcatcatcatcatg and reverse primer 5´- GATCTCTCGAGCAGCGCTtcacttcgctgtcatcatttgtacaaact) to amplify the GCaMP6s fragment. pAAV-SERT was digested with HindIII and AfeI and the PCR product was inserted by InFusion Cloning (Takara Clontech) to generate pAAV-SERT His-GCaMP6s. Accuracy of all cloning steps was verified by PCR, restriction digests and DNA sequencing analysis.
AAV-DJ pseudotyped vectors were generated by co-transfection of HEK293-AAV cells (Cellbiolabs) with the AAV transfer plasmid pAAV-SERT His-GCaMP6s and the AAV packaging plasmid pAAV-DJ and pHelper (both Cellbiolabs). HEK293AAV cells (Cellbiolabs) were cultivated in Dulbecco’s modified Eagle’s medium (DMEM, High Glucose, Glutamax) supplemented with 10% (v/v) heat-inactivated fetal calf serum, 0.1 mM MEM Non-Essential Amino Acids (NEAA), 100 U/ml penicillin and 100 μg/ml streptomycin. Tissue culture reagents were obtained from Life Technologies. Briefly, 1x10⁷ HEK293-AAV cells were seeded one day before transfection on 15 cm culture dishes and transfected with 7.5 µg pAAV-DJ, 10 µg pHelper and 6.5 µg pAAV plasmid per plate complexed with Max-polyethylenimine (PEI, Polysciences) at a PEI:DNA ratio (w/w) of 3:1. After 72 hr cells were harvested and resuspended in 5 ml lysis buffer (50 mM Tris base, 150 mM NaCl, 5 mM MgCl2, pH 8.5). After three freeze-thaw cycles, benzonase (Merk; final concentration 50 U/ml) was added and the lysates were incubated for 1 hr at 37 °C. Cell debris was pelleted and vector containing lysates were purified using iodixanol step gradients. Finally, iodixanol was removed by ultrafiltration using Amicon Ultra Cartridges (50 mwco) and three washes with DPBS.
The genomic titers of DNase-resistant recombinant AAV particles were determined after alkaline treatment of virus particles and subsequent neutralization by qPCR using the qPCRBIO SY Green Mix Hi-Rox (Nippon Genetics Europe GmbH) and an ABI PRISM 7900HT cycler (Applied Biosystems). Vectors were quantified using primers specific for the GCaMP6s sequence (5’- CACAGAAGCAGAGCTGCAG and 5’- actggggaggggtcacag). Real-time PCR was performed in a total volume of 10 μl with 0.3 μM for each primer. The corresponding pAAV transfer plasmid was used as a copy number standard. A standard curve for quantification was generated by serial dilutions of the respective plasmid DNA. The cycling conditions were as follows: 50 °C for 2 min, 95 °C for 10 min, followed by 35 cycles of 95 °C for 15 s and 60 °C for 60 s. Calculations were done using the SDS 2.4 software (Applied Biosystems).
Virus handling
Request a detailed protocolRaphe and RTN neurons - AAV-9: pGP-AAV-syn-GCaMP6s-WPRE.4.641 at a titre of 1x10¹³ GC·ml–1 (Addgene, Watertown, MA, USA); Raphe: AAV-DJ: pAAV-SERT-GCaMP6s at a titre of 1.8x10¹³GC·ml–1 (University hospital Hamburg-Eppendorf, Hamburg, Germany). pFL - AAV-9: pGP-AAV-syn-GCaMP6f-WPRE.24.693 at a titre of 1x10¹³ GC·ml–1 (Addgene, Watertown, MA, USA).
Viruses were aliquoted and stored at –80 °C. On the day of injection, viruses were removed and held at 4 °C, loaded into graduated glass pipettes (Drummond Scientific Company, Broomall, PA, USA), and placed into an electrode holder for pressure injection. The AAV-syn-GCaMP6s and AAV-syn-GCaMP6f vectors use the synapsin promoter, and therefore transduced neurons showing higher tropism for the AAV 2/9 subtype, and to a much lesser extent neurons that show low tropism for AAV 2/9 within the injection site, e.g. facial motoneurons, they do not transduce non-neuronal cells. Vector AAV SERT-GCaMP6s was specific for serotonergic neurons.
Viral transfection of RTN, Raphe and pFL neurons
Request a detailed protocolAdult male C57BL/6 mice (20–30 g) were anaesthetized with isofluorane (4%; Piramal Healthcare Ltd, Mumbai, India) in pure oxygen (4 L·min–1). Adequate anaesthesia was maintained with 0.5–2% Isofluorane in pure oxygen (1 L·min–1) throughout the surgery. Mice received a presurgical subcutaneous injection of atropine (120 µg·kg–1; Westward Pharmaceutical Co., Eatontown, NJ, USA) and meloxicam (2 mg·kg–1; Norbrook Inc, Lenexa, KS, USA). Mice were placed in a prone position into a digital stereotaxic apparatus (Kopf Instruments, Tujunga, CA, USA) on a heating pad (TCAT 2-LV: Physitemp, Clifton, NJ, USA) and body temperature was maintained at a minimum of 33°C via a thermocouple. The head was levelled at bregma, and 2 mm caudal to bregma, and graduated glass pipettes containing the virus were placed stereotaxically into either the RTN, rostral medullary raphe or pFL (Figures 2A, 5A and 7A). The RTN was defined as the area ventral to the caudal half of the facial nucleus, bound medially and laterally by the edges of the facial nucleus (coordinates with a 9⁰ injection arm angle: –1.0 mm lateral and –5.6 mm caudal from Bregma, and –5.5 mm ventral from the surface of the cerebellum; Figure 2A). The Raphe was defined as the medial, TPH containing regions level with the caudal face of the facial nucleus: the Raphe Magnus (RMg) was directly above the pyramidal tracts (Py), and the Raphe Pallidus (RPa) was bound laterally by the Py (coordinates with a 9⁰ injection arm angle: 0 mm lateral and –5.8 mm caudal from Bregma, and –5.2 mm ventral from the surface of the cerebellum; Figure 5A). The pFL was defined as the neurons bound laterally by the spinothalmic tract and medially by the lateral edge of the facial motor nucleus (coordinates with a 9⁰ injection arm angle: –1.8 mm lateral and –5.55 mm caudal from Bregma, and –4.7 mm ventral from the surface of the cerebellum; Figure 7A). The virus solution was pressure injected (<300 nL) unilaterally. Pipettes were left in place for 3–5 min to prevent back flow of the virus solution up the pipette track. Postoperatively, mice received intraperitoneal (IP) injections of buprenorphine (100 µg·kg–1; Reckitt Benckiser, Slough, UK). Mice were allowed 2 weeks for recovery and viral expression, with food and water ad libitum.
GRIN lens implantation
Request a detailed protocolMice expressing GCaMP6 were anesthetized with isofluorane, given pre-surgical drugs, placed into a stereotax, and the head was levelled as described above. To widen the lens path whilst producing the least amount of deformation of tissue, a graduated approach was taken; firstly a glass pipette was inserted down the GRIN lens path to a depth 200 µm above where the lens would terminated and left in place for 3 min; this procedure was then repeated with a blunted hypodermic needle. The GRIN lens (600 µm diameter, 7.3 mm length; Inscopix, Palo Alto, CA, USA) was then slowly inserted at a rate of 100 µm·min–1 to a depth ~1300 µm above the target site, then lowered at a rate of 50 µm·min–1 to a depth ~300 µm above the RTN, Raphe or pFL (coordinates with a 9⁰ injection arm angle: RTN – 1.1 mm lateral and –5.75 mm caudal from Bregma, and –5.3 mm ventral from the surface of the cerebellum; Raphe – 0 mm lateral and –5.95 mm caudal from Bregma, and –5.1 mm ventral from the surface of the cerebellum; pFL – 1.7 mm lateral and –5.7 mm caudal from Bregma, and –4.6 mm ventral from the surface of the cerebellum). The lens was then secured in place with SuperBond (Prestige Dental, Bradford, UK). Postoperatively, mice received buprenorphine, and were allowed 2 weeks for recovery, with food and water ad libitum.
Baseplate installation
Request a detailed protocolMice expressing GCaMP6 and implanted with GRIN lens were anesthetized with isofluorane, given pre-surgical drugs, and placed into a stereotax as described above. To hold the miniaturized microscope during recordings, a baseplate was positioned over the lens and adjusted until the cells under the GRIN lens were in focus. The baseplate was then secured with superbond, and coated in black dental cement (Vertex Dental, Soesterberg, the Netherlands) to stop interference of the recording from ambient light. Mice were allowed 1 week for recovery, with food and water ad libitum.
Ca2+ imaging in freely moving mice
Request a detailed protocolAll mice were trained with dummy camera and habituated to plethysmography chamber at least twice before imaging. The miniature microscope with integrated 475 nm LED (Inscopix, Palo Alto, CA, USA) was secured to the baseplate. GCaMP6 fluorescence was visualised through the GRIN lens, using nVista 2 HD acquisition software (Inscopix, Palo Alto, CA, USA). Calcium fluorescence was optimised for each experiment so that the histogram range was ~150–600, with average recording parameters set at 10–20 frames/sec with the LED power set to 10–20 mW of light and a digital gain of 1.0–4.0. A TTL pulse was used to synchronize the calcium signalling to the plethysmography trace. All images were processed using Inscopix data processing software (Inscopix, Palo Alto, CA, USA). GCaMP6 movies were ran through: preprocessing algorithm (with temporal downsampling), crop, spatial filter algorithm (0.005–0.5 Hz), motion correction and cell identification through manual regions of interest (ROIs) operation to generate the identified cell sets. Cell sets were imported into Spike2 software for processing.
Plethysmography
Request a detailed protocolMice were placed into a custom-made 0.5 L plethysmography chamber, with an airflow rate of 1 l·min–1. The plethysmography chamber was heated to 31 °C (thermoneutral for C57/BL6 mice). CO2 concentrations were sampled via a Hitech Intruments (Luton, UK) GIR250 Dual Sensor Gas analyzer or ML206 gas analyzer (ADinstruments, Sydney, Australia) connected to the inflow immediately before entering the chamber. The analyser had a delay of ~15–20 sec to read-out the digital output of gas mixture. Pressure transducer signals and CO2 measurements were amplified and filtered using the NeuroLog system (Digitimer, Welwyn Garden City, UK) connected to a 1401 interface and acquired on a computer using Spike2 software (Cambridge Electronic Design, Cambridge, UK). Video data was recorded with Spike2 software and was synchronised with the breathing trace. Airflow measurements were used to calculate: tidal volume (VT: signal trough at the end of expiration subtracted from the peak signal during inspiration, converted to mL following calibration and normalized to body weight), and respiratory frequency (fR: breaths per minute). Minute ventilation (VE) was calculated as VT x fR.
Hypercapnia in freely behaving mice
Request a detailed protocolInstrumented mice were allowed ~30 mins to acclimate to the plethysmograph. The LED was activated through a TTL pulse synchronised with the Spike2 recording and 1 or 3 min of baseline recordings were taken (gas mixture: 0% CO2 21% O2 79% N2). The mice were then exposed to 3 min epochs of hypercapnic gas mixture at different concentrations of CO2: RTN and Raphe transduced mice were exposed to 3% followed by 6% CO2, and pFL transduced mice were exposed to 6% followed by 9% CO2. All gas mixtures contained 21% O2 balanced N2. Following exposure to the hypercapnic gas mixtures, CO2 levels were reduced back to 0% and calcium signals were recorded for a further 3–4 minutes recovery period.
Hypercapnia and seizure induction in urethane anaesthetised mice
Request a detailed protocolInstrumented mice were anaesthetised with an IP injection of 1.2–1.5 g·kg-1 urethane (Sigma-Aldrich, St Louis, MO, USA) and placed into the plethysmograph. For recording responses of RTN neurons to hypercapnia, the LED was activated and 1 or 3 minute of baseline recording was taken. The mice were then exposed to 2 or 3 minute epochs of hypercapnic gas mixture 3%, 6% and 9% CO2 (in 21% O2 balanced N2) sequentially, as experiments into the chemosensitivity of RTN neurons in mice often use 6% CO2 in freely behaving experiments but 9% CO2 in anaesthetised animals. Following exposure to the hypercapnic gas mixtures, CO2 levels were reduced back to 0% and calcium signals were recorded for a further 3 minute recovery period.
For neurons recorded in the RTN, after completion of hypercapnic responses and a period of rest, baseline Ca2+ activity was recorded for 5 min. The mice were then injected with a dose of kainic acid (8 mg·kg–1 IP) sufficient to induce an electrographic seizures in the absence of any movement from behavioural seizures. Following injection of kainic acid, calcium activity was recorded every alternate 5 min to avoid the fluorophore bleaching and concurrently record the calcium activity for a long enough to evidence the effect of induction of seizure on the activity of RTN neurons (at least for 90 min post kainic acid injection).
Preparation of fixed brain slices
Request a detailed protocolMice were humanely killed by pentobarbital overdose (>100 mg·kg−1) and transcardially perfused with paraformaldehyde solution (4% PFA; Sigma-Aldrich, St Louis, MO, USA). The head was removed and postfixed in PFA (4 °C) for 3 days to preserve the lens tract. The brains were removed and postfixed in PFA (4 °C) overnight. Brainstems were serially sectioned at 50–70 μm.
Immunohistochemistry
Request a detailed protocolFree-floating sections were incubated for 1 hr in a blocking solution (PBS containing 0.1% Triton X-100 and 5% BSA). The tissue was then incubated overnight at room temperature in primary antibodies: goat anti-choline acetyl transferase [ChAT; 1:100; Millipore, Burlington, MA, USA] alone for co-labelling with GCaMP6, or rabbit anti-tryptophan hydroxylase [TPH; 1:500; Sigma-Aldrich, St Louis, MO, USA] alone for co-labelling with GCaMP6.
Slices were washed in PBS (6 × 5 min) and then incubated in a blocking solution to which secondary antibodies were added; donkey anti-rabbit Alexa Fluor 594 (1:250; Jackson Laboratory, Bar Harbor, ME, USA) for co-labelling with GCaMP6, or donkey anti-goat Alexa Fluor 594 (1:250; Jackson Laboratory, Bar Harbor, ME, USA; RTN) for co-labelling with GCaMP6 in RTN tissue or donkey anti-goat Alexa Fluor 568 (1:250; Jackson Laboratory, Bar Harbor, ME, USA) for co-labelling with GCaMP6 in pFL tissue. The tissue was then incubated 2–4 hr at room temperature. Tissue was washed in PBS (6 × 5 min). Slices were mounted on polysine adhesion slides and were coverslipped with Vectashield Antifade Mounting Medium with DAPI (Vectorlabs, Burlingame, CA, United States).
Heat-induced epitope retrieval and immunohistochemistry for NMB
Request a detailed protocolSlices were mounted onto poly-lysine coated microscope slides and allowed to dry and adhere. Mounted brain sections were added to the pre-heated sodium citrate antigen retrieval buffer (10 mM sodium citrate, 0.05% Tween 20, pH 9.0) and incubated for 15 min. The mounted brain sections were then removed and washed in PBS.
The tissue was then incubated for 1 hr in a blocking solution. Without washing, the tissue was then incubated overnight at room temperature in blocking solution containing primary antibodies: (goat anti-ChAT [same as above] alone for co-labelling with GCaMP6, or in conjunction with rabbit anti-Neuromedin-B [NMB; 1:100; SAB1301059; Sigma-Aldrich, St Louis, MO, USA] antibody) for co-labelling of ChAT and NMB.
The tissue was then washed in PBS (6 × 5 min) and incubated for 1 hr in a blocking solution. Without washing, the tissue was then incubated 2 hr at room temperature in blocking solution containing secondary antibodies: donkey anti-rabbit Alexa Fluor 568 (1:250; Invitrogen, Waltham, MA, United States) for co-labelling with GCaMP6, or donkey anti-rabbit Alexa Fluor 488 (1:250; Invitrogen, Waltham, MA, United States) and donkey anti-goat Alexa Fluor 594 (1:250; Invitrogen, Waltham, MA, United States) for co-labelling of ChAT and NMB. Tissue was washed in PBS (6 × 5 min).
Slides were examined using a Zeiss 880 confocal microscope with ZEN acquisition software (Zeiss, Oberkochen, Germany).
Antibody specificity
Request a detailed protocolThe antibodies that we used have been independently validated by others in the field: anti-ChAT (Dempsey et al., 2015; Saunders et al., 2015; Zhang et al., 2020); anti-TPH (Pitzer et al., 2015; Quina et al., 2020; Zhong et al., 2017) 1; and anti-NMB (Li et al., 2016). The staining patterns we report are highly consistent with these prior studies indicating that these antibodies are specifically recognising their targets with the tissue we have examined. Additionally, we compared NMB immunostaining with in situ hybridization patterns for NMB documented in the Allen Brain Atlas and found it to be very similar (Figure 2—figure supplement 1).
Data availability
All data generated or analysed during this study are included in the MS and supporting files. Source data files have been provided for Figure 3D, Figure 7I–K, Figure 1—figure supplement 7, and Figure 4—figure supplement 2.
References
-
Perinatal fluoxetine exposure impairs the CO2 chemoreflex. Implications for sudden infant death syndromeAmerican Journal of Respiratory Cell and Molecular Biology 55:368–376.https://doi.org/10.1165/rcmb.2015-0384OC
-
Recording, labeling, and transfection of single neurons in deep brain structuresPhysiological Reports 3:e12246.https://doi.org/10.14814/phy2.12246
-
Hypercapnic ventilatory response in sleeping adultsAmerican Review of Respiratory Disease 126:758–762.https://doi.org/10.1164/arrd.1982.126.5.758
-
Central respiratory chemoreceptionThe Journal of Comparative Neurology 518:3883–3906.https://doi.org/10.1002/cne.22435
-
Activity of tachykinin1-expressing pet1 raphe neurons modulates the respiratory chemoreflexThe Journal of Neuroscience 37:2016.https://doi.org/10.1523/JNEUROSCI.2316-16.2016
-
Co2-dependent opening of an inwardly rectifying K+ channelPflugers Archiv 461:337–344.https://doi.org/10.1007/s00424-010-0916-z
-
Redefining the components of central CO2 chemosensitivity -- towards a better understanding of mechanismThe Journal of Physiology 589:5561–5579.https://doi.org/10.1113/jphysiol.2011.214759
-
Role of parafacial nuclei in control of breathing in adult ratsThe Journal of Neuroscience 35:1052–1067.https://doi.org/10.1523/JNEUROSCI.2953-14.2015
-
CO2-inhibited neurons in the medullary raphé are GABAergicRespiratory Physiology & Neurobiology 203:28–34.https://doi.org/10.1016/j.resp.2014.07.016
-
Functional brain stem circuits for control of nose motionJournal of Neurophysiology 121:205–217.https://doi.org/10.1152/jn.00608.2018
-
Acid sensitivity and ultrastructure of the retrotrapezoid nucleus in phox2b-EGFP transgenic miceThe Journal of Comparative Neurology 517:69–86.https://doi.org/10.1002/cne.22136
-
Hypercapnia-induced active expiration increases in sleep and enhances ventilation in unanaesthetized ratsThe Journal of Physiology 596:3271–3283.https://doi.org/10.1113/JP274726
-
Intrinsic and synaptic mechanisms controlling the expiratory activity of excitatory lateral parafacial neurones of ratsThe Journal of Physiology 599:4925–4948.https://doi.org/10.1113/JP281545
-
The sniff is part of the olfactory perceptChemical Senses 31:181–196.https://doi.org/10.1093/chemse/bjj012
-
Respiratory control by ventral surface chemoreceptor neurons in ratsNature Neuroscience 7:1360–1369.https://doi.org/10.1038/nn1357
-
Active expiration induced by excitation of ventral medulla in adult anesthetized ratsThe Journal of Neuroscience 31:2895–2905.https://doi.org/10.1523/JNEUROSCI.5338-10.2011
-
Breathing without CO (2) chemosensitivity in conditional PHOX2B mutantsThe Journal of Neuroscience 31:12880–12888.https://doi.org/10.1523/JNEUROSCI.1721-11.2011
-
Response to CO2 of neurons in the rostral ventral medulla in vitroJournal of Neurophysiology 73:933–944.https://doi.org/10.1152/jn.1995.73.3.933
-
Afferent and efferent connections of the rat retrotrapezoid nucleusThe Journal of Comparative Neurology 499:64–89.https://doi.org/10.1002/cne.21105
-
Neuromedin B expression defines the mouse retrotrapezoid nucleusThe Journal of Neuroscience 37:11744–11757.https://doi.org/10.1523/JNEUROSCI.2055-17.2017
-
Distinct pathways to the parafacial respiratory group to trigger active expiration in adult ratsAmerican Journal of Physiology-Lung Cellular and Molecular Physiology 317:L402–L413.https://doi.org/10.1152/ajplung.00467.2018
-
GABAergic neurons of the medullary raphe regulate active expiration during hypercapniaJournal of Neurophysiology 123:1933–1943.https://doi.org/10.1152/jn.00698.2019
-
Odorant-induced and sniff-induced activation in the cerebellum of the humanThe Journal of Neuroscience 18:8990–9001.https://doi.org/10.1523/JNEUROSCI.18-21-08990.1998
-
Breathing regulation and blood gas homeostasis after near complete lesions of the retrotrapezoid nucleus in adult ratsThe Journal of Physiology 596:2521–2545.https://doi.org/10.1113/JP275866
-
Expression of PHOX2B by brainstem neurons involved in chemosensory integration in the adult ratThe Journal of Neuroscience 26:10305–10314.https://doi.org/10.1523/JNEUROSCI.2917-06.2006
-
Galanin is a selective marker of the retrotrapezoid nucleus in ratsThe Journal of Comparative Neurology 512:373–383.https://doi.org/10.1002/cne.21897
-
Properties of cutaneous mechanoreceptors in the human hand related to touch sensationHuman Neurobiology 3:3–14.
-
The hippocampus as an olfacto-motor mechanism: were the classical anatomists right after all?Behavioural Brain Research 127:25–47.https://doi.org/10.1016/s0166-4328(01)00354-0
-
Response of serotonergic caudal raphe neurons in relation to specific motor activities in freely moving catsThe Journal of Neuroscience 15:5346–5359.https://doi.org/10.1523/JNEUROSCI.15-07-05346.1995
-
Phox2b-expressing retrotrapezoid neurons are intrinsically responsive to H+ and CO2The Journal of Neuroscience 33:7756–7761.https://doi.org/10.1523/JNEUROSCI.5550-12.2013
-
Receptors in the trachea and bronchi of the catThe Journal of Physiology 123:71–104.https://doi.org/10.1113/jphysiol.1954.sp005034
-
Learning and stress shape the reward response patterns of serotonin neuronsThe Journal of Neuroscience 37:8863–8875.https://doi.org/10.1523/JNEUROSCI.1181-17.2017
-
Miniature microscopes for large-scale imaging of neuronal activity in freely behaving rodentsCurrent Opinion in Neurobiology 32:141–147.https://doi.org/10.1016/j.conb.2015.04.001
-
Interaction between the retrotrapezoid nucleus and the parafacial respiratory group to regulate active expiration and sympathetic activity in ratsAmerican Journal of Physiology. Lung Cellular and Molecular Physiology 315:L891–L909.https://doi.org/10.1152/ajplung.00011.2018
Decision letter
-
Jeffrey C SmithReviewing Editor; National Institute of Neurological Disorders and Stroke, United States
-
Catherine DulacSenior Editor; Harvard University, United States
-
Jeffrey C SmithReviewer; National Institute of Neurological Disorders and Stroke, United States
Our editorial process produces two outputs: (i) public reviews designed to be posted alongside the preprint for the benefit of readers; (ii) feedback on the manuscript for the authors, including requests for revisions, shown below. We also include an acceptance summary that explains what the editors found interesting or important about the work.
Decision letter after peer review:
Thank you for submitting your article "Analyzing the brainstem circuits for respiratory chemosensitivity in freely moving mice" for consideration by eLife. Your article has been reviewed by 3 peer reviewers, including Jeffrey C Smith as Reviewing Editor and Reviewer #1, and the evaluation has been overseen by Catherine Dulac as the Senior Editor.
The reviewers have discussed their reviews with one another, and the Reviewing Editor has drafted this to help you prepare a revised submission.
Essential revisions:
1) The authors should discuss more the technical limitations of their imaging approach. A major concern is whether the targeted regional neuronal and glial populations have been adequately sampled to reasonably understand the spatial and functional heterogeneity of the hypercapnic responses. There are important optical limitations as well as potential limitations associated with efficacy of cellular labeling with the vector constructs used. These are major caveats that need to be more thoroughly discussed in the context of technical limitations. The authors state for example that the GRIN lens placement was within the RTN (Discussion p. 10, para. 2) or terminated under the caudal pole of the facial nucleus (p. 6, para. 1) but the anatomical reconstructions consistently show the end of the lens in facial motor nucleus and in Methods (p. 17, para. 1), so as the authors discuss the coverage of the RTN populations may not be sufficient. The authors state that generally the lens was positioned ~300 µm above the regions to be imaged. Please provide information on the depth of field of the GRIN lens used and the typical field of view (including providing length scale bars on the cellular fluorescence images presented in the main text). Additional information on the viral transduction efficacy with the GCaMP constructs used is also essential.
2) Cell identification is another technical issue that needs to be addressed. It is critically important that the authors provide more convincing additional experimental data on the molecular identity of RTN neurons imaged to help with the interpretation of the results on this component. This should be done by employing an experimental strategy that allows for cell-type specific expression of GCaMP in RTN neurons (e.g., by using a Phox2b promoter), and/or by providing convincing additional quantification verifying that a high percentage of the GCaMP-expressing neurons imaged in the RTN region also express NMB and VGLUT2. For astrocytes and serotonin neurons, an attempt was made to restrict GCaMP expression to the targeted cell groups by using viruses including GFAP (gfaABC1D) or SERT promoters, but a non-specific neuronal promoter (synapsin) was used to drive GCaMP expression in RTN neurons or the pFL, with the obvious problem that the recordings were made from unidentified cells. Granted there is no specific marker for the pFL, but this approach is not justified for the RTN neurons. The molecular phenotype of CO2-sensitive RTN neurons has been well-established, and viral vectors using a Phox2b promoter have been employed for many years to preferentially target those RTN neurons. There are not a lot of RTN neurons (maybe 700-800 in mice) and there are many other neurons in the same region that likely were transduced with GCaMP and may account for the measured responses to CO2.
3) Information about specificity of the antibodies used should be provided, which is particularly important for the immunostaining for NMB and VGLUT2 used to suggest that some of the GCaMP-expressing parafacial cells were bona fide RTN neurons. There are no controls provided for the specificity of the antibody staining, and no references attesting to the quality of the antibodies, which should be standard practice (see Rhodes and Trimmer, J Neuroscience 2006; Saper, JCN, 2005; Saper and Sawchenko, ibid, 2003). Even if the staining were validated as specific for the relevant antigens, demonstrating that some of the GCaMP-expressing neurons were VGLUT2- and NMB-positive RTN neurons does not guarantee that the recorded cells were also RTN chemosensory neurons. This important caveat needs to be amplified in the text with appropriate disclaimers.
4) The authors need to explain more their interpretations of the measured GCaMP signals. For various neurons there may be a nonlinear relationship between theses signals and neuronal firing. For glia it is not clear that "activation" by hypercapnia would always cause a change in intracellular calcium, and yet signaling pathways could still be engaged that influence neighboring neurons. In addition, the authors need to explain why GCaMP6s was used for calcium activity imaging of RTN and Raphe neurons, whereas GCaMP6f was used for imaging astrocytes and pFL neurons. For comparisons of calcium dynamics between regions it is important that the same sensor is utilized which was done for the RTN region and Raphe neurons, but interpretation of what is being encoded by a particular sensor needs to take into account the sensor signaling kinetics. GCaMP6s kinetics produce long (many seconds) calcium signal decays after signal onset, which can for example contribute to features such as adaptation of the calcium dynamics imaged and would not accurately reflect neuronal activity profiles per se.
5) The authors should discuss more how they adequately ruled out movement artifacts affecting the calcium signals. The authors provide some evidence that the measured Ca transients are independent of movement, but the GFP signal measured in different mice is not the best and adequate control for movement artifacts in other GCaMP-expressing mice. Inscopix miniscopes are capable of dual color imaging to detect a co-expressed fluorescent marker in the same cell, which would be a better control.
6) The calcium signals are interpreted by the authors to reflect a variety of cellular response patterns, but there is no indication of how the authors verified consistency of these patterns, and this important issue needs to be addressed. Did the authors apply the CO2 challenges in repeated or alternately ordered fashion (0-3-6, 0-6-3) to more convincingly verify a consistent response in each individual cell? This is important information to include. This approach would also aid in dissociating common CO2-associated response patterns from any more randomly associated movement artifacts, for example by the use of peristimulus averaging to tease out signal from noise.
7) The authors suggest that tonic RTN neurons "provide tonic drive to the respiratory network." However, it is possible that these neurons are not respiratory. Just because they are in/near the RTN does not mean they are chemoreceptors. Please discuss more carefully.
8) There was little effect of CO2 on calcium signals in RTN astrocytes. The authors need to discuss if they imaged the astrocytes near the ventral medullary surface that have been most associated with CO2 activation and control of breathing. The authors also should indicate if they have independent histochemical evidence that the gfaABC1D promoter indeed restricted GCaMP expression to glial cells. Also, it is important to explain how they can conclude, based on the strength of the calcium signal, whether or not the astrocytes could play a functional role – at what threshold would they decide the signal is big enough, and on what would they base that decision. Is there any evidence that glial calcium levels need to rise in order for glia to influence neighboring neurons? Please discuss these issues.
9) The authors argue (page 6, 2nd paragraph) that the adapting responses of RTN neurons to hypercapnia match adaptation of VE in the WBP trace. This issue should be addressed in more detail. The data for this are very unconvincing. Instead there is a gradually increasing level of respiratory activity after switching to 3% and 6% CO2. In Figure 2H the WBP Av ReSm shows a similar result, with gradually increasing amplitude as CO2 level increases. The authors should expand the "WBP Av ReSm" trace in the vertical direction to more clearly show the increase in amplitude with time, and a horizontal line should be drawn at the baseline level to allow the reader to visualize the change in amplitude more clearly. When this is done, there is a clear ramp up of VE after changing to 3% CO2, and an even steeper increase with 6% CO2. This is opposite of the clear adaptation of calcium level in the "Average Waveform" trace in Figure 2H.
10) The imaging results for pFL neurons suggest that these cells did not exhibit sustained expiratory-related oscillatory activity in response to hypercapnia that would be predicted based on the concept of a conditional expiratory oscillator in the pFL. The nature of the transient expiratory events described and whether they are in anyway related to the hypercapnic challenge in unclear from the results presented in Figure 8. This issue should be addressed more thoroughly in the manuscript.
11) The authors conclude (page 15) that: "Raphe neurons tended to be active during the entire CO2 stimulus and conceivably these neurons are likely to take over from RTN neurons under pathophysiological levels of CO2." The logic of how the authors come to this conclusion should be explained. The data are more supportive of the opposite conclusion. 42% of raphe neurons respond with a graded or sustained increase in firing in response to a rise in CO2 of as little as 3%, whereas most RTN neurons rapidly adapt (in only 1-2 minutes) to 3% CO2 and don't increase to 6% CO2 (a level that strongly stimulates breathing). The data are more consistent with the conclusion that at low levels of CO2, RTN neurons would have little or no effect, while raphe neurons would be expected to provide continuous activation of the respiratory network across the whole CO2 range studied. But there are potentially major problems with identifying the relevant RTN chemosensory neurons as indicated above that are thought to generate graded and sustained responses to CO2. This issue should be discussed more thoughtfully, particularly in the context of new experimental data that may be obtained regarding the molecular phenotypic identity of the RTN neurons analyzed.
12) There should be an explicit discussion of the role of synaptic connectivity, and the authors should discuss the relationship of their results with data from more reduced preparations (about which there is little discussion). Synaptic inputs were intact and all responses that were measured were due to a combination of intrinsic responses, synaptic input and glial modulation. Some of the text seems to imply that the responses are all intrinsic, but this issue should be clarified.
13) There are numerous reporting details that should be included. How many mice were used for cell counts and from how many sections? Did cells with particular response patterns (or sniffs) come from different mice or the same mouse? How were they distributed among the mice used? Which results were from synapsin and SERT mice?
14) In the text (p. 4) description of Figure 1, please correct the references to panels D-F. The actual figure panels do not correspond to the text descriptions. Similarly, in the figure legend, correctly match the references to panels D-G. Please also check the y-axis labeling in panel D.
Reviewer #1 (Recommendations for the authors):
1) The authors have worked out the essential technical approaches required for deep brain fluorescence imaging of targeted regions in the medulla of freely behaving mice. The authors are attempting to draw functional conclusions with this imaging approach about chemosensory responses of neurons and glia in multiple important medullary regions that have been the focus of numerous studies. Understanding the details of how these types of cells respond in any of these regions in vivo, particularly in awake behaving animals, requires extensive work with this imaging approach for any region studied, beyond what the authors have presented. The observations presented here are nonetheless important for the field and provocative, but the major concern with this approach is whether the targeted regional neuronal and glial populations have been adequately sampled to reasonably understand the spatial and functional heterogeneity of the hypercapnic responses. There are important optical limitations as well as potential limitations associated with efficacy of cellular labeling with the vector constructs used. These are major caveats that need to be more thoroughly discussed in the context of technical limitations. The authors state that the GRIN lens placement was within the RTN (Discussion p. 10, para. 2) or terminated under the caudal pole of the facial nucleus (p. 6, para. 1) but the anatomical reconstructions consistently show the end of the lens in facial motor nucleus and in Methods (p. 17, para. 1), so as the authors discuss the coverage of the RTN populations may not be sufficient. The authors state that generally the lens was positioned ~300 µm above the regions to be imaged. Please provide information on the depth of field of the GRIN lens used and the typical field of view (including providing length scale bars on the cellular fluorescence images presented in the main text). Additional information on the viral transduction efficacy with the GCaMP constructs used would be helpful.
2) Another technical issue relates to the genetically encoded calcium sensors used for different experiments. The authors need to explain why GCaMP6s was used for calcium activity imaging of RTN and Raphe neurons, whereas GCaMP6f was used for imaging astrocytes and pFL neurons. For comparisons of calcium dynamics between regions it is important that the same sensor is utilized which was done so this is not an issue, but interpretation of what is being encoded by a particular sensor needs to take into account the sensor signaling kinetics. GCaMP6s kinetics produce long (many seconds) calcium signal decays after signal onset, which can for example contribute to features such as adaptation of the calcium dynamics imaged and would not accurately reflect neuronal activity profiles per se.
3) The imaging results for pFL neurons are of considerable interest since these cells did not exhibit sustained expiratory-related oscillatory activity in response to hypercapnia that would be predicted based on the concept of a conditional expiratory oscillator in the pFL. The nature of the transient expiratory events described and whether they are in anyway related to the hypercapnic challenge in unclear from the results presented in Figure 8. This issue needs to be addressed more thoroughly in the manuscript.
4) In the text (p. 4) description of Figure 1, please correct the references to panels D-F. The actual figure panels do not correspond to the text descriptions. Similarly, in the figure legend, correctly match the references to panels D-G. Please also check the y-axis labeling in panel D.
Reviewer #2 (Recommendations for the authors):
The authors should provide more discussion of the evidence supporting the conclusion that a high percentage of the neurons they recorded from were in the RTN and were Phox2b+/Neuromedin B+/vGluT2+.
Page 6, 2nd paragraph: The authors argue that the adapting responses of RTN neurons to hypercapnia match adaptation of VE in the WBP trace. The data for this are very unconvincing. Instead there is a gradually increasing level of respiratory activity after switching to 3% and 6% CO2. In Figure 2H the WBP Av ReSm shows a similar result, with gradually increasing amplitude as CO2 level increases. The authors should expand the "WBP Av ReSm" trace in the vertical direction to more clearly show the increase in amplitude with time, and a horizontal line should be drawn at the baseline level to allow the reader to visualize the change in amplitude more clearly. When this is done, there is a clear ramp up of VE after changing to 3% CO2, and an even steeper increase with 6% CO2. This is opposite of the clear adaptation of calcium level in the "Average Waveform" trace in Figure 2H.
None of the other WBP traces appear to show any evidence of adaptation. To better illustrate if there is adaptation, or conversely if there is a graded increase, the authors should include more examples of rectified and smoothed WBP traces (or VE) with expanded vertical scales and horizontal lines marking the baseline level.
The traces in Figures4H and 4I should be expanded in the y axis to better visualize the increase in calcium levels, and a horizontal line should be added denoting the baseline.
Page 8, 4th paragraph: The number of raphe glial cells with various types of responses should be stated.
Reviewer #3 (Recommendations for the authors):
There are numerous reporting details that should be included. How many mice were used for cell counts? and from how many sections? did cells with particular response patterns (or sniffs) come from different mice? or the same mouse? how were they distributed among the mice? which results were from synapsin and SERT mice?
[Editors’ note: further revisions were suggested prior to acceptance, as described below.]
Thank you for resubmitting your work entitled "Analyzing the brainstem circuits for respiratory chemosensitivity in freely moving mice" for further consideration by eLife. Your revised article has been evaluated by Catherine Dulac (Senior Editor) and a Reviewing Editor.
Your revisions have improved the manuscript, but some remaining critical issues need to be rigorously addressed in a more thoroughly revised manuscript, as outlined below:
Essential Revisions.
(1) The critical issue of identifying the recorded neurons as RTN neurons according to the current definition of these neurons based on their established molecular properties (particularly see Reviewer #3) remains a major problem. As indicated in the reviews, there are other approaches to address this issue. Despite the new neuromedin B immunostaining results, the authors have not implemented a strategy to establish that any particular GCaMP-imaged cell was an actual RTN neuron. Accordingly, the authors cannot directly relate the measured responses of individual neurons to any specific type of neuron in the region studied. The authors should employ an approach that defines the molecular identity of the neurons imaged. Without additional convincing neuronal labeling/identification information that RTN neurons (as currently defined in the literature) were imaged, the authors need to use different terminology for what they are calling "RTN neurons" (e.g., ventral/ventromedial parafacial neurons) to avoid confusion and misinterpretation by readers. This issue also needs to be thoroughly discussed in the manuscript.
(2) The authors should include a more thorough discussion of the problem of precisely interpreting what the measured calcium signals are encoding due to uncertain, possibly nonlinear, relationships between the signals recorded from various neurons and their neuronal firing patterns. This discussion should include the rationale for their selection of the GCaMP sensors used. The authors need to have a section at the beginning of the Discussion dealing with these technical aspects/limitations that may affect interpretations of their observations, including further addressing any potentially confounding effects of insufficient correction of signals for movement artifacts- an issue raised again in this review.
(3) The issue of the consistency of calcium dynamic response patterns for a given neuron with repeated measurements to establish whether a given neuron truly belongs to any particular group as classified. How the authors establish consistency by applying some specific metrics should be more thoroughly addressed. A more rigorous assessment of the response consistency in individual neurons would go a long way to address technical and interpretive problems (including those associated with movement artifacts).
(4) The authors need to rectify inconsistencies in the data presented and address questions about how they interpret some of their observations, as noted in the reviews.
(5) The authors should thoroughly address all other issues raised by the reviewers.
Reviewer #1 (Recommendations for the authors):
This revised paper provides supporting evidence demonstrating the technical application of deep endoscopic fluorescence imaging with head-mounted miniscopes and genetically encoded calcium sensors in awake behaving mice for multicellular calcium activity imaging from key medullary structures involved in respiratory control in freely behaving mice, which is novel and important for the respiratory neurobiology field. The authors address some of the major problems and concerns about characterizing multi-neuronal activity by dynamic calcium imaging within medullary regions (RTN, raphe magnus and pallidus nuclei, pFL) proposed to have important chemosensory functions for the regulation of respiratory responses and homeostatic control of breathing with hypercapnia.
They have revised the paper in a number of important aspects in response to the original reviews: (1) they have removed the data on astroglial calcium dynamics and now just focus on the neuronal datasets obtained from these regions; (2) they have addressed the technical issues related to the depth of field with the GRIN lens and miniscope system used, which is critical for understanding the adequacy of sampling calcium dynamics in the targeted neuronal populations; (3) they have provided additional information on the neuromedin B identity of the possibly imaged neurons, although there are still concerns about the specificity of the antibody labeling and how the molecular identity has been established for the imaged neurons; and (4) they have discussed more directly how their regional calcium imaging data may be reconciled with available information on electrophysiological behavior and its variability in different experimental approaches, including comparisons with measurements in their awake freely behaving mice vs measurements in anesthetized and in vitro cellular measurements.
Reviewer #2 (Recommendations for the authors):
This revised manuscript reports the results of GCaMP imaging of neurons from the RTN and raphe of unanesthetized mice using a mini-microscope to determine how hypercapnia affects neuronal calcium levels. The authors have made a number of major changes, including removing the data on glia.
There is a lot of potential in this approach to determine how neurons in these two regions respond to hypercapnia in vivo. However, as currently presented some errors have been introduced, there are some inconsistencies in the data, and there are new concerns about some artifacts contaminating some of the results. The authors also make some conclusions that are not supported by their data.
It is important for the authors to specifically state that for the two specific types of neurons of most interest here the authors cannot convert the size of the calcium signals measured to firing rate. The relationship between calcium levels and firing rate is unlikely to be linear and is likely to be different for the two neuron types. One or both neuron types may not increase calcium levels very much in response to an increase in firing rate. The relationship could only be determined by simultaneous imaging and extracellular recordings of spikes. The authors should discuss this issue.
Movement artifacts influencing the interpretation of results
There is serious concern that movement has confounded some of the data. The authors provide arguments against the role of movement in altering the results, but many neurons had to be excluded due to movement artifacts (Figure 1A), indicating it is sometimes a problem.
Line 155 – "[under anesthesia]…movement artifacts cannot be a potential confounding factor."
This statement is not true. Convulsive seizures involve a large amount of movement. This experiment was done without a paralytic agent, so it does not rule out movement as a cause of the calcium signal recorded in the neurons during seizures.
Figure 1 Figure Supplement 2 and 3
For several groups of neurons recorded from the same mice, the pattern of calcium transients is so nearly identical that it does not seem biologically plausible. For example, that is true for neurons from mouse 7 for the RTN EA group. It is also true for the top two traces for Figure 2H (both extracted from mouse 5 in Suppl figure2), and for mouse 6 for the Raphe I group. How can the authors verify that the calcium activity is due to an increase in firing rate in these examples, and not movement or other artifact shared across neurons recorded at the same time? It would be possible for neurons to have similar patterns of activity, but not to be essentially identical.
There are a number of inconsistencies in the data
Figure 1 Figure Supplement 2
The trace labeled "Average EA" (7th trace down from the top in 1st column) does not correspond with the individual traces shown, where there should be a transient increase in calcium upon exposure to CO2 instead of occurring midway through the 3% CO2 exposure.
Figure 2H – Why does the Average Waveform EA look different than the Average EA in Figure 1 Figure Supplement 2? Shouldn't they be the same?
There are several observations that are not consistent with the literature.
In Figure 2H, the VE trace shows adaptation in 3% CO2, but not in 6% CO2. In Figures 2H and 9C of the previous version of this paper, there was no adaptation at either CO2 level. The authors state on line 452 that adaptation to step changes in inspired CO2 is well known to occur in the literature, but they do not give a reference. I don't think that is true, with the existing literature instead showing a sustained increase in CO2 with continuous exposure to hypercapnia. The authors should cite literature if it exists.
Line 257 – "Only a minority of neurons, 13% (5/38), encoded the magnitude of hypercapnia."
The sizes of the responses were much less than expected based on previous literature. This should be mentioned.
Line 367 "…type 1 neurons … display an adapting response to acidification."
The data in Lazarenko et al., 2009 is very unconvincing for an adapting response, and therefore the analogy with the EA neurons is as well. Coupled with the fact that ventilation does not adapt in most literature in response to sustained hypercapnia, and other chemoreceptors do not adapt to CO2, I am not convinced that the EA neurons are important for chemoreception. There is also no clear mechanism for why neurons should adapt to 3% CO2 but not 6%.
Line 569 – "[raphe neurons] are likely to take over from RTN neurons under pathophysiological levels of CO2."
That conclusion is not consistent with the observation that nearly half of raphe neurons have a graded or sustained response to CO2 of only 3%. That is not a pathophysiological stimulus.
It should be pointed out that sampling of both groups of neurons was limited and the authors may have not recorded from all subtypes of neuron.
The authors left labels off of the axes of a number of figures, e.g. 3B, 4C (fR), 7G.
Figure 1 Figure Suppl 3 – The EA trace does not look convincingly adapting.
Reviewer #3 (Recommendations for the authors):
The authors have attempted to address the concerns from the previous reviews.
1. In dealing with the major issue of identifying the recorded neurons as RTN cells, the authors argue that the use of a PRSX8 promoter-driven viral approach was ineffective. But, this is not the only solution. An alternative is using a Phox2b-Cre mouse and a DIO virus for GCaMP delivery. These reagents are readily available and should be attempted if they want to say anything about RTN neurons.
2. The authors need to use different terminology for what they are calling RTN. The initial description of RTN neurons in cats was based on their projections to VRG (and a lesser extent, DRG; see Smith et al., 1989). Since then, the RTN cell group has been defined functionally and neurochemically with increasingly greater precision (e.g., Guyenet et al., 2019). In the current study, these authors have not convincingly demonstrated that the actual recorded cells meet any of the established criteria for being called RTN neurons. Therefore, they should follow the more general "parafacial" terminology to describe this region, and refer to these as "unidentified neurons located in the parafacial region."
3. There are issues remaining with respect to Nmb antibody validation and immunostaining. It is still the case that no experimental controls for the Nmb immunohistochemistry are provided in this paper.
Instead, two references are cited. In Yamagata et al. (eLife 2021), however, it appears that a different antibody was used (monoclonal antibody from Developmental Studies Hybridoma Bank) – rendering this an irrelevant citation. The Li et al. (Nature, 2014) citation indeed reports on the same polyclonal antibody used here, but they used it to detect Nmb-IR terminals in the preBötC (see Ext. Data Figure 2 in Li et al.) and not cell somata in the RTN. The problems of detecting neuropeptides in neuronal cell bodies by antibody staining are well recognized and the images provided are unconvincing. For example, there appears to be staining where one would expect to find few, if any, Nmb-expressing neurons – e.g., see upper right in current Figure 2D, just below the lens lesion. This is not to say that this Ab staining approach is impossible, but at least some validation is required. For example, the authors might combine IHC with FISH to demonstrate that the Nmb antibody specifically recognizes neurons that also express Nmb transcripts and, more importantly, that it does not non-specifically stain cells that do not express Nmb.
(It should be noted that, even with more appropriate validation, this strategy of post hoc identification will not be able to ensure that any particular GCaMP-imaged cell was an actual RTN neuron – i.e., no attempt is made to relate individual responsive neurons to the cells that were subsequently immunostained.)
4. The issue of response "patterns" remains. The post hoc grouping of different neurons selected for similar responses to use for averaging (Figure 1, Supp. 2) does not say anything about whether the response in an individual neuron represents its own characteristic "pattern." It is circular reasoning to select neurons based on a type of response to the stimulus, and then view the averaged data from those pre-selected neurons aligned to the stimulus as evidence for a consistent "pattern."
Moreover, the new anecdotal data presented of recordings from the same cell over multiple days (Figure 1, Supp. 5) with no analysis beyond the "eye test" is unconvincing and does not adequately address this issue. What precisely does it mean to say that "activity patterns were remarkably similar between separate recording sessions" when no quantification is provided to assess that professed similarity. Why not simply repeat the stimulus protocol and verify a consistent response pattern?
5. Aside from issues with the data mentioned above, it is worth pointing out that some of the interpretations presented in the Discussion are questionable and/or fail to adequately consider the existing literature. A few examples are provided below.
As mentioned in the previous review, the responses recorded (and any associated response properties such as graded, adapting, etc.) could represent either an intrinsic sensory response or a complex amalgam of the presumed intrinsic property with extrinsic inputs to the recorded neuron. Although the authors claim to have clarified this at various points in the text (e.g., one instance is noted on p. 13, when discussing CO2-inhibited raphe neurons), a reader is likely to get the overall sense from the presentation that the responses are mostly presumed to be intrinsic (e.g., with phrasing such as "cells encoded the level of inspired CO2.") An explicit acknowledgement of this interpretive confound, which is unavoidably inherent to studies that correlate neuronal activity with behavior, should be provided at the outset of the Discussion (preferably in a general standalone section that deals with the various experimental and interpretive limitations.)
The statements that: "The majority of evidence for the involvement of the RTN, and in particular the Phox2B+ neurons, in CO2 chemoreception comes from neonatal or young juvenile animals" and "much of prior evidence for RTN chemosensory responses depends heavily on recordings from anaesthetized animals" ignores strong evidence from the Guyenet group for RTN involvement in CO2 responses of unanesthetized adult rodents (e.g., Basting et al., 2015).
Further, the suggestion that a normal developmental feature is that "chemosensory response becomes less dependent on Phox2B+ neurons of the RTN by 3 months of age" is based on a study that examined adaptations following genetic RTN destruction – hardly a normal developing mouse – and it ignores the profound effects of acute RTN neuron ablation in adult rats on chemosensory responses (Souza et al., 2018). A more balanced interpretation of the present results that considers all the relevant literature is advisable.
As a final example, it would appear to be a stretch to relate E-A and E-G responses in vivo to two types of RTN neurons recorded in vitro, based apparently on a visual inspection ("careful examination") of a few example cells presented in figures from other papers in which those particular response characteristics were neither identified nor characterized. It does not seem appropriate to build a substantial and speculative part of the discussion on this subjective interpretation from those example cells.
[Editors’ note: further revisions were suggested prior to acceptance, as described below.]
Thank you for resubmitting your work entitled "Analyzing the brainstem circuits for respiratory chemosensitivity in freely moving mice" for further consideration by eLife. Your revised article has been evaluated by Catherine Dulac (Senior Editor) and a Reviewing Editor.
The manuscript has been improved but there are some remaining issues that need to be addressed, as outlined below:
Essential Revisions:
The reviewers appreciate that the authors have responded to many of the previous points of major concern raised. The authors' novel catalog and analyses of multicellular neuronal calcium dynamics in the freely behaving mouse during hypercapnia are a valuable contribution to the field, including by illustrating the feasibility and paving the way for further development/application of this imaging approach, while indicating its limitations. However, there are some concerns that should be further addressed.
1) There is still a serious concern that there is a problem with precisely interpreting what the measured calcium signals are encoding due to uncertain, possibly nonlinear, relationships between calcium imaging from various neurons and their firing rate/pattern. The authors respond to this criticism by saying: "… the dynamics of the Ca2+ signal are likely to reflect the dynamics of firing. We can be confident that when the firing rate increases, intracellular Ca2+ will also increase." While this has been shown for some types of neurons (especially hippocampal and neocortical neurons), the reviewers are not aware that it has been shown for RTN or raphe neurons, and the authors offer no evidence for that. There are many mechanisms by which calcium levels could become dissociated from the firing rate. For example, in some neurons calcium levels may be relatively insensitive to an increase in firing rate due to low calcium current density or a high level of calcium buffering. An increase in firing rate or intracellular acidosis could have a stimulatory effect on calcium extrusion or sequestration. The "adaptation" of calcium levels the authors point out may reflect augmentation of calcium regulation rather than adaptation of firing rate. The response/decay kinetics of GCaMP6s is also a problem in terms of encoding the temporal characteristics of neuronal firing (e.g., Dana et al. Nat Methods 16, 649-657, 2019). A disconnect between calcium levels and firing rate could also explain why some neurons did not have a linear response to a graded increase to CO2 – their firing rate may have increased linearly while calcium levels fell off. The authors say they "have never attempted to convert Ca2+ signals to firing rate," but they lead the reader to believe that their measurements reflect neuronal firing rate/patterns throughout the paper by describing their measurements of calcium fluorescence as "activity of neurons", "neuronal firing", "activity patterns", or "activity." Neurons were categorized as Inhibited, Excited, or Tonic. Neurons are described as being "silenced." All of these terms lead the reader to think that the measurements presented are reliable surrogates of neuronal electrophysiological activity. The authors state that "the use of Ca2+ as a proxy for activity is widely accepted." That doesn't make it right. The authors need to be more precise in their terminology throughout the text. They are measuring calcium signals, not necessarily firing rate/activity patterns.
2) The authors' responses have not adequately addressed the major and overarching concerns that: a) the recordings were ultimately from unidentified RTN neurons even if we allow that they were in the region of the RTN; and, b) we cannot know whether the recorded responses were a true characteristic CO2 response of the recorded neurons without repeated measurements in the same neurons (as opposed to some random fluorescence changes that were found represented among the population of recorded cells in different mice). The authors need to emphasize these problems more clearly in the manuscript.
3) Reviewer #3 still questions the specificity of the NMB immunostaining. While it is appreciated that the authors tried to match their immunolabeling with the Allen Brain Atlas, this is unconvincing and appears to be mostly comparisons of the type of non-specific labeling that is often seen in areas of high cell density (e.g., Figure 2, Figure Suppl. 1, Panel Ei, cortex; Panel Eii, piriform cortex). The most obvious example they provide of "real" strong in situ labeling from the Allen Atlas is in Panel Eii (in the hilus of the dentate gyrus?) – and in this case, the NMB immunostaining they show is not any stronger than the non-specific labeling noted above.
Other specific issues that should be addressed:
1) Abstract, lines 26-28. Given the authors' acknowledgements of the potential limitations of their calcium signal measurements in terms of encoding temporal patterns of neuronal activity, the statement that their "analysis revises understanding of chemosensory control in awake adult mouse" should be modified.
2) Introduction: "brain imaging techniques have been developed to allow recording of activity of defined cell populations in awake, freely-moving animals … require: the expression of genetically encoded Ca2+ indicators such as GCaMP6 in the relevant neurons …" This specific requirement was not met for the RTN since there was no "defined cell population" targeted with the GCaMP6. Consider rewording.
3) Page 5, lines 151-153: "When we were able to identify the same neurons their activity patterns were remarkably similar between separate recording sessions (Figure 1—figure supplement 6)." This cursory analysis, based on a few neurons, is not very convincing. The need for repeated measurements of the same neuron to be sure about the characteristic dynamic pattern of the calcium signal should be clearly stated in the limitations section in the Discussion.
4) Line 369: "are reproducible between recording sessions from a single mouse …" Change to "are reproducible across the imaged neuronal population between recording sessions from a single mouse" to clarify that these general activity patterns were observed, but not within the same individual neurons.
5) There seem to be two different definitions applied for the EA subtype of response. For one, they responded to the initial increase in inspired CO2 but did not maintain their activation, and for the other, they respond to 3% CO2 more robustly than 6% CO2. Are these the same?
6) Lines 447-448: "Chemosensory responses become less dependent on Phox2B+ neurons of the RTN by 3 months of age (Ramanantsoa et al., 2011) … should add "when those neurons are genetically ablated" or some such qualifier.
7) Line 515: This statement should include a reference to Cleary et al. (PMID: 34013884), in which CO2-inhibited SST-expressing interneurons were recorded in the parafacial (RTN) region. This paper should also be cited with reference to the diversity of neuronal subtypes in that region, many of which may have been sampled in the current GCaMP6 recordings.
8) Page 15, para. 1 and 2 and Figure 8. The calcium signal measurements presented in this paper and summarized in panel C do not directly provide information on neuronal firing patterns and associated synaptic interactions implied in these diagrams. Given the uncertainty, the authors should emphasize that the regional interactions postulated are based on what is generally proposed in the literature, and it is currently unknown if any specific type of neuron that the authors have classified from the calcium signals and represented in the diagram has the connections indicated. Some readers may find these diagrams excessively speculative.
9) Line 619: "The neuronal responses to CO2 were more heterogeneous in both the RTN and Raphe than would be expected from the prior literature" should be clarified to state that "The neuronal responses to CO2 were heterogeneous for unidentified neurons in the RTN and for serotonergic neurons in Raphe."
https://doi.org/10.7554/eLife.70671.sa1Author response
Essential revisions:
1) The authors should discuss more the technical limitations of their imaging approach. A major concern is whether the targeted regional neuronal and glial populations have been adequately sampled to reasonably understand the spatial and functional heterogeneity of the hypercapnic responses. There are important optical limitations as well as potential limitations associated with efficacy of cellular labeling with the vector constructs used. These are major caveats that need to be more thoroughly discussed in the context of technical limitations. The authors state for example that the GRIN lens placement was within the RTN (Discussion p. 10, para. 2) or terminated under the caudal pole of the facial nucleus (p. 6, para. 1) but the anatomical reconstructions consistently show the end of the lens in facial motor nucleus and in Methods (p. 17, para. 1), so as the authors discuss the coverage of the RTN populations may not be sufficient. The authors state that generally the lens was positioned ~300 µm above the regions to be imaged. Please provide information on the depth of field of the GRIN lens used and the typical field of view (including providing length scale bars on the cellular fluorescence images presented in the main text). Additional information on the viral transduction efficacy with the GCaMP constructs used is also essential.
We thank the reviewers for raising these important issues.
Optical characteristics of GRIN lens
We appreciate that the optical characteristics are a key point in the interpretation of our data.
The GRIN lens has a diameter of 600 µm and ample evidence in the literature shows that it has a focal plane that is ~300 µm below the lens as described in these references:
Resendez SL, Jennings JH, Ung RL, Namboodiri VM, Zhou ZC, Otis JM, et al. Visualization of cortical, subcortical and deep brain neural circuit dynamics during naturalistic mammalian behavior with head-mounted microscopes and chronically implanted lenses. Nat Protoc. 2016;11(3):566-97. Table-2
Jennings JH, Ung RL, Resendez SL, Stamatakis AM, Taylor JG, Huang J, et al. Visualizing hypothalamic network dynamics for appetitive and consummatory behaviors. Cell. 2015;160(3):516-27. Figure-4
However, given this is such a key point, we have imaged fluorescent beads to document this for the lenses we used in this study (now included as Figure 1 Figure Supplement 1). It is possible to adjust the focal plane of the lens by winding the camera back on its turret from the end of the lens (which moves the focal plane deeper into the tissue). We have therefore documented the focal plane and depth under two conditions -a turret setting of 0 turns (i.e. camera is against the end of the GRIN lens, and the focal plane is at its closest to the lens) and a maximum turret setting of 4 turns (i.e the camera is far from the end of the GRIN lens as it can be, and the focal plane is at its farthest). The imaging of the beads shows that at a turret setting of 0, the focal depth (in which the beads are sharply focussed) extends from 150-250 µm below the end of the lens, and for a turret setting of 4 this has been moved from 350-450 µm below the end of the lens. We kept a record of the turret settings for every recording and have added this into the data description and this gives the approximate depth of focus for every image. The text on pp 3 has been modified to explain this.
Even though anatomical reconstructions show the end of the lens in facial motor nucleus, the lens extends on either end of the shown anatomical reconstruction and covers the caudal pole of the facial nucleus, and the focal plane will be ventral to the facial nucleus. In the figure panels where we show lens placement we now include a box which shows the range of focal depths in which we expect to image cells. Our additional analysis suggests that in most cases we were indeed able to image from the ventral surface of the medulla.
Field of view was same in all the recordings- "width" 1440 and "height" 1080 pixels. We have added scale bars as requested to the GRIN lens images.
Transduction efficacy
We have addressed this by giving Venn diagrams for GCaMP expression versus different markers in Figures2, 5 and 9. We show a low percentage of ChAT (9/66), and a high percentage of NMB (40/93) and TPH (57/83) cells transduced by GCaMP.
Additionally, the numbers of cells that we recorded (i.e. within the imaging field) were as follows:
9 mice for RTN with hSyn promoter 122 neurons transduced ~14 neurons/mouse
6 mice for Raphe with hSyn or SERT promoter 41 neurons transduced ~7 neurons/mouse
3 mice pFL with hSyn promoter, 31 neurons transduced ~10 neurons/mouse
2) Cell identification is another technical issue that needs to be addressed. It is critically important that the authors provide more convincing additional experimental data on the molecular identity of RTN neurons imaged to help with the interpretation of the results on this component. This should be done by employing an experimental strategy that allows for cell-type specific expression of GCaMP in RTN neurons (e.g., by using a Phox2b promoter), and/or by providing convincing additional quantification verifying that a high percentage of the GCaMP-expressing neurons imaged in the RTN region also express NMB and VGLUT2. For astrocytes and serotonin neurons, an attempt was made to restrict GCaMP expression to the targeted cell groups by using viruses including GFAP (gfaABC1D) or SERT promoters, but a non-specific neuronal promoter (synapsin) was used to drive GCaMP expression in RTN neurons or the pFL, with the obvious problem that the recordings were made from unidentified cells. Granted there is no specific marker for the pFL, but this approach is not justified for the RTN neurons. The molecular phenotype of CO2-sensitive RTN neurons has been well-established, and viral vectors using a Phox2b promoter have been employed for many years to preferentially target those RTN neurons. There are not a lot of RTN neurons (maybe 700-800 in mice) and there are many other neurons in the same region that likely were transduced with GCaMP and may account for the measured responses to CO2.
The PRSX8 promoter can only be used with lentiviral (LV) vectors. Unlike AAV vectors which are expressed in cells without causing cellular insults, LVs integrate into the cellular genome and can have off target effects. While we have had great success with the AAV approach, our use of LVs and the PRSX8 promoter to drive GCaMP expression in 10 mice on 3 separate occasions has not been successful. This strategy did indeed transduce NMB+ neurons. However, the GCaMP fluorescence was unvarying to any stimulus. We think this an artefact as these cells did not respond to KA injection. Thus, for unknown technical reasons this approach has not worked.
As the PRSX8 approach did not work we performed further experiments with hSyn-driven transduction and use NMB immuno-labelling to verify correct placement of lens and the presence of these cells in the field of view. These additional recordings replicated our prior findings, provided evidence for some more neurons with graded CO2 responses, provided evidence for a further subclass of CO2 non-coding neurons that exhibit Ca2+ signals related to variability in the breathing traces. These additional experiments have also allowed us to document more thoroughly how anaesthesia alters the responses of these neurons. We now have 98 neurons included. Furthermore, the proportion of NMB+ neurons transduced was approx. 43%.
3) Information about specificity of the antibodies used should be provided, which is particularly important for the immunostaining for NMB and VGLUT2 used to suggest that some of the GCaMP-expressing parafacial cells were bona fide RTN neurons. There are no controls provided for the specificity of the antibody staining, and no references attesting to the quality of the antibodies, which should be standard practice (see Rhodes and Trimmer, J Neuroscience 2006; Saper, JCN, 2005; Saper and Sawchenko, ibid, 2003). Even if the staining were validated as specific for the relevant antigens, demonstrating that some of the GCaMP-expressing neurons were VGLUT2- and NMB-positive RTN neurons does not guarantee that the recorded cells were also RTN chemosensory neurons. This important caveat needs to be amplified in the text with appropriate disclaimers.
We thank the reviewers for raising this point. The antibodies we used are those that have been used by others and validated. We give the details and references in the Methods:
Goat anti-choline acetyltransferase (AB144P); Millipore, Burlington, MA, USA- PMIDs- 33013329, 25723967, 25602013
Rabbit anti-tryptophan hydroxylase (ABN60); Σ-Aldrich, St Louis, MO, USA- PMIDs- 32332079, 25732261, 28821671
Rabbit anti-Neuromedin-B (SAB1301059); SigmaAldrich, St Louis, MO, USA- PMID- 26855425, 33393903
We agree that it is important to add caveats to our ability to identify the actual cells that we recorded from. However, the RTN contains a multitude of cells, and that will include chemosensory and non-chemosensory neurons. We have unbiasedly report on the activity of all neurons in the nucleus. We have been careful to avoid stating that we only record from “chemosensory” RTN neurons -clearly some of the recorded neurons are insensitive to the chemosensory stimuli.
4) The authors need to explain more their interpretations of the measured GCaMP signals. For various neurons there may be a nonlinear relationship between theses signals and neuronal firing. For glia it is not clear that "activation" by hypercapnia would always cause a change in intracellular calcium, and yet signaling pathways could still be engaged that influence neighboring neurons. In addition, the authors need to explain why GCaMP6s was used for calcium activity imaging of RTN and Raphe neurons, whereas GCaMP6f was used for imaging astrocytes and pFL neurons. For comparisons of calcium dynamics between regions it is important that the same sensor is utilized which was done for the RTN region and Raphe neurons, but interpretation of what is being encoded by a particular sensor needs to take into account the sensor signaling kinetics. GCaMP6s kinetics produce long (many seconds) calcium signal decays after signal onset, which can for example contribute to features such as adaptation of the calcium dynamics imaged and would not accurately reflect neuronal activity profiles per se.
We agree that the relationship between intracellular Ca2+ accumulation and neuronal firing may be nonlinear. Nevertheless, it is well established that neuronal firing does indeed lead to accumulation of intracellular Ca2+ and has been used as a proxy of neural activity in many imaging studies (and underlies other techniques such as cFos expression to assess neural activation).
The choice of GCaMP6s and GCaMP6f was predicated on their sensitivity and speed of kinetics (PMID: 23868258). We used GCaMP6f in the pFL to attempt to resolve their firing during active expiration, whilst this may be a different fluorophore, we do not make any comparisons between the pFL and any other site. However, we used GCaMP6s in both the RTN and the Raphe, so these measurements are directly comparable. GCaMP6s being a slower responding GCaMP is more sensitive to smaller signals and seemed the correct choice for our studies. The inability to resolve individual spikes does not seem to us a shortcoming, as the Ca2+ will accumulate and likely show the envelope of firing in the neurons. We note that the graded responses that we observe in the RTN neurons are remarkably similar to the chemosensory response of a Phox2b+ neuron documented in Stornetta et al. 2006.
As the paper is now considerably longer due to the revisions and extra documentation, we have decided to focus only on the neuronal recordings and have taken out the data on glial cells. This has the benefit of allowing us to present the neuronal data much more fully and simplifies the discussion of our results.
5) The authors should discuss more how they adequately ruled out movement artifacts affecting the calcium signals. The authors provide some evidence that the measured Ca transients are independent of movement, but the GFP signal measured in different mice is not the best and adequate control for movement artifacts in other GCaMP-expressing mice. Inscopix miniscopes are capable of dual color imaging to detect a co-expressed fluorescent marker in the same cell, which would be a better control.
With respect we think that our treatment of this has been very thorough. Dual wavelength ratiometric imaging is of course desirable but such microscopes were not available at the time we performed this study. With appropriate controls single wavelength imaging has been used to study neural activity successfully in many brain areas and we believe that our work conforms to the best practice published in the field. We have emphasized that we have used a consistent experiment protocol and have used averaging to document consistent Ca2+ signals (see point below).
6) The calcium signals are interpreted by the authors to reflect a variety of cellular response patterns, but there is no indication of how the authors verified consistency of these patterns, and this important issue needs to be addressed. Did the authors apply the CO2 challenges in repeated or alternately ordered fashion (0-3-6, 0-6-3) to more convincingly verify a consistent response in each individual cell? This is important information to include. This approach would also aid in dissociating common CO2-associated response patterns from any more randomly associated movement artifacts, for example by the use of peristimulus averaging to tease out signal from noise.
We of course agree that a consistent paradigm of stimulation is critical to document reliable responses to hypercapnia. With respect, we point out that this is exactly what we did and that we provided all the records of all the recordings in Figure 1 Figure Supplement 2 which documents the systematic nature of our study and the reproducibility of what we observed across neurons and mice. Our paradigm was to go from 0 to 3 to 6 and back to 0% inspired CO2. This was chosen to minimise bleaching of the GCaMP and allow repeated imaging sessions of cells on different days. We also point out that we averaged the responses of each type of neuron aligned to hypercapnic stimulus, and for neurons that displayed activity related to breathing we averaged the Ca2+ signals triggered to the relevant features of the WBP trace (a form of peristimulus averaging). We have modified the text on pp4 to make this clearer.
In addition, we now document in Figure 1 Supplement 3 that, when we can identify the same neurons between recording sessions on different days, their activity patterns are remarkably similar (text on pp 5).
7) The authors suggest that tonic RTN neurons "provide tonic drive to the respiratory network." However, it is possible that these neurons are not respiratory. Just because they are in/near the RTN does not mean they are chemoreceptors. Please discuss more carefully.
We have carefully reviewed our wording and modified any ambiguities. However, the RTN is well known to provide tonic drive to the preBotC so this suggestion is hardly contentious. We have also been careful to avoid describing all the RTN neurons are chemosensitive. Like others (e.g. PMIDs 29873079, 31635852, 26968853 and 24107938) we found neurons apparently insensitive to changes in PCO2. We have added some additional text to pp 15.
8) There was little effect of CO2 on calcium signals in RTN astrocytes. The authors need to discuss if they imaged the astrocytes near the ventral medullary surface that have been most associated with CO2 activation and control of breathing. The authors also should indicate if they have independent histochemical evidence that the gfaABC1D promoter indeed restricted GCaMP expression to glial cells. Also, it is important to explain how they can conclude, based on the strength of the calcium signal, whether or not the astrocytes could play a functional role – at what threshold would they decide the signal is big enough, and on what would they base that decision. Is there any evidence that glial calcium levels need to rise in order for glia to influence neighboring neurons? Please discuss these issues.
As mentioned above we have decided to take out the glial recordings so that this paper focusses more clearly on neuronal responses. We shall publish the glial responses in a different paper.
9) The authors argue (page 6, 2nd paragraph) that the adapting responses of RTN neurons to hypercapnia match adaptation of VE in the WBP trace. This issue should be addressed in more detail. The data for this are very unconvincing. Instead there is a gradually increasing level of respiratory activity after switching to 3% and 6% CO2. In Figure 2H the WBP Av ReSm shows a similar result, with gradually increasing amplitude as CO2 level increases. The authors should expand the "WBP Av ReSm" trace in the vertical direction to more clearly show the increase in amplitude with time, and a horizontal line should be drawn at the baseline level to allow the reader to visualize the change in amplitude more clearly. When this is done, there is a clear ramp up of VE after changing to 3% CO2, and an even steeper increase with 6% CO2. This is opposite of the clear adaptation of calcium level in the "Average Waveform" trace in Figure 2H.
We agree that we had not clearly documented this point. To rectify this, we have now provided for three mice, in which this phenomenon was particularly clear, a correlation plot (VT vs F/F0) at the beginning of the 3% hypercapnia to show that there is a positive correlation between these two variables i.e. there is an adapting change in VT that matches the Ca2+ signal. To aid interpretation of this plot we also provide an Excel worksheet that uses simple mathematical functions to model an adapting F/F0 response together with either a gradual increase in VT or an adapting change in VT plus a gradual increase. This is an interactive spreadsheet so the reader can alter the values of the parameters to explore further. The key point is that if there were no adapting change in VT, the correlation plot would have negative slope, whereas with an adapting change in VT it gives a positive slope -which is what we observe in the real experiment.
10) The imaging results for pFL neurons suggest that these cells did not exhibit sustained expiratory-related oscillatory activity in response to hypercapnia that would be predicted based on the concept of a conditional expiratory oscillator in the pFL. The nature of the transient expiratory events described and whether they are in anyway related to the hypercapnic challenge in unclear from the results presented in Figure 8. This issue should be addressed more thoroughly in the manuscript.
We agree and have added more discussion of this on pp16. Most studies on this are from anaesthetised and vagotomised rodents, which elongates and enhances expiratory output. Data from pFL neurons in unanaesthetised unvagotomised in situ preparation shows pFL neurons only discharge in the final 20% of the expiratory period. In freely moving mice this equates to approximately only 20 ms, which may not be enough to give a sufficient signal using GRIN lens technology and the GCaMP6f construct. This technique does however still allow for recording of large expiratory events, which support the role of the pFL as an expiratory oscillator. Therefore, this finding is still of great importance. We now discuss this in greater detail on pp16 and 17.
11) The authors conclude (page 15) that: "Raphe neurons tended to be active during the entire CO2 stimulus and conceivably these neurons are likely to take over from RTN neurons under pathophysiological levels of CO2." The logic of how the authors come to this conclusion should be explained. The data are more supportive of the opposite conclusion. 42% of raphe neurons respond with a graded or sustained increase in firing in response to a rise in CO2 of as little as 3%, whereas most RTN neurons rapidly adapt (in only 1-2 minutes) to 3% CO2 and don't increase to 6% CO2 (a level that strongly stimulates breathing). The data are more consistent with the conclusion that at low levels of CO2, RTN neurons would have little or no effect, while raphe neurons would be expected to provide continuous activation of the respiratory network across the whole CO2 range studied. But there are potentially major problems with identifying the relevant RTN chemosensory neurons as indicated above that are thought to generate graded and sustained responses to CO2. This issue should be discussed more thoughtfully, particularly in the context of new experimental data that may be obtained regarding the molecular phenotypic identity of the RTN neurons analyzed.
Thank you for raising this point. We have looked closely at the chemosensory responses documented for Phox2b neurons in the published literature. As mentioned above the time course of the Ca2+ signal (including its recovery back to baseline in return to 0%) of the graded neurons (EG) is remarkably similar to the response documented by Stornetta et al. 2006. We note that Phox2b+ chemosensory neurons have been subdivided into type 1 and type 2 categories based on the characteristics of their pH sensitivity. Interestingly type 1 neurons display an adapting response to acidification -this is clearly seen in Figure 6B1 of Lazarenko et al. 2009 doi: 10.1002/cne.22136, where the adaptation is particularly prominent on going from pH 7.3 to pH 7.0, and was also evident (but slower) with lesser acidification. The type 2 neurons (panel C1) show a sustained response. This adapting response in type 1 neurons is also evident in the isolated Phox2b neurons reported in Wang et al. 2013 J Neurosci doi: 10.1523/JNEUROSCI.5550-12.2013 e.g. Figure 2A. Although the acid stimulus is only 1 minute long, allowing for the time taken for the stimulus to wash on and wash off (about 30s), the firing appears to adapt.
We now discuss these points and suggest that the adapting and graded neuronal subtypes we observe could be equivalent to these previously described subtypes. In total we observe that ~20% of the neurons in the RTN exhibit a graded or adapting response, this matches reasonably well with the proportion of GCaMP6 transduced neurons that are also NMB+.
Our additional experiments have allowed us to document more fully the effect of anaesthesia on the chemoresponsiveness of RTN neurons. The over-riding result is that anaesthesia very effectively silences the vast majority of RTN neurons -both their baseline activity and their response to hypercapnia. We find that the chemosensory phenotype of the neurons that retain activity under anaesthesia changes between the awake and anesthetised state. For example, neurons that exhibit a graded chemosensory response in the anaesthetised state would be classified as “non-coding respiratory related” in the awake state. Neurons that exhibited a graded response when awake, became non-coding in the anaesthetized state. Adapting neurons in the awake state became non-coding or inhibited neurons in the anaesthetized state. We think there is very compelling evidence that some RTN neurons are intrinsically pH sensitive (e.g. the Wang et al. study on acutely isolated neurons). However, our data would suggest that caution in interpreting the activity patterns of these neurons in the presence of anaesthesia is warranted, especially as the type of anaesthetic agent and depth of anaesthesia are likely to be confounding variables.
12) There should be an explicit discussion of the role of synaptic connectivity, and the authors should discuss the relationship of their results with data from more reduced preparations (about which there is little discussion). Synaptic inputs were intact and all responses that were measured were due to a combination of intrinsic responses, synaptic input and glial modulation. Some of the text seems to imply that the responses are all intrinsic, but this issue should be clarified.
Thank you for pointing this out. We have clarified this matter at various points in the text.
13) There are numerous reporting details that should be included. How many mice were used for cell counts and from how many sections? Did cells with particular response patterns (or sniffs) come from different mice or the same mouse? How were they distributed among the mice used? Which results were from synapsin and SERT mice?
We have added these details to Figure 1 Supplement 2.
14) In the text (p. 4) description of Figure 1, please correct the references to panels D-F. The actual figure panels do not correspond to the text descriptions. Similarly, in the figure legend, correctly match the references to panels D-G. Please also check the y-axis labeling in panel D.
Now corrected.
Reviewer #1 (Recommendations for the authors):
1) The authors have worked out the essential technical approaches required for deep brain fluorescence imaging of targeted regions in the medulla of freely behaving mice. The authors are attempting to draw functional conclusions with this imaging approach about chemosensory responses of neurons and glia in multiple important medullary regions that have been the focus of numerous studies. Understanding the details of how these types of cells respond in any of these regions in vivo, particularly in awake behaving animals, requires extensive work with this imaging approach for any region studied, beyond what the authors have presented. The observations presented here are nonetheless important for the field and provocative, but the major concern with this approach is whether the targeted regional neuronal and glial populations have been adequately sampled to reasonably understand the spatial and functional heterogeneity of the hypercapnic responses. There are important optical limitations as well as potential limitations associated with efficacy of cellular labeling with the vector constructs used. These are major caveats that need to be more thoroughly discussed in the context of technical limitations. The authors state that the GRIN lens placement was within the RTN (Discussion p. 10, para. 2) or terminated under the caudal pole of the facial nucleus (p. 6, para. 1) but the anatomical reconstructions consistently show the end of the lens in facial motor nucleus and in Methods (p. 17, para. 1), so as the authors discuss the coverage of the RTN populations may not be sufficient. The authors state that generally the lens was positioned ~300 µm above the regions to be imaged. Please provide information on the depth of field of the GRIN lens used and the typical field of view (including providing length scale bars on the cellular fluorescence images presented in the main text). Additional information on the viral transduction efficacy with the GCaMP constructs used would be helpful.
We have covered these important matters in Essential Revisions point 1 above, provided more data and revised the text.
2) Another technical issue relates to the genetically encoded calcium sensors used for different experiments. The authors need to explain why GCaMP6s was used for calcium activity imaging of RTN and Raphe neurons, whereas GCaMP6f was used for imaging astrocytes and pFL neurons. For comparisons of calcium dynamics between regions it is important that the same sensor is utilized which was done so this is not an issue, but interpretation of what is being encoded by a particular sensor needs to take into account the sensor signaling kinetics. GCaMP6s kinetics produce long (many seconds) calcium signal decays after signal onset, which can for example contribute to features such as adaptation of the calcium dynamics imaged and would not accurately reflect neuronal activity profiles per se.
We have covered these concerns in our response to Essential Revisions point 2 above.
3) The imaging results for pFL neurons are of considerable interest since these cells did not exhibit sustained expiratory-related oscillatory activity in response to hypercapnia that would be predicted based on the concept of a conditional expiratory oscillator in the pFL. The nature of the transient expiratory events described and whether they are in anyway related to the hypercapnic challenge in unclear from the results presented in Figure 8. This issue needs to be addressed more thoroughly in the manuscript.
We agree, the recent paper by Magalhaes et al. 2021 (PMID 34510468) shows firing during the expiratory phase in rat (in situ preparation). These are recordings have a very elongated expiratory period. They only show a smally flurry of bursts just before inspiration and our mice are breathing 16 times fast than this. This is probably too short lasting for us to resolve. We discuss this in the paper and in point 10 above.
4) In the text (p. 4) description of Figure 1, please correct the references to panels D-F. The actual figure panels do not correspond to the text descriptions. Similarly, in the figure legend, correctly match the references to panels D-G. Please also check the y-axis labeling in panel D.
Corrected
Reviewer #2 (Recommendations for the authors):
The authors should provide more discussion of the evidence supporting the conclusion that a high percentage of the neurons they recorded from were in the RTN and were Phox2b+/Neuromedin B+/vGluT2+.
We have now done this see response to Essential Revisions point 1 above.
Page 6, 2nd paragraph: The authors argue that the adapting responses of RTN neurons to hypercapnia match adaptation of VE in the WBP trace. The data for this are very unconvincing. Instead there is a gradually increasing level of respiratory activity after switching to 3% and 6% CO2. In Figure 2H the WBP Av ReSm shows a similar result, with gradually increasing amplitude as CO2 level increases. The authors should expand the "WBP Av ReSm" trace in the vertical direction to more clearly show the increase in amplitude with time, and a horizontal line should be drawn at the baseline level to allow the reader to visualize the change in amplitude more clearly. When this is done, there is a clear ramp up of VE after changing to 3% CO2, and an even steeper increase with 6% CO2. This is opposite of the clear adaptation of calcium level in the "Average Waveform" trace in Figure 2H.
We agree that we did not clearly present the evidence. We have now performed further analysis to thoroughly document the adapting response in the plethysmography trace and correlate it with the F/F0 trace from the adapting neurons. We show this correlation in Figure 2J for the EA neurons in three mice. See Essential Revisions point 9.
We agree that VE shows a ramp upwards, but this is in addition to a transient enhancement at the very beginning of hypercapnia.
None of the other WBP traces appear to show any evidence of adaptation. To better illustrate if there is adaptation, or conversely if there is a graded increase, the authors should include more examples of rectified and smoothed WBP traces (or VE) with expanded vertical scales and horizontal lines marking the baseline level.
We have revised Figure 2 to make this clearer.
The traces in Figures4H and 4I should be expanded in the y axis to better visualize the increase in calcium levels, and a horizontal line should be added denoting the baseline.
This has been done.
Page 8, 4th paragraph: The number of raphe glial cells with various types of responses should be stated.
The glial data has been removed now. See response to Essential Revisions point 8 above.
Reviewer #3 (Recommendations for the authors):
There are numerous reporting details that should be included. How many mice were used for cell counts? and from how many sections? did cells with particular response patterns (or sniffs) come from different mice? or the same mouse? how were they distributed among the mice? which results were from synapsin and SERT mice?
We have provided more details on these points most notably in Figure 1 Supplement 2 and in the relevant figure legends.
[Editors’ note: further revisions were suggested prior to acceptance, as described below.]
Essential Revisions.
(1) The critical issue of identifying the recorded neurons as RTN neurons according to the current definition of these neurons based on their established molecular properties (particularly see Reviewer #3) remains a major problem. As indicated in the reviews, there are other approaches to address this issue. Despite the new neuromedin B immunostaining results, the authors have not implemented a strategy to establish that any particular GCaMP-imaged cell was an actual RTN neuron. Accordingly, the authors cannot directly relate the measured responses of individual neurons to any specific type of neuron in the region studied. The authors should employ an approach that defines the molecular identity of the neurons imaged. Without additional convincing neuronal labeling/identification information that RTN neurons (as currently defined in the literature) were imaged, the authors need to use different terminology for what they are calling "RTN neurons" (e.g., ventral/ventromedial parafacial neurons) to avoid confusion and misinterpretation by readers. This issue also needs to be thoroughly discussed in the manuscript.
In the interests of transparency, we have revised the text to make it clear that we cannot identify the neurons to a specific subtype within the RTN.
However, we disagree that we are not using the correct nomenclature. The neurons are in the correct location underneath the caudal portion of the facial nucleus, in an area that contains NMB labelled neurons. The RTN, as implied by its name, is a nucleus, and nuclei consist of multiple neuronal subpopulations. It is inappropriate to define the RTN as a single anatomically defined neuronal subtype, as is being requested. Furthermore, calling this “ventral/ventromedial parafacial” is more likely to confuse readers. We have responded to this point more fully in point 2 of reviewer 3.
(2) The authors should include a more thorough discussion of the problem of precisely interpreting what the measured calcium signals are encoding due to uncertain, possibly nonlinear, relationships between the signals recorded from various neurons and their neuronal firing patterns. This discussion should include the rationale for their selection of the GCaMP sensors used. The authors need to have a section at the beginning of the Discussion dealing with these technical aspects/limitations that may affect interpretations of their observations, including further addressing any potentially confounding effects of insufficient correction of signals for movement artifacts- an issue raised again in this review.
We have added a section to the beginning of the Discussion to address these points.
(3) The issue of the consistency of calcium dynamic response patterns for a given neuron with repeated measurements to establish whether a given neuron truly belongs to any particular group as classified. How the authors establish consistency by applying some specific metrics should be more thoroughly addressed. A more rigorous assessment of the response consistency in individual neurons would go a long way to address technical and interpretive problems (including those associated with movement artifacts).
We have repeated recordings on separate days and in separate mice. Although for the most part we cannot identify the same neuron from day to day, we see very consistent patterns of responses across recording sessions, we now include these data in Figure 1 Figure Supplement 5. We explain the technical difficulties of identifying the same neuron between recording sessions on different days (possible in a few cases and presented in Figure 1 Figure Supplement 6), and why the possible issue of GCaMP6 bleaching constrained use to a single recording session per day. Our reasoning has been laid out in the response to Reviewer 2.
To justify the results of our classification further, we have plotted the change in Ca2+ response from baseline to 6% CO2 versus the response to 3% inspired CO2. This simple two component analysis would predict that EA neurons, as they have a stronger response to 3% than 6%, should fall below the x=y line on the graph. Conversely, EG neurons as they have a stronger response to 6% than 3%, should fall above the x=y line. ENC neurons as their activity does not change with CO2 should be clustered around the origin, and I neurons should fall in the negative quadrant of the graph. We include a new figure supplement to demonstrate that this analysis shows our groupings follow the predicted pattern (Figure 1 Figure Supplement 7). Out of the 124 neurons from the RTN and Raphe included in our dataset, this further analysis caused us to reassign only 7 neurons (2 from RTN: 1 from I to NC and 1 from EG to NC; and 5 from Raphe: 2 from Es to EG and 3 from Es to EA).
(4) The authors need to rectify inconsistencies in the data presented and address questions about how they interpret some of their observations, as noted in the reviews.
We have corrected some errors pointed out to us that were inadvertently introduced during revision.
Reviewer #1 (Recommendations for the authors):
This revised paper provides supporting evidence demonstrating the technical application of deep endoscopic fluorescence imaging with head-mounted miniscopes and genetically encoded calcium sensors in awake behaving mice for multicellular calcium activity imaging from key medullary structures involved in respiratory control in freely behaving mice, which is novel and important for the respiratory neurobiology field. The authors address some of the major problems and concerns about characterizing multi-neuronal activity by dynamic calcium imaging within medullary regions (RTN, raphe magnus and pallidus nuclei, pFL) proposed to have important chemosensory functions for the regulation of respiratory responses and homeostatic control of breathing with hypercapnia.
They have revised the paper in a number of important aspects in response to the original reviews: (1) they have removed the data on astroglial calcium dynamics and now just focus on the neuronal datasets obtained from these regions; (2) they have addressed the technical issues related to the depth of field with the GRIN lens and miniscope system used, which is critical for understanding the adequacy of sampling calcium dynamics in the targeted neuronal populations; (3) they have provided additional information on the neuromedin B identity of the possibly imaged neurons, although there are still concerns about the specificity of the antibody labeling and how the molecular identity has been established for the imaged neurons; and (4) they have discussed more directly how their regional calcium imaging data may be reconciled with available information on electrophysiological behavior and its variability in different experimental approaches, including comparisons with measurements in their awake freely behaving mice vs measurements in anesthetized and in vitro cellular measurements.
We would like to thank Reviewer 1 for their positive stance on our revisions.
Reviewer #2 (Recommendations for the authors):
This revised manuscript reports the results of GCaMP imaging of neurons from the RTN and raphe of unanesthetized mice using a mini-microscope to determine how hypercapnia affects neuronal calcium levels. The authors have made a number of major changes, including removing the data on glia.
There is a lot of potential in this approach to determine how neurons in these two regions respond to hypercapnia in vivo. However, as currently presented some errors have been introduced, there are some inconsistencies in the data, and there are new concerns about some artifacts contaminating some of the results. The authors also make some conclusions that are not supported by their data.
It is important for the authors to specifically state that for the two specific types of neurons of most interest here the authors cannot convert the size of the calcium signals measured to firing rate. The relationship between calcium levels and firing rate is unlikely to be linear and is likely to be different for the two neuron types. One or both neuron types may not increase calcium levels very much in response to an increase in firing rate. The relationship could only be determined by simultaneous imaging and extracellular recordings of spikes. The authors should discuss this issue.
We agree and have never attempted to convert the Ca2+ signal to firing rate in any version of the paper. Nevertheless, the dynamics of the Ca2+ signal are likely to reflect the dynamics of firing. We can be confident that when the firing rate increases, intracellular Ca2+ will also increase. The precise relationship will have distortions introduced by the slower nature of the Ca2+ signal and the dynamics of intracellular buffering. Nevertheless, the use of Ca2+ as a proxy for activity is widely accepted.
Movement artifacts influencing the interpretation of results
There is serious concern that movement has confounded some of the data. The authors provide arguments against the role of movement in altering the results, but many neurons had to be excluded due to movement artifacts (Figure 1A), indicating it is sometimes a problem.
These data were presented in first version of the manuscript. For a neuron to be included in the analysis it had to adhere to the rules set out in the methods. In some instances, we were further able to clean up the recordings by removing the background subtraction. If the cells were not able to meet our criteria for being free of movement and we were unable to remove movement through background subtraction the cells were excluded from further analysis. We provide recordings of every single recorded neuron and movies of each subtype, so that the reader may make their own judgement.
Line 155 – "[under anesthesia]…movement artifacts cannot be a potential confounding factor."
This statement is not true. Convulsive seizures involve a large amount of movement. This experiment was done without a paralytic agent, so it does not rule out movement as a cause of the calcium signal recorded in the neurons during seizures.
The way we performed the experiments does indeed rule out movement as a cause of the signals. We stated in the methods of the previous version paper that the dose of Kainate was 8 mg·kg-1 IP, titrated to avoid behavioural seizures, but sufficient to induce electrographic seizures in the absence of movement. We have emphasized and clarified this point in the revised text and now provide a supplementary video to document this.
Figure 1 Figure Supplement 2 and 3
For several groups of neurons recorded from the same mice, the pattern of calcium transients is so nearly identical that it does not seem biologically plausible. For example, that is true for neurons from mouse 7 for the RTN EA group. It is also true for the top two traces for Figure 2H (both extracted from mouse 5 in Suppl figure2), and for mouse 6 for the Raphe I group. How can the authors verify that the calcium activity is due to an increase in firing rate in these examples, and not movement or other artifact shared across neurons recorded at the same time? It would be possible for neurons to have similar patterns of activity, but not to be essentially identical.
We disagree with this comment. The response types are consistent across mice. For this to be a movement artefact, every mouse would have to move and generate this proposed artefact in the same way. This seems exceedingly unlikely and the simpler hypothesis that the Ca2+ responses reflect the biological responses of these neurons to hypercapnia seems far more probable to us. Were movement artefact to be a confounding factor, then all neurons from a single session would show the same profile. However, we show that multiple functional types were recorded from the same session. We have provided movies of all the neuronal types so readers can see the signals for themselves and judge accordingly.
We agree that the responses are very similar but do not see the problem -hypercapnia is a global stimulus and will thus evoke a global response, likely to be very similar in all responding neurons. In principle, synchrony may be additionally enhanced by synaptic and electrical coupling between neurons. Finally, using GRIN lens technology in vivo, several publications show neuronal recordings with near identical synchronous pattern/activity e.g PMIDs 35110409 (Video S1, Figure 2), 31184589.
There are a number of inconsistencies in the data
Figure 1 Figure Supplement 2
The trace labeled "Average EA" (7th trace down from the top in 1st column) does not correspond with the individual traces shown, where there should be a transient increase in calcium upon exposure to CO2 instead of occurring midway through the 3% CO2 exposure.
This was a mistake introduced during revision where we changed the timescale of the individual traces to make them clearer but omitted to do the same for the average. Thank you for pointing this out and we have now corrected this.
Figure 2H – Why does the Average Waveform EA look different than the Average EA in Figure 1 Figure Supplement 2? Shouldn't they be the same?
Yes they should -once again our thanks, and we have corrected this
There are several observations that are not consistent with the literature.
In Figure 2H, the VE trace shows adaptation in 3% CO2, but not in 6% CO2. In Figures 2H and 9C of the previous version of this paper, there was no adaptation at either CO2 level.
Figures 2H and 9C of the original paper were an average of the integrated and smoothed plethysmographic waveform over all mice. As the reviewers were unconvinced by this and asked us to document this point more clearly, we have replaced it in panel H of the revised Figure 2 by the VE record for the mouse from which the neurons of this panel were recorded to facilitate direct comparison. This shows the adaptation more clearly and we have done the same for the VT traces in three more individual mice in panel J. The reason for showing individual mice is that the extent of adaptation to the initial stimulus varies from mouse to mouse and an average over all mice obscures this.
The authors state on line 452 that adaptation to step changes in inspired CO2 is well known to occur in the literature, but they do not give a reference. I don't think that is true, with the existing literature instead showing a sustained increase in CO2 with continuous exposure to hypercapnia. The authors should cite literature if it exists.
We seem to be talking at cross purposes. We of course agree that there is a sustained increase in breathing with hypercapnia. However, superimposed on this is a transient adapting response -this is easy to see from the recordings we present in the paper. The vast body of literature that we have examined never shows measurements across the transition from normocapnia to hypercapnia (90 publications appeared in a PubMed search with the keywords: mice, hypercapnia and tidal volume). There is a simple reason for this -over the transition period, ventilation increases to a peak that then falls back somewhat to a stable value (still above that of normocapnia). This is simply an undocumented well-known fact of the field. Clearly there is a sustained ventilatory response to hypercapnia as measured at the end of the episode, but there is also an adapting response evident over the first minute that is superimposed on top of this sustained response. We refer the referee to panel 2H and J that show this adapting response in 4 different mice. Typically, the last minute of a hypercapnic episode is analysed to avoid this adapting period around the transition.
With regard to the literature, we have only managed to find one paper out of 90 that actually documents the transition and indeed shows an adapting response on top of the sustained response, see figure 1B in PMID: 27018763.
Line 257 – "Only a minority of neurons, 13% (5/38), encoded the magnitude of hypercapnia."
The sizes of the responses were much less than expected based on previous literature. This should be mentioned.
The reviewer earlier suggested that we cannot convert Ca2+ signals to firing rate -we agree and have never attempted to do this. Given this, we do not understand how this point can be made, and for this reason will not discuss it further. Nevertheless, the available data shows that Phox2b+ chemosensory neurons do not exhibit very high firing rates to a strong stimulus (<12Hz). As these rates are low, we would not expect huge changes in the Ca2+.
The point that intrigues us is that the proportion of neurons that behave like a “classical Phox2b+ chemoreceptor neuron” as expected from the literature is very low. We extensively discuss the reasons for this on page 11.
Line 367 "…type 1 neurons … display an adapting response to acidification."
The data in Lazarenko et al., 2009 is very unconvincing for an adapting response, and therefore the analogy with the EA neurons is as well.
We beg to differ. The Lazarenko et al. paper, being from an earlier era, does not provide access to their original data to settle this point. However, we take it as a matter of good faith that the authors showed representative data in this figure. Taking this as our starting point we have made further measurements from this paper:
Following a change in pH from 7.4 to 7.0, it takes a type 1 neuron approx. 23 ± 6s (n=5, mean ± SD) to reach its peak firing rate. Over the next 27s (from peak) the firing rate reduces to 52% of its peak. Following a change from pH 7.4 to 7.3, a type 1 neuron takes 39s to reach peak firing and then declines to 84% of this peak rate over 38s.
We additionally include annotated illustrations from the two papers to make our point (B1 shows a Type 1 neuron, and C1 and Type 2 neuron).
This adapting response in type 1 neurons is also evident in the isolated Phox2b+ neurons reported in Wang et al. 2013 J Neurosci doi: 10.1523/JNEUROSCI.5550-12.2013 e.g. Figure 2A. Although the acid stimulus is only 1 minute long, allowing for the time taken for the stimulus to wash on and wash off (about 30s), the firing appears to adapt.
What is interesting about the values that we have measured from these papers is that they are not dissimilar to the dynamics of the EA neurons we describe. This similarity is evident even though they were obtained to a pH change in brain slices from P6-10 mice compared to in vivo recordings from adult mice and a response to CO2.
Coupled with the fact that ventilation does not adapt in most literature in response to sustained hypercapnia, and other chemoreceptors do not adapt to CO2, I am not convinced that the EA neurons are important for chemoreception.
There is clearly an adapting component to the ventilation response over the initial phase -this is documented in Figure 2H and J. We have now shown it correlates very nicely with the response pattern of the EA neurons. This is only a correlation, but since the RTN is linked to the generation of ventilatory responses to hypercapnia, it seems plausible that the EA neurons are involved in generating the adapting component of the response.
There is also no clear mechanism for why neurons should adapt to 3% CO2 but not 6%.
We agree, but inability to imagine a mechanism does not affect our observations.
Line 569 – "[raphe neurons] are likely to take over from RTN neurons under pathophysiological levels of CO2."
That conclusion is not consistent with the observation that nearly half of raphe neurons have a graded or sustained response to CO2 of only 3%. That is not a pathophysiological stimulus.
Fair point -we have amended the text
It should be pointed out that sampling of both groups of neurons was limited and the authors may have not recorded from all subtypes of neuron.
This is possible, but we have included 98 neurons from 9 mice in RTN. We have extensively discussed this and will include this point in a new section of the Discussion.
The authors left labels off of the axes of a number of figures, e.g. 3B, 4C (fR), 7G.
We have rechecked the figures and added any missing labels.
Figure 1 Figure Suppl 3 – The EA trace does not look convincingly adapting.
We agree that this example does not look similar to the EA neurons of the RTN, but it shows a larger response (in terms of frequency of transients) at the beginning of the 3% stimulus than in the 6% stimulus and we therefore classified as showing an adapting response. This is backed up by our 2-component analysis presented in Figure 1 Figure Supplement 7. This new analysis also led us to reclassify 3 ES neurons as EA, hence there are now 4 neurons in this category.
Reviewer #3 (Recommendations for the authors):
The authors have attempted to address the concerns from the previous reviews.
1. In dealing with the major issue of identifying the recorded neurons as RTN cells, the authors argue that the use of a PRSX8 promoter-driven viral approach was ineffective. But, this is not the only solution. An alternative is using a Phox2b-Cre mouse and a DIO virus for GCaMP delivery. These reagents are readily available and should be attempted if they want to say anything about RTN neurons.
This mouse was not available at the time we did the experiments. We disagree that we cannot say anything about RTN neurons. We are clearly recording activity from neurons located within the RTN as evidenced by the landmarks, facial nucleus, pyramids, and SP-5, and the presence of NMB positive neurons within the region.
2. The authors need to use different terminology for what they are calling RTN. The initial description of RTN neurons in cats was based on their projections to VRG (and a lesser extent, DRG; see Smith et al., 1989). Since then, the RTN cell group has been defined functionally and neurochemically with increasingly greater precision (e.g., Guyenet et al., 2019). In the current study, these authors have not convincingly demonstrated that the actual recorded cells meet any of the established criteria for being called RTN neurons. Therefore, they should follow the more general "parafacial" terminology to describe this region, and refer to these as "unidentified neurons located in the parafacial region."
We disagree on this point. We are quite willing to accept that the precise identity of the neurons has not been established but using the term “parafacial” is likely to introduce further confusion. The retrotrapezoid nucleus (RTN) is a nucleus. The point being made by the reviewer conflates anatomical localisation with function. In common with many other nuclei in the brain, the RTN contains multiple sub-populations of neuron. Nearby nuclei such as the preBotC contain neuronal subpopulations with NK1R+ glutamatergic, Sst glutamatergic, and glycinergic chemical phenotypes. The Raphe contains neurons with serotonergic and GABAergic chemical phenotypes. To look further afield, the VTA contains dopaminergic, GABAergic and glutamatergic neurons.
As far as we are aware, no-one is seeking to redefine the preBotC along the lines implied by this comment. This line of reasoning would imply that as Sst neurons are output neurons and not rhythm generating neurons, they should no longer be considered preBotC neurons. Sensibly, the field refers to these neurons as a defined subtype within the preBotC. Similarly, no-one is promoting dopaminergic neurons as the “true” VTA. We strongly argue that the naming convention for neurons in the RTN should adhere to the well-established norm in neuroscience: Phox2b+/NMB+ chemosensory neurons are a subpopulation within the RTN, but do not by themselves constitute the RTN.
3. There are issues remaining with respect to Nmb antibody validation and immunostaining. It is still the case that no experimental controls for the Nmb immunohistochemistry are provided in this paper.
Instead, two references are cited. In Yamagata et al. (eLife 2021), however, it appears that a different antibody was used (monoclonal antibody from Developmental Studies Hybridoma Bank) – rendering this an irrelevant citation. The Li et al. (Nature, 2014) citation indeed reports on the same polyclonal antibody used here, but they used it to detect Nmb-IR terminals in the preBötC (see Ext. Data Figure 2 in Li et al.) and not cell somata in the RTN. The problems of detecting neuropeptides in neuronal cell bodies by antibody staining are well recognized and the images provided are unconvincing. For example, there appears to be staining where one would expect to find few, if any, Nmb-expressing neurons – e.g., see upper right in current Figure 2D, just below the lens lesion. This is not to say that this Ab staining approach is impossible, but at least some validation is required. For example, the authors might combine IHC with FISH to demonstrate that the Nmb antibody specifically recognizes neurons that also express Nmb transcripts and, more importantly, that it does not non-specifically stain cells that do not express Nmb.
Souza et al. 2018 show NMB+ neurons in the locations mentioned by the reviewer “midline NMB” neurons Figure 1 of PMID: 29667182. Staining right next to the lens tract is likely to be artefactual.
We have removed the Yamagata reference, and now provide further validation of antibody specificity by comparing the NMB immunostaining with the pattern of ISH from the Allen Brain Atlas across several brain areas. This shows lack of staining in areas that do not express NMB (from ISH) and staining in areas where it would be expected from the ISH.
(It should be noted that, even with more appropriate validation, this strategy of post hoc identification will not be able to ensure that any particular GCaMP-imaged cell was an actual RTN neuron – i.e., no attempt is made to relate individual responsive neurons to the cells that were subsequently immunostained.)
We agree with this comment to the extent that no recording can be attributed to a particular subtype of RTN neuron. But we have been appropriately cautious in this regard. (1) We do not equate any response of a neuron to a specific subtype, but merely report the different functional subtypes. (2) In the Discussion, we attempt to reconcile our findings with the prior literature -for example, we “tentatively suggest” that the EG subtypes may represent Phox2b+ neurons. It seems to us that this a perfectly acceptable point to make, and it would be odd if we did not put our findings in this wider context. We now state that sub-type specific drivers of GCaMP would be needed before any associations of functional subtypes with neurons of known chemical phenotype can be definitively made.
4. The issue of response "patterns" remains. The post hoc grouping of different neurons selected for similar responses to use for averaging (Figure 1, Supp. 2) does not say anything about whether the response in an individual neuron represents its own characteristic "pattern." It is circular reasoning to select neurons based on a type of response to the stimulus, and then view the averaged data from those pre-selected neurons aligned to the stimulus as evidence for a consistent "pattern."
We are puzzled by this comment. The reviewers specifically requested peristimulus averaging in their previous review to show that responses were repeatable and reproducible. We have chosen to show across mice that the same types of neuronal response are seen. As we show every recording in the dataset, we leave it up to readers to decide whether these response patterns are reproducible and consistent. The additional 2 component analysis we have performed (plotting the change in activity at 3% vs 6%) we have performed backs up our categorisation (see Figure 1 Figure Supplement 7).
Moreover, the new anecdotal data presented of recordings from the same cell over multiple days (Figure 1, Supp. 5) with no analysis beyond the "eye test" is unconvincing and does not adequately address this issue. What precisely does it mean to say that "activity patterns were remarkably similar between separate recording sessions" when no quantification is provided to assess that professed similarity. Why not simply repeat the stimulus protocol and verify a consistent response pattern?
We have revised Figure 1 Figure Supplement 6 (previously Figure Supplement 5) to bring out the similarity of the activity in the two sessions. We have now added a third panel in which the traces from different days are superimposed. The key issue is not how similar the activity of the cells is in each recording session (one would not expect them to be identical) but whether one would classify the patterns of neuronal activity differently across sessions. These neurons were classified as non-coding (NC) in both sessions.
Identification of the same neurons from recording session to recording session (on different days) was possible only in a few cases. The reasons for why we could not reliably identify the same neurons on different days are not completely clear. Most likely it was not possible to place the camera on the headstage in the exact same turret position. This would cause the focal plane to vary from session to session -this has been explained in the text on pp 5.
We chose to perform one recording session per day i.e. one complete protocol, rather than giving repeated stimuli. This is because the GCaMP6 significantly bleaches and we wanted to be able to repeat the recording sessions across multiple days. However, every mouse was recorded on more than one day. In our dataset (Figure 1 supplements) we only include recordings from one session (i.e. each mouse is represented only once, to avoid pseudoreplication, and all the neurons from a mouse are from the same session). We now make this explicitly clear. However, we additionally present data to show that the same types of neuronal responses to hypercapnia are present in multiple recording sessions from the same mouse, even although these cannot be attributed to the same neurons (Figure 1 Figure Supplement 5).
Our additional analysis in Figure 1 Supplement 7 shows that the different neuronal types we identified fall into distinct quantitative groupings.
5. Aside from issues with the data mentioned above, it is worth pointing out that some of the interpretations presented in the Discussion are questionable and/or fail to adequately consider the existing literature. A few examples are provided below.
As mentioned in the previous review, the responses recorded (and any associated response properties such as graded, adapting, etc.) could represent either an intrinsic sensory response or a complex amalgam of the presumed intrinsic property with extrinsic inputs to the recorded neuron. Although the authors claim to have clarified this at various points in the text (e.g., one instance is noted on p. 13, when discussing CO2-inhibited raphe neurons), a reader is likely to get the overall sense from the presentation that the responses are mostly presumed to be intrinsic (e.g., with phrasing such as "cells encoded the level of inspired CO2.") An explicit acknowledgement of this interpretive confound, which is unavoidably inherent to studies that correlate neuronal activity with behavior, should be provided at the outset of the Discussion (preferably in a general standalone section that deals with the various experimental and interpretive limitations.)
We appreciate that bringing these matters to one place in the discussion would be helpful so have added a section to do this.
The statements that: "The majority of evidence for the involvement of the RTN, and in particular the Phox2B+ neurons, in CO2 chemoreception comes from neonatal or young juvenile animals" and "much of prior evidence for RTN chemosensory responses depends heavily on recordings from anaesthetized animals" ignores strong evidence from the Guyenet group for RTN involvement in CO2 responses of unanesthetized adult rodents (e.g., Basting et al., 2015).
Our phrasing may not have been sufficiently precise. The evidence for the activity of RTN neurons in response to chemosensory stimuli comes mainly from neonatal or young juvenile animals and recordings from anaesthetized animals. The paper quoted does not document recordings of activity of RTN neurons in the absence of anaesthesia. There are of course papers that show the effect of optogenetic stimulation in non-anaesthetized animals or the effects of various lesions. But these tell us nothing about the activity patterns, only that stimulation of RTN neurons is sufficient to give an enhancement of breathing, or that destruction of the RTN alters hypercapnic responses. Without knowing the activity of these neurons in the absence of anaesthesia, the precise significance of optogenetic stimulation or lesions is not known.
We have modified our wording to avoid any further confusion.
Further, the suggestion that a normal developmental feature is that "chemosensory response becomes less dependent on Phox2B+ neurons of the RTN by 3 months of age" is based on a study that examined adaptations following genetic RTN destruction – hardly a normal developing mouse – and it ignores the profound effects of acute RTN neuron ablation in adult rats on chemosensory responses (Souza et al., 2018). A more balanced interpretation of the present results that considers all the relevant literature is advisable.
We now include discussion of chemical lesioning experiments.
As a final example, it would appear to be a stretch to relate E-A and E-G responses in vivo to two types of RTN neurons recorded in vitro, based apparently on a visual inspection ("careful examination") of a few example cells presented in figures from other papers in which those particular response characteristics were neither identified nor characterized. It does not seem appropriate to build a substantial and speculative part of the discussion on this subjective interpretation from those example cells.
We disagree with this point. We take it on trust that the authors showed representative data and refer the reviewer to our response to reviewer 2. That they never identified or characterized this adapting response, may reflect the priorities that the authors had at the time. The emphasis in the Lazarenko paper was very much on documenting pH sensitivity and the differences in this characteristic between the type 1 and type 2 neurons. It is noteworthy that this same difference (adapting versus graded) was evident when the Phox2B+ neurons were isolated and was published some 4 years after the Lazarenko paper.
[Editors’ note: further revisions were suggested prior to acceptance, as described below.]
1) There is still a serious concern that there is a problem with precisely interpreting what the measured calcium signals are encoding due to uncertain, possibly nonlinear, relationships between calcium imaging from various neurons and their firing rate/pattern. The authors respond to this criticism by saying: "… the dynamics of the Ca2+ signal are likely to reflect the dynamics of firing. We can be confident that when the firing rate increases, intracellular Ca2+ will also increase." While this has been shown for some types of neurons (especially hippocampal and neocortical neurons), the reviewers are not aware that it has been shown for RTN or raphe neurons, and the authors offer no evidence for that.
It seems to us inadvisable to argue that RTN and raphe neurons have very different properties with respect to their Ca2+ dynamics from other neurons in many different regions of the brain (e.g. additionally hypothalamus, LDT/PPT). While this is possible in principle, there is no evidence to support this contention. In fact, the reverse is true. We note that the use of c-fos expression to identify neurons activated by chemosensory stimuli including those of the RTN has been widely published and accepted by the field (e.g., PMIDs 8173977; 26068853, Figures 1 and 4). As c-fos expression depends on activity dependent accumulation of intracellular Ca2+, these studies and data strongly support the Ca2+ dynamics of RTN and Raphe neurons as reflecting their activity patterns.
There are many mechanisms by which calcium levels could become dissociated from the firing rate. For example, in some neurons calcium levels may be relatively insensitive to an increase in firing rate due to low calcium current density or a high level of calcium buffering. An increase in firing rate or intracellular acidosis could have a stimulatory effect on calcium extrusion or sequestration. The "adaptation" of calcium levels the authors point out may reflect augmentation of calcium regulation rather than adaptation of firing rate.
Unfortunately, we do not think that these points have mechanistic support or evidence to back them:
1. As Ca2+ buffering is finite, a high buffering capacity might slow the onset of the increase of Ca2+ but would not prevent it from occurring.
2. Low Ca2+ current densities would mean that the magnitude of the signal might be small, even too small to be resolved. Cells that did not show appreciable Ca2+ signals in the baseline were excluded from our dataset as being uninterpretable.
3. Extrusion/sequestration rates for Ca2+ are much slower than entry rates. The electrochemical driving force for Ca2+ entry is very high, and channels have much faster transport rates than energy dependent transporters/exchangers. This is apparent in neurons throughout the nervous system where Ca2+ transients have a very fast onset (reflecting kinetics of entry through a variety of Ca2+ permeable channels -not just voltage-gated Ca2+ channels) and a much slower exponentially decaying phase that reflects sequestration/extrusion processes. This pattern is clearly evident in our own recordings, in which the decay time constant of Ca2+ transients is roughly 2s, and the 10-90% rise time of the transients is roughly 0.5s.
To specifically address the point about acidosis or some other feature of the hypercapnic stimulus changing Ca2+ dynamics and thus accounting for the adapting pattern, we have taken example recordings EA neurons and tonic firing neurons and plotted individual Ca2+ transients from before, during and after the hypercapnic episodes. The kinetics of these transients are in effect real-time probes of the entry and extrusion/sequestration rates for Ca2+ in the cell. Neither the decay time constant nor the rise time of these signals in either of these cell types differs between these conditions. For the reviewers’ alternative hypothesis (that the apparent adapting pattern of Ca2+ activity is due to changes in influx and efflux rates caused by intracellular acidosis rather than reflecting neuronal firing patterns) to have merit, the decay time of the Ca2+ transients, which reflects buffering/sequestration/extrusion would have to be faster than the rise time of the transients during the hypercapnic period. Since neither change in an appreciable way, and the decay time constant remains much longer than the rise time, we can confidently discount this alternative explanation. We have added text to pp7 and pp10 and created a new Figure 2—figure supplement 2 to document this point.
The response/decay kinetics of GCaMP6s is also a problem in terms of encoding the temporal characteristics of neuronal firing (e.g., Dana et al. Nat Methods 16, 649-657, 2019). A disconnect between calcium levels and firing rate could also explain why some neurons did not have a linear response to a graded increase to CO2 – their firing rate may have increased linearly while calcium levels fell off.
The Dana et al. paper does not support this contention. Dana et al. show that while GCaMP6s cannot accurately resolve individual action potentials, it does nevertheless provide a smoothed envelope that reflects the firing dynamics. This is analogous to passing a high frequency electrical signal through a low pass filter. Dana et al. do not provide evidence of a disconnect between Ca2+ levels as measured by GCaMP6s and firing rates (they show quite the opposite: that the Ca2+ signal parallels the firing rates). Other papers agree on the difficulty of resolving single action potentials but also document the ability of GCaMP6 to accurately represent multispike firing dynamics in a variety of neurons and model systems (including zebrafish and Drosophila) – PMIDs 23868258, 33683198. As the responses of chemosensory neurons to hypercapnia are multispiking events, our use of GCaMP6 as an indicator of activity in these cells seems entirely appropriate given the current state of genetically encoded Ca2+ sensors.
The authors say they "have never attempted to convert Ca2+ signals to firing rate," but they lead the reader to believe that their measurements reflect neuronal firing rate/patterns throughout the paper by describing their measurements of calcium fluorescence as "activity of neurons", "neuronal firing", "activity patterns", or "activity." Neurons were categorized as Inhibited, Excited, or Tonic. Neurons are described as being "silenced." All of these terms lead the reader to think that the measurements presented are reliable surrogates of neuronal electrophysiological activity. The authors state that "the use of Ca2+ as a proxy for activity is widely accepted." That doesn't make it right. The authors need to be more precise in their terminology throughout the text. They are measuring calcium signals, not necessarily firing rate/activity patterns.
We have reviewed how we have presented the data, which is in line with the great consensus in the field that Ca2+ levels do reflect a reasonable proxy of firing rates and activity patterns. We note that throughout the Results section we refer to Ca2+ activity patterns (e.g., pp 5-6). We have extensively discussed the limitations in the Discussion. In the response above we have shown by reference to the literature and further analysis of our own data that these points of the reviewers lack evidential support. We have added some further references in the limitations section on pp10 to support these points.
2) The authors' responses have not adequately addressed the major and overarching concerns that: a) the recordings were ultimately from unidentified RTN neurons even if we allow that they were in the region of the RTN; and, b) we cannot know whether the recorded responses were a true characteristic CO2 response of the recorded neurons without repeated measurements in the same neurons (as opposed to some random fluorescence changes that were found represented among the population of recorded cells in different mice). The authors need to emphasize these problems more clearly in the manuscript.
We are pleased that the reviewers now accept that we recorded from neurons in the RTN.
In response to (b): from a statistical viewpoint, repeated recordings from a single cell would be regarded as pseudoreplication that tells nothing about the activity of a wider sample. We have used genuine replication by recording from separate neurons from separate mice. We have found consistency of activity patterns that is time-linked to the hypercapnic stimulus between recording sessions and between mice. This tells us that these cells exist and that our sample recordings represent the population.
To turn argument around, let us suppose that we were trying to claim that the observed responses were random and did not reflect any meaningful biological reality. The problem is that we would then have to “explain away” the following observations: the patterns are time locked to the stimulus; they are seen in multiple recording sessions from the same mouse; and they are seen in different mice recorded at different times. We would argue that it would be extremely unlikely that this alternative interpretation would gain significant support from our scientific peers.
In summary, we believe that we have already devoted considerable time and space to addressing these concerns by adding new data and figures in the two previous revisions. We also note that we have been extremely transparent and have shown all of our data, allowing readers to assess patterns in our data for themselves. Consequently, we are not aware of any further changes that could meaningfully address this point other than an additional sentence which we have added to the limitations section stating the desirability of repeated recordings.
3) Reviewer #3 still questions the specificity of the NMB immunostaining. While it is appreciated that the authors tried to match their immunolabeling with the Allen Brain Atlas, this is unconvincing and appears to be mostly comparisons of the type of non-specific labeling that is often seen in areas of high cell density (e.g., Figure 2, Figure Suppl. 1, Panel Ei, cortex; Panel Eii, piriform cortex). The most obvious example they provide of "real" strong in situ labeling from the Allen Atlas is in Panel Eii (in the hilus of the dentate gyrus?) – and in this case, the NMB immunostaining they show is not any stronger than the non-specific labeling noted above.
We have previously found the Allen Brain Atlas to be quite accurate in its localisation of a number of other markers and have no reason to believe that it does not represent NMB expression accurately. Most relevant for our study is that the neurons stained in the RTN with this antibody have the positions and cell body shapes and punctate staining pattern that have been previously described with use of FISH (PMID 29066557). This suggests that in this area, at least, it is staining the correct cells. As we are not using this antibody to describe a new population of cells but to confirm the location of the lens and that we are indeed imaging from the RTN, in conjunction with other landmarks and ChAT staining we suggest that this level of verification is adequate.
Other specific issues that should be addressed:
1) Abstract, lines 26-28. Given the authors' acknowledgements of the potential limitations of their calcium signal measurements in terms of encoding temporal patterns of neuronal activity, the statement that their "analysis revises understanding of chemosensory control in awake adult mouse" should be modified.
As we argue above Ca2+ imaging does give an accurate picture of the activity envelope even if it cannot resolve individual spikes, so we think that this wording is appropriate.
2) Introduction: "brain imaging techniques have been developed to allow recording of activity of defined cell populations in awake, freely-moving animals … require: the expression of genetically encoded Ca2+ indicators such as GCaMP6 in the relevant neurons …" This specific requirement was not met for the RTN since there was no "defined cell population" targeted with the GCaMP6. Consider rewording.
As the reviewers agreed in point 2 above, we were recording from neurons in the RTN. We have made it clear at many points that we used the hSyn promoter and we would argue that we are indeed recording from the relevant neurons, even if we have not identified the subtype.
3) Page 5, lines 151-153: "When we were able to identify the same neurons their activity patterns were remarkably similar between separate recording sessions (Figure 1—figure supplement 6)." This cursory analysis, based on a few neurons, is not very convincing. The need for repeated measurements of the same neuron to be sure about the characteristic dynamic pattern of the calcium signal should be clearly stated in the limitations section in the Discussion.
We have added a sentence to the limitations section.
4) Line 369: "are reproducible between recording sessions from a single mouse …" Change to "are reproducible across the imaged neuronal population between recording sessions from a single mouse" to clarify that these general activity patterns were observed, but not within the same individual neurons.
Done
5) There seem to be two different definitions applied for the EA subtype of response. For one, they responded to the initial increase in inspired CO2 but did not maintain their activation, and for the other, they respond to 3% CO2 more robustly than 6% CO2. Are these the same?
Yes -the wording has been modified to avoid confusion.
6) Lines 447-448: "Chemosensory responses become less dependent on Phox2B+ neurons of the RTN by 3 months of age (Ramanantsoa et al., 2011) … should add "when those neurons are genetically ablated" or some such qualifier.
Done
7) Line 515: This statement should include a reference to Cleary et al. (PMID: 34013884), in which CO2-inhibited SST-expressing interneurons were recorded in the parafacial (RTN) region. This paper should also be cited with reference to the diversity of neuronal subtypes in that region, many of which may have been sampled in the current GCaMP6 recordings.
Done
8) Page 15, para. 1 and 2 and Figure 8. The calcium signal measurements presented in this paper and summarized in panel C do not directly provide information on neuronal firing patterns and associated synaptic interactions implied in these diagrams. Given the uncertainty, the authors should emphasize that the regional interactions postulated are based on what is generally proposed in the literature, and it is currently unknown if any specific type of neuron that the authors have classified from the calcium signals and represented in the diagram has the connections indicated. Some readers may find these diagrams excessively speculative.
We agree that we have not identified synaptic connections from these neurons and that the interconnections are purely literature based we have reworded the legend and text on pp15 to bring this out more clearly.
9) Line 619: "The neuronal responses to CO2 were more heterogeneous in both the RTN and Raphe than would be expected from the prior literature" should be clarified to state that "The neuronal responses to CO2 were heterogeneous for unidentified neurons in the RTN and for serotonergic neurons in Raphe."
Reworded.
https://doi.org/10.7554/eLife.70671.sa2Article and author information
Author details
Funding
Medical Research Council (MC_PC_15070)
- Nicholas Dale
Royal Society
- Nicholas Dale
The funders had no role in study design, data collection and interpretation, or the decision to submit the work for publication.
Acknowledgements
This work was supported by an MRC Discovery Award MC_PC_15070. ND is a Royal Society Wolfson Research Merit Award Holder. We thank Tamara Sotelo-Hitschfeld for help in the early stages of developing the method.
Ethics
Experiments were performed in accordance with the European Commission Directive 2010/63/EU (European Convention for the Protection of Vertebrate Animals used for Experimental and Other Scientific Purposes) and the United Kingdom Home Office (Scientific Procedures) Act (1986) with project approval from the University of Warwick's AWERB.
Senior Editor
- Catherine Dulac, Harvard University, United States
Reviewing Editor
- Jeffrey C Smith, National Institute of Neurological Disorders and Stroke, United States
Reviewer
- Jeffrey C Smith, National Institute of Neurological Disorders and Stroke, United States
Version history
- Preprint posted: December 10, 2018 (view preprint)
- Received: May 25, 2021
- Accepted: October 12, 2022
- Accepted Manuscript published: October 27, 2022 (version 1)
- Version of Record published: November 8, 2022 (version 2)
Copyright
© 2022, Bhandare et al.
This article is distributed under the terms of the Creative Commons Attribution License, which permits unrestricted use and redistribution provided that the original author and source are credited.
Metrics
-
- 1,536
- Page views
-
- 219
- Downloads
-
- 2
- Citations
Article citation count generated by polling the highest count across the following sources: Crossref, PubMed Central, Scopus.
Download links
Downloads (link to download the article as PDF)
Open citations (links to open the citations from this article in various online reference manager services)
Cite this article (links to download the citations from this article in formats compatible with various reference manager tools)
Further reading
-
- Cell Biology
- Neuroscience
The amyloid beta (Aβ) plaques found in Alzheimer’s disease (AD) patients’ brains contain collagens and are embedded extracellularly. Several collagens have been proposed to influence Aβ aggregate formation, yet their role in clearance is unknown. To investigate the potential role of collagens in forming and clearance of extracellular aggregates in vivo, we created a transgenic Caenorhabditis elegans strain that expresses and secretes human Aβ1-42. This secreted Aβ forms aggregates in two distinct places within the extracellular matrix. In a screen for extracellular human Aβ aggregation regulators, we identified different collagens to ameliorate or potentiate Aβ aggregation. We show that a disintegrin and metalloprotease a disintegrin and metalloprotease 2 (ADM-2), an ortholog of ADAM9, reduces the load of extracellular Aβ aggregates. ADM-2 is required and sufficient to remove the extracellular Aβ aggregates. Thus, we provide in vivo evidence of collagens essential for aggregate formation and metalloprotease participating in extracellular Aβ aggregate removal.
-
- Computational and Systems Biology
- Neuroscience
The cerebellar granule cell layer has inspired numerous theoretical models of neural representations that support learned behaviors, beginning with the work of Marr and Albus. In these models, granule cells form a sparse, combinatorial encoding of diverse sensorimotor inputs. Such sparse representations are optimal for learning to discriminate random stimuli. However, recent observations of dense, low-dimensional activity across granule cells have called into question the role of sparse coding in these neurons. Here, we generalize theories of cerebellar learning to determine the optimal granule cell representation for tasks beyond random stimulus discrimination, including continuous input-output transformations as required for smooth motor control. We show that for such tasks, the optimal granule cell representation is substantially denser than predicted by classical theories. Our results provide a general theory of learning in cerebellum-like systems and suggest that optimal cerebellar representations are task-dependent.