Repression of hypoxia-inducible factor-1 contributes to increased mitochondrial reactive oxygen species production in diabetes
- Department of Molecular Medicine and Surgery, Karolinska Institutet, Sweden
- Centre for Inherited Cardiovascular Diseases, IRCCS Foundation University Hospital Policlinico San Matteo, Italy
- Folkälsan Research Center, Folkälsan Institute of Genetics, University of Helsinki, Finland
- Laboratory of Tumor Inflammation and Angiogenesis, Center for Cancer Biology, Vlaams Instituut voor Biotechnologie (VIB); Laboratory of Tumor Inflammation and Angiogenesis, Center for Cancer Biology, Department of Oncology, Katholieke Universiteit (KU) Leuven, Belgium
- Laboratory of Angiogenesis and Vascular Metabolism, Department of Oncology, Katholieke Universiteit (KU) Leuven; Laboratory of Angiogenesis and Vascular Metabolism, Vesalius Research Center, Vlaams Instituut voor Biotechnologie (VIB), Belgium
- Dipartimento di Biochimica, Università di Bologna, Italy
- Department of Medical Cell Biology, Uppsala University, Sweden
- Department of Endocrinology and Diabetes, Karolinska University Hospital, Sweden
- Center for Diabetes, Academic Specialist Centrum, Sweden
Figures
Figure 1 with 1 supplement
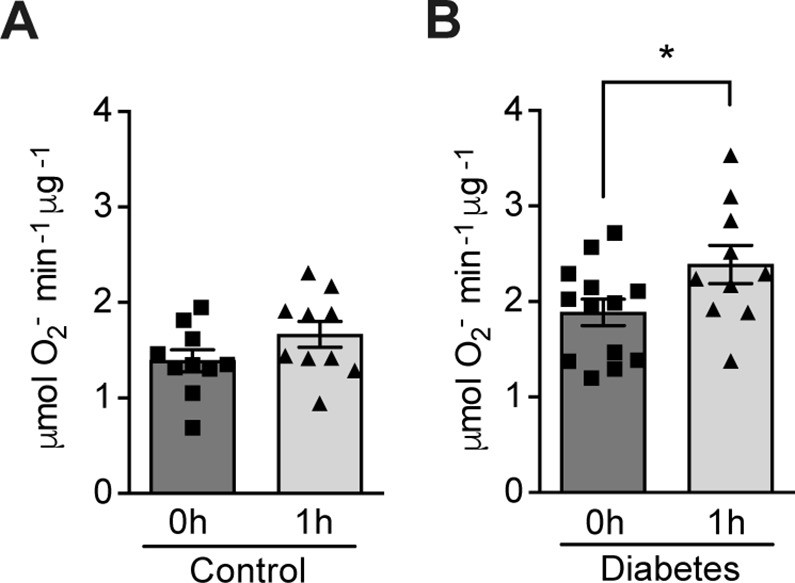
Hypoxia increases circulating ROS in patients with diabetes but not in control subjects without diabetes.
Healthy controls (A) and subjects with type 1 diabetes (B) were exposed to intermittent hypoxia for 1 hr. Peripheral blood was taken before (0h) and after (1h) hypoxia exposure. ROS levels were analyzed using Electron Paramagnetic Resonance (EPR) Spectroscopy with CPH spin probes (n = 10–13). Data are represented as mean ± SEM. *, p < 0.05 analysed using unpaired two-sided Student’s t-test. This figure has one figure supplement. Source data are shown in Figure 1—source data 1.
-
Figure 1—source data 1
ROS levels in blood from patients with diabetes and control subjects.
- https://cdn.elifesciences.org/articles/70714/elife-70714-fig1-data1-v1.xlsx
Figure 1—figure supplement 1
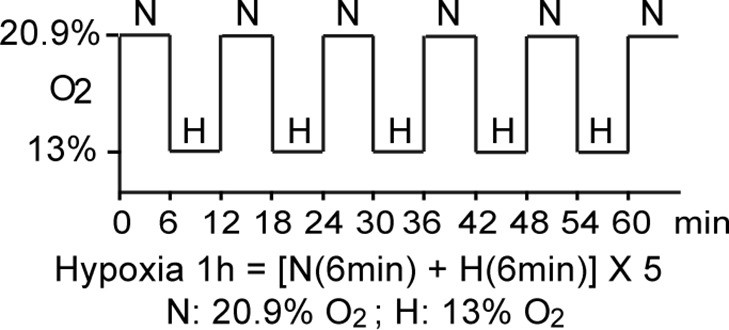
Schematic demonstration of hypoxia exposure protocol in the clinical study.
The study participants were exposed to intermittent hypoxia for 1 hr, consisting of five hypoxic episodes (H, 13% O2, 6 min) that alternate with normoxic episodes (N, 20.9% O2, 6 min).
Figure 2 with 1 supplement
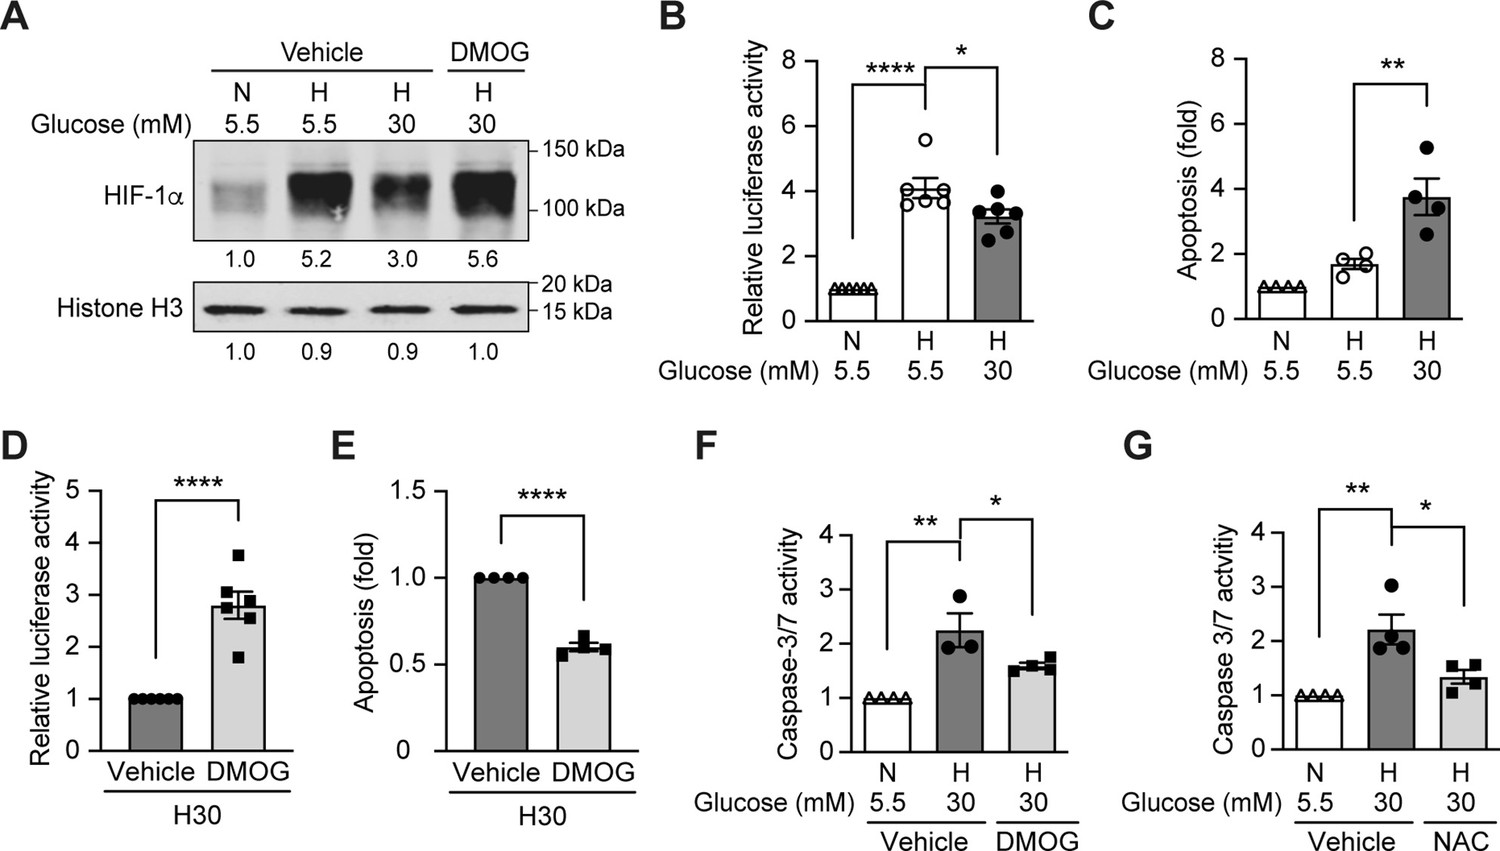
High glucose levels inhibit HIF-1 signaling and induce apoptosis, which can be rescued by PHD inhibitor DMOG.
(A) mIMCD-3 cells were cultured in normal (5.5 mM) or high (30 mM) glucose media in the presence of DMOG or vehicle for 24 hr, and were exposed to hypoxia (H) or normoxia (N) for 6 hr before harvest. The nuclear expression of HIF-1α and Histone H3 was measured using western blotting. (B–F) mIMCD-3 cells were exposed to 5.5 or 30 mM glucose levels in normoxia (N) or hypoxia (H) in the presence or absence of DMOG or vehicle for 24 hr. The relative HRE-driven luciferase activity (B and D, n = 6), apoptosis (C and E, n = 4), and the caspase 3/7 activity (F, n = 3–4) were assessed. (G) Caspase 3/7 activity was evaluated in mIMCD-3 cells that were pre-treated with 1 mM NAC or vehicle for 1 hr before exposure to 5.5 or 30 mM glucose levels in normoxia (N) or hypoxia (H) for 24 hr (n = 4). The data under control conditions were considered as 1.0. Data are shown as mean ± SEM. *, p < 0.05; **, p < 0.01; ***, p < 0.001; ****, p < 0.0001 using one-way ANOVA followed by Bonferroni’s post hoc test (B–C, F–G), and unpaired two-sided Student t-test (D–E). This figure has one figure supplement. Source data are shown in Figure 2—source data 1.
-
Figure 2—source data 1
HRE-driven luciferase activity, apoptosis and caspase 3/7 activity in mIMCD3 cells.
- https://cdn.elifesciences.org/articles/70714/elife-70714-fig2-data1-v1.xlsx
Figure 2—figure supplement 1
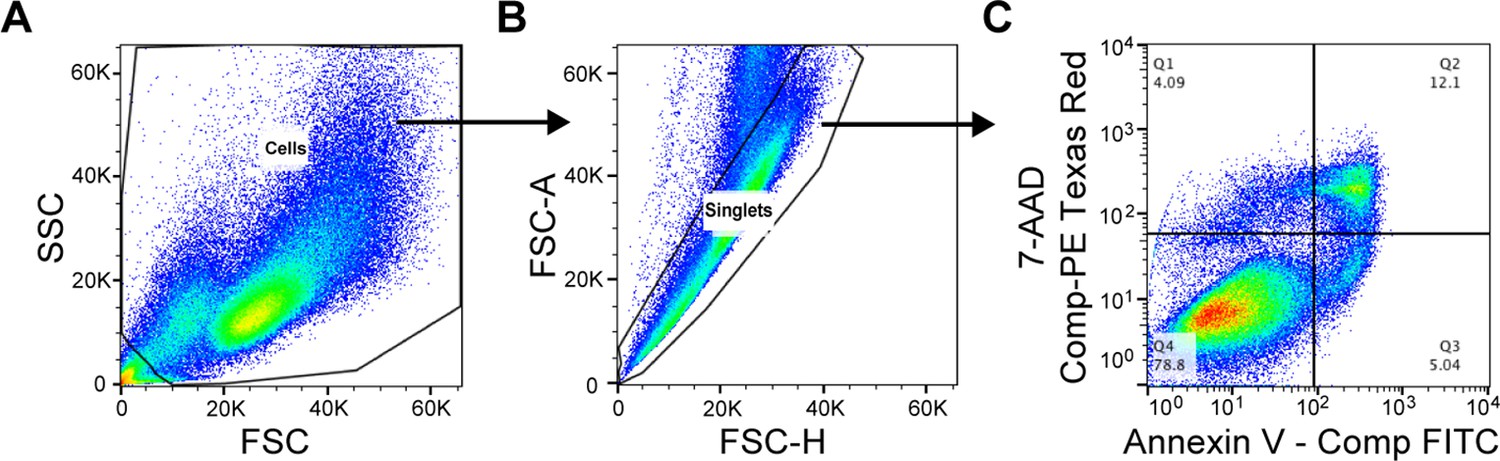
Flow cytometry gating strategy for the evaluation of cellular apoptosis.
Compensation controls were performed prior to flow analysis. (A) Cell population was defined based on FSC / SSC. (B) Single cells were gated based on FSC-H / FSC-A. (C) The Annexin V – positive and 7-AAD – negative apoptotic cell population is shown in Quadrant 3 (Q3) of the bivariate histogram based on the compensated intensity of Annexin V – FITC and 7-AAD – PE Texas Red.
Figure 3 with 2 supplements
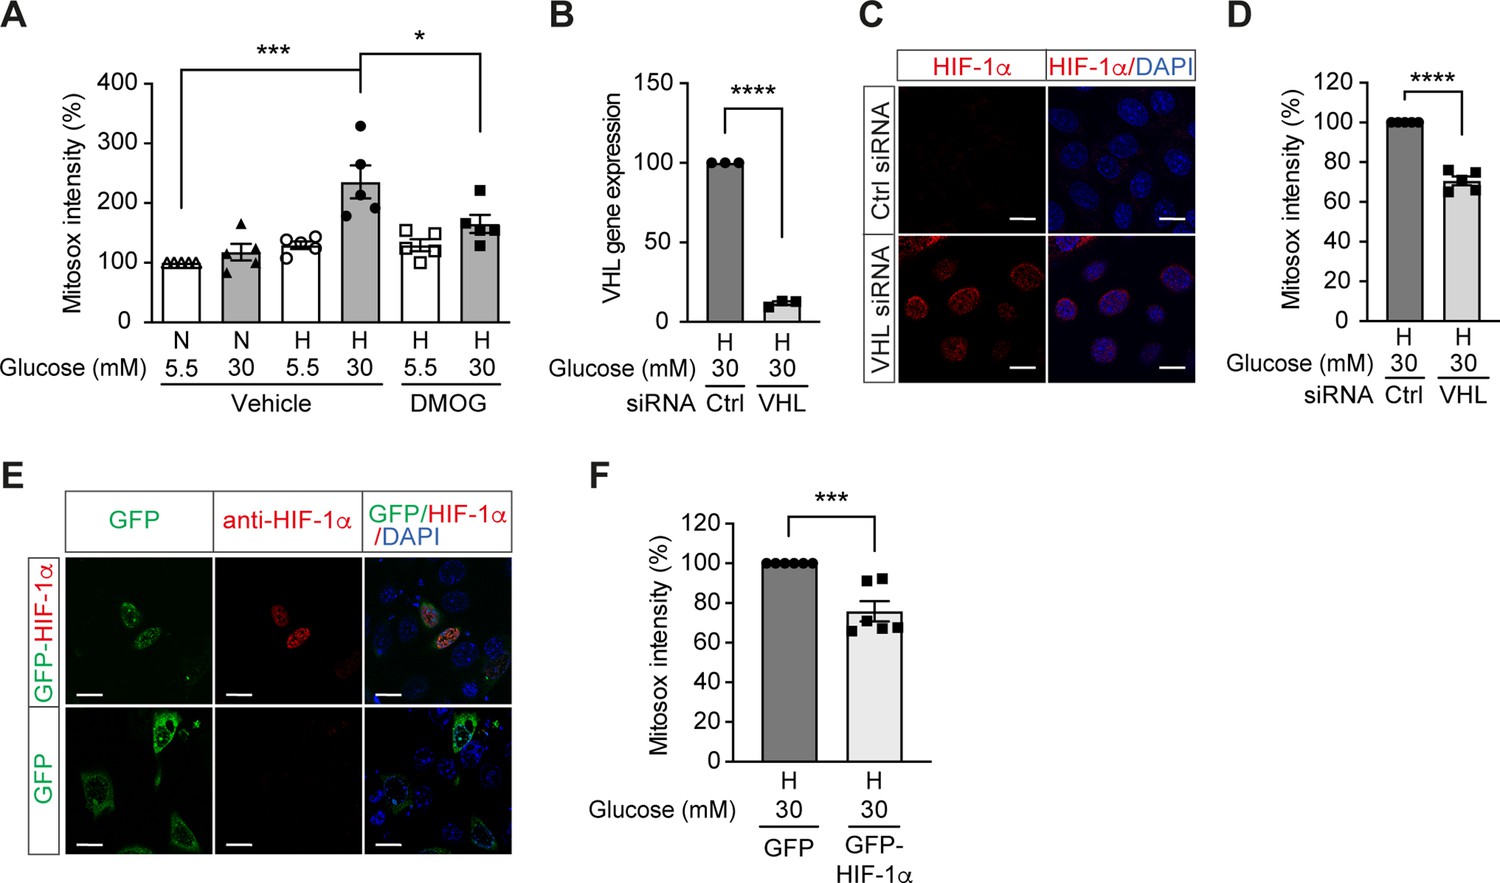
High glucose levels induce mitochondrial ROS overproduction in hypoxia, which can be rescued by promoting HIF-1 function.
(A) Mitochondrial ROS levels were measured as mitosox intensity in mIMCD-3 cells cultured in normal (5.5 mM) or high (30 mM) glucose media in normoxia (N) or hypoxia (H) for 24 hr in the presence of DMOG or vehicle (n = 5). (B–D) mIMCD-3 cells were transfected with von Hippel–Lindau tumour suppressor (VHL) or control (Ctrl) siRNA, and exposed to hypoxia (H) and 30 mM glucose for 24 hr. VHL gene expression (B, n = 3), endogenous HIF-1α expression (red) and DAPI staining (blue) (C) and mitochondrial ROS levels (D, n = 5) were assessed using quantitative RT-PCR, fluorescent immunocytochemistry and flow cytometry, respectively. (E and F) mIMCD-3 cells were transfected with plasmids encoding GFP or GFP-HIF-1α,and exposed to hypoxia and 30 mM glucose for 24 hr. (E) Expression of GFP and GFP-HIF-1α (green) were detected using confocal microscopy. The nuclear HIF-1α expression was confirmed by immucytochemistry using anti-HIF-1α antibody (red). Nuclei were stained blue with DAPI. (F) Mitochondrial ROS levels are shown (n = 6). The mitosox intensity of cells cultured under control conditions were considered as 100%. Data are shown as mean ± SEM. *, p < 0.05; ***, p < 0.001; ****, p < 0.0001 using one-way ANOVA followed by Bonferroni’s post hoc test (A), and unpaired two-sided Student t-test (B, D and F). This figure has two figure supplements. Source data are shown in Figure 3—source data 1. Scale bar: 50 μm.
-
Figure 3—source data 1
Mitosox intensity and VHL gene expression in mIMCD3 cells.
- https://cdn.elifesciences.org/articles/70714/elife-70714-fig3-data1-v1.xlsx
Figure 3—figure supplement 1

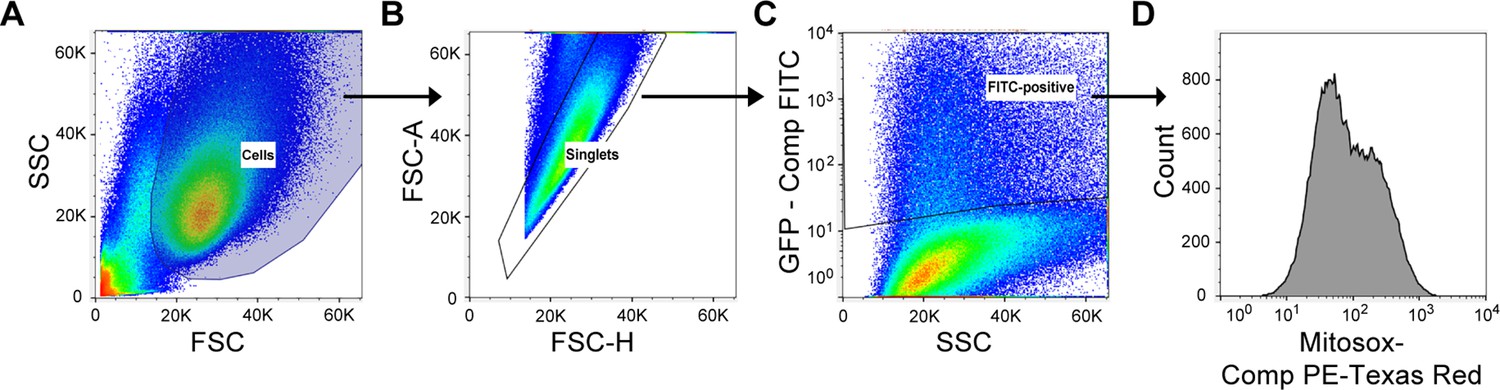
Flow cytometry gating strategy for the evaluation of mitosox intensity.
(A) Cell population was defined based on FSC / SSC. (B) Single cells were gated based on FSC-H / FSC-A. (C) Mitosox-PE-Texas red intensity was evaluated among single cells.
Figure 3—figure supplement 2
Flow cytometry gating strategy for the evaluation of mitosox intensity in mIMCD3 cells transfected with plasmids encoding GFP or GFP-fused protein.
Compensation controls were performed prior to flow analysis. (A) Cell population was defined based on FSC/SSC. (B) Single cells were gated based on FSC-H/FSC-A. (C) GFP-expressing (compensated (comp) FITC-positive) cells were gated among single cells. (D) Mitosox-PE-Texas red (compensated) intensity was evaluated among GFP-expressing (FITC-positive) cells.
Figure 4 with 3 supplements

Promoting HIF-1 function attenuates renal ROS excess and mitochondrial respiration in mouse models of diabetes.
Kidneys were harvested from wild-type (WT) and Leprdb/db diabetic mice (db/db) that were treated with placebo (vehicle) or DMOG (A–B, E, G), and from non-diabetic control (Ctrl) or diabetic (Db) wild-type (WT) and Egln1+/- mice (C–D, F, H). (A and C) HIF-1α (green), pimonidazole (red, hypoxia marker) and DAPI (blue, nuclear staining) signals were detected by fluorescent immunohistochemistry, and relative HIF-1α expression levels were quantified (A, n = 4–5; C, n = 4–6). Scale bar: 100 μm. (B and D) Renal ROS levels were detected using the OxiSelect HNE adduct competitive ELISA kit (B, n = 7–10; D, n = 5–8). (E and F) Mitochondrial respiratory function was evaluated using high resolution respirometry (E, n = 4–9; F, n = 11–17). (G and H) PDK1 gene expression in kidneys (G, n = 4–9; H, n = 4–6). (I and J) mIMCD-3 cells were transfected with plasmids encoding GFP or GFP-PDK1,and exposed to hypoxia and 30 mM glucose (H30) for 24 hr. (I) Expression of GFP and GFP-HIF-1α (green) and nuclear DAPI staining (blue) were detected using confocal microscopy. Scale bar: 50 μm. (J) Mitochondrial ROS levels are shown (n = 4). Data are shown as mean ± SEM. *, p < 0.05; **, p < 0.01; ***, p < 0.001; ****, p < 0.0001 using one-way ANOVA (A, B, E, G) and two-way ANOVA (C, D, F, H) followed by multi-comparison post hoc tests, and unpaired two-sided Student t-test (J). This figure has three figure supplements. Source data are shown in Figure 4—source data 1.
-
Figure 4—source data 1
HIF-1α, ROS, and mitochondrial respiration levels in mouse kidneys and PDK1 gene expression and Mitosox intensity in mIMCD3 cells.
- https://cdn.elifesciences.org/articles/70714/elife-70714-fig4-data1-v1.xlsx
Figure 4—figure supplement 1
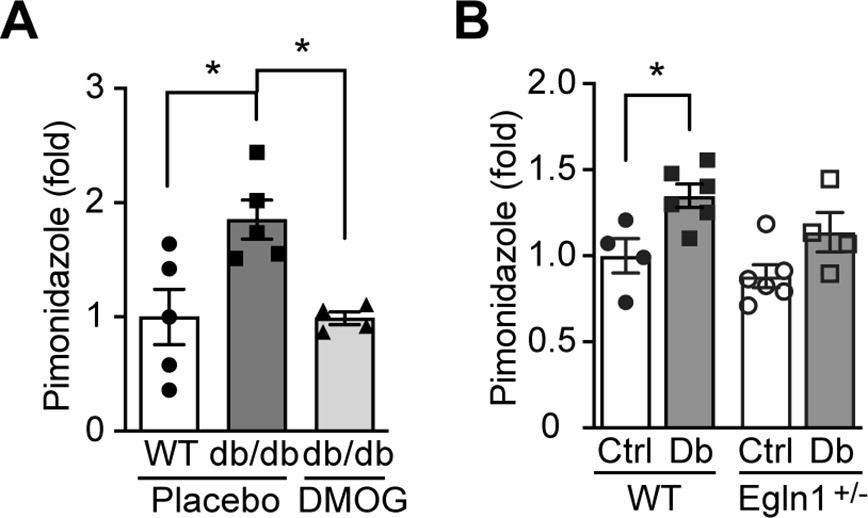
Kidney in diabetes is more hypoxic.
Pimonidazole (60 mg/kg body weight) was i.p. administered to mice 90 min prior to tissue harvest from wild-type (WT) and Leprdb/db diabetic mice (db/db) that were treated with placebo (vehicle) or DMOG (A), and from non-diabetic control (Ctrl) or diabetic (Db) wild-type (WT) and Egln1+/- mice (B). Pimonidazole adducts were detected on kidney sections using fluorescent immunohistochemistry and fold induction of pimonidazole signal is shown. *, p < 0.05 using one-way ANOVA (A) and two-way ANOVA (B) followed by multi-comparison post hoc tests. Source data are shown in Figure 4—figure supplement 1—source data 1.
-
Figure 4—figure supplement 1—source data 1
Quantification of Pimonidazole immunofluorescent signal in mouse kidneys.
- https://cdn.elifesciences.org/articles/70714/elife-70714-fig4-figsupp1-data1-v1.xlsx
Figure 4—figure supplement 2
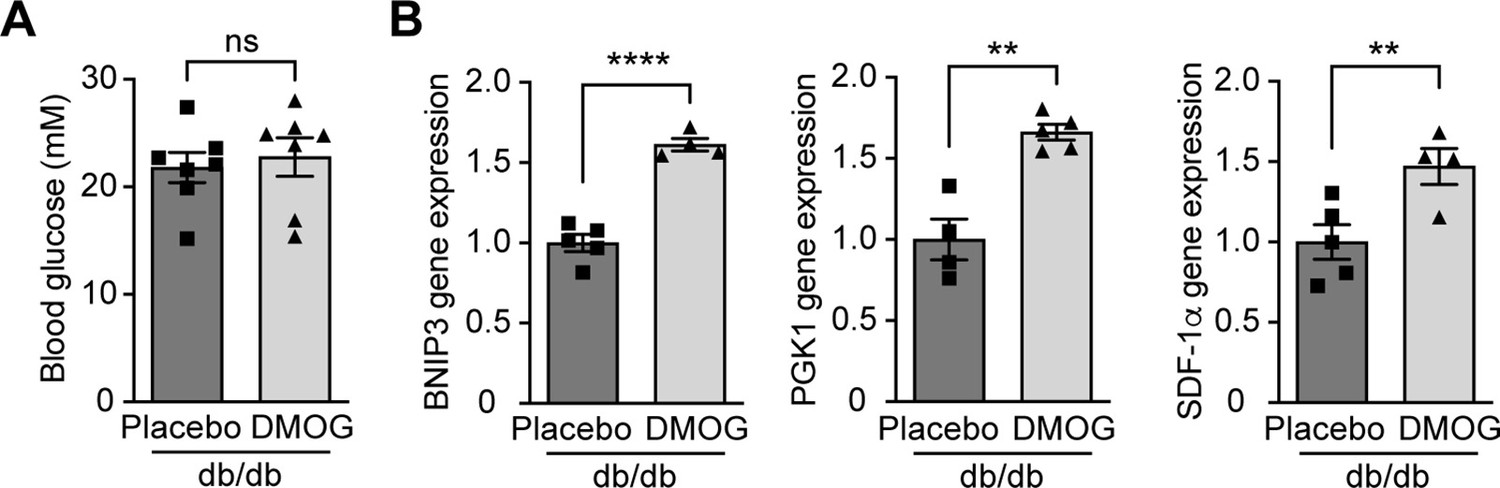
DMOG increases HIF-1 target gene expression in Leprdb/db mice without affecting blood glucose levels.
Leprdb/db diabetic mice (db/db) were treated with placebo (vehicle) or DMOG (50 mg / kg) for 4 weeks. (A) There was no difference in blood glucose in Leprdb/db mice treated with placebo or DMOG (n = 7). (B) QPCR results demonstrate that DMOG increased the gene expression of HIF-1 target genes (n = 4–5). Data are shown as mean ± SEM. ns = not significant. **, p < 0.01; ****, p < 0.0001 analysed using unpaired two-sided Student’s t-test. Source data are shown in Figure 4—figure supplement 2—source data 1.
-
Figure 4—figure supplement 2—source data 1
Blood glucose and HIF-1 target gene expression levels in Leprdb/db mice.
- https://cdn.elifesciences.org/articles/70714/elife-70714-fig4-figsupp2-data1-v1.xlsx
Figure 4—figure supplement 3
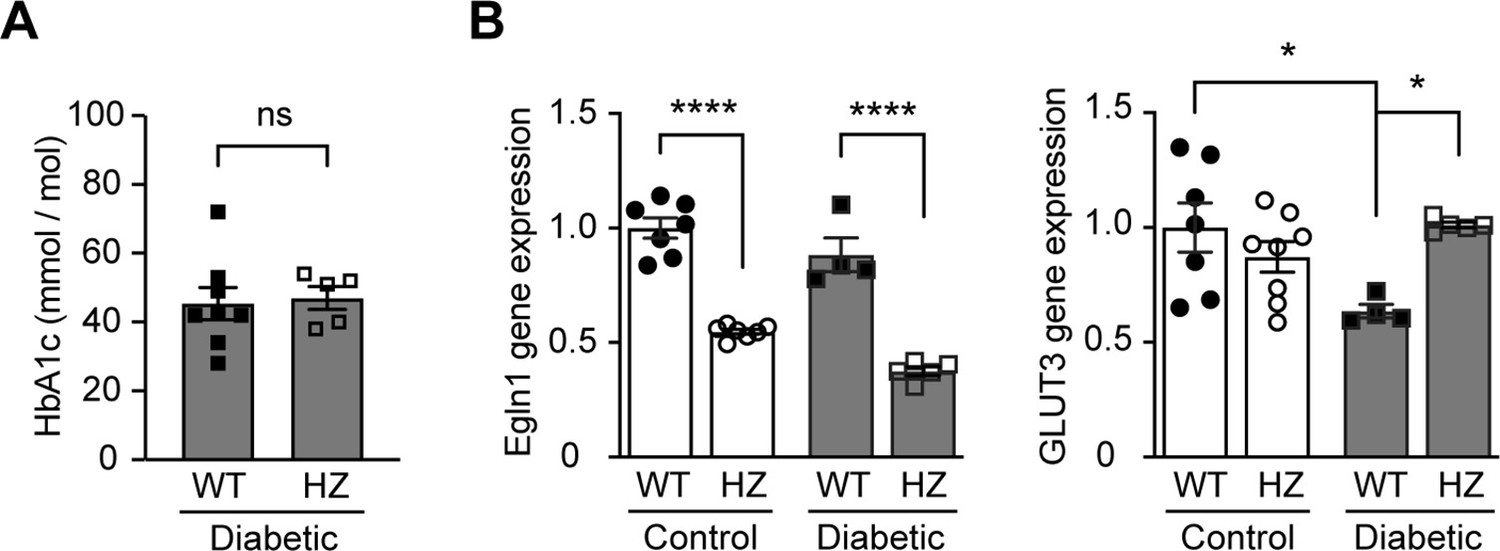
Egln1 haplodeficiency increases HIF-1 target gene expression in diabetic mice without affecting blood glucose levels.
Egln1 haplodeficient (Egln1+/-, HZ) and corresponding Wild-type (WT) mice were induced diabetes using STZ. HbA1c (A) and gene expression (B) of Egln1 and HIF-1 target gene GLUT3 were assessed in non-diabetic control and diabetic WT and Egln1+/- mice (n = 4–8). Data are shown as mean ± SEM, and were analyzed using unpaired two-sided Student’s t-test (A) and two-way ANOVA followed by Bonferroni’s post hoc test (B). ns = not significant; *, p < 0.05; ****, p < 0.0001. Source data are shown in Figure 4—figure supplement 3—source data 1.
-
Figure 4—figure supplement 3—source data 1
HbA1c and gene expression levels in Egln1+/- and WT mice.
- https://cdn.elifesciences.org/articles/70714/elife-70714-fig4-figsupp3-data1-v1.xlsx
Figure 5
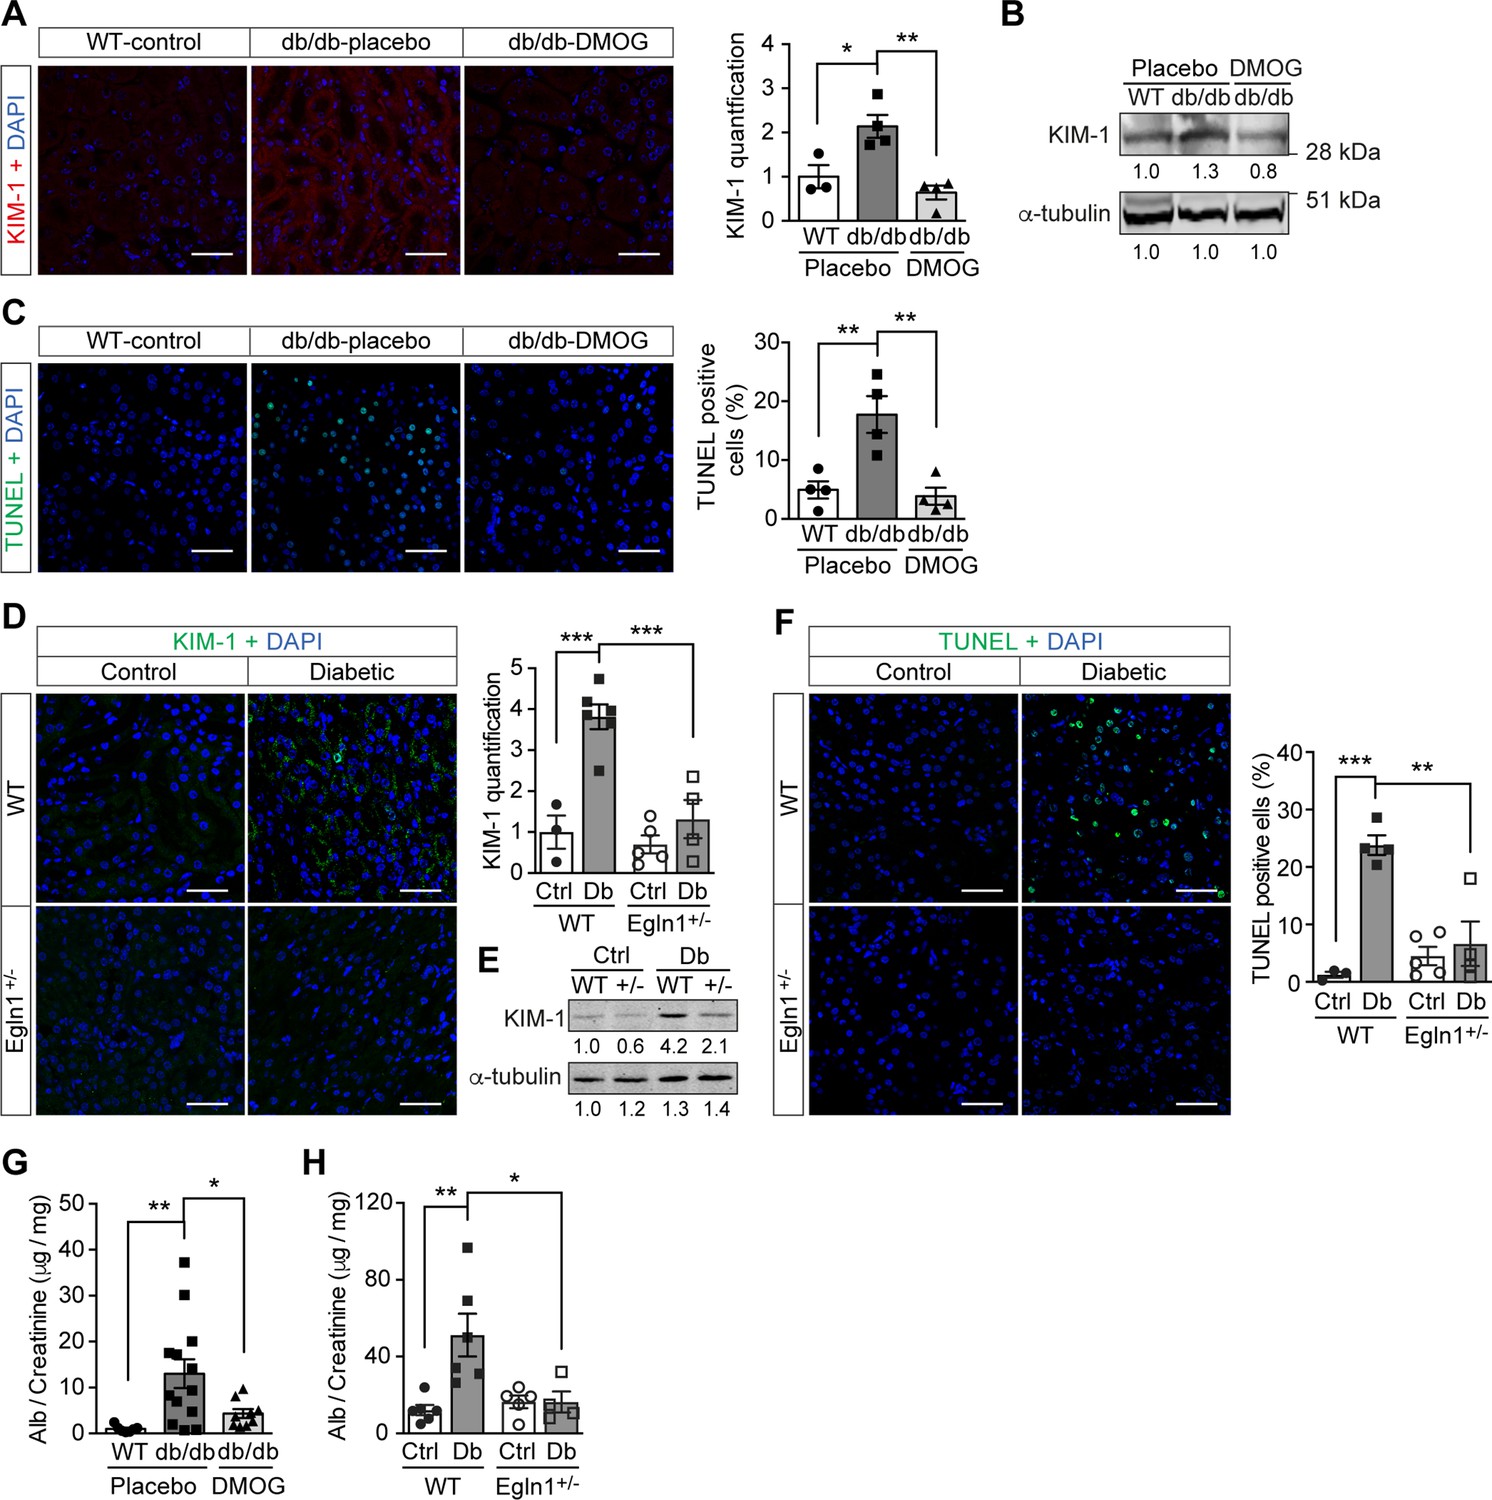
Promoting HIF-1 function reduces renal injury and ameliorates renal dysfunction in mouse models of diabetes.
Kidneys were harvested from wild-type (WT) and Leprdb/db diabetic mice (db/db) that were treated with placebo (vehicle) or DMOG (A–C, G), and from non-diabetic control (Ctrl) or diabetic (Db) wild-type (WT) and Egln1+/- (+/-) mice (D–F, H). (A and D) Representative images of KIM-1 (red or green) and DAPI (blue) in kidney that were analysed using fluorescent immunohistochemistry. Quantifications of KIM-1 fluoresent signal are shown in corresponding histogram (A, n = 3–4; D, n = 3–6). (B and E) Representative images of KIM-1 and α-tubulin analyzed by western blotting. (C and F) Apoptotic cells were detected using TUNEL staining, and the percentage of TUNEL-positive cells were quantified (C, n = 4; F: n = 3–5). (G and H) Albuminuria is presented as the ratio of albumin (Alb) to creatinine in mouse urine (G, n = 7–13; H, n = 4–6). Data are shown as mean ± SEM. *, p < 0.05; **, p < 0.01; ***, p < 0.001 analysed using one-way ANOVA (A, C), Brown-Forsythe and Welch ANOVA (G) and two-way ANOVA (D, F, H) followed by multi-comparison test. Source data are shown in Figure 5—source data 1. Scale bar: 100 μm.
-
Figure 5—source data 1
Evaluation of renal KIM-1 and TUNEL staining and albuminuria of mouse models.
- https://cdn.elifesciences.org/articles/70714/elife-70714-fig5-data1-v1.xlsx
Figure 6
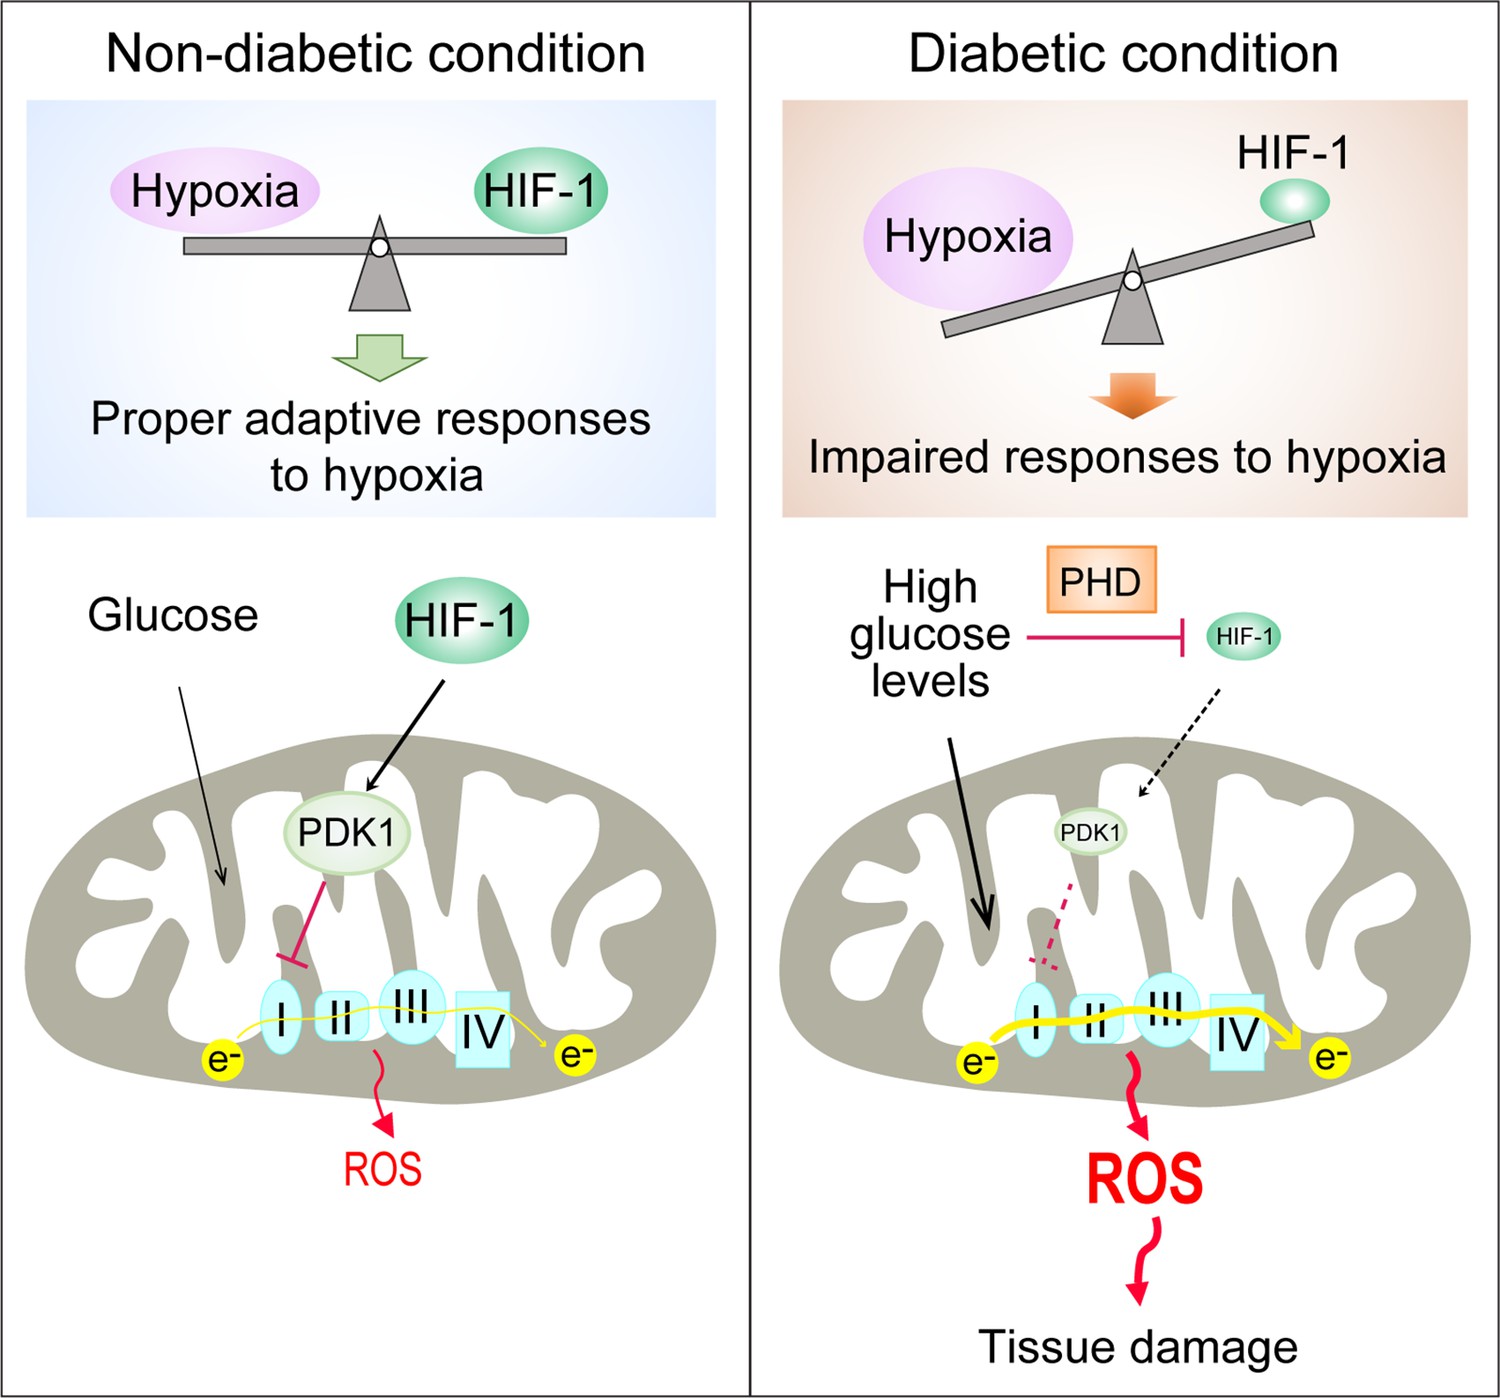
Repression of HIF-1 contributes to increased mitochondrial ROS production in diabetes.
Under non-diabetic conditions (left panel), HIF-1 is induced by hypoxia and activates PDK1 expression which inhibits excess mitochondrial ROS production through inhibition of mitochondrial respiration. However, under diabetic conditions (right panel), HIF-1 is inhibited by high glucose levels through a PHD-dependent mechanism despite hypoxia. This results in decreased expression of PDK1, leading to increased mitochondrial respiration and excessive mitochondrial ROS production which causes tissue damage.
Tables
Table 1
Characteristics of Leprdb/db (db/db) and control mice prior to experiments.
| Groups | WT-Control | Db/db-Control | Db/db-DMOG |
|---|---|---|---|
| Body weight (g) | 27.44 ± 0.41 | 48.66 ± 1.00 | 50.04 ± 1.08 |
| Blood glucose (mM) | 7.16 ± 0.39 | 21.27 ± 1.21 | 20.59 ± 1.50 |
| Age (weeks) | 16 ± 0 | 17.25 ± 0.48 | 17.00 ± 0.45 |
| n | 14 | 16 | 16 |
-
Data are presented as mean ± SEM. Source data are shown in Table 1—source data 1.
-
Table 1—source data 1
Characteristics of Leprdb/db and control mice prior to experiments.
- https://cdn.elifesciences.org/articles/70714/elife-70714-table1-data1-v1.xlsx
Table 2
Characteristics of Egln1+/- and WT mice prior to experiments.
| Groups | WT-Control | Egln1+/--Control | WT-diabetic | Egln1+/--diabetic |
|---|---|---|---|---|
| Start body weight (g) | 28.02 ± 1.04 | 27.11 ± 0.79 | 28.27 ± 0.71 | 28.64 ± 0.87 |
| Age (weeks) | 22.46 ± 0.85 | 23.91 ± 0.72 | 22.67 ± 0.87 | 24.57 ± 0.59 |
| n | 24 | 23 | 24 | 21 |
-
Data are presented as mean ± SEM. Source data are shown in Table 2—source data 1.
-
Table 2—source data 1
Characteristics of Egln1+/- and WT mice prior to experiments.
- https://cdn.elifesciences.org/articles/70714/elife-70714-table2-data1-v1.xlsx
Table 3
Blood glucose of Egln1+/- and WT mice before and after STZ injection.
| Groups | WT-diabetic | Egln1+/--diabetic |
|---|---|---|
| Blood glucose (mM) before STZ | 5.11 ± 0.24 | 4.18 ± 0.20 |
| Blood glucose (mM) after STZ | 19.39 ± 1.04 | 17.7 ± 0.81 |
| n | 24 | 21 |
-
Data are presented as mean ± SEM. Source data are shown in Table 3—source data 1.
-
Table 3—source data 1
Blood glucose of Egln1+/- and WT mice before and after STZ injection.
- https://cdn.elifesciences.org/articles/70714/elife-70714-table3-data1-v1.xlsx
Appendix 1—key resources table
| Reagent type (species) or resource | Designation | Source or reference | Identifiers | Additional information |
|---|---|---|---|---|
| Strain, strain background (Mus musculus; male) | BKS(D)-Leprdb/JOrlRj, Leprdb/db diabetic mice | Janvier Labs | RRID:MGI:6293869 | |
| Strain, strain background (Mus musculus; male) | C57BL/6JRj Mouse | Janvier Labs | RRID:MGI:5751862 | |
| Strain, strain background (Mus musculus; male) | Egln1+/- and wild-type mice | Own colony | PMID:19217150Mazzone et al., 2009 | |
| Cell line (Mus musculus) | mIMCD-3 cell line | ATCC | Cat#:CRL-2123;RRID:CVCL_0429 | |
| Transfected construct (M. musculus) | siRNA to mouse VHL | Qiagen | Gene Solution siRNA (Cat#: 1027416) | Target sequence: TCCGAGATTGATCTACACATA |
| Transfected construct (M. musculus) | AllStars Negative Control siRNA | Qiagen | Cat#: 1027280 | |
| Antibody | anti-HIF-1alpha (Rabbit polyclonal) | GeneTex | Cat#: GTX127309; RRID:AB_2616089 | ICC(1:200)IHC(1:100) |
| Antibody | anti-KIM-1 (Rabbit polyclonal) | Novus Biologicals | Cat#:NBP1-76701;RRID:AB_11037459 | IHC(1:50)WB(1:500) |
| Antibody | Goat anti-Rabbit Secondary Antibody, Alexa Fluor 594 | Thermo Fisher Scientific | Cat#:A-11037;RRID:AB_2534095 | ICC (1:500)IHC (1:500) |
| Antibody | Goat anti-Rabbit Secondary Antibody, Alexa Fluor 488 | Thermo Fisher Scientific | Cat#:A-11008;RRID:AB_143165 | IHC (1:500)WB (1:500) |
| Antibody | anti-HIF-1alpha (Rabbit polyclonal) | Novus Biologicals | Cat#:NB100-479;RRID:AB_10000633 | WB: 1:500 |
| Antibody | anti-Histone H3 (Rabbit polyclonal) | Abcam | Cat#: ab1791;RRID:AB_302613 | WB: 1:5,000 |
| Antibody | anti-α-tubulin (mouse monoclonal) | Abnova | Cat#:MAB11106; RRID:AB_2888691 | WB:1:1,000 |
| Antibody | IRDye 800 goat anti-rabbit Secondary Antibody | LI_COR Biosciences | Cat#:925–32211; RRID:AB_2651127 | WB:1:20,000 |
| Antibody | IRDye 680 goat anti-mouse Secondary Antibody | LI_COR Biosciences | Cat#:925–68070; RRID:AB_2651128 | WB:1:20,000 |
| Recombinant DNA reagent | pCMV3-FLAG-PDK1 | Sino Biological Inc | Cat#: HG12312-NF | Plasmid encoding FLAG-tagged human PDK1 |
| Recombinant DNA reagent | pCMV3-GFP-FLAG-PDK1 | This paper | Plasmid encoding GFP-fused FLAG-tagged human PDK1 | |
| Sequence-based reagent | Mouse PDK1_F | This paper | PCR primers | AGTCCGTTGTCCTTATGAG |
| Sequence-based reagent | Mouse PDK1_R | This paper | PCR primers | CAGAACATCCTTGCCCAG |
| Sequence-based reagent | Mouse BNIP3_F | This paper | PCR primers | AACAGCACTCTGTCTGAGG |
| Sequence-based reagent | Mouse BNIP3_R | This paper | PCR primers | CCGACTTGACCAATCCCA |
| Sequence-based reagent | Mouse PGK1_F | This paper | PCR primers | AGTCCGTTGTCCTTATGAG |
| Sequence-based reagent | Mouse PGK1_R | This paper | PCR primers | CAGAACATCCTTGCCCAG |
| Sequence-based reagent | MouseSDF-1alpha_F | This paper | PCR primers | GAGAGCCACATCGCCAGAG |
| Sequence-based reagent | MouseSDF-1alpha_R | This paper | PCR primers | TTTCGGGTCAATGCACACTTG |
| Sequence-based reagent | MouseEgln1_F | This paper | PCR primers | GGGCAACTACAGGATAAACGG |
| Sequence-based reagent | Mouse Egln1_R | This paper | PCR primers | CTCCACTTACCTTGGCGT |
| Sequence-based reagent | Mouse GLUT3_F | This paper | PCR primers | TCATCTCCATTGTCCTCCAG |
| Sequence-based reagent | Mouse GLUT3_R | This paper | PCR primers | CCAGGAACAGAGAAACTACAG |
| Sequence-based reagent | MouseACTB_F | This paper | PCR primers | AAGATCAAGATCATTGCTCCTC |
| Sequence-based reagent | MouseACTB_R | This paper | PCR primers | GGACTCATCGTACTCCTG |
| Sequence-based reagent | MouseHMBS_F | This paper | PCR primers | CCTGTTCAGCAAGAAGATGGTC |
| Sequence-based reagent | MouseHMBS_R | This paper | PCR primers | AGAAGTAGGCAGTGGAGTGG |
| Sequence-based reagent | MouseVHL_F | This paper | PCR primers | CATCACATTGCCAGTGTATACCC |
| Sequence-based reagent | MouseVHL_R | This paper | PCR primers | GCTGTATGTCCTTCCGCAC |
| Commercial assay or kit | MycoAlert PLUS mycoplasma detection kit | LONZA | Cat#:LT07-218 | |
| Commercial assay or kit | Dual-Luciferase Reporter Assay System | Promega | Cat#: E1960 | |
| Commercial assay or kit | Annexin V-FITC / 7-AAD kit | Beckman Coulter | Cat#: IM3614 | |
| Commercial assay or kit | Caspase-Glo 3/7 assay kit | Promega | Cat#: G8091 | |
| Commercial assay or kit | Quant-iT dsDNA High-Sensitivity Assay Kit | Thermo Fisher Scientific | Cat#: Q33120 | |
| Commercial assay or kit | Lipofectamine RNAiMAX Transfection Reagent | Thermo Fisher Scientific | Cat#: 13778075 | |
| Commercial assay or kit | MitoSOX Red Mitochondrial Superoxide Indicator, for live-cell imaging | Thermo Fisher Scientific | Cat#:M36008 | |
| Commercial assay or kit | ProLong Gold Antifade Mountant with DAPI | Thermo Fisher Scientific | Cat#:P36935 | |
| Commercial assay or kit | DAPI | Thermo Fisher Scientific | Cat#:D1306 | |
| Commercial assay or kit | Hypoxyprobe–1 Omni Kit | Hypoxyprobe, Inc | Cat#:HP1-XXX | |
| Commercial assay or kit | Tyramide Superboost kit | Thermo Fisher Scientific | Cat#:B40943 | |
| Commercial assay or kit | OxiSelectTM HNE Adduct Competitive ELISA kit | Cell Biolabs | STA838 | |
| Commercial assay or kit | DC Protein Assay | BIO-RAD | Cat#:5000111 | |
| Commercial assay or kit | miRNeasy Mini kit | Qiagen | Cat#:217,004 | |
| Commercial assay or kit | High-Capacity cDNA Reverse Transcription Kit | Thermo Fisher Scientific | Cat#:4368814 | |
| Commercial assay or kit | SYBR Green Master Mix | Thermo Fisher Scientific | Cat#:4367659 | |
| Commercial assay or kit | Bradford Protein Assay | BIO-RAD | Cat#:5000001 | |
| Commercial assay or kit | In Situ Cell Death Detection Kit | Roche | Cat#:11684817910RRID:AB_2861314 | |
| Commercial assay or kit | DCA Microalbumin/Creatinine Urine Test | Siemens Healthcare GmbH | Cat#:01443699 | |
| Chemical compound, drug | CPH (1-hydroxy-3-carboxy-pyrrolidine) | Noxygen Science Transfer & Diagnostics GmbH | Cat#:NOX-01.1–50 mg | |
| Chemical compound, drug | EPR-grade Krebs HEPES buffer | Noxygen Science Transfer & Diagnostics GmbH | Cat#:NOX-7.6.1–500 ml | |
| Chemical compound, drug | Deferoxamine | Noxygen Science Transfer & Diagnostics GmbH | Cat#:NOX-09.1–100 mg | |
| Chemical compound, drug | DETC (diethyldithiocarbamate) | Noxygen Science Transfer & Diagnostics GmbH | Cat#:NOX-10.1–1 g | |
| Chemical compound, drug | DMOG (Dimethyloxalylglycine) | Frontier Specialty Chemicals | Cat#:D1070 | |
| Chemical compound, drug | cOmplete, Mini, EDTA-free Protease Inhibitor Cocktail | Roche | Cat#: 11836170001 | |
| Chemical compound, drug | Formaldehyde solution | Sigma | Cat#: F8775 | |
| Chemical compound, drug | Streptozotocin | Sigma | Cat#: S0130 | |
| Chemical compound, drug | Sudan Black B | Sigma | Cat#:199,664 | |
| Software, algorithm | FlowJo | FlowJo | RRID:SCR_008520 | |
| Software, algorithm | Image-Pro Premier v9.2 | Media Cybernetics | ||
| Software, algorithm | ImageJ | ImageJ | RRID:SCR_003070 | |
| Software, algorithm | GraphPad Prism | GraphPad Prism | RRID:SCR_002798 | |
| Other | Dulbecco’s Modified Eagle’s Medium | Thermo Fisher Scientific | 31885–023 |
Additional files
-
Transparent reporting form
- https://cdn.elifesciences.org/articles/70714/elife-70714-transrepform1-v1.pdf
-
Source data 1
Unedited blots.
- https://cdn.elifesciences.org/articles/70714/elife-70714-supp1-v1.zip
Download links
A two-part list of links to download the article, or parts of the article, in various formats.
Downloads (link to download the article as PDF)
Open citations (links to open the citations from this article in various online reference manager services)
Cite this article (links to download the citations from this article in formats compatible with various reference manager tools)
Repression of hypoxia-inducible factor-1 contributes to increased mitochondrial reactive oxygen species production in diabetes
eLife 11:e70714.
https://doi.org/10.7554/eLife.70714


