Control of Arabidopsis shoot stem cell homeostasis by two antagonistic CLE peptide signalling pathways
- Institute for Developmental Genetics and Cluster of Excellence on Plant Sciences, Heinrich Heine University, Germany
Abstract
Stem cell homeostasis in plant shoot meristems requires tight coordination between stem cell proliferation and cell differentiation. In Arabidopsis, stem cells express the secreted dodecapeptide CLAVATA3 (CLV3), which signals through the leucine-rich repeat (LRR)-receptor kinase CLAVATA1 (CLV1) and related CLV1-family members to downregulate expression of the homeodomain transcription factor WUSCHEL (WUS). WUS protein moves from cells below the stem cell domain to the meristem tip and promotes stem cell identity, together with CLV3 expression, generating a negative feedback loop. How stem cell activity in the meristem centre is coordinated with organ initiation and cell differentiation at the periphery is unknown. We show here that the CLE40 gene, encoding a secreted peptide closely related to CLV3, is expressed in the SAM in differentiating cells in a pattern complementary to that of CLV3. CLE40 promotes WUS expression via BAM1, a CLV1-family receptor, and CLE40 expression is in turn repressed in a WUS-dependent manner. Together, CLE40-BAM1-WUS establish a second negative feedback loop. We propose that stem cell homeostasis is achieved through two intertwined pathways that adjust WUS activity and incorporate information on the size of the stem cell domain, via CLV3-CLV1, and on cell differentiation via CLE40-BAM1.
eLife digest
Plants are sessile lifeforms that have evolved many ways to overcome this challenge. For example, they can quickly adapt to their environment, and they can grow new organs, such as leaves and flowers, throughout their lifetime.
Stem cells are important precursor cells in plants (and animals) that can divide and specialize into other types of cells to help regrow leaves and flowers. A region in the plant called meristem, which can be found in the roots and shoots, continuously produces new organs in the peripheral zone of the meristem by maintaining a small group of stem cells in the central zone of the meristem.
This is regulated by a signalling pathway called CLV and a molecule produced by the stem cells in the central zone, called CLV3. Together, they keep a protein called WUS (found in the deeper meristem known as the organizing zone) at low levels. WUS, in turn, increases the production of stem cells that generate CLV3. However, so far it was unclear how the number of stem cells is coordinated with the rate of organ production in the peripheral zone.
To find out more, Schlegel et al. studied cells in the shoot meristems from the thale cress Arabidopsis thaliana. The researchers found that cells in the peripheral zone produce a molecule called CLE40, which is similar to CLV3. Unlike CLV3, however, CLE40 boosts the levels of WUS, thereby increasing the number of stem cells. In return, WUS reduces the production of CLE40 in the central zone and the organizing centre. This system allows meristems to adapt to growing at different speeds.
These results help reveal how the activity of plant meristems is regulated to enable plants to grow new structures throughout their life. Together, CLV3 and CLE40 signalling in meristems regulate stem cells to maintain a small population that is able to respond to changing growth rates. This understanding of stem cell control could be further developed to improve the productivity of crops.
Introduction
In angiosperms, the stem cell domain in shoot meristem is controlled by the directional interplay of two adjacent groups of cells. These are the central zone (CZ) at the tip of the dome-shaped meristem, comprising slowly dividing stem cells, and the underlying cells of the organizing centre (OC). Upon stem cell division, daughter cells are displaced laterally into the peripheral zone (PZ), where they can enter differentiation pathways (Fletcher et al., 1999; Hall and Watt, 1989; Reddy et al., 2004; Schnablová et al., 2020; Stahl and Simon, 2005; Steeves and Sussex, 1989). Cells in the OC express the homeodomain transcription factor WUSCHEL (WUS), which moves through plasmodesmata to CZ cells to maintain stem cell fate and promote expression of the secreted signalling peptide CLAVATA3 (CLV3) (Brand et al., 2000; Daum et al., 2014; Müller et al., 2006; Schoof et al., 2000; Yadav et al., 2011). Perception of CLV3 by plasma membrane-localized receptors in the OC cells triggers a signal transduction cascade and downregulates WUS activity, thus establishing a negative feedback loop (Mayer et al., 1998; Ogawa et al., 2008; Yadav et al., 2011). Mutants of CLV3 or its receptors (see below) fail to confine WUS expression and cause stem cell proliferation, while WUS mutants cannot maintain an active stem cell population (Brand et al., 2002; Clark et al., 1993; Clark et al., 1995; Endrizzi et al., 1996; Laux et al., 1996; Schoof et al., 2000). WUS function in the OC is negatively regulated by HAM transcription factors, and only WUS protein that moves upwards to the stem cell zone, which lacks HAM expression, can activate CLV3 expression (Han et al., 2020; Zhou et al., 2018). The CLV3-WUS interaction can serve to maintain the relative sizes of the CZ and OC, and thereby meristem growth along the apical-basal axis. However, cell loss from the PZ due to production of lateral organs requires a compensatory size increase of the stem cell domain.
The CLV3 signalling pathway, which acts along the apical-basal axis of the meristem, has been widely studied in several plant species and shown to be crucial for stem cell homeostasis in shoot and floral meristems (Somssich et al., 2016). The CLV3 peptide is perceived by a leucine-rich repeat (LRR) receptor kinase, CLAVATA1 (CLV1), which interacts with coreceptors of the CLAVATA3 INSENSITIVE RECEPTOR KINASES (CIK) 1–4 family (Clark et al., 1997; Cui et al., 2018). CLV1 activation involves autophoshorylation, interaction with membrane-associated and cytosolic kinases and phosphatases (Blümke et al., 2021; Defalco et al., 2021). Furthermore, heterotrimeric G-proteins and MAPKs have been implicated in this signal transduction cascade in maize and Arabidopsis (Betsuyaku et al., 2011; Bommert et al., 2013; Ishida et al., 2014; Lee et al., 2019). Besides CLV1, several other receptors contribute to WUS regulation, among them RECEPTOR-LIKE PROTEIN KINASE2 (RPK2), the CLAVATA2-CORYNE heteromer (CLV2-CRN) and BARELY ANY MERISTEM1-3 (BAM1-3) (Bleckmann et al., 2010; Deyoung and Clark, 2008; Hord et al., 2006; Jeong et al., 1999; Kinoshita et al., 2010; Müller et al., 2008). The BAM receptors share high-sequence similarity with CLV1 and perform diverse functions throughout plant development. Double mutants of BAM1 and BAM2 maintain smaller shoot and floral meristems, thus displaying the opposite phenotype to mutants of CLV1 (DeYoung et al., 2006; Deyoung and Clark, 2008; Hord et al., 2006). Interestingly, ectopic expression experiments showed that CLV1 and BAM1 can perform similar functions in stem cell control (Nimchuk et al., 2015). In addition, one study showed that CLV3 could interact with CLV1 and BAM1 in cell extracts (Shinohara and Matsubayashi, 2015), although another in vitro study did not detect BAM1-CLV3 interaction at physiological levels of CLV3 (Crook et al., 2020). Furthermore, CLV1 was shown to act as a negative regulator of BAM1 expression, which was interpreted as a genetic buffering system, whereby a loss of CLV1 is compensated by upregulation of BAM1 in the meristem centre (Nimchuk, 2017; Nimchuk et al., 2015). Comparable genetic compensation models for CLE peptide signalling in stem cell homeostasis were established for other species, such as tomato and maize (Rodriguez-Leal et al., 2019).
Maintaining the overall architecture of the shoot apical meristem during the entire life cycle of the plant requires replenishment of differentiating stem cell descendants in the PZ, indicating that cell division rates and cell fate changes in both regions are closely connected (Stahl and Simon, 2005). Overall meristem size is restricted by the ERECTA-family signalling pathway, which is activated by EPIDERMAL PATTERNING FACTOR (EPF)-LIKE (EPFL) ligands from the meristem periphery and confines both CLV3 and WUS expression (Mandel et al., 2014; Shpak, 2013; Shpak et al., 2004; Torii et al., 1996; Zhang et al., 2021). In the land plant lineage, the shoot meristems of bryophytes such as the moss Physcomitrium patens appear less complex than those of angiosperms and carry only a single apical stem cell which ensures organ initiation by continuous asymmetric cell divisions (de Keijzer et al., 2021; Harrison et al., 2009). Broadly expressed CLE peptides were here found to restrict stem cell identity and act in division plane control (Whitewoods et al., 2018). Proliferation of the apical notch cell in the liverwort Marchantia polymorpha is promoted by MpCLE2 peptide which acts from outside the stem cell domain via the receptor MpCLV1, while cell proliferation is confined by MpCLE1 peptide through a different receptor (Hata and Kyozuka, 2021; Hirakawa et al., 2019; Hirakawa et al., 2020; Takahashi et al., 2021). Thus, antagonistic control of stem cell activities through diverse CLE peptides is conserved between distantly related land plants. In the grasses, several CLEs were found to control the stem cell domain. In maize, ZmCLE7 is expressed from the meristem tip, while ZmFCP1 is expressed in the meristem periphery and its centre. Both peptides restrict stem cell fate via independent receptor signalling pathways (Liu et al., 2021; Rodriguez-Leal et al., 2019). In rice, overexpression of the CLE peptides OsFCP1 and OsFCP2 downregulates the homeobox gene OSH1 and arrests meristem function (Ohmori et al., 2013; Suzaki et al., 2008). Common for rice and maize, CLE peptide signalling restricts stem cell activities in the shoot meristem, but a stem cell-promoting pathway was not identified so far.
Importantly, how stem cell activities in the CZ and OC are coordinated to regulate organ initiation and cell differentiation in the PZ, which is crucial to maintain an active meristem, is not yet known. In maize, the CLV3-related peptide ZmFCP1 was suggested to be expressed in primordia and convey a repressive signal on the stem cell domain (Je et al., 2016). In Arabidopsis, the most closely related peptide to CLV3 is CLE40, which was shown to act in the root meristem to restrict columella stem cell fate and regulate the expression of the WUS paralog WOX5 (Berckmans et al., 2020; Hobe et al., 2003; Pallakies and Simon, 2014; Stahl et al., 2013; Stahl and Simon, 2010). Endogenous functions of CLE40 in the SAM have not previously been described, although overexpression of CLE40 causes shoot stem cell termination, while CLE40 expression from the CLV3 promoter fully complements the shoot and floral meristem defects of clv3 mutants (Hobe et al., 2003). We therefore hypothesized that CLE40 could act in a CLV3-related pathway in shoot stem cell control.
Here, we show that the expression level of WUS in the OC is subject to feedback regulation from the PZ, which is mediated by the secreted peptide CLE40. In the shoot meristem, CLE40 is expressed in a complementary pattern to CLV3 and excluded from the CZ and OC. In cle40 loss-of-function mutants, WUS expression is reduced, and shoot meristems remain small and flat, indicating that CLE40 signalling is required to maintain WUS expression in the OC. Ectopic expression of WUS represses CLE40 expression, while in wus loss-of-function mutants CLE40 is expressed in the meristem centre, indicating that CLE40, in contrast to CLV3, is subject to negative feedback regulation by WUS. CLE40 likely acts as an autocrine signal that is perceived by BAM1 in a domain flanking the OC.
Based on our findings, we propose a new model for the regulation of the stem cell domain in the shoot meristem in which signals and information from both the CZ and the PZ are integrated through two interconnected negative feedback loops that sculpt the dome-shaped shoot meristems of angiosperms.
Results
CLE40 signalling promotes IFM growth from the PZ
Previous studies showed that CLE40 expression from the CLV3 promoter can fully complement a clv3-2 mutant, indicating that CLE40 can substitute CLV3 function in the shoot meristem to control stem cell homeostasis, if expressed from the stem cell domain. Furthermore, while all other CLE genes in Arabidopsis lack introns, the CLE40 and CLV3 genes carry two introns at very similar positions (Hobe et al., 2003), indicating close evolutionary relatedness. Phylogenetic analysis revealed that CLV3 and CLE40 locate in the same cluster together with CLV3 orthologues from rice, maize and tomato (Goad et al., 2017). The amino acid sequences of CLV3 and CLE40 differ at 4 out of 13 positions (Figure 1A).
Figure 1 with 3 supplements see all
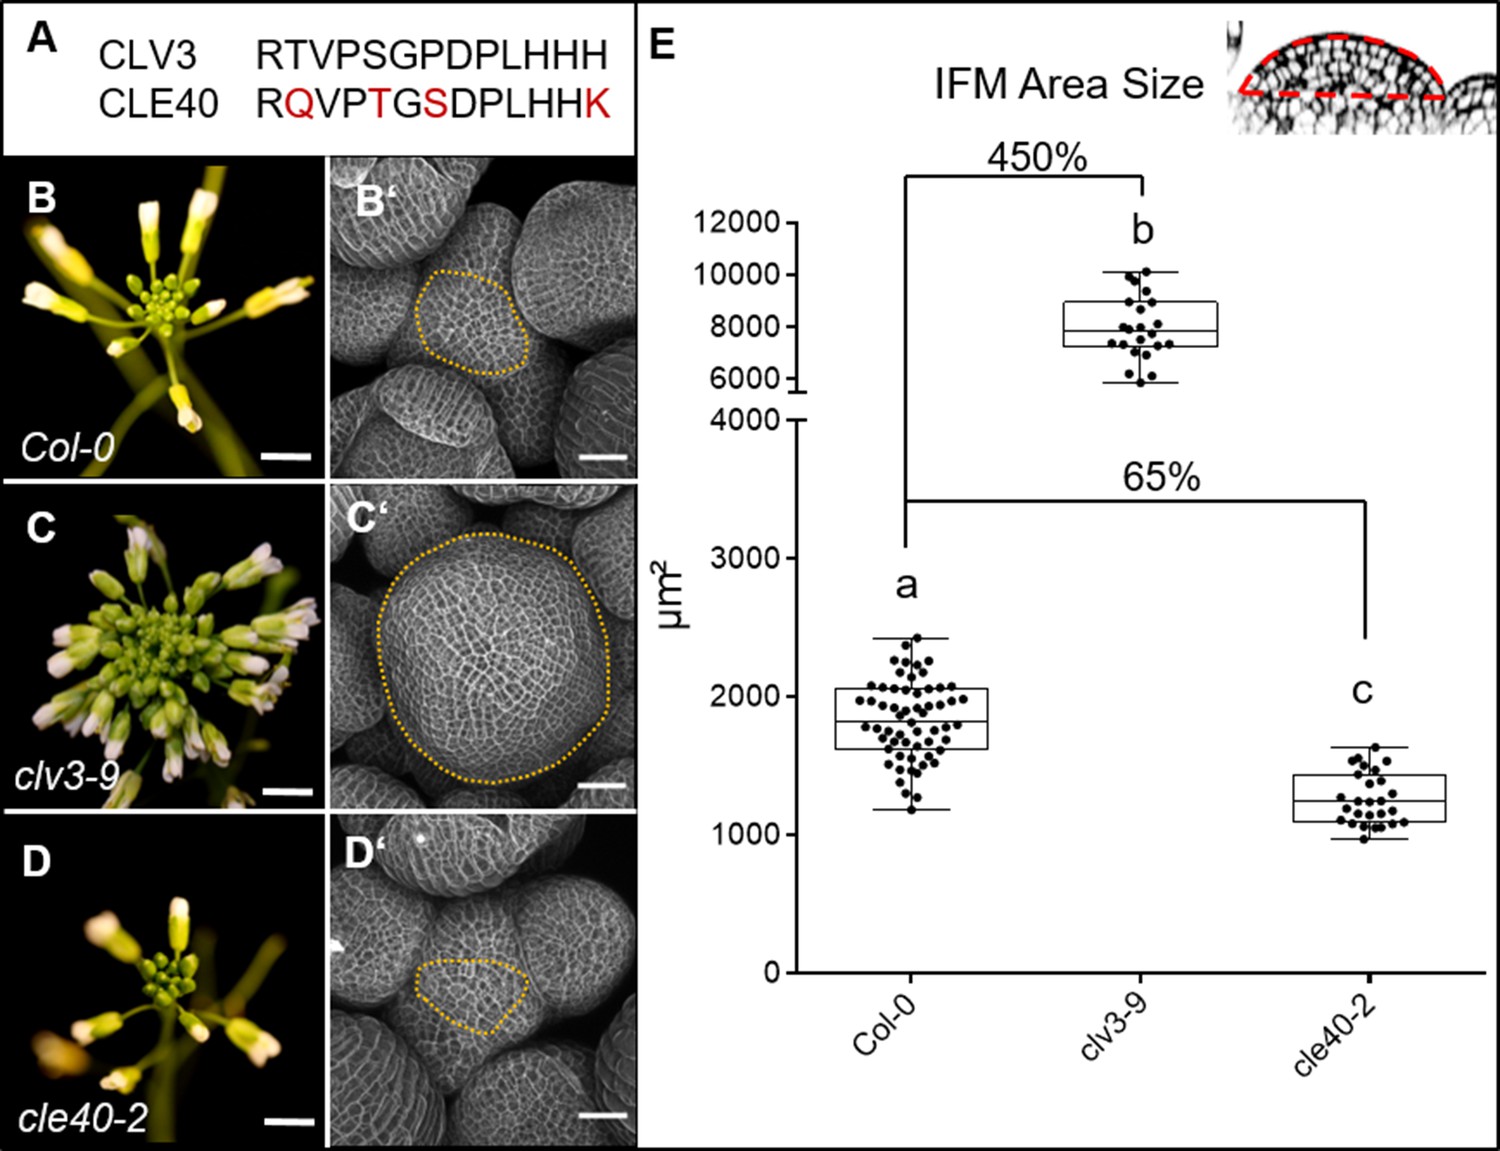
CLV3 and CLE40 exert opposite effects on meristem size.
(A) The amino acid (AA) sequences of the mature CLV3 and CLE40 peptides differ in four AAs (differences marked in red). (B) Col-0 inflorescence at 6 weeks after germination (WAG) with flowers. (B´) Inflorescence meristem (IFM) at 6 WAG, maximum intensity projection (MIP) of a z-stack taken by confocal microscopy. (C) clv3-9 inflorescence at 6 WAG (C´) MIP of a clv3-9 IFM at 6 WAG. (D) Inflorescence of cle40-2 at 6 WAG (D´) MIP of a cle40-2 IFM. (E) Box and whisker plot of IFM sizes of Col-0 (N = 59), clv3-9 (N = 22) and cle40-2 (N = 27) plants. Scale bars: 10 mm (B–D), 50 µm (B’–D’), Statistical groups were assigned after calculating p-values by ANOVA and Tukey’s multiple comparison test (differential grouping from p≤0.01). Yellow dotted lines in (B´–D´) enclose the IFM, red line in the inset meristem in (E) indicates the area that was used for the quantifications in (E).
Mutations in CLE40 were previously found to affect distal stem cell maintenance in the root meristem, revealing that a CLV3-related signalling pathway also operates in the root stem cell niche. To uncover a potential role of CLE40 in shoot development, we analysed seedling and flower development, and inflorescence meristem (IFM) sizes of the wild-type Col-0, and clv3-9 and cle40-2 loss-of-function mutants. At 4 weeks after germination (WAG), leaves of clv3-9 mutants remained shorter than those of Col-0 or cle40-2 (Figure 1—figure supplement 1). After floral induction, the inflorescences of clv3-9 mutants were compact with many more flowers than the wild type, while cle40-2 mutant inflorescences appeared smaller than the control (B–D). To first investigate effects on meristem development in detail, longitudinal sections through the IFM at 6 WAG were obtained by confocal microscopy and meristem areas were analysed (Figure 1B–E). In clv3-9 mutants, meristem areas increased to ~450% of wild-type (Col-0) levels, while shoot meristems from four independent cle40 mutant alleles in a Col-0 background (cle40-2, cle40-cr1, cle40-cr2, cle40-cr3) reached only up to 65% of wild type (Figure 1E, Figure 1—figure supplement 2C; Yamaguchi et al., 2017). Next, we used carpel number as a rough proxy for flower meristem (FM) size, which was 2 ± 0.0 (N = 290) in Col-0 and cle40-2 (N = 290) but 3.7 ± 0.4 (N = 340) in clv3-9 (Figure 1—figure supplement 3). Hence, we concluded that CLE40 mainly promotes IFM growth, whereas CLV3 serves to restrict both IFM and FM sizes.
We next analysed the precise CLE40 expression pattern using a transcriptional reporter line, CLE40:Venus-H2B, which showed the same expression pattern as a previously described reporter (Stahl et al., 2009; Figure 2—figure supplement 1). We first concentrated on the IFMs and FMs. CLE40 is expressed in IFMs and FMs, starting at P5 to P6 onwards (Figure 2A–C). We found stronger expression in the PZ than in the CZ, and no expression in young primordia. Using MorphoGraphX software, we extracted the fluorescence signal originating from the outermost cell layer (L1) of the IFM and noted downregulation of CLE40 expression in the centre of the meristem (Figure 2B). Longitudinal optical sections through the IFM showed that CLE40 is not expressed in the CZ, and only occasionally in the OC region (Figure 2C, Figure 2—figure supplement 2A-E'). Expression of CLE40 changed dynamically during development: expression was concentrated in the IFM, but lacking at sites of primordia initiation (P0 to P4/5, Figure 2C). In older primordia from P5/6 onwards, CLE40 expression is detectable from the centre of the young FM and expands towards the FM periphery. In the FMs, CLE40 is lacking in young sepal primordia (P6), but starts to be expressed on the adaxial sides of petals at P7 (Figure 2A, P1–P7).
Figure 2 with 2 supplements see all
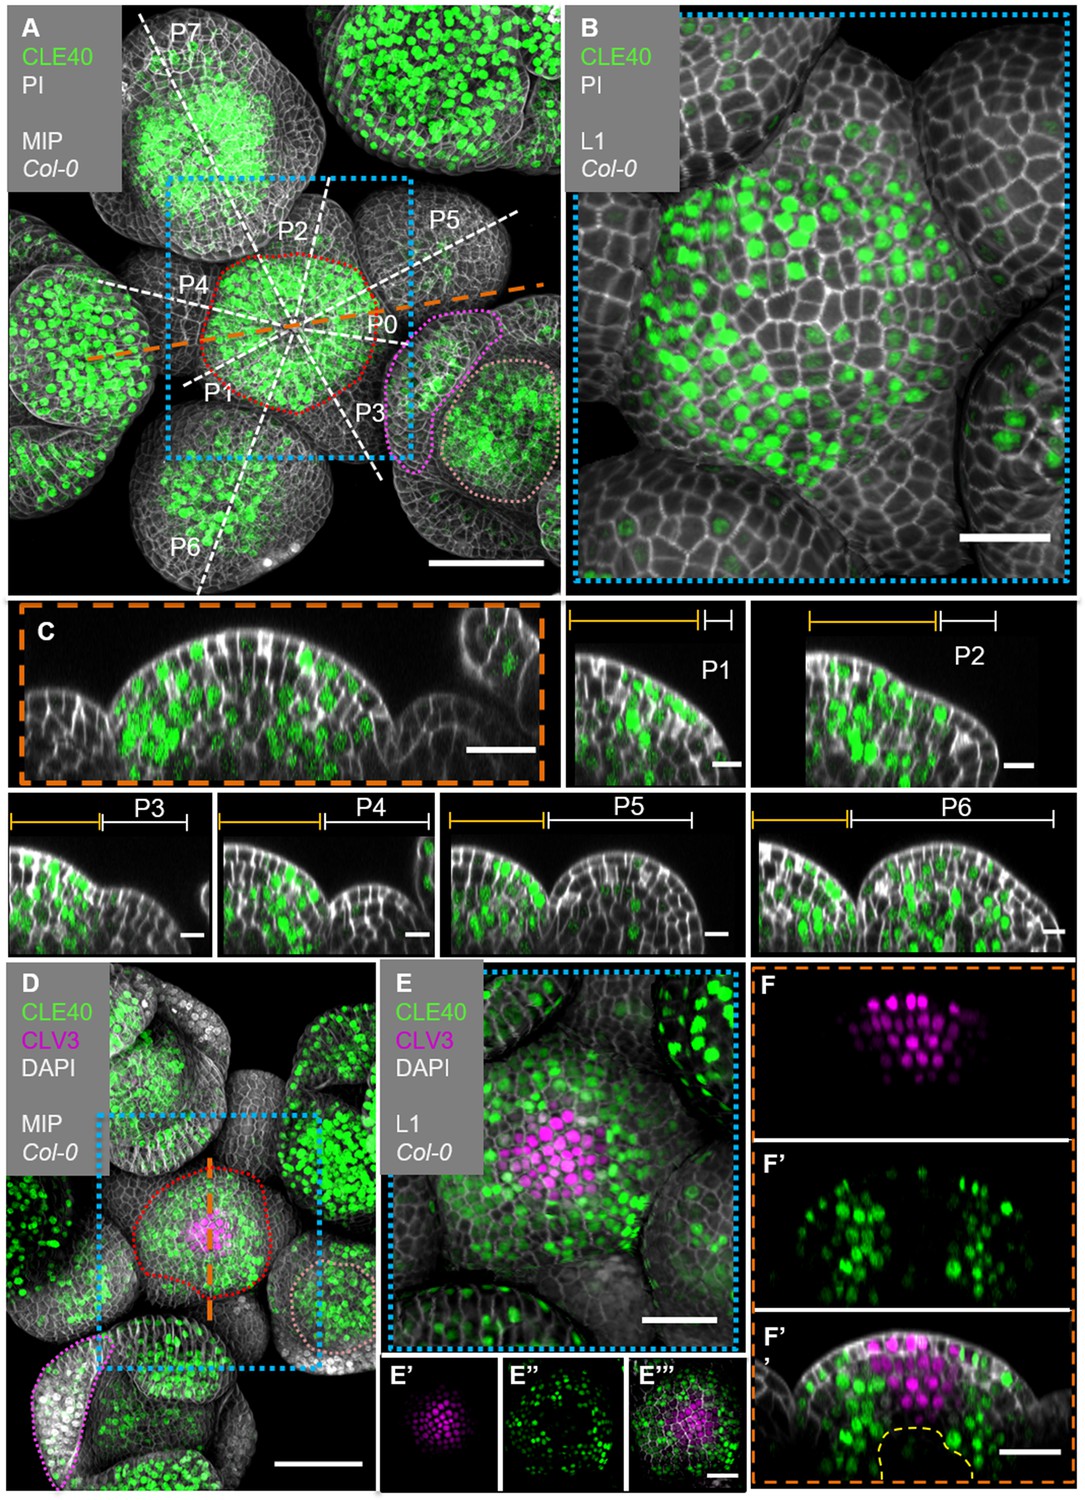
CLE40 and CLV3 show complementary expression patterns in the inflorescence meristem (IFM).
(A) Maximum intensity projection (MIP) of an inflorescence at 5 weeks after germination (WAG) expressing the transcriptional reporter CLE40:Venus-H2B//Col-0 showing CLE40 expression in the IFM, older primordia and sepals (N = 23). (B) The L1 projection shows high expression in the epidermis of the periphery of the IFM and only weak expression in the central zone (CZ). (C) Longitudinal section through the IFM shows expression of CLE40 in the periphery, but downregulated expression in the CZ. (P1 –P6) Longitudinal section through primordia show no CLE40 expression in young primordia (P1–P4), but in the centre of older primordia (P5–P6). (D) The MIP of the double reporter line of CLE40 and CLV3 (CLE40:Venus-H2B;CLV3:NLS-3xmCherry//Col-0) shows CLV3 expression in the CZ surrounded by CLE40 expression in the periphery (N = 12). (E–E’’’) The L1 projection shows CLV3 (E’) expression in the centre of the IFM and CLE40 (E’’) expression in a distinct complementary pattern in the periphery of the IFM. (F) The longitudinal section through the centre of the IFM shows CLV3 expression in the CZ while CLE40 (F’) is mostly expressed in the surrounding cells. (F’’) CLE40 and CLV3 are expressed in complementary patterns. Dashed blue lines indicate magnified areas, dashed white and orange lines indicate planes of longitudinal sections, dashed red line in (A) and (D) marks the IFM area, the dashed pink line marks the sepals, the dashed rose line marks the FMs and dashed yellow line in (F’’) the OC. Scale bars: 50 µm (A, D), 20 µm (B, C, E, E’’’, F’’), 10 µm (P0–P6), PI: propidium iodide; L1: visualization of layer 1 only; P1–P7: primordia at consecutive stages.
To compare the CLE40 pattern with that of CLV3, we introgressed a CLV3:NLS-3xmCherry transcriptional reporter into the CLE40:Venus-H2B background. CLV3 and CLE40 are expressed in almost mutually exclusive domains of the IFM, with CLV3 in the CZ surrounded by CLE40 expressing cells (Figure 2D–F’’, Figure 2—figure supplement 2). In the deeper region of the IFM, where the OC is located, both CLV3 and CLE40 are not expressed (Figure 2F, Figure 2—figure supplement 2).
We noted that CLE40 is downregulated where WUS is expressed, or where WUS protein localizes, such as the OC and CZ. Furthermore, CLE40 is also lacking in very early flower primordia and incipient organs.
CLE40 expression is repressed by WUS activity
To further analyse the regulation of CLE40 expression, we introduced the CLE40 transcriptional reporter into the clv3-9 mutant background (Figure 3A and B, Figure 3—figure supplement 1). In clv3-9 mutants, WUS is no longer repressed by the CLV signalling pathway, and the CZ of the meristem increases in size as described previously (Clark et al., 1995). In the clv3-9 mutant meristems, both CLV3 and WUS promoter activity is now found in an expanded domain (Figure 3—figure supplement 1). CLE40 is not expressed in the tip and centre of the IFM but is rather confined to the peripheral domain, where neither CLV3 nor WUS are expressed (Figure 3B’, Figure 3—figure supplement 1B'). To further explore the expression dynamics of CLE40 in connection with regulation of stem cell fate and WUS, we misexpressed WUS from the CLV3 promoter and introgressed it into plants carrying the CLE40:Venus-H2B construct. Since WUS activates the CLV3 promoter, CLV3:WUS misexpression triggers a positive feedback loop. This results in a continuous enlargement of the CZ (Brand et al., 2002). Young seedlings carrying the CLV3:WUS transgene at 10 days after germination (DAG) displayed a drastically enlarged SAM compared to wild-type seedlings of the same age (Figure 3C–D’). Wild-type seedlings at this stage express CLE40 in older leaf primordia and deeper regions of the vegetative SAM (Figure 3E–E’). The CLV3:WUS transgenic seedlings do not initiate lateral organs from the expanded meristem, and CLE40 expression is confined to the cotyledons (Figure 3F–F’). CLE40 is also lacking in the deeper regions of the vegetative SAM (Figure 3F’). Thus. we conclude that either WUS itself or a WUS-dependent regulatory pathway represses CLE40 gene expression.
Figure 3 with 2 supplements see all
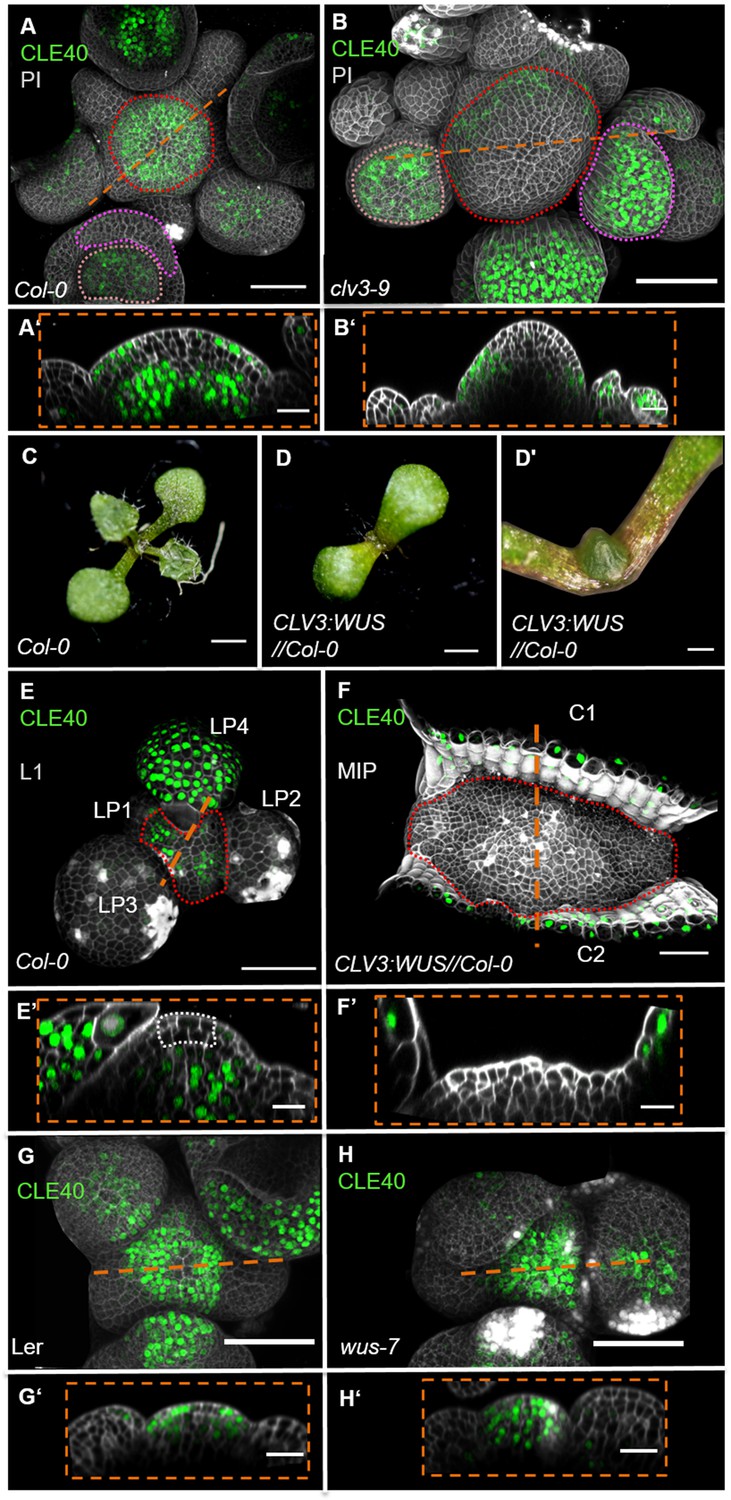
WUS-dependent repression of CLE40 expression in the shoot meristem.
(A) Maximum intensity projection (MIP) of CLE40 expression (CLE40:Venus-H2B//Col-0) at 5 weeks after germination (WAG), (A’) Longitudinal optical section through the centre of the inflorescence meristem (IFM) (indicated by orange line in A) reveals no CLE40 expression in the central zone (CZ) and the centre of the meristem. Cells in the L2 layer also show less CLE40 expression. High CLE40 expression is found in the peripheral zone (PZ) (N = 23). (B) MIP of CLE40 expression in a clv3-9 mutant (CLE40:Venus-H2B//clv3-9) shows expression only in the PZ of the meristem, in flower meristems (FMs) and in sepals (N = 6). (B’) Longitudinal optical section through the IFM depicts no CLE40 expression at the tip and the centre of the meristem. CLE40 expression is only detected in cells at the flanks of the IFM and in sepals. (C) Arabidopsis seedling at 10 days after germination (DAG). (D) Seedling expressing WUS from the CLV3 promoter, 10 DAG. (D’) Magnification of seedling in (D). The meristem fasciates without forming flowers. (E) L1 projection, vegetative seedling with CLE40 expression in the PZ and leaf primordia starting from LP4, at 10 DAG (N = 5). (E’) Longitudinal section of (E) with CLE40 expression primordia and rib meristem or periphery. (F) MIP of fasciated meristem as in (D). CLE40 expression can only be found in the cotyledons (C1 and C2) next to the meristem (N = 5). (F’) Longitudinal optical section shows CLE40 expression only in the epidermis of cotyledons. (G, G’) MIP (G) and longitudinal optical section (G’) of CLE40 expression (CLE40:Venus-H2B//Ler) in a wild- type (Landsberg erecta [L.er]) background at 5 WAG shows no signal in the CZ or OC. CLE40 is confined to the PZ and the centre of older flower primordia, and to sepals (N = 8). (H, H’) MIP of CLE40 in a wus-7 background shows expression through the entire IFM and in the centre of flower primordia. The longitudinal optical section (H’) reveals that CLE40 is also expressed in the CZ as well as in the OC of the IFM (N = 12). Dashed orange lines indicate the planes of longitudinal sections, dashed red line in (A), (B), (E) and (F) marks the IFM area, the dashed pink line in (A) and (B) marks the sepals, the dashed rose line in (A) and (B) marks the FMs, the dashed white line in (E’) marks the CZ. Scale bars: 50 µm (A, B, G, H), 20 µm (A’, B’, E, E’, F, F’, G’, H’), 1 mm (C, D), 500 µm (D’). PI: propidium iodide; L1: layer 1 projection; C: cotyledon; LP: leaf primordium.
We next determined if CLE40 repression in the CZ can be alleviated in mutants with reduced WUS activity. Since wus loss-of-function mutants fail to maintain an active CZ and shoot meristem, we used the hypomorphic wus-7 allele (Graf et al., 2010; Ma et al., 2019). wus-7 mutants are developmentally delayed. Furthermore, wus-7 mutants generate an IFM, but the FMs give rise to sterile flowers that lack inner organs (Figure 3—figure supplement 2). We introgressed the CLE40 reporter into wus-7 and found that at 5 WAG all wus-7 mutants expressed CLE40 in both the CZ and the OC of the IFM (Figure 3G–H’, Figure 3—figure supplement 2). Similar to wild type, CLE40 is only weakly expressed in the young primordia of wus-7. Therefore, we conclude that a WUS-dependent pathway downregulates CLE40 in the centre of the IFM during normal development.
CLE40 signals through BAM1
Given that CLV1 and BAM1 perform partially redundant functions to perceive CLV3 in shoot and floral meristems, we asked if these receptors also contribute in a CLE40 signalling pathway. We therefore generated the translational reporter lines CLV1:CLV1-GFP and BAM1:BAM1-GFP, and analysed their expression patterns in detail. Both reporter lines rescued the shoot phenotype in a clv1-101 and bam1-3;clv1-20 mutant background, respectively. The CLV1 reporter line additionally showed the same expression pattern in the shoot compared to a previously published reporter line (Nimchuk et al., 2011; Figure 4—figure supplement 1, Figure 4—figure supplement 2, Figure 4—figure supplement 3, Figure 5—figure supplement 1). We observed dynamic changes of CLV1 expression during the different stages of flower primordia initiation. CLV1:CLV1-GFP is continuously expressed in deeper regions of the IFM comprising the OC, and in the meristem periphery where new FMs are initiating (Figure 4A, Figure 4—figure supplement 2, Figure 4—figure supplement 3). CLV1 is expressed strongly in cells of the L1 and L2 of incipient organ primordia (P-1, P0), and only in L2 at P1. P2 and P3 show only very faint expression in the L1, but in stages from P4 to P6, CLV1 expression expands from the L3 into the L2 and L1 (Figure 4, P1–P6, Figure 4—figure supplement 2, Figure 4—figure supplement 3).
Figure 4 with 3 supplements see all
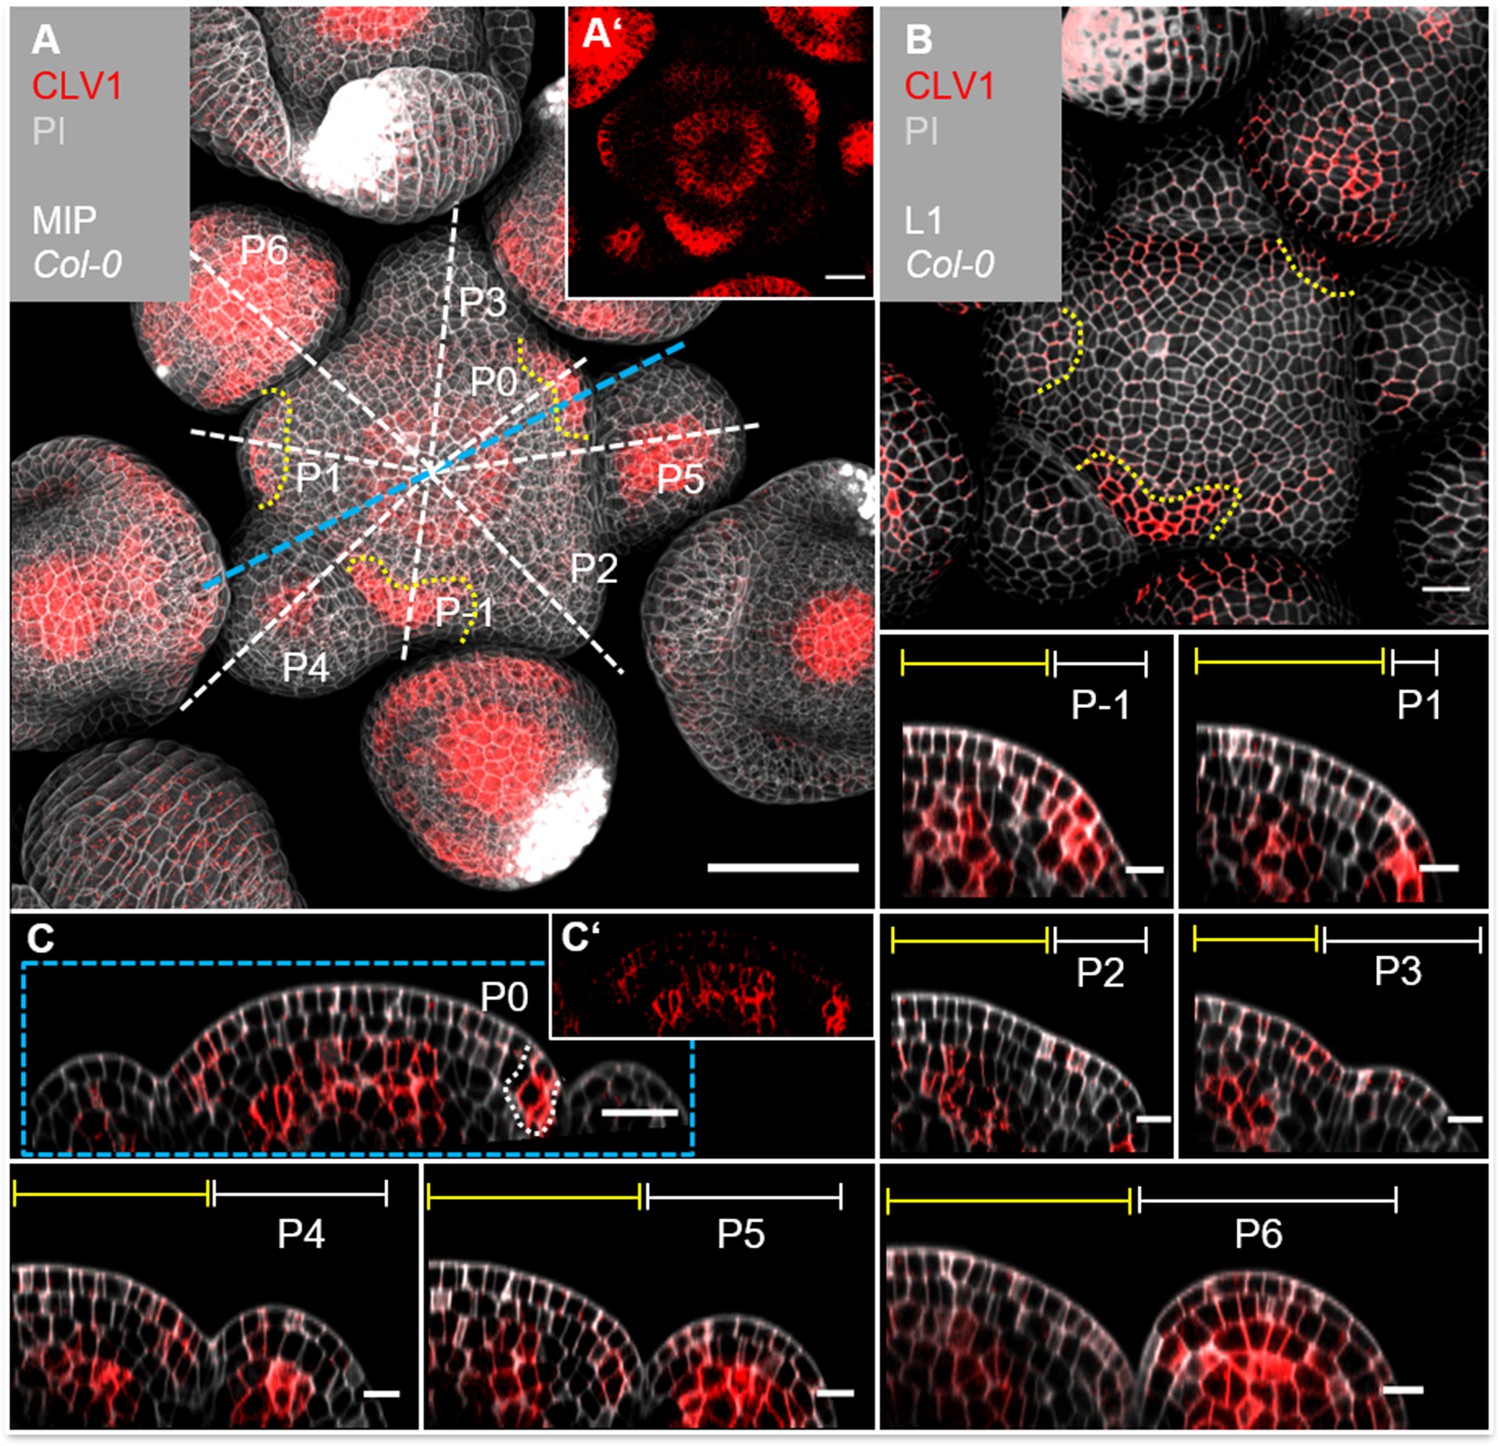
CLV1 is expressed in the organizing centre (OC) and cells of incipient organ primordia.
(A) Maximum intensity projection (MIP) of CLV1 under its endogenous promoter (CLV1:CLV1-GFP//Col-0) at 5 weeks after germination (WAG) shows CLV1 expression in the OC of the meristems, inflorescence meristem (IFM) and flower meristems (FMs), in incipient organ primordia (P-1–P1) and in sepals (N = 15). (A’) MIP of the IFM from (A) without propidium iodide (PI) staining. (B) In the layer 1 (L1) projection, CLV1 expression is detected in cells of incipient organs. (C) Longitudinal section through the IFM shows CLV1 expression in the OC and P0. (C’) XZ section from (C) without PI staining. (P-1–P6) CLV1 expression is detected in incipient organ primordia in L1 and L2 (-P1, P0), in the L2 of P1 and in the OC of the IFM and FMs from P4 to P6. Dashed white and blue lines indicate the planes of longitudinal sections, yellow dashed lines in (A) and (B) mark incipient organ primordia (P-1–P1), yellow lines (P-1–P6) indicate the IFM region, white lines mark the primordium. Scale bars: 50 µm (A), 20 µm (B, C), 10 µm (P1–P6), P: primordium.
The translational BAM1:BAM1-GFP reporter is expressed in the IFM, the FMs and in floral organs (Figure 5A, Figure 5—figure supplement 2A–C’, Figure 5—figure supplement 3A–E’). In the IFM, expression is found throughout the L1 layer of the meristem, and, at an elevated level, in L2 and L3 cells of the PZ, but not in the meristem centre around the OC, where CLV1 expression is detected (Figure 5B and C, compare to Figure 4C). BAM1 is less expressed in the deeper regions of primordia from P6 onwards (Figure 5C, Figure 5—figure supplement 3A’–E’). BAM1 transcription was reported to be upregulated in the meristem centre in the absence of CLV3 or CLV1 signalling (Nimchuk, 2017). Using our translational BAM1 reporter in the clv1-20 mutant background, we quantified and thereby confirmed that BAM1 is now expressed in the meristem centre, similar to the pattern of CLV1 in the wild type, and that BAM1 is upregulated in the L1 of the meristem. Importantly, in a clv1-20 background BAM1 is absent in the peripheral region of the IFM and the L2 (Figure 5D–F, Figure 4—figure supplement 3F–J’, Figure 5—figure supplement 4).
Figure 5 with 6 supplements see all
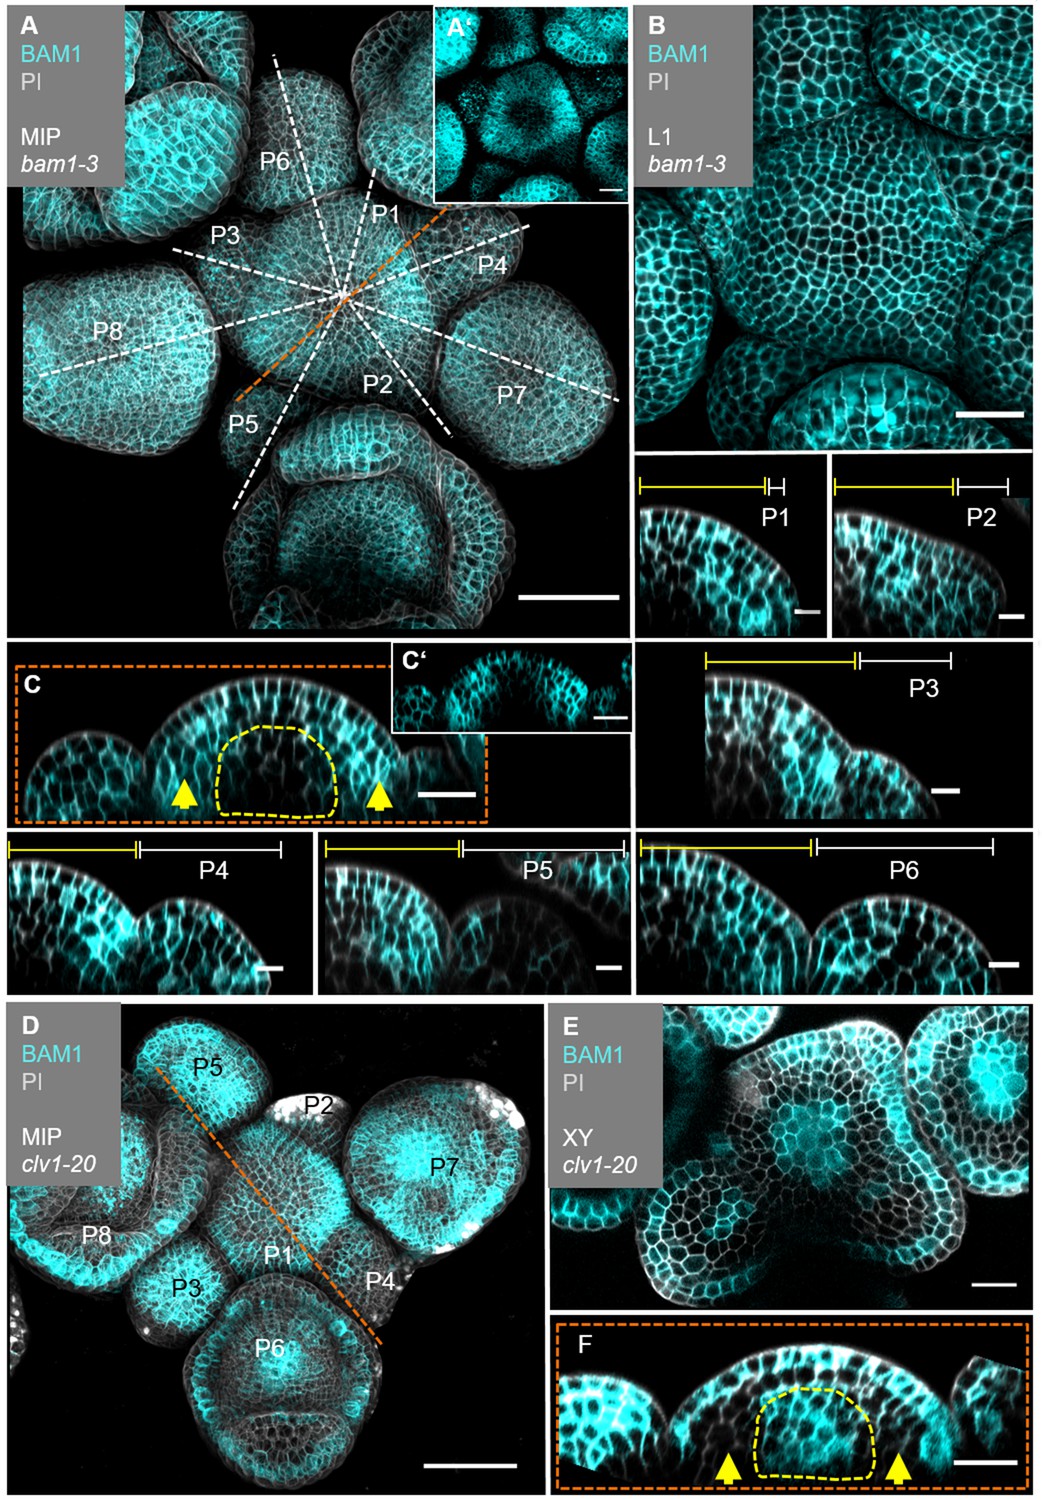
BAM1 expression is elevated in the flanks of the inflorescence meristem (IFM) and not detectable in the organizing centre (OC).
(A) Maximum intensity projection (MIP) of BAM1 under its endogenous promoter (BAM1:BAM1-GFP//bam1-3) at 5 weeks after germination (WAG). BAM1 expression is detected nearly throughout the entire inflorescence (IFM, flower meristem [FM], sepals) with weak expression in the central zone (CZ) of IFM and FMs (N = 15). (A’) MIP of the IFM from (A) without propidium iodide (PI) staining. (B) The layer 1 (L1) projection of the IFM shows ubiquitous expression of BAM1. (C) Longitudinal optical section through the IFM shows elevated BAM1 expression in the flanks (yellow arrows) and a lack of BAM1 expression in the OC. (C’) XZ section from (C) without PI staining. (P1–P6) BAM1 expression is found in all primordia cells. (D) MIP of BAM1 in a clv1-20 mutant (BAM1:BAM1-GFP//bam1-3;clv1-20). BAM1 expression is detected in most parts of the inflorescence, especially in the centre of the IFM and FMs (N = 9). (E) Cross-section (XY) of the IFM (from D) shows BAM1 expression in a clv1-20 mutant in the CZ (IFM and FMs) and the L1/L2. (F) Longitudinal optical section through the meristem (from D) shows BAM1 expression in the OC and the L1, while no BAM1 expression is detected in the peripheral zone (PZ) (yellow arrows). Dashed white and orange lines indicate longitudinal sections; dashed yellow lines in (C) and (F) mark the OC area, yellow lines (P1–P6) indicate the IFM region, white lines (P1–P6) mark the primordium and yellow arrows indicate high (C) or no (F) BAM1 expression in the PZ. Scale bars: 50 µm (A, D), 20 µm (B, C, E, F), 10 µm (P1–P6). P: primordium.
In longitudinal and transversal optical sections through the IFM, we found that complementarity of CLE40 and CLV3 is reflected in the complementary expression patterns of BAM1 and CLV1 (Figure 5—figure supplement 5). Therefore, we conclude that expression patterns of CLV1 and BAM1 are mostly complementary in the meristem itself and during primordia development. When comparing CLE40 and BAM1 expression patterns, we found a strong overlap in the PZ of the meristem, during incipient primordia formation, in older primordia and in L3 cells surrounding the OC (Figure 5—figure supplement 5A’ and B’, Figure 5—figure supplement 6). Similarly, CLV3 and CLV1 are confined to the CZ and OC, respectively.
To analyse if CLE40-dependent signalling requires CLV1 or BAM1, we measured the sizes of IFMs in the respective single and double mutants (Figure 6). While cle40-2 mutant IFMs reached 65% of the wild-type size, clv1-101 plants develop IFMs that were 140% wild-type size, whereas bam1-3;clv1-101 double mutant meristems reached 450% wild-type size, similar to those of clv3-9 mutants. This supports the notion that BAM1 can partially compensate for CLV1 function in the CLV3 signalling pathway when expressed in the meristem centre (Figure 5F; Nimchuk et al., 2015). The relationship between CLV1 and BAM1 is not symmetrical since CLV1 is expressed in a wild-typic pattern in bam1-3 mutants (Figure 8—figure supplement 4). Meristem sizes of bam1-3 mutants reached 70% of the wild type, and double mutants of cle40-2;bam1-3 did not differ significantly. However, double mutants of cle40-2;clv1-101 developed like the clv1-101 single mutant, indicating an epistatic relationship. Importantly, both clv1-101 and bam1-3 mutants lack BAM1 function in the meristem periphery (Figure 5F), where also CLE40 is highly expressed, which could explain the observed epistatic relationships of cle40-2 with both clv1-101 and bam1-3. Similar genetic relationships for CLV3, CLE40, CLV1 and BAM1 were noticed when analysing carpel number as a proxy for FM sizes. We also noted that generation of larger IFMs and FMs in different mutants was negatively correlated with leaf size, which we cannot explain so far (Figure 1—figure supplement 1). In the root meristem, we found that the BAM1 receptor, but not CLV1, is required for CLE40-dependent root meristem development, suggesting that CLE40 can act through BAM1 (Figure 6—figure supplement 1).
Figure 6 with 1 supplement see all

Inflorescence meristem (IFM) size of single and double mutants.
XZ sections through the centre of IFMs of (A) Col-0, (B) cle40-2, (C) clv3-9, (D) bam1-3;clv1-101, (E) clv1-101, (F) clv1-101;cle40-2, (G) bam1-3 and (H) bam1-3;cle40-2 plants. (I) Box and whisker plot of the IFM area size of Col-0 (N = 82), various single (clv3-9 [N = 22], cle40-2 [N = 42], clv1-101 [N = 32], bam1-3 [N = 68]) and double mutants (cle40-2;clv1-101 [N = 37], cle40-2;bam1-3 [N = 25] and bam1-3;clv1-101 [N = 36]) at 6 weeks after germination (WAG).The yellow dashed line depicts the area of the meristem that was measured, and the dashed red line indicates the height of the meristems. Scale bar: 20 µm (A–H). Statistical groups were assigned after calculating p-values by ANOVA and Tukey’s multiple comparison test (differential grouping from p≤0.01).
For the shoot, we hypothesize that CLE40 signals from the meristem periphery via BAM1 to promote meristem growth. Next, we aimed to determine if the commonalities between cle40-2 and bam1-3 mutants extend beyond their effects on meristem size.
A CLE40 and BAM1 signalling pathway promotes WUS expression in the meristem periphery
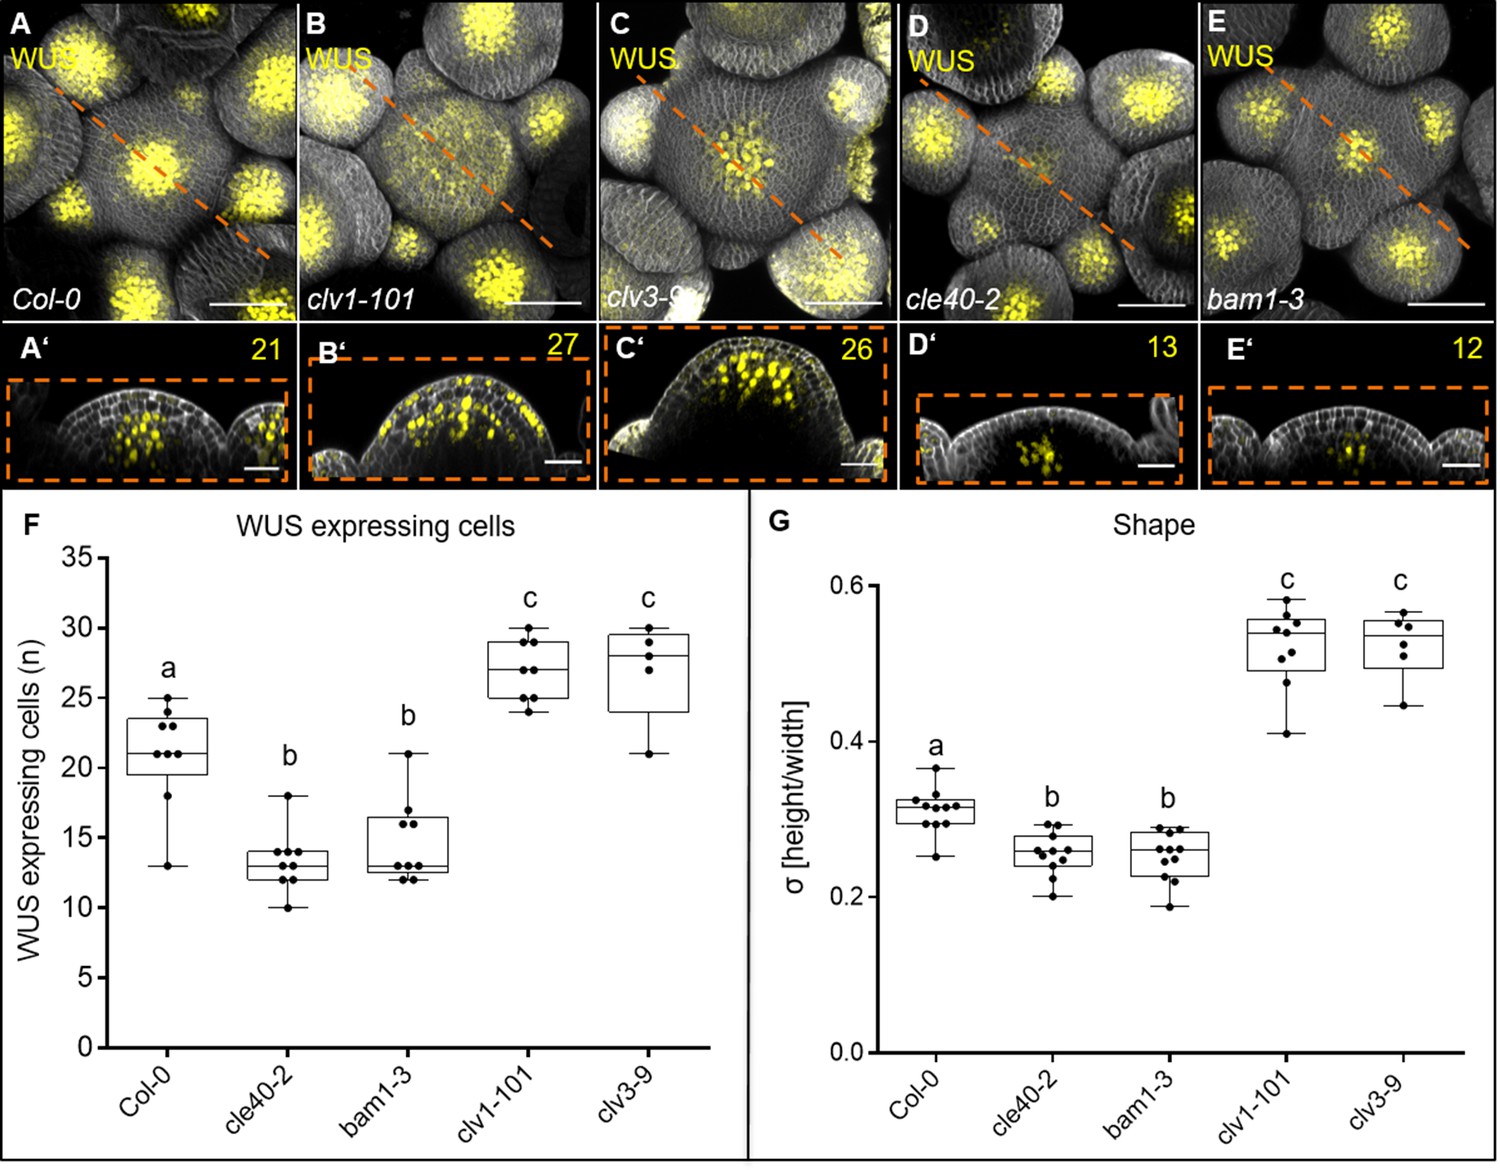
We next analysed the number of WUS-expressing cells in wild type and mutant meristems using a WUS:NLS-GFP transcriptional reporter. Compared to wild type, the WUS expression domain was laterally strongly expanded in both clv3-9 and clv1-101. Interestingly, WUS signal extended also into the L1 layer of clv1-101, albeit in a patchy pattern (Figure 7A–C’ and F, Figure 7—figure supplement 1, Figure 7—figure supplement 2). Also noteworthy is that BAM1 was expressed at a higher level in the L1 layer of clv1 mutants. cle40-2 mutants showed a reduction in the number of WUS-expressing cells down to ~50% wild-type levels (Figure 7D–D’ and F, Figure 7—figure supplement 1, Figure 7—figure supplement 2). Importantly, WUS remained expressed in the centre of the meristem, but was found in a narrow domain. In bam1-3 mutants, the WUS domain was similarly reduced as in cle40-2, and WUS expression focussed in the meristem centre (Figure 7E, E’ and F, Figure 7—figure supplement 1, Figure 7—figure supplement 2). In contrast, both clv3-9 and clv1-101 mutants express WUS in a laterally expanded domain (Figure 7B’ and C’, Figure 7—figure supplement 1, Figure 7—figure supplement 2).
Figure 7 with 3 supplements see all
CLE40 and BAM1 promote WUS expression.
(A–E’) Maximum intensity projection (MIP) and longitudinal optical section of inflorescences at 5 weeks after germination (WAG) expressing the transcriptional reporter WUS:NLS-GFP in a (A, A’) Col-0, (B, B’) clv1-101, (C, C’) clv3-9, (D, D’) cle40-2 and (E, E’) bam1-3 background. In (A) wild-type plants, the WUS domain is smaller compared to the expanded WUS domain in (B) clv1-101 and (C) clv3-9 mutants. The WUS domain of (D) cle40-2 and (E) bam1-3 mutants is decreased compared to wild-type plants. Longitudinal optical sections of (B’) clv1-101 and (C’) clv3-9 mutants expand along the basal-apical axis while the meristem shape of (D’) cle40-2 and (E’) bam1-3 mutants is flatter compared to (A’) wild-type plants,. (F) Box and whisker plot shows the number of WUS-expressing cells in a single plane through the organizing centre (OC) of inflorescence meristems (IFMs) of Col-0 (N = 9), cle40-2 (N = 9), bam1-3 (N = 9), clv1-101 (N = 8) and clv3-9 (N = 5). (G) At 5 WAG, bam1-3 (N = 11) and cle40-2 (N = 11) mutants have flatter meristems than wild-type plants (decreased σ value compared to Col-0 [N = 11]), while clv1-101 [N = 9] and clv3-9 [N = 6] mutants increase in their IFM height showing a higher σ value. Scale bars: 50 µm (A–E), 20 µm (A’–E’), Statistical groups and stars were assigned after calculating p-values by ANOVA and Tukey’s multiple comparison test (differential grouping from p≤0.01). yellow numbers: WUS-expressing cells in the CZ; σ value: height/width of IFMs.
To integrate our finding that CLE40 expression is repressed by WUS activity with the observation that WUS, in turn, is promoted by CLE40 signalling, we hypothesize that the CLE40-BAM1-WUS interaction establishes a new negative feedback loop. The CLE40-BAM1-WUS negative feedback loop acts in the meristem periphery, while the CLV3-CLV1-WUS negative feedback loop acts in the meristem centre along the apical-basal axis. Both pathways act in parallel during development to regulate the size of the WUS expression domain in the meristem, possibly by perceiving input signals from two different regions, the CZ and the PZ, of the meristem.
We then asked how the two signalling pathways converge on the regulation of WUS expression, control meristem growth and development. So far, we showed that both CLV3-CLV1 and CLE40-BAM1 signalling control meristem size, but in an antagonistic manner. However, we noticed that the different mutations in peptides and receptors affected distinct aspects of meristem shape. We therefore analysed meristem shape by measuring meristem height (the apical-basal axis) at its centre, and meristem diameter (the radial axis) at the base in longitudinal sections. The ratio of height to width then gives a shape parameter ‘σ’ (from the Greek word σχήμα = shape). In young IFMs at 4–5 WAG, when inflorescence stems were approximately 5–8 cm long, meristems of cle40-2 and bam1-3 mutants were slightly reduced in width, and strongly reduced in height, resulting in reduced σ in comparison to Col-0 (Figure 7G, Figure 7—figure supplement 3). Meristems of clv1-101 and clv3-9 mutants were similar in width to wild type, but strongly increased in height, giving high σ values (Figure 7, Figure 7—figure supplement 3). This indicates that CLV3-CLV1 signalling mostly restricts meristem growth along the apical-basal axis, while CLE40-BAM1 signalling promotes meristem growth along both axes.
Our data expand the current model of shoot meristem homeostasis by taking into account that stem cells are lost from the OC during organ initiation in the PZ (Figure 8). CLV3 signals from the CZ via CLV1 in the meristem centre to confine WUS expression to the OC. The diffusion of WUS protein along the apical-basal axis towards the meristem tip establishes the CZ and activates CLV3 expression as a feedback signal. During plant growth, rapid cell division activity and organ initiation requires the replenishment of PZ cells from the CZ, which can be mediated by increased WUS activity. We now propose that the PZ generates CLE40 as a short-range or autocrine signal that acts through BAM1 in the meristem periphery. Since BAM1 and WUS expression does not overlap, we postulate the generation of a diffusible factor that relies on CLE40-BAM1 and acts from the PZ to promote WUS expression. WUS, in turn, represses CLE40 expression from the OC, thus establishing a second negative feedback regulation. Together, the two intertwined pathways serve to adjust WUS activity in the OC and incorporate information on the actual size of the stem cell domain, via CLV3-CLV1, and the growth requirements from the PZ via CLE40-BAM1.
Figure 8 with 4 supplements see all

Schematic model of two intertwined signalling pathways in the shoot meristem.
(A, B) Schematic representation of two negative feedback loops in the inflorescence meristem (IFM) of Arabidopsis thaliana. CLV3 in the central zone (CZ) binds to the LRR receptor CLV1 to activate a downstream signalling cascade which leads to the repression of the transcription factor WUS. In a negative feedback loop WUS protein moves to the stem cells to activate CLV3 gene expression. In the peripheral zone (PZ) of the IFM, a second negative feedback loop controls meristem growth by CLE40 and its receptor BAM1. CLE40 binds to BAM1 in an autocrine manner, leading to the activation of a downstream signal ‘X’ which promotes WUS activity. WUS protein in turn represses the expression of the CLE40 gene. Arrows indicate a promoting effect, and the blocked line indicates a repressing signal.
Discussion
Shoot meristems are the centres of growth and organ production throughout the life of a plant. Meristems fulfil two main tasks, which are the maintenance of a non-differentiating stem cell pool, and the assignment of stem cell daughters to lateral organ primordia and differentiation pathways (Hall and Watt, 1989). Shoot meristem homeostasis requires extensive communication between the CZ, the OC and the PZ. The discovery of CLV3 as a signalling peptide, which is secreted exclusively from stem cells in the CZ, and its interaction with WUS in a negative feedback loop was fundamental to our understanding of such communication pathways (Fletcher, 2020). Here, we analysed the function of CLE40 in shoot development of Arabidopsis and found that WUS expression in the OC is under positive control from the PZ due to the activity of a CLE40-BAM1 signalling pathway. IFM size is reduced in cle40 mutants, indicating that CLE40 signalling promotes meristem size. Importantly, CLE40 is expressed in the PZ, late-stage FMs and differentiating organs. A common denominator for the complex and dynamic expression pattern is that CLE40 expression is confined to meristematic tissues, but not in organ founder sites or in regions with high WUS activity, such as the OC and the CZ. Both misexpression of WUS in the CLV3 domain (Figure 3F), studies of clv3 mutants with expanded stem cell domains (Figure 3B, Figure 3—figure supplement 1) and analysis of wus mutants (Figure 3, Figure 3—figure supplement 2) underpinned the notion that CLE40 expression, in contrast to CLV3, is negatively controlled in a WUS-dependent manner. Furthermore, we found that the number of WUS-expressing cells in cle40 mutant IFMs is strongly reduced, indicating that CLE40 exerts its positive effects on IFM size by expanding the WUS expression domain.
So far, the antagonistic effects of Arabidopsis CLV3 and CLE40 on meristem size can only be compared to the antagonistic functions of MpCLE1 and MpCLE2 on the gametophytic meristems of M. polymorpha, which signal through two distinct receptors, MpTDR and MpCLV1, respectively (Hata and Kyozuka, 2021). By the complementation of clv3 mutants through expression of CLE40 from the CLV3 promoter, it was shown previously that CLE40 and CLV3 are able to activate the same downstream receptors (Hobe et al., 2003). Our detailed analysis of candidate receptor expression patterns showed that CLV3 and CLV1 are expressed in partially overlapping domains in the meristem centre, while CLE40 and BAM1 are confined to the meristem periphery. Like cle40 mutants, bam1 mutant IFMs are smaller and maintain a smaller WUS expression domain, supporting the notion that CLE40 and BAM1 comprise a signalling unit that increases meristem size by promoting WUS expression. The antagonistic functions of the CLV3-CLV1 and CLE40-BAM1 pathways in the regulation of WUS are reflected in their complementary expression patterns. There is cross-regulation between these two signalling pathways at two levels: (1) WUS has been previously shown to promote CLV3 levels in the CZ, and we here show that WUS represses (directly or indirectly) CLE40 expression in the OC and in the CZ (Figure 3B, Figure 3—figure supplement 1) and (2) CLV1 represses BAM1 expression in the OC, and thereby restricts BAM1 to the meristem periphery (Figures 5 and 6). In clv1 mutants, BAM1 shifts from the meristem periphery to the OC, and the WUS domain laterally expands in the meristem centre (Figures 5F and 7B’). Furthermore, BAM1 expression increases also in the L1, which could cause the observed irregular expression of WUS in the outermost cell layer of clv1 mutants. The role of BAM1 in the OC is not entirely clear: despite the high-sequence similarity between CLV1 and BAM1, the expression of BAM1 in the OC is not sufficient to compensate for the loss of CLV1 (Figure 5D–F, Nimchuk et al., 2015). In the OC, BAM1 appears to restrict WUS expression to some extent since clv1;bam1 double mutants reveal a drastically expanded IFM (Deyoung and Clark, 2008). However, it is possible that BAM1 in the absence of CLV1 executes a dual function: to repress WUS in response to CLV3 in the OC as a substitute for CLV1 and simultaneously to promote WUS expression in the L1 in response to CLE40.
The expression domains of CLE40 and its receptor BAM1 largely coincide, suggesting that CLE40 acts as an autocrine signal. Similarly, protophloem sieve element differentiation in roots is inhibited by CLE45, which acts as an autocrine signal via BAM3 (Kang and Hardtke, 2016). Since WUS is not expressed in the same cells as BAM1, we have to postulate a non-cell-autonomous signal X that is generated in the PZ due to CLE40-BAM1 signalling and diffuses towards the meristem centre to promote WUS expression (Hohm et al., 2010). As a result, CLE40-BAM1 signalling from the PZ will provide the necessary feedback signal that stimulates stem cell activity and thereby serves to replenish cells in the meristem for the initiation of new organs. The CLV3-CLV1 signalling pathway then adopts the role of a necessary feedback signal that avoids an excessive stem cell production.
The two intertwined, antagonistically acting signalling pathways that we described here allow us to better understand the regulation of shoot meristem growth, development and shape. The previous model, which focussed mainly on the interaction of the CZ and the OC via the CLV3-CLV1-WUS negative feedback regulation, lacked any direct regulatory contribution from the PZ. EPFL peptides were shown to be expressed in the periphery and to restrict both CLV3 and WUS expression via ER (Zhang et al., 2021). However, EPFL peptide expression is not reported to be feedback regulated from the OC or CZ, and the main function of the EPFL-ER pathway is therefore to restrict overall meristem size (Zhang et al., 2021). The second negative feedback loop controlled by CLE40, which we uncovered here, enables the meristem to fine-tune stem cell activities in response to fluctuating requirements for new cells during organ initiation. Due to the combined activities of CLV3 and CLE40, the OC (with WUS as a key player) can now record and compute information from both, the CZ and PZ. Weaker CLV3 signalling, indicating a reduction in the size of the CZ, induces preferential growth of the meristem along the apical-basal axis (increasing σ), while weaker CLE40 signals, reporting a smaller PZ, would decrease σ and flatten meristem shape. It will be intriguing to investigate if different levels of CLV3 and CLE40 also contribute to the shape changes that are observed during early vegetative development or upon floral transition in Arabidopsis.
Many shoot-expressed CLE peptides are encoded in the genomes of maize, rice and barley, which could act analogously to CLV3 and CLE40 of Arabidopsis. It is tempting to speculate that in grasses a CLE40-like, stem cell-promoting signalling pathway is more active than a CLV3-like, stem cell-restricting pathway. This could contribute to the typical shape of cereal SAMs, which are, compared to the dome-shaped SAM of dicotyledonous plants, extended along the apical-basal axis.
Materials and methods
Plant material and growth conditions
Request a detailed protocolAll wild-type Arabidopsis thaliana (L.) Heynh. plants used in this study are ecotype Columbia-0 (Col-0), except for wus-7 mutants which are in Landsberg erecta (L.er.) background. Details about A. thaliana plants carrying mutations in the following alleles – bam1-3, cle40-2, cle40-cr1, cle40-cr2, cle40-cr3, clv1-101, clv3-9 and wus-7 – are described in Table 1. All mutants are in Col-0 background and are assumed to be null mutants, except for wus-7 mutants. cle40 mutants (cle40-2, cle40-cr1, cle40-cr2, cle40-cr3) have either a stop codon, a T-DNA insertion or deletion in or before the crucial CLE box domain. clv3-9 mutants were generated in 2003 by the lab of R. Simon. clv3-9 mutants were created by EMS, resulting in a W62STOP mutation before the critical CLE domain region. bam1-3 and clv1-101 mutants have been described as null mutants before (DeYoung et al., 2006; Kinoshita et al., 2010), while clv1-20 is a weak allele which contains a insertion within the 5′-UTR of CLV1 and results in a reduced mRNA level (Durbak and Tax, 2011). wus-7 is a weak allele and mutants were described in previous publications (Graf et al., 2010). Double mutants were obtained by crossing the single mutant plants until both mutations were proven to be homozygous for both alleles. Genotyping of the plants was performed either by PCR or dCAPS method with the primers and restrictions enzymes listed in Table 2.
Table 1
Mutants analysed in this study.
| Allele | Gene | Mutation | Reference | Background |
|---|---|---|---|---|
| bam1-3 | AT5G65700 | T-DNA | Alonso et al., 2003;SALK_015302 | Col-0 |
| cle40-2 | AT5G12990 | Transposon mutation | Stahl et al., 2009 | Col-0 |
| cle40-cr1 | AT5G12990 | CRISPR | Yamaguchi et al., 2017 | Col-0 |
| cle40-cr2 | ||||
| cle40-cr3 | ||||
| clv3-9 | AT2G27250 | EMS | Brand et al., 2000 | Col-0 |
| clv1-20 | AT1G75820 | T-DNA | SALK_008670 | Col-0 |
| clv1-101 | AT1G75820 | T-DNA | Kinoshita et al., 2010;CS858348 | Col-0 |
| wus-7 | AT2G17950 | EMS | Graf et al., 2010 | L.er. |
Table 2
Primers and methods used for genotyping.
| Allele | Method | Primer | PCR product |
|---|---|---|---|
| bam1-3 | PCR | bam1-3_F: ctaacgactctccgggagctbam1-3_R: taaggaccacagagatcaggattacLbaI_R: tggttcacgtagtgggccatcg | WT amp.: 1208 bpmutant amp.: 998 bp |
| cle40-2 | dCAPS | cle40-2_F: GGAGAAACACAAGATACGAAAGCCATGcle40-2_R: ATTGTGATTTGATACCAACTTAAAA | Restriction enzyme: AseIWT amp.: 460 + 200 bpmutant amp.: 410 + 200 + 60 bp |
| cle40-cr1 | dCAPS | cle40-cr_F: ATGGCGGCGATGAAATACAAcle40-cr_R: GTTACGCTTTGGCATCTTTCC | Restriction enzyme: BamHIWT amp.: 750 bpmutant amp.: 491 + 259 bp |
| cle40-cr2 | |||
| cle40-cr3 | |||
| clv1-20 | PCR | clv1-20_F: TTTGAATAGTGTGTGACCAAATTTGAclv1-20_R: TCCAATGGTAATTCACCGGTGLBa.1: TGGTTCACGTAGTGGGCCATCG | WT amp.: 860 bpmutant amp: 1200 bp |
| clv1-101 | PCR | clv1-101_F: TTCTCCAAATTCACCAACAGGclv1-101_R: CAACGGAGAAATCCCTAAAGGWiscLox_LT6_R: AATAGCCTTTACTTGAGTTGGCGTAAAAG | WT amp.: 1158 bpmutant amp.: 896 bp |
| wus-7 | dCAPS | wus-7_F: CCGACCAAGAAAGCGGCAACAwus-7_R: AGACGTTCTTGCCCTGAATCTTT | Restriction enzyme: XmnIWT amplification: 216 bpmutant amp.: 193 + 23 bp |
Before sowing, seeds were either sterilized for 10 min in an ethanol solution (80% v/v ethanol, 1.3% w/v sodium hypochloride, 0.02% w/v SDS) or for 1 hr in a desiccator in a chloric gas atmosphere (50 mL of 13% w/v sodium hypochlorite with 1 mL 37% HCl). Afterwards, seeds were stratified for 48 hr at 4°C in darkness. Seeds on soil were then cultivated in phytochambers under long day (LD) conditions (16 hr light/8 hr dark) at 21°C. For selection of seeds or imaging of vegetative meristems, seeds were sowed on ½ Murashige & Skoog (MS) media (1% w/v sucrose, 0.22% w/v MS salts + B5 vitamins, 0.05% w/v MES, 12 g/L plant agar, adjusted to pH 5.7 with KOH) in squared Petri dishes. Seeds in Petri dishes were kept in phytocabinets under continuous light conditions at 21°C and 60% humidity.
Cloning of reporter lines
Request a detailed protocolThe CLE40 (CLE40:Venus-H2B) reporter line was cloned using the Gateway method (Curtis and Grossniklaus, 2003). The vector CLE40:Venus-H2B carries a 2291 bp long DNA fragment extending 5´ from the translational start codon of CLE40 that drives the expression of a Venus-H2B fusion protein. The DNA fragment was amplified via PCR using the oligonucleotides proCLE40_F and proCLE40_R (Table 5). As PCR template, wild-type Col-0 DNA was used. The fragment was inserted in pENTR-D-TOPO via directional TOPO-cloning. The insert was then transferred into a modified plant transformation vector pMDC99 containing the Venus-H2B sequence (Curtis and Grossniklaus, 2003).
CLV1 (CLV1:CLV1-GFP), BAM1 (BAM1:BAM1-GFP) and CLV3 (CLV3:NLS-3xmCherry) reporter lines were cloned using the GreenGate method (Lampropoulos et al., 2013). Entry and destination plasmids are listed in Table 3 and Table 4. Promoter and coding sequences were PCR amplified from genomic Col-0 DNA which was extracted from rosette leaves of Col-0 plants. Primers used for amplification of promoters and coding sequences can be found in Table 5 with the specific overhangs used for the GreenGate cloning system. Coding sequences were amplified without the stop codon to allow transcription of fluorophores at the C-terminus. BsaI restriction sites were removed by site-directed mutagenesis using the ‘QuikChange II Kit’ following the manufacturer’s instructions (Agilent Technologies). Plasmid DNA amplification was performed by heat-shock transformation into Escherichia coli DH5α cells (10 min on ice, 1 min at 42°C, 1 min on ice, 1 hr shaking at 37°C), which were subsequently plated on selective LB medium (1% w/v tryptone, 0.5% w/v yeast extract, 0.5% w/v NaCl) and cultivated overnight at 37°C. All entry and destination plasmids were validated by restriction digest and Sanger sequencing.
Table 3
Entry vectors used for cloning.
| Name | Description | Bacterial resistance | Backbone | Reference/origin |
|---|---|---|---|---|
| proBAM1(pGD288) | BAM1 promoter3522 bp upstream from transcription start | Ampicillin | pGGA000 | Grégoire Denay |
| proCLE40 | CLE40 promoter2291 bp upstream from translational start codon | Kanamycin | pENTR/D-TOPO | Rene Wink |
| proCLV3 | CLV3 promoter1480 bp upstream from transcription start | Ampicillin | pGGA000 | Jenia Schlegel |
| proCLV1 | CLV1 promoter5759 bp upstream from transcription start | Ampicillin | pGGA000 | Patrick Blümke |
| omega-element(pGGB002) | Omega-element | Ampicillin | pGGB000 | Lampropoulos et al., 2013 |
| SV40 NLS(pGGB005) | SV40 NLS (SIMIAN VIRUS 40 NUCLEARLOCALIZATION SIGNAL) | Ampicillin | pGGB000 | Lampropoulos et al., 2013 |
| BAM1_CDS(pGD351) | BAM1 coding region genomic region of BAM1 START to one codon before STOP, including introns, internal BsaI sites removed | Ampicillin | pGGC000 | Grégoire Denay |
| CLV1_CDS | CLV1 coding region2946 bp coding region amplified from genomic Col-0 DNA without STOP codon and internal BsaI site removed | Ampicillin | pGGC000 | Jenia Schlegel |
| 3x-mCherry(pGGC026) | 3x mCherry | Ampicillin | pGGC000 | Lampropoulos et al., 2013 |
| linker-GFP(pGD165) | linker(10aa)-eGFP | Ampicillin | pGGD000 | Grégoire Denay |
| d-dummy(pGGD002) | d-dummy | Ampicillin | pGGD000 | Lampropoulos et al., 2013 |
| tCLV3 | CLV3 terminator1257 bp downstream of transcription stop | Ampicillin | pGGE000 | Jenia Schlegel |
| tUBQ10(pGGE009) | UBQ10 terminator | Ampicillin | pGGE000 | Lampropoulos et al., 2013 |
| BastaR(pGGF008) | pNOS:BastaR (chi sequence removed):tNOS | Ampicillin | pGGF000 | Lampropoulos et al., 2013 |
| D-AlaR(pGGF003) | pMAS:D-AlaR:tMAS | Ampicillin | pGGF000 | Lampropoulos et al., 2013 |
Table 4
Destination vectors used to generate transgenic A. thaliana reporter lines.
| Name | Backbone | Promoter | N-tag | CDS | C-tag | Terminator | Resistance |
|---|---|---|---|---|---|---|---|
| BAM1:BAM1-GFP | pGGZ001 | proBAM1 | Ω-element(pGGB002) | BAM1-CDS | linker-GFP(pGD165) | tUBQ10 (pGGE009) | D-Alanin(pGGF003) |
| CLE40:Venus-H2B | pMDC99 | proCLE40 | - | Venus | H2B | T3A | Hygromycin |
| CLV1:CLV1-GFP | pGGZ001 | proCLV1 | Ω-element(pGGB002) | CLV1-CDS | linker-GFP(pGD165) | tUBQ10 (pGGE009) | BastaR(pGGF008) |
| CLV3:NLS-3xmCherry | pGGZ001 | proCLV3 | SV40 NLS | 3x-mCherry(pGGC026) | d-dummy(pGGD002) | tCLV3 | BastaR(pGGF008) |
Table 5
Primers used for cloning the entry vectors.
| Name | Primer |
|---|---|
| proBAM1(pGD288) | F: AAAGGTCTCAACCTATGATCCGATCCTCAAAAGTATGTAR: AAAGGTCTCATGTTTCTCTCTATCTCTCTTGTGTG |
| BAM1_CDS(pGD351) | F: TTTGGTCTCAGGCTCTATGAAACTTTTTCTTCTCCTTCR:TTTGGTCTCACTGATAGATTGAGTAGATCCGGCBsaI-site_#1_F: CTTGATCTCTCCGGACTCAACCTCTCCGGBsaI-site_#1_R: CCGGAGAGGTTGAGTCCGGAGAGATCAAGBsaI-site_#2_F: CTCATGTTGCTGACTTTGGACTCGCTAAATTCCTTCAAGBsaI-site_#2_R: CTTGAAGGAATTTAGCGAGTCCAAAGTCAGCAACATGAG |
| proCLE40 | F: CACCGTTAAGCCAAGTAAGTACCACACAGCR: CATTTCAAAAACCTCTTTGTG |
| proCLV1 | F: AAAGGTCTCAACCTGACTATTGTTTATACTTAGTTGR: TTTGGTCTCATGTTCATTTTTTTAGTGTCCTC |
| CLV1_CDS | F: AAAGGTCTCAGGCTTAATGGCGATGAGACR: TTTGGTCTCACTGAACGCGATCAAGTTCBasI-site_#1_F: CTAAAGGACACGGACTGCACGACTGBasI-site_#1_R: CAGTCGTGCAGTCCGTGTCCTTTAGBasI-site_#2_F: CTTAGAGTATCTTGGACTGAACGGAGCTGGBasI-site_#2_R: CCAGCTCCGTTCAGTCCAAGATACTCTAAG |
| proCLV3 | F: AAAGGTCTCAACCTCGGATTATCCATAATAAAAACR:AAAGGTCTCATGTTTTTTAGAGAGAAAGTGACTGAG |
| tCLV3 | F: TTTGGTCTCTCTGCCGCCCTAATCTCTTGTTR: TTTGGTCTCGTGATATGTGTGTTTTTTCTAAACAATC |
Generation of stable A. thaliana lines
Request a detailed protocolGeneration of stable A. thaliana lines was done by using the floral dip method (Clough and Bent, 1998).
Translational CLV1 (CLV1:CLV1-GFP) and transcriptional CLV3 (CLV3:NLS-3xmCherry) reporter carry the BASTA plant resistance cassette. T1 seeds were sown on soil and sprayed with Basta (120 mg/mL) at 5 and 10 DAG. Seeds of ~10 independent Basta-resistant lines were harvested. The transcriptional CLE40 (CLE40:Venus-HB) reporter carries the hygromycin plant resistance cassette. T1 seeds were sown on ½ MS media containing 15 μg/mL hygromycin. The translational BAM1 (BAM1:BAM1-GFP) reporter line carries a D-Alanin resistance cassette and T1 seeds were sown on ½ MS media containing 3–4 mM D-Alanin. Only viable plants (~10 T1 lines) were selected for the T2 generation. T2 seeds were then selected on ½ MS media supplied with either 15 μg/mL hygromycin, 3–4 mM D-Alanin or 10 µg/mL of DL-phosphinothricin (PPT) as a BASTA alternative. Only plants from lines showing about ~75% viability were kept and cultivated under normal plant conditions (21°C, LD). Last, T3 seeds were plated on ½ MS media supplied with 3–4 mM D-Alanin or PPT again and plant lines showing 100% viability were kept as homozygous lines. The CLE40:Venus-H2B, CLV3:NLS-3xmCherry and CLV1:CLV1-GFP constructs were transformed into Col-0 wild-type plants, and stable T3 lines were generated. Plants carrying the CLE40:Venus-H2B reporter were crossed into homozygous clv3-9 or heterozygous wus-7 mutants. Homozygous clv3-9 mutants were detected by its obvious phenotype and were bred into a stable F3 generation. Homozygous wus-7 mutants were identified by phenotype and DNA genotype. Seeds were kept in the F2 generation since homozygous wus-7 plants do not develop seeds. The CLE40:Venus-H2B reporter line was crossed with the CLV3:NLS-3xmCherry reporter line and was brought into a stable F3 generation. To generate the CLE40:Venus-H2B//CLV3:WUS line, plants carrying the CLE40:Venus-H2B line were transformed with the CLV3:WUS construct. T1 seeds were sown on 10 µg/mL of DL-phosphinothricin (PPT) and the viable seedlings were imaged. Plants carrying the CLV1:CLV1-GFP construct were crossed into bam1-3, cle40-2, clv3-9 and clv1-101 mutants until a homozygous mutant background was reached. BAM1:BAM1-GFP lines were transformed into bam1-3 mutants and subsequently crossed into the clv1-20 mutant background which rescued the extremely fasciated meristem phenotype of bam1-3;clv1-20 double mutants (Figure 5D–F). BAM1:BAM1-GFP//bam1-3 plants were also crossed into cle40-2 and clv3-9 mutants until a homozygous mutant background was achieved. The CLE40:CLE40-GFP line was previously described in Stahl et al., 2009. The WUS:NLS-GFP;CLV3:NLS-mCherry reporter line was a gift from the Lohmann lab and was crossed into clv3-9, cle40-2, clv1-101 and bam1-3 mutants until a stable homozygous F3 generation was reached respectively.
Detailed information of all used A. thaliana lines can be found in Table 6.
Table 6
Arabidopsis lines that were analysed in this study.
| Name/construct | Background | Plant resistance | Generation | Reference |
|---|---|---|---|---|
| BAM1:BAM1-GFP | bam1-3 | D-Ala | T4 | This study |
| BAM1:BAM1-GFP | bam1-3;clv1-20 | D-Ala | F3 | This study |
| BAM1:BAM1-GFP | bam1-3;clv3-9 | D-Ala | F3 | This study |
| BAM1:BAM1-GFP | bam1-3;cle40-2 | D-Ala | F3 | This study |
| CLE40:Venus-H2B | Col-0 | Hygromycin | T5 | This study |
| CLE40:Venus-H2B | clv3-9 | Hygromycin | F3 | This study |
| CLE40:Venus-H2B | wus-7 | Hygromycin | F2 | This study |
| CLE40:Venus-H2B | CLV3:WUS//Col-0 | Hygromycin/Basta | T1* | This study |
| CLE40:CLE40-GFP | Col-0 | N/A | T3 | Stahl et al., 2009 |
| CLV1:CLV1-GFP | Col-0 | Basta | T4 | This study |
| CLV1:CLV1-GFP | bam1-3 | Basta | F3 | This study |
| CLV1:CLV1-GFP | clv3-9 | Basta | F3 | This study |
| CLV1:CLV1-GFP | cle40-2 | Basta | F3 | This study |
| CLV1:CLV1-2xGFP | clv1-11 | Basta | N/A | Nimchuk et al., 2011 |
| CLV3:NLS-3xmCherry | CLE40:Venus-H2B//Col-0 | Basta/hygromycin | F3 | This study |
| CLV3:NLS-mCherryWUS:NLS-GFP | Col-0 | Kanamycin | N/A | Anne Pfeiffer |
| CLV3:NLS-mCherryWUS:NLS-GFP | cle40-2 | Kanamycin | F3 | This study |
| CLV3:NLS-mCherryWUS:NLS-GFP | bam1-3 | Kanamycin | F3 | This study |
| CLV3:NLS-mCherryWUS:NLS-GFP | clv1-101 | Kanamycin | F3 | This study |
| CLV3:NLS-mCherryWUS:NLS-GFP | clv3-9 | Kanamycin | F3 | This study |
-
*
Plants do not overcome seedling stage.
Confocal imaging of IFMs
Request a detailed protocolTo image IFMs in vivo, plants were grown under LD (16 hr light/8 hr dark) conditions and inflorescences were cut off at 5 or 6 WAG. Inflorescences were stuck on double-sided adhesive tape on an objective slide and dissected until only the meristem and primordia from P0 to maximum P10 were visible. Next, inflorescences were stained with either propidium iodide (PI 5 mM) or 4′,6-diamidin-2-phenylindol (DAPI 1 µg/mL) for 2–5 min. Inflorescences were then washed three times with water and subsequently covered with water and a cover slide and placed under the microscope. Imaging was performed with a Zeiss LSM780 or LSM880 using a W Plan-Apochromat 40×/1.2 objective. Laser excitation, emission detection range and detector information for fluorophores and staining can be found in Table 7. All IFMs were imaged from the top taking XY images along the Z axis, resulting in a Z-stack through the inflorescence. The vegetative meristems were imaged as described for IFMs. Live imaging of the reporter lines in A. thaliana plants was performed by dissecting primary inflorescences (except for clv3-9 mutants) at 5 WAG under LD conditions. For imaging of the reporter lines in the mutant backgrounds of clv3-9, secondary IFMs were dissected since the primary meristems are highly fasciated. Vegetative meristems were cultivated in continuous light conditions at 21°C on ½ MS media plates and were imaged at 10 DAG. For each reporter line, at least three independent experiments were performed and at least five IFMs were imaged.
Table 7
Microscopy settings used for imaging.
| Fluorophore/staining | Excitation (nm) | Emission (nm) | MBS | Detector | Light source |
|---|---|---|---|---|---|
| DAPI | 405 | 410–490 | 405 | PMT | Diode |
| GFP | 488 | 500–545 | 488/561 | GaAsP | Argon laser |
| Venus | 514 | 518–540 | 458/514 | GaAsP | Argon laser |
| mCherry | 561 | 570–640 | 458/561 | PMT | DPSS laser |
| PI | 561 | 595–650 | 488/561 | PMT | DPSS laser |
-
PMT, photomultiplier tubes; DPSS, diode-pumped solid state.
Phenotyping of CLV mutants
Request a detailed protocolFor meristem measurements (area size, width and height), primary and secondary IFMs of wild-type (Col-0) and mutant plants (cle40-2, cle40-cr1-3, bam1-3, cle40-2;bam1-3, clv1-101) were dissected at 6 WAG under LD conditions. For clv3-9 and clv1-101;bam1-3, only secondary IFMs were imaged and analysed due to the highly fasciated primary meristems. Longitudinal optical sections of the Z-stacks were performed through the middle of the meristem starting in the centre of primordia P5 and ending in the centre of primordia P4. Based on the longitudinal optical sections (XZ), meristem height and area size were measured as indicated in Figure 6. IFM sizes from Figure 1E are also used in Figure 6E for Col-0, cle40-2 and clv3-9 plants.
Same procedure was used to count the cells expressing WUS in different mutant backgrounds (Figure 7A–E). Longitudinal optical sections of IFMs at 5 WAG were performed from P4 to P5, and only nuclei within the meristem area were counted and plotted. For analyses of carpel numbers, the oldest 10–15 siliques per plant at 5 WAG were used. Each carpel was counted as 1, independent of its size. N number depicts number of siliques. Leaf measurements were performed at 4 WAG, and four leaves of each plant were measured and plotted. Data was obtained from at least three independent experiments.
Root length assay
Request a detailed protocolEffects of CLE40 peptide treatment on root growth were analysed by cultivating seedlings (Col-0, clv1-101, bam1-3 and bam1-3;clv1-101) on ½ MS agar plates (squared) supplied with or without synthetic CLE40p at indicated concentrations. The plates were kept upright in continuous light at 21°C and 60% relative humidity. Root growth was measured at 11 DAG by scanning plates and analysed using ImageJ to measure root lengths. For each genotype and condition, 20–48 single roots were measured. Graphs and statistical analyses were done with Prism v.8.
Data analysis
Request a detailed protocolFor visualization of images, the open-source software ImageJ v 1.53c (Schneider et al., 2012) was used. All images were adjusted in ‘Brightness and Contrast’. IFMs in Figure 7 were imaged with identical microscopy settings (except for clv3-9 mutants) and were all changed in ‘Brightness and Contrast’ with the same parameters to ensure comparability. clv3-9 mutants were imaged with a higher laser power since meristems are highly fasciated. MIPs were created by using the ‘Z-Projection’ function and longitudinal optical sections were performed with the ‘Reslice…’ function, resulting in the XZ view of the image. Meristem width, height and area size were measured with the ‘Straight line’ for width and height and the ‘Polygon selection’ for area size. The shape parameter σ was calculated by the quotient of height and width from each IFM. For L1 visualization, the open-source software MorphoGraphX (https://www.mpipz.mpg.de/MorphoGraphX/) was used that was developed by Richard Smith. 2½ D images were created by following the steps in the MorphoGraphX manual (Barbier de Reuille et al., 2015). After both channels (PI and fluorophore signal) were projected to the created mesh, both images were merged using ImageJ v 1.53c.
For all statistical analyses, GraphPad Prism v8.0.0.224 was used. Statistical groups were assigned after calculating p-values by ANOVA and Tukey’s or Dunnett’s multiple comparison test (differential grouping from p≤0.01) as indicated under each figure. Same letters indicate no statistical differences.
Intensity plot profiles were measured with the ‘plot profile’ function in Fiji and plotted in GraphPad Prism. Each intensity profile was normalized. For each genotype, nine meristems were analysed and the mean of all nine meristems with its corresponding error bars (standard deviation) was plotted (Figure 5—figure supplement 3).
Imaris software was used to detect WUS-expressing cells within the entire IFMs (MIP) of different mutant backgrounds. The ‘spot detection’ function in Imaris was used with the same algorithm for Col-0, cle40-2, bam1-3 genotypes ([Algorithm] Enable Region Of Interest = false; Enable Region Growing = false; Enable Tracking = false; [Source Channel]; Source Channel Index = 2; Estimated; Diameter = 3.00 um; Background Subtraction = true; [Classify Spots] "Quality" above 3000). Due to the highly fasciated meristems in clv1-101 and clv3-9 mutants, the threshold for ‘Quality’ for WUS-expressing cells was set to 1000.
All plasmid maps and cloning strategies were created and planned using the software VectorNTI.
Appendix 1
Appendix 1—key resources table
| Reagent type (species) or resource | Designation | Source or reference | Identifiers | Additional information |
|---|---|---|---|---|
| Strain, strain background (Arabidopsis thaliana) | Columbia (Col-0) | NASC ID: N22625 | ABRC: CS22625 | |
| Genetic reagent (A. thaliana) | bam1-3 | Alonso et al., 2003; NASC ID: N515302 | ABRC: SALK_015302 | T-DNA mutation in Col-0 background |
| Genetic reagent (A. thaliana) | cle40-2 | Stahl et al., 2009 | NA | Transposon mutation Col‑0 background |
| Genetic reagent (A. thaliana) | cle40-cr1/2/3 | Yamaguchi et al., 2017 | NA | CRISPR in Col-0 background |
| Genetic reagent (A. thaliana) | clv3-9 | Hobe et al., 2003 | NA | EMS in Col-0 background |
| Genetic reagent (A. thaliana) | clv1-20 | Alonso et al., 2003; NASC ID: N508670 | ABRC: SALK_008670 | T-DNA mutation in Col-0 background |
| Genetic reagent (A. thaliana) | clv1-101 | Alonso et al., 2003; NASC ID: N858348 | ABRC: CS858348 | T-DNA mutation in Col-0 background |
| Genetic reagent (A. thaliana) | wus-7 | Graf et al., 2010; | NA | EMS in L.er. background Gift from J. Lohmann lab |
| Genetic reagent (A. thaliana) | BAM1:BAM1-GFP | This study | NA | Transgenic line in bam1‑3 background |
| Genetic reagent (A. thaliana) | BAM1:BAM1-GFP | This study | NA | Transgenic line in bam1‑3;clv1‑20 background |
| Genetic reagent (A. thaliana) | BAM1:BAM1-GFP | This study | NA | Transgenic line in bam1‑3;clv3-9 background |
| Genetic reagent (A. thaliana) | BAM1:BAM1-GFP | This study | NA | Transgenic line in bam1‑3;cle40-2 background |
| Genetic reagent (A. thaliana) | CLE40:Venus-H2B | This study | NA | Transgenic line in Col-0 background |
| Genetic reagent (A. thaliana) | CLE40:Venus-H2B | This study | NA | Transgenic line in clv3-9 background |
| Genetic reagent (A. thaliana) | CLE40:Venus-H2B | This study | NA | Transgenic line in wus-7 background |
| Genetic reagent (A. thaliana) | CLE40:Venus-H2B | This study | NA | Transgenic line in CLV3:WUS/Col-0 background |
| Genetic reagent (A. thaliana) | CLE40:CLE40-GFP | Stahl et al., 2009 | NA | Transgenic line in Col-0 background |
| Genetic reagent (A. thaliana) | CLV1:CLV1-GFP | This study | NA | Transgenic line in Col-0 background |
| Genetic reagent (A. thaliana) | CLV1:CLV1-GFP | This study | NA | Transgenic line in clv1-101 background |
| Genetic reagent (A. thaliana) | CLV1:CLV1-GFP | This study | NA | Transgenic line in bam1-3 background |
| Genetic reagent (A. thaliana) | CLV1:CLV1-GFP | This study | NA | Transgenic line in clv3-9 background |
| Genetic reagent (A. thaliana) | CLV1:CLV1-GFP | This study | NA | Transgenic line in cle40-2 background |
| Genetic reagent (A. thaliana) | CLV1:CLV1-2xGFP | Nimchuk et al., 2011 | NA | Transgenic line in clv1-11 backgroundGift from Z. Nimchuk lab |
| Genetic reagent (A. thaliana) | CLV3:NLS-3xmCherry | This study | NA | Transgenic line in CLE40:Venus-H2B/Col-0 background |
| Genetic reagent (A. thaliana) | CLV3:NLS-mCherry WUS:NLS-GFP | Anne Pfeiffer | NA | Transgenic line in Col-0 backgroundGift from J. Lohmann lab |
| Genetic reagent (A. thaliana) | CLV3:NLS-mCherry WUS:NLS-GFP | This study | NA | Transgenic line in cle40-2 background |
| Genetic reagent (A. thaliana) | CLV3:NLS-mCherry WUS:NLS-GFP | This study | NA | Transgenic line in bam1-3 background |
| Genetic reagent (A. thaliana) | CLV3:NLS-mCherry WUS:NLS-GFP | This study | NA | Transgenic line in clv1-101 background |
| Genetic reagent (A. thaliana) | CLV3:NLS-mCherry WUS:NLS-GFP | This study | NA | Transgenic line in clv3-9 background |
| Strain, strain background (Agrobacterium tumefaciens) | A. tumefaciens GV3101 pMP90 pSoup | Lifeasible | Cat# ACC-101 | |
| Recombinant DNA reagent | pGGZ001 | Lampropoulos et al., 2013 | Addgene | RRID:Addgene_48868 |
| Recombinant DNA reagent | pGGB002 | Lampropoulos et al., 2013 | Addgene | RRID:Addgene_48820 |
| Recombinant DNA reagent | pGGE009 | Lampropoulos et al., 2013 | Addgene | RRID:Addgene_48841 |
| Recombinant DNA reagent | pGGF003 | Lampropoulos et al., 2013 | Addgene | RRID:Addgene_48844 |
| Recombinant DNA reagent | pGGC026 | Lampropoulos et al., 2013 | Addgene | RRID:Addgene_48831 |
| Recombinant DNA reagent | pGGD002 | Lampropoulos et al., 2013 | Addgene | RRID:Addgene_48834 |
| Recombinant DNA reagent | pGGF008 | Lampropoulos et al., 2013 | Addgene | RRID:Addgene_48848 |
| Recombinant DNA reagent | pMDC99 | Curtis and Grossniklaus, 2003 | NA | |
| Recombinant DNA reagent | pBAM1/pGGA000 | This study | NA | Entry vector used for cloningSee Tables 4 and 5 for details |
| Recombinant DNA reagent | BAM1-CDS/pGGC000 | This study | TAIR: AT5G65700 | Entry vector used for cloningSee Tables 4 and 5 for details |
| Recombinant DNA reagent | pCLV1-/pGGA000 | This study | NA | Entry vector used for cloningSee Tables 4 and 5 for details |
| Recombinant DNA reagent | CLV1-CDS/pGGC000 | This study | TAIR: AT1G75820 | Entry vector used for cloningSee Tables 4 and 5 for details |
| Recombinant DNA reagent | pCLE40/pGGA000 | This study | NA | Entry vector used for cloningSee Tables 4 and 5 for details |
| Recombinant DNA reagent | pCLV3/pGGA000 | This study | NA | Entry vector used for cloningSee Tables 4 and 5 for details |
| Recombinant DNA reagent | pCLV3/pGGE000 | This study | NA | Entry vector used for cloningSee Tables 4 and 5 for details |
| Sequence-based reagent | Cloning primers | This study | NA | Table 5 |
| Sequence-based reagent | Genotyping primers | This study | NA | Table 2 |
| Chemical compound, drug | BASTA non-selective herbicide | Bayer CropScience | 84442615 | |
| Peptide, recombinant protein | Synthetic CLE40 | Peptides&Elephants | NA | |
| Software, algorithm | ImageJ v 1.53c | Schneider et al., 2012 | https://imagej.net/software/fiji/ | RRID:SCR_003070 |
| Software, algorithm | MorphoGraphX | Barbier de Reuille et al., 2015 | https://www.mpipz.mpg.de/MorphoGraphX/ | |
| Software, algorithm | GraphPad Prism v8.0.0.224 | NA | GraphPad Prism (https://graphpad.com) | RRID:SCR_002798 |
| Software, algorithm | Imaris | NA | http://www.bitplane.com/imaris/imaris | RRID:SCR_007370 |
Data availability
Original microscopy and image analysis data represented in the manuscript are available via Dryad (https://doi.org/10.5061/dryad.1g1jwstwf) and BioStudies (https://www.ebi.ac.uk/biostudies/studies/S-BSST723).
-
Dryad Digital RepositoryControl of Arabidopsis shoot stem cell homeostasis by two antagonistic CLE peptide signalling pathways.https://doi.org/10.5061/dryad.1g1jwstwf
-
BioStudiesID S-BSST723. Control of Arabidopsis shoot stem cell homeostasis by two antagonistic CLE peptide signalling pathways.
References
-
CLE40 signaling regulates root stem cell fatePlant Physiology 182:1776–1792.https://doi.org/10.1104/pp.19.00914
-
Receptor-like cytoplasmic kinase MAZZA mediates developmental processes with CLAVATA1 family receptors in ArabidopsisJournal of Experimental Botany 72:4853–4870.https://doi.org/10.1093/jxb/erab183
-
Regulation of CLV3 expression by two homeobox genes in ArabidopsisPlant Physiology 129:565–575.https://doi.org/10.1104/pp.001867
-
Physcomitrium patens: A single model to study oriented cell divisions in 1d to 3d patterningTernational Journal of Molecular Sciences 22:2626.https://doi.org/10.3390/ijms22052626
-
Recent Advances in Arabidopsis CLE Peptide SignalingTrends in Plant Science 25:1005–1016.https://doi.org/10.1016/j.tplants.2020.04.014
-
The Overlapping and Distinct Roles of HAM Family Genes in Arabidopsis Shoot MeristemsFrontiers in Plant Science 11:541968.https://doi.org/10.3389/fpls.2020.541968
-
Fundamental mechanisms of the stem cell regulation in land plants: lesson from shoot apical cells in bryophytesPlant Molecular Biology 1:11103-021-01126.https://doi.org/10.1007/s11103-021-01126-y
-
Loss of CLE40, a protein functionally equivalent to the stem cell restricting signal CLV3, enhances root waving in ArabidopsisDevelopment Genes and Evolution 213:371–381.https://doi.org/10.1007/s00427-003-0329-5
-
The WUSCHEL gene is required for shoot and floral meristem integrity in ArabidopsisDevelopment 122:87–96.
-
NIH Image to ImageJ: 25 years of image analysisNature Methods 9:671–675.https://doi.org/10.1038/nmeth.2089
-
Diverse roles of ERECTA family genes in plant developmentJournal of Integrative Plant Biology 55:1238–1250.https://doi.org/10.1111/jipb.12108
-
CLAVATA-WUSCHEL signaling in the shoot meristemDevelopment 143:3238–3248.https://doi.org/10.1242/dev.133645
-
Plant stem cell nichesThe International Journal of Developmental Biology 49:479–489.https://doi.org/10.1387/ijdb.041929ys
-
Plant primary meristems: shared functions and regulatory mechanismsCurrent Opinion in Plant Biology 13:53–58.https://doi.org/10.1016/j.pbi.2009.09.008
-
Patterns in Plant DevelopmentCambridge University Press 2:11626227.https://doi.org/10.1017/CBO9780511626227
-
An Evolutionarily Conserved Coreceptor Gene Is Essential for CLAVATA Signaling in Marchantia polymorphaFrontiers in Plant Science 12:657548.https://doi.org/10.3389/fpls.2021.657548
-
WUSCHEL protein movement mediates stem cell homeostasis in the Arabidopsis shoot apexGenes & Development 25:2025–2030.https://doi.org/10.1101/gad.17258511
Article and author information
Author details
Funding
Deutsche Forschungsgemeinschaft (CEPLAS (EXC2048))
- Rüdiger GW Simon
Deutsche Forschungsgemeinschaft (iGRAD-PLANT)
- Rüdiger GW Simon
- Rene Wink
- Jenia Schlegel
Deutsche Forschungsgemeinschaft (CRC1208)
- Rüdiger GW Simon
- Gregoire Denay
The funders had no role in study design, data collection and interpretation, or the decision to submit the work for publication.
Acknowledgements
This study was funded by DFG through iGrad-Plant (IRTG 2466), CRC 1208 and CEPLAS (EXC 2048). We thank Cornelia Gieseler, Silke Winters and Carin Theres for technical support and Yasuka L Yamaguchi (Sawa lab) and Anne Pfeiffer (Lohmann lab) for sharing Arabidopsis seeds. We also thank Vicky Howe for proofreading the manuscript, the Center for Advanced imaging (CAi) at HHU for microscopy support and Aleksandra Sapala for support with MorphoGraphX.
Copyright
© 2021, Schlegel et al.
This article is distributed under the terms of the Creative Commons Attribution License, which permits unrestricted use and redistribution provided that the original author and source are credited.
Metrics
-
- 6,140
- views
-
- 960
- downloads
-
- 70
- citations
Views, downloads and citations are aggregated across all versions of this paper published by eLife.
Citations by DOI
-
- 70
- citations for umbrella DOI https://doi.org/10.7554/eLife.70934
Download links
A two-part list of links to download the article, or parts of the article, in various formats.
Downloads (link to download the article as PDF)
Open citations (links to open the citations from this article in various online reference manager services)
Cite this article (links to download the citations from this article in formats compatible with various reference manager tools)
Control of Arabidopsis shoot stem cell homeostasis by two antagonistic CLE peptide signalling pathways
eLife 10:e70934.
https://doi.org/10.7554/eLife.70934


