Circadian oscillations in Trichoderma atroviride and the role of core clock components in secondary metabolism, development, and mycoparasitism against the phytopathogen Botrytis cinerea
- ANID – Millennium Science Initiative Program - Millennium Institute for Integrative Biology (iBio), Chile
- Pontificia Universidad Católica de Chile, Biological Sciences Faculty, Molecular Genetics and Microbiology Department, Chile
- Centro de Biotecnología Vegetal, Facultad de Ciencias de la Vida, Universidad Andrés, Chile
- Department of Biotechnology and Biochemistry, Cinvestav Unidad Irapuato, Mexico
- Laboratorio de expresión génica y desarrollo en hongos, Unidad de Genómica Avanzada-LANGEBIO, Mexico
Figures
Figure 1 with 8 supplements
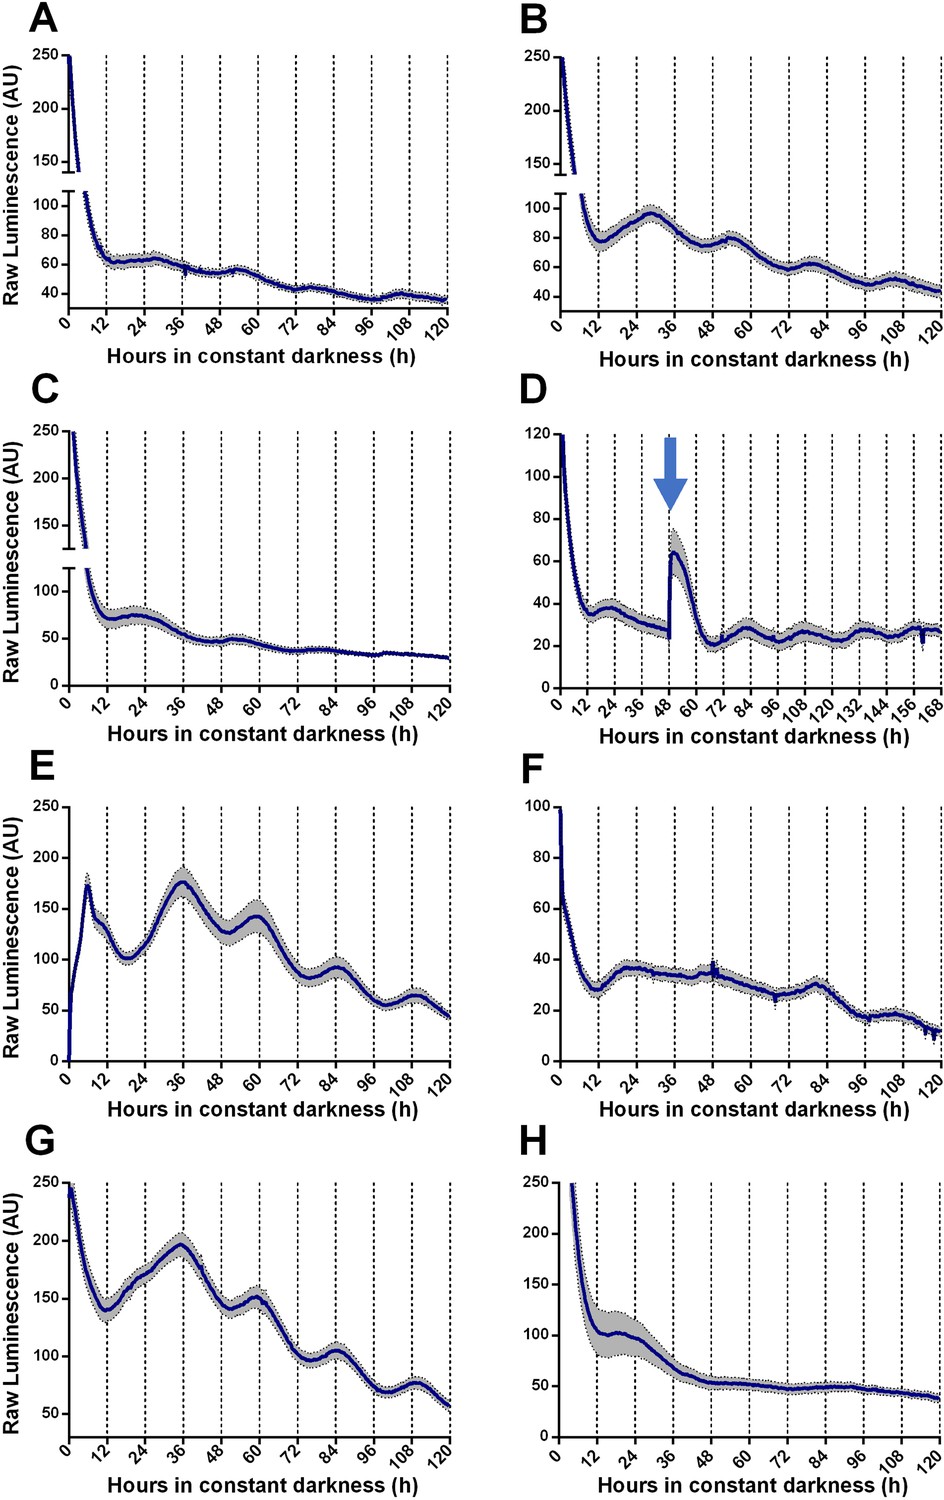
Circadian oscillations of TaFRQLUC are reset by light and temperature and are temperature-compensated.
(A, B) Raw TaFRQLUC levels were quantified under DD in strains previously entrained for 3 days under LD (12:12 hr) cycles in GYEC (A) or GYEC+ peas (B) culture media. (C) Culture in LL (at 25°C) for 72 hr and then transferred to DD exhibit oscillations. (D) The effect of a 20 min. light pulse (blue arrow) was evaluated in DD on cultures that were also entrained in LD cycles as mentioned. (E) A 4°C temperature pulse efficiently resets rhythms, as shown in cultures grown for 48 hr in LL, cold pulsed in the dark for 6 hr, and then monitored in DD. (F–H) TaFRQLUC expression was monitored at 20 (F), 22 (G), and 28°C (H) to assess rhythmicity at different temperatures. GYEC+ peas media was used in all cases except in (A), and bioluminescence was recorded at 25°C except when indicated otherwise. In all cases, raw data’s mean values are presented from two biological and eight technical replicates each (SEM represented with the gray area). Source data can be found in Figure 1—source data 1.
-
Figure 1—source data 1
For each graph, source data of TaFRQLUC bioluminescence is provided as an .xlsx file.
Data is organized in individual sheets following the same order as in Figure 1.
- https://cdn.elifesciences.org/articles/71358/elife-71358-fig1-data1-v2.xlsx
Figure 1—figure supplement 1
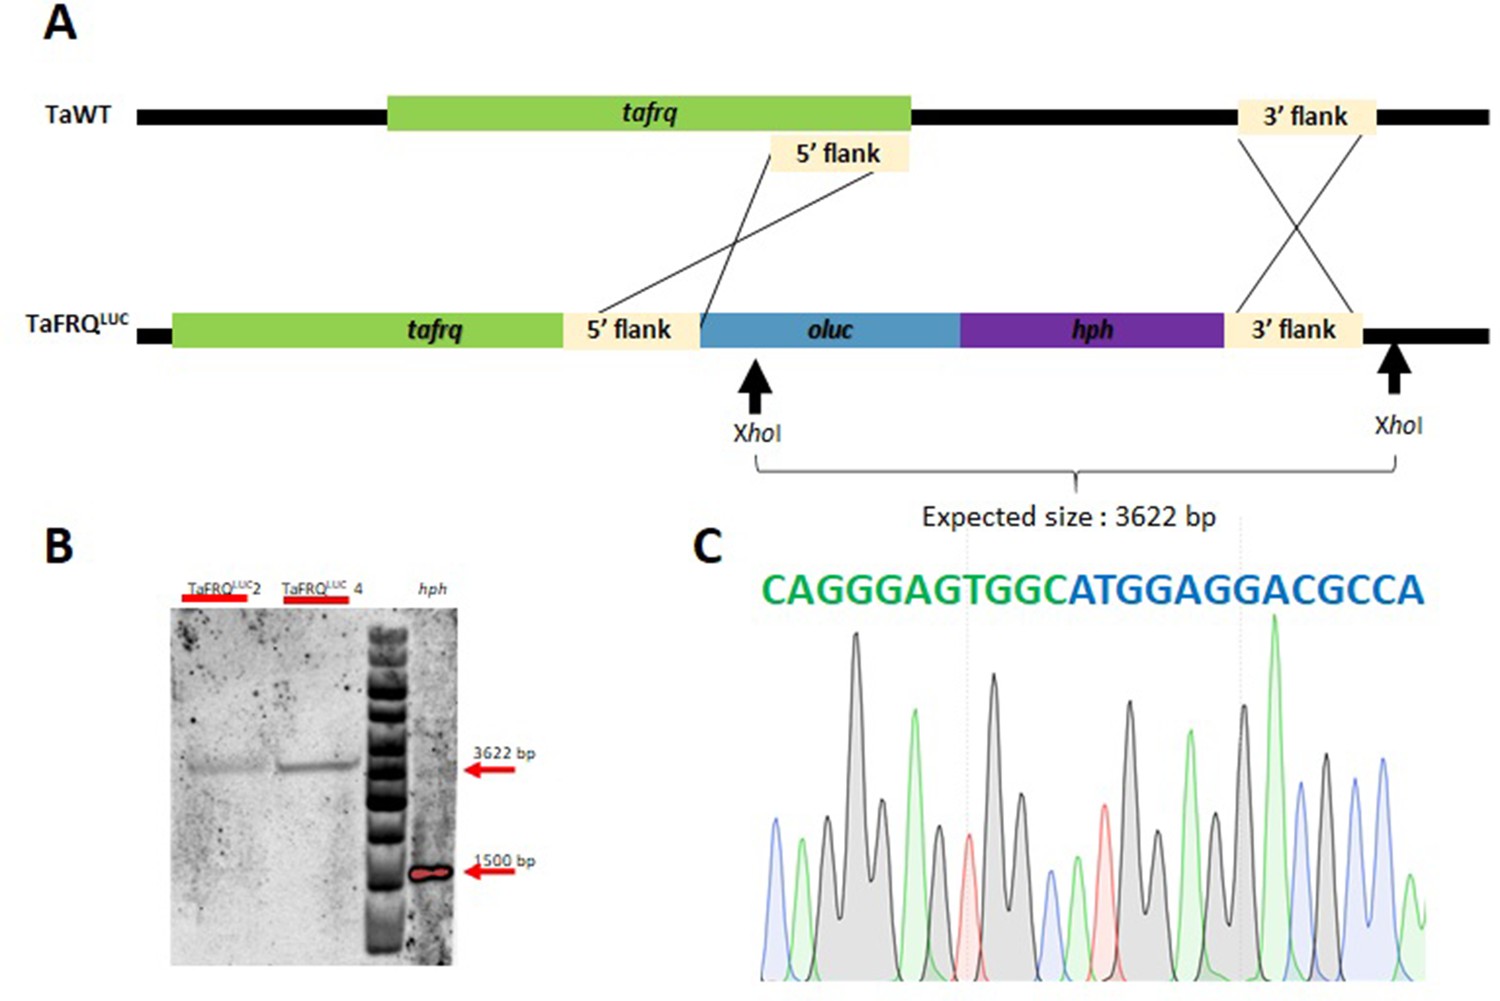
Generation of TaFRQLUC strains.
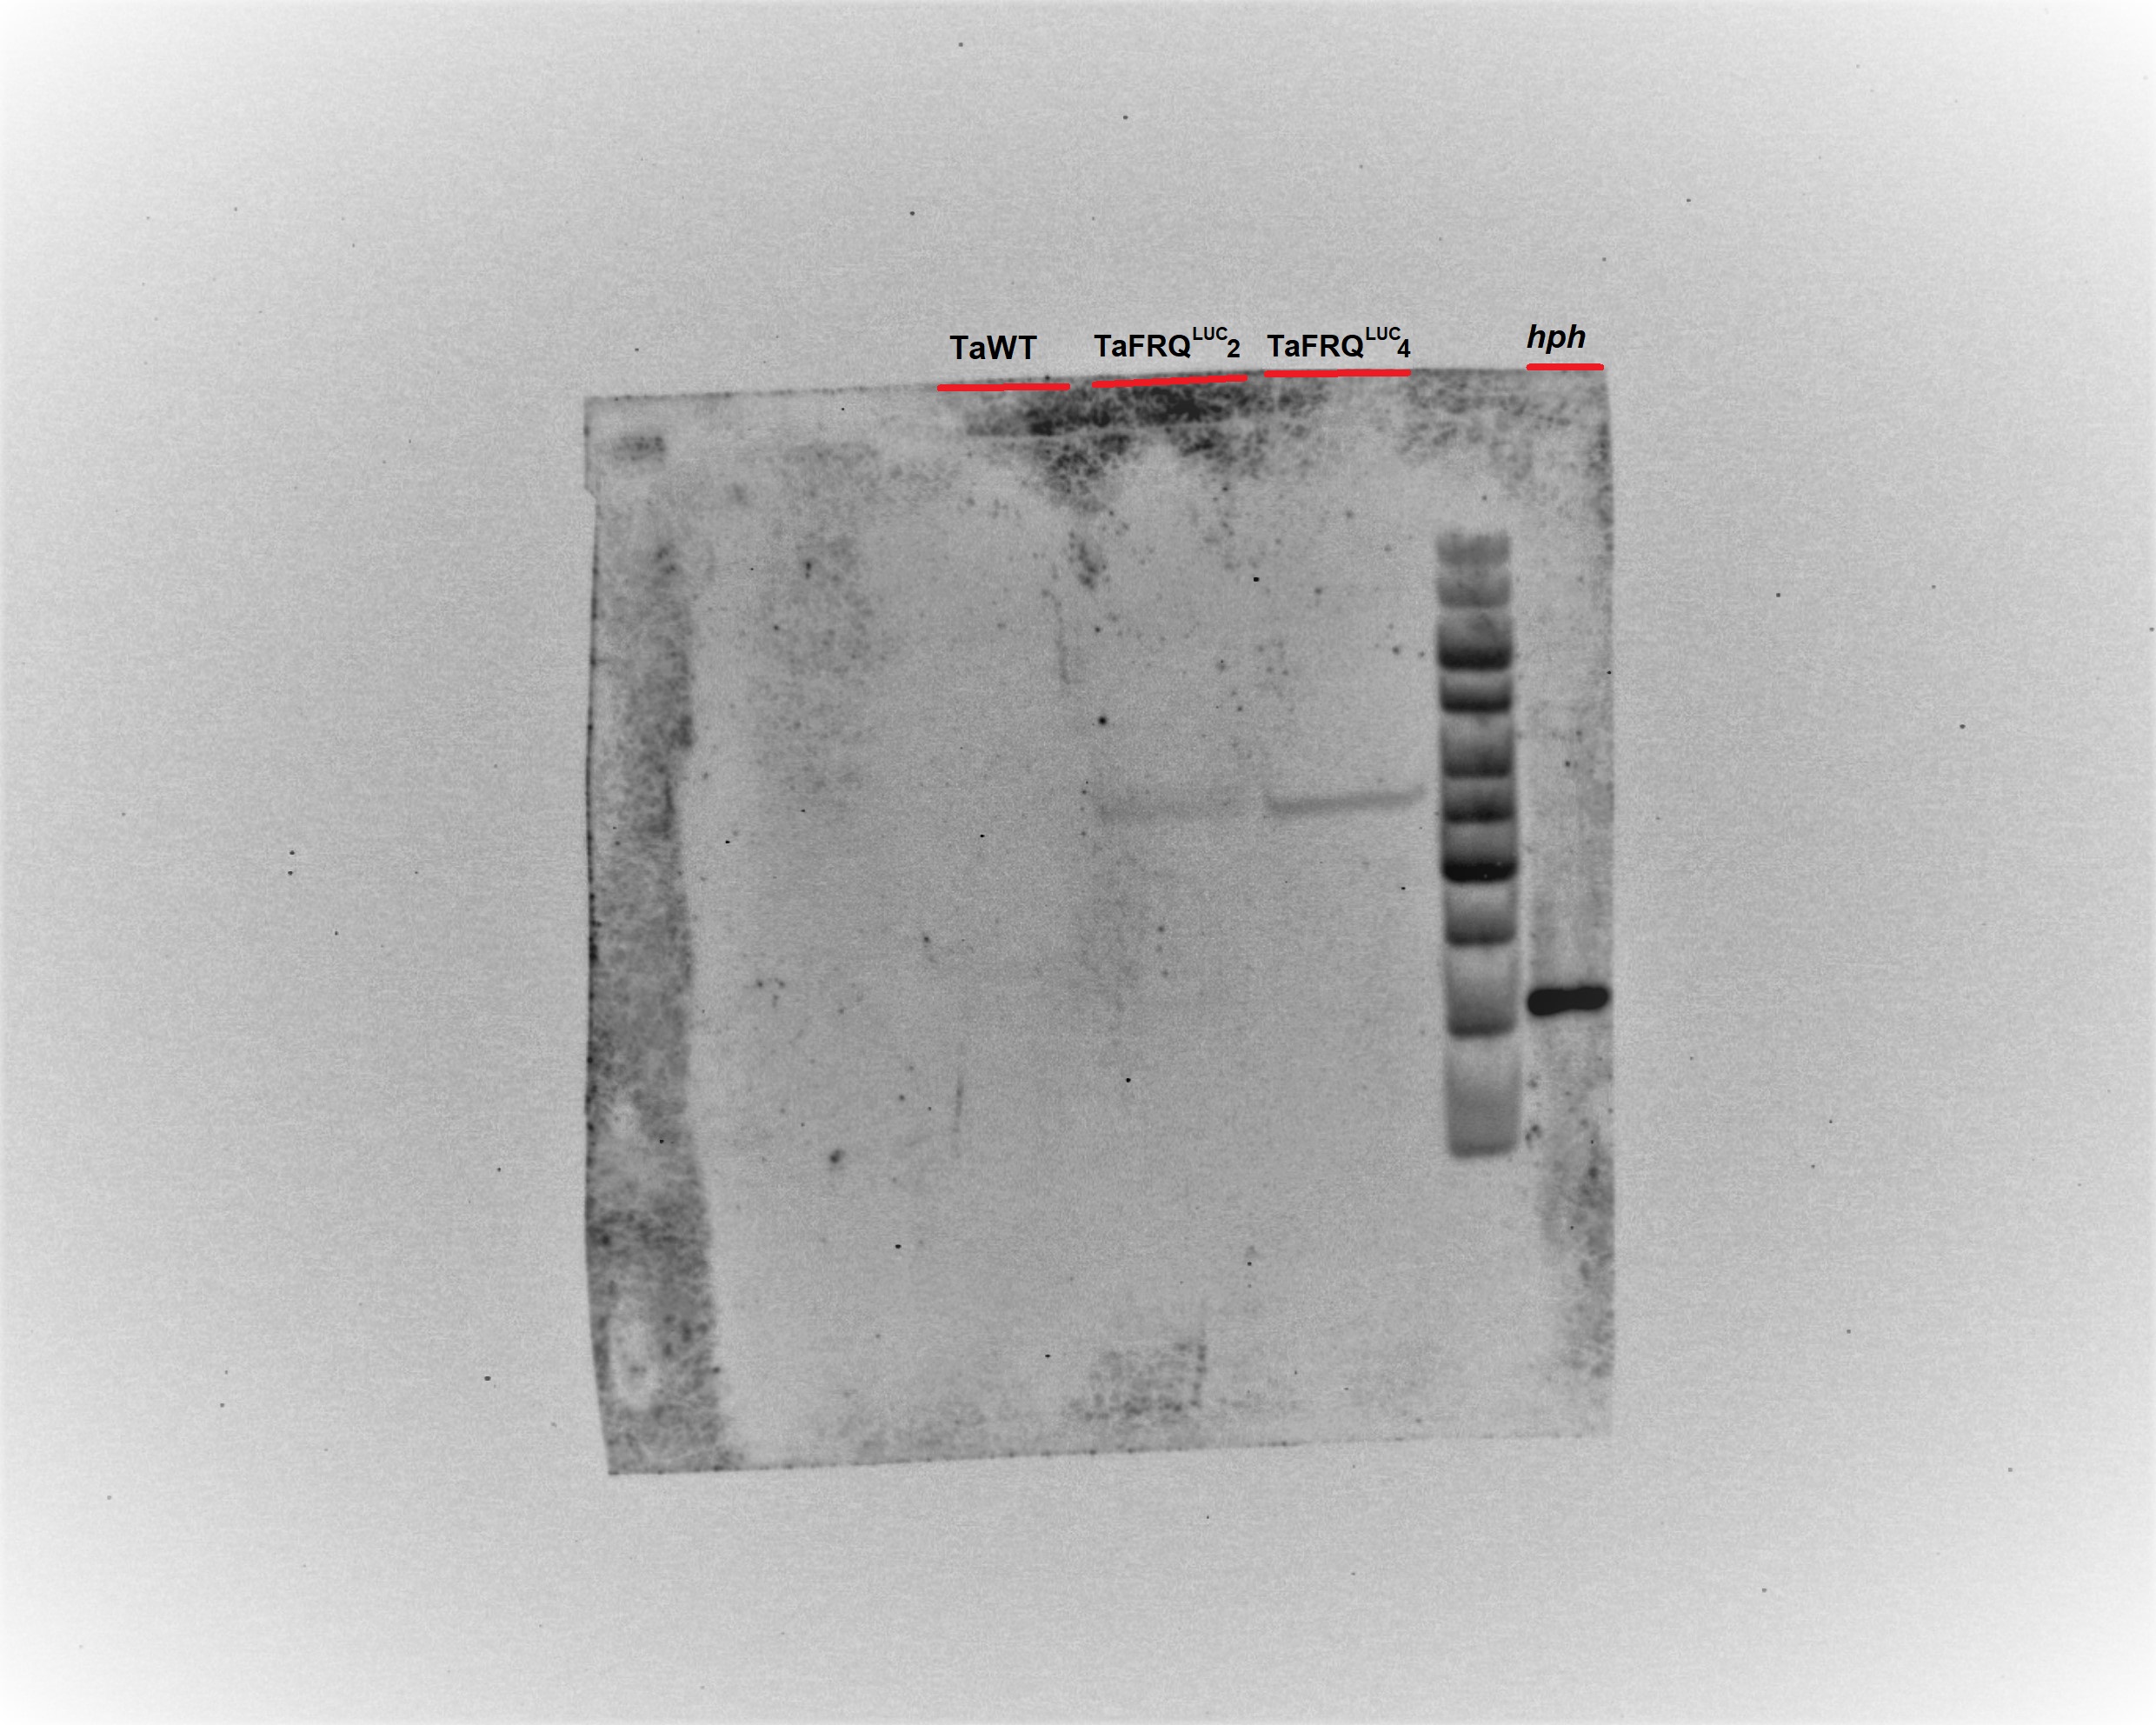
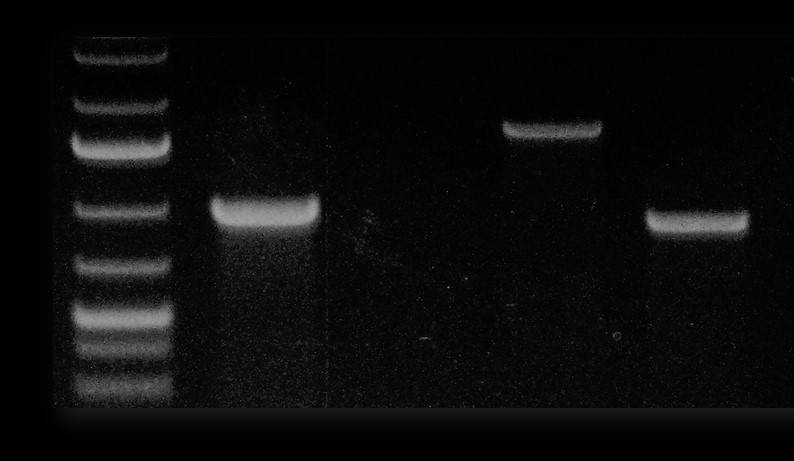
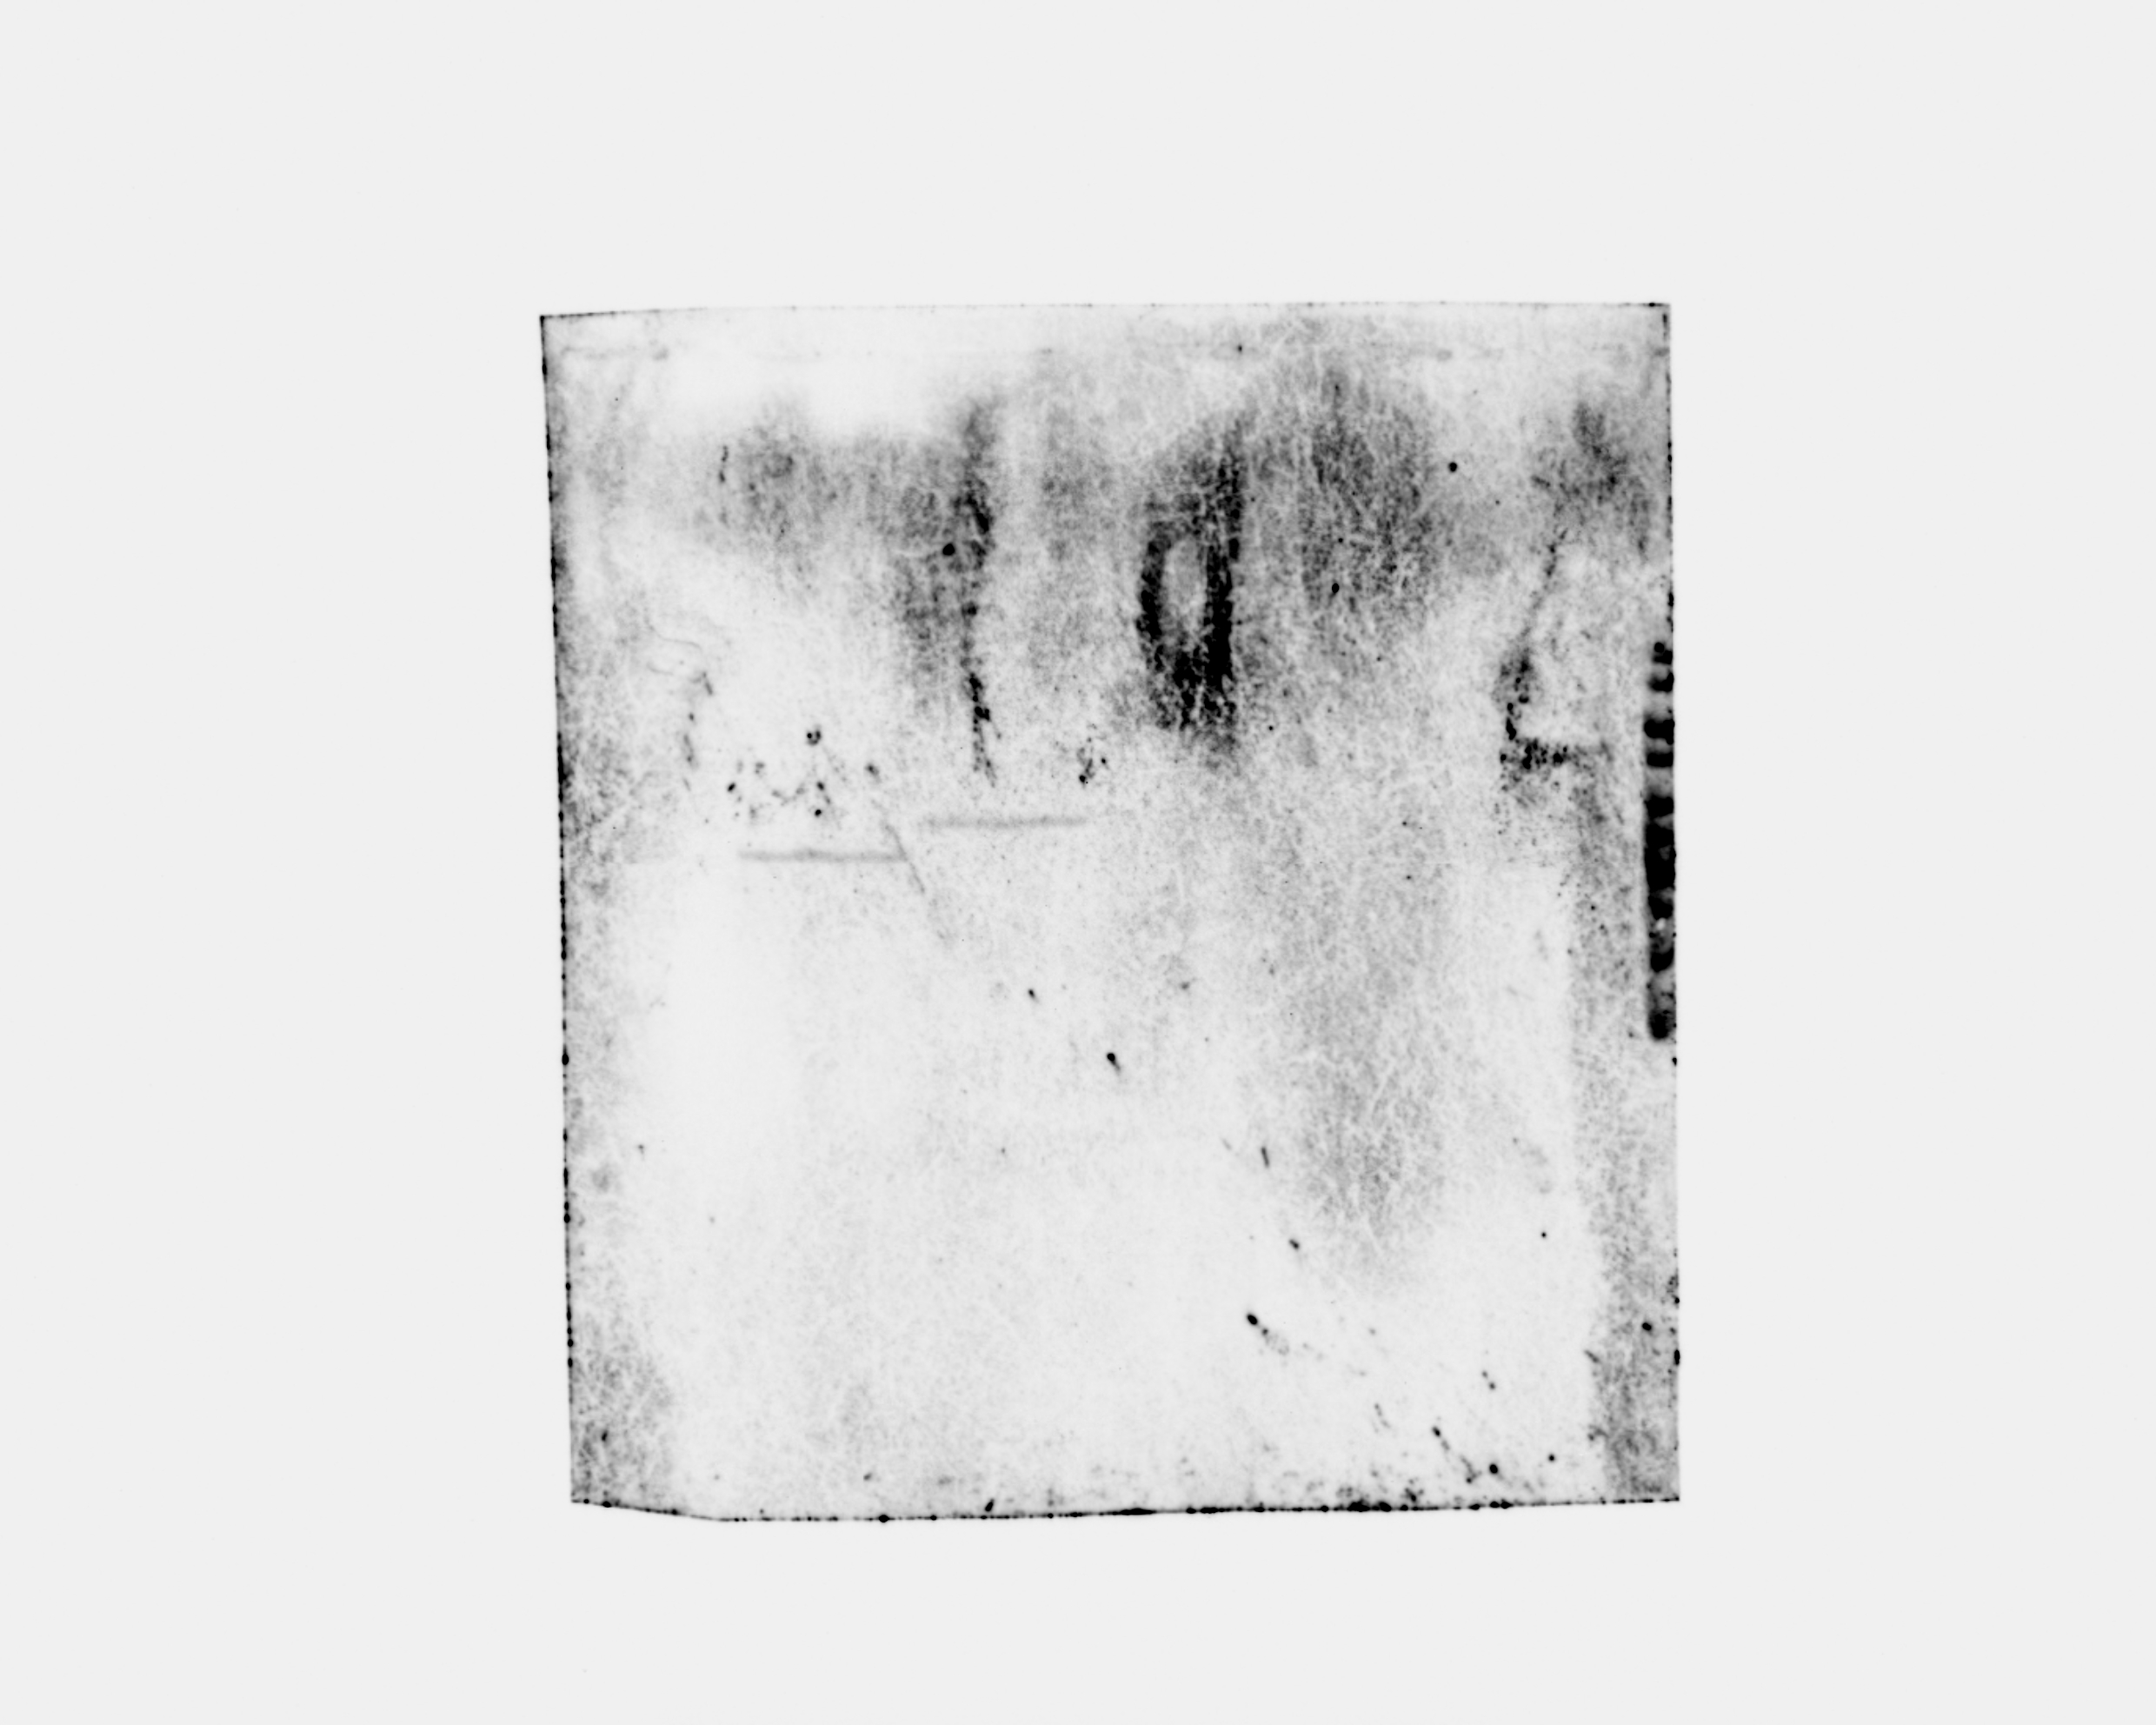
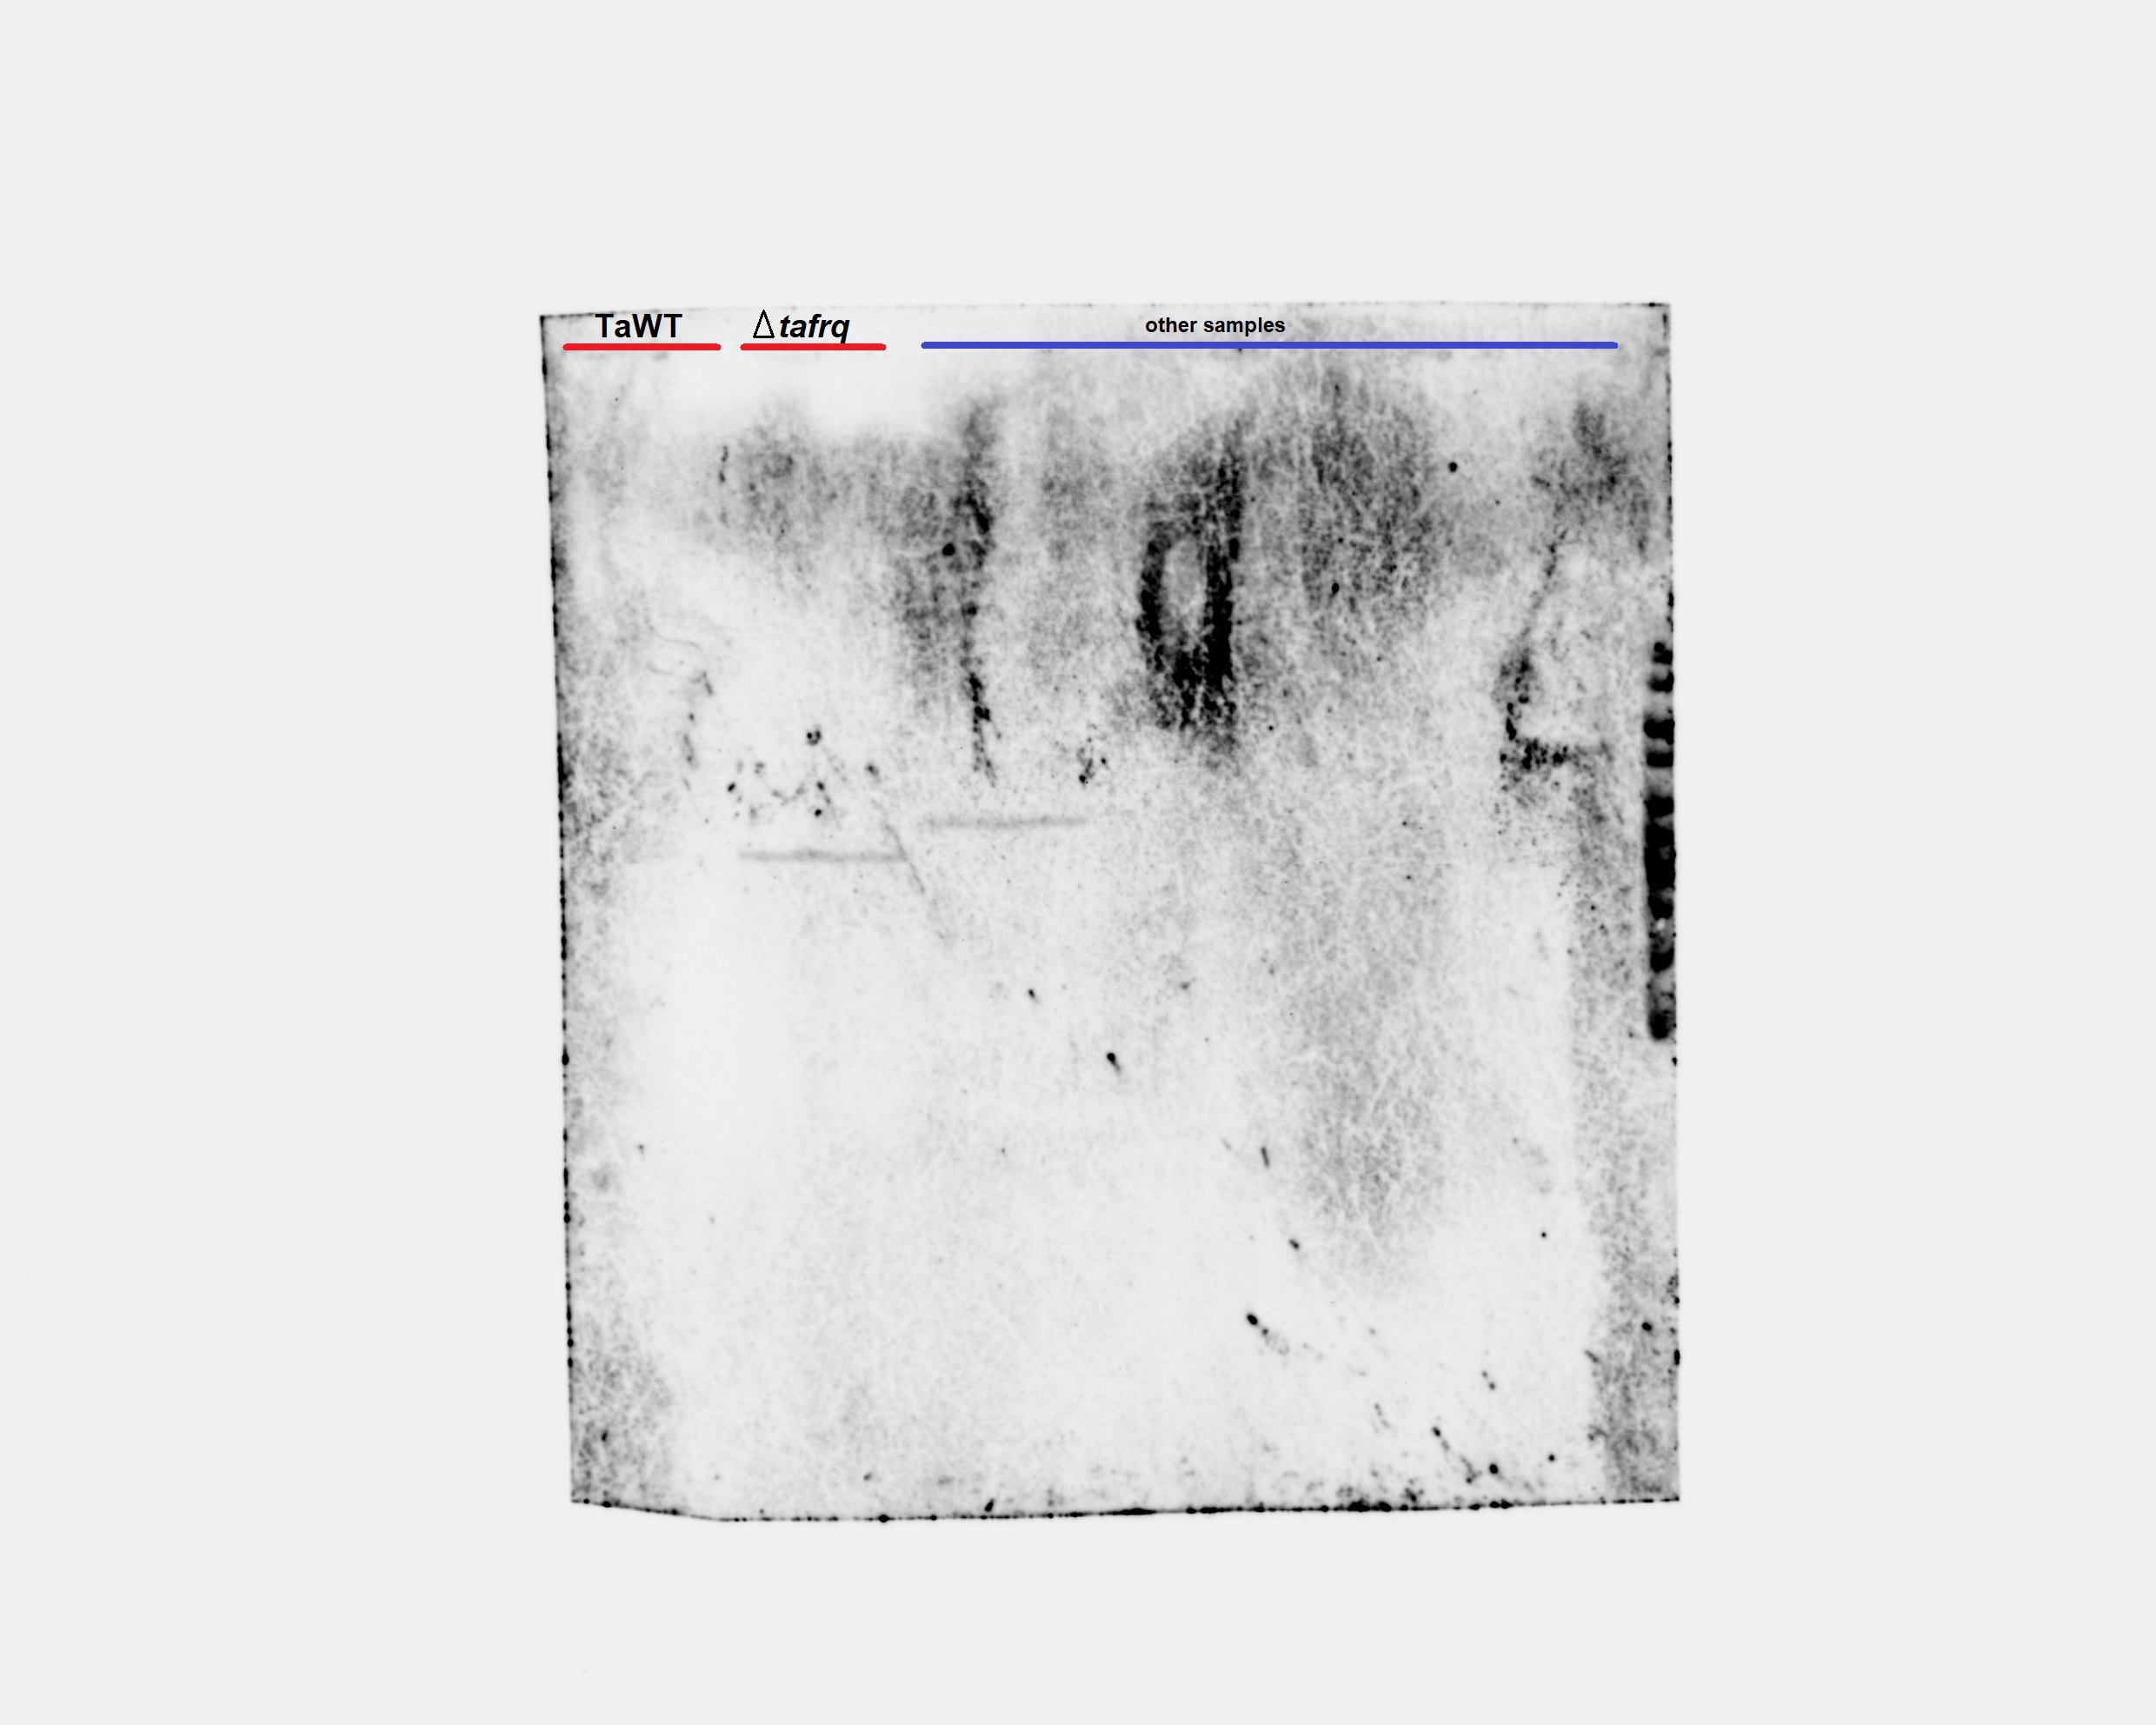
(A) Representation of the homologous recombination strategy used to integrate luc yielding TaFRQLUC at the endogenous locus. Black arrows show expected XhoI restriction sites used for Southern blot. (B) Southern blot analysis showing both correct and single-copy integration of the replacement cassette using hph as the probe. (C) Sequence chromatogram showing the correct fusion of tafrq (in green, without stop codon) and luc (in blue).
-
Figure 1—figure supplement 1—source data 1
Related to Figure 1—figure supplement 1B.
Original Southern blot of TaFRQLUC (strains 2 and 4) and TaWT.
- https://cdn.elifesciences.org/articles/71358/elife-71358-fig1-figsupp1-data1-v2.jpg
-
Figure 1—figure supplement 1—source data 2
Related to Figure 1—figure supplement 1B.
Labeled Southern blot of TaFRQLUC (strains 2 and 4) and TaWT.
- https://cdn.elifesciences.org/articles/71358/elife-71358-fig1-figsupp1-data2-v2.jpg
Figure 1—figure supplement 2
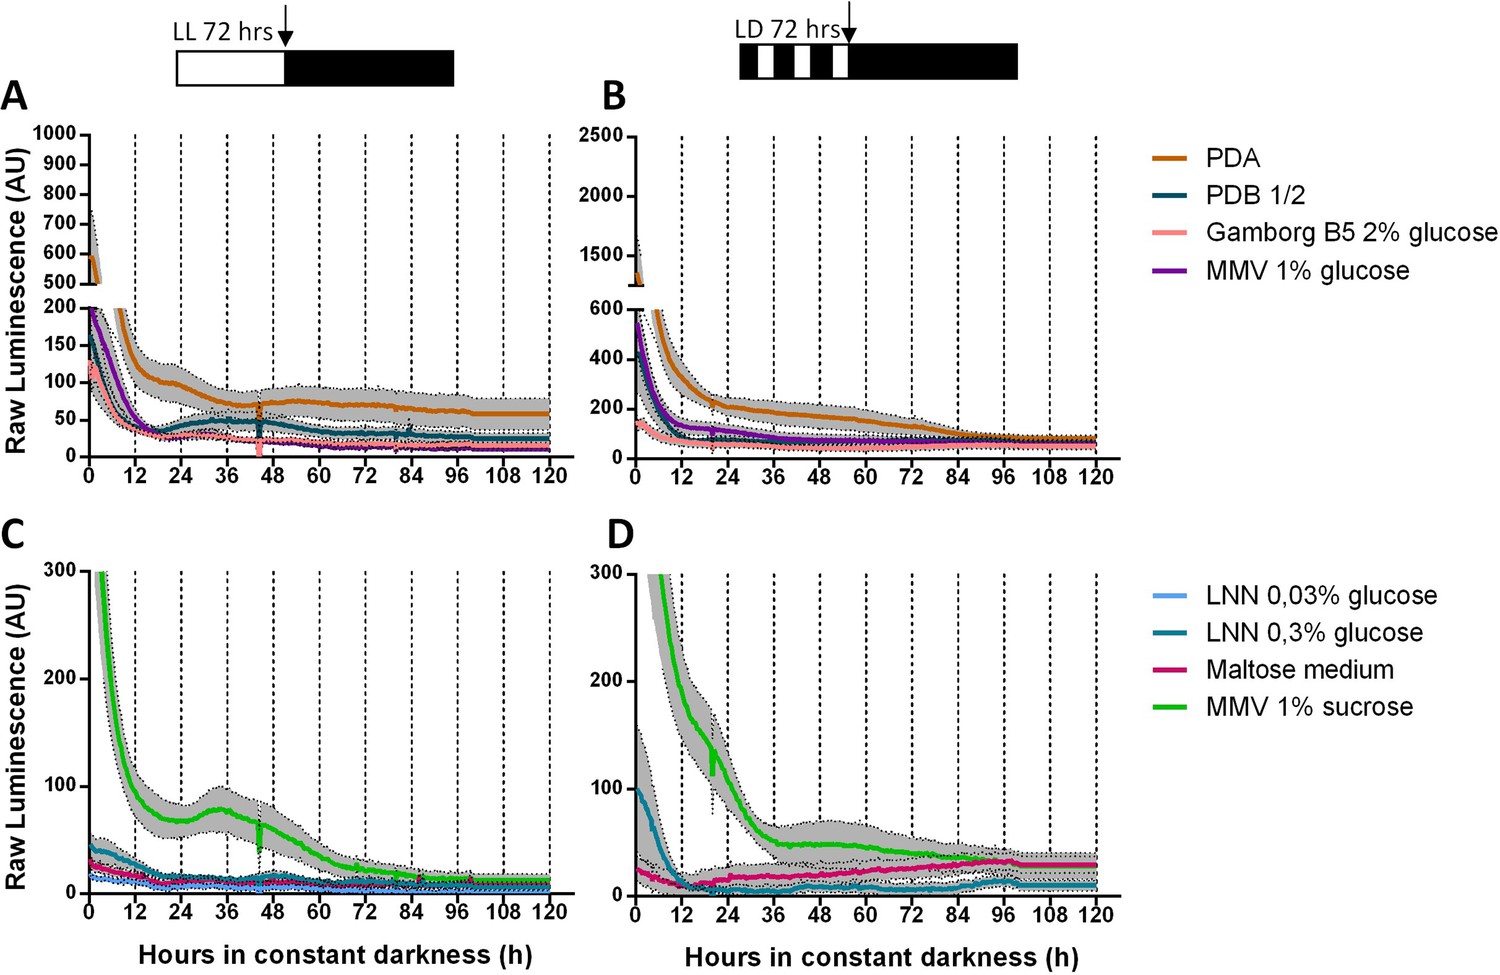
TaFRQLUC oscillations are conditioned by media composition.
TaFRQLUC reporter strains (clones 2 and 4) received two treatments: each strain was cultivated first under LL culture conditions for 3 days to reset the clock (A, C) or entrained during 3 days under LD conditions (B, D), both at 25°C. The schematic representation at the top of each panel denotes the lights-on period and the lights-off period (white and black boxes, respectively). LUC acquisition of the TaFRQLUC reporter strains started at the beginning of the free-running conditions (DD, indicated with a vertical black arrow) monitored for 5 days at 25°C. Eight different culture media were tested for each strain (marked with different colors), but no oscillations were determined. Raw data is presented. An average of two biological replicates and three technical replicates each is presented (SEM is represented with the gray area).
Figure 1—figure supplement 3

Normalized data of TaFRQLUC oscillations in GYEC.
TaFRQLUC reporter strains (TaFRQLUC 2 and 4) were entrained during 3 days under LD (12:12 hr) cycles at 25°C. (A) GYEC culture media. (B) GYEC supplemented with 0.5% peas (w/v). In all experiments, LUC activity was monitored under DD at 25°C for 5 days. Data were normalized to mean. An average of two biological replicates and eight technical replicates is presented (SEM is represented with the gray area).
Figure 1—figure supplement 4
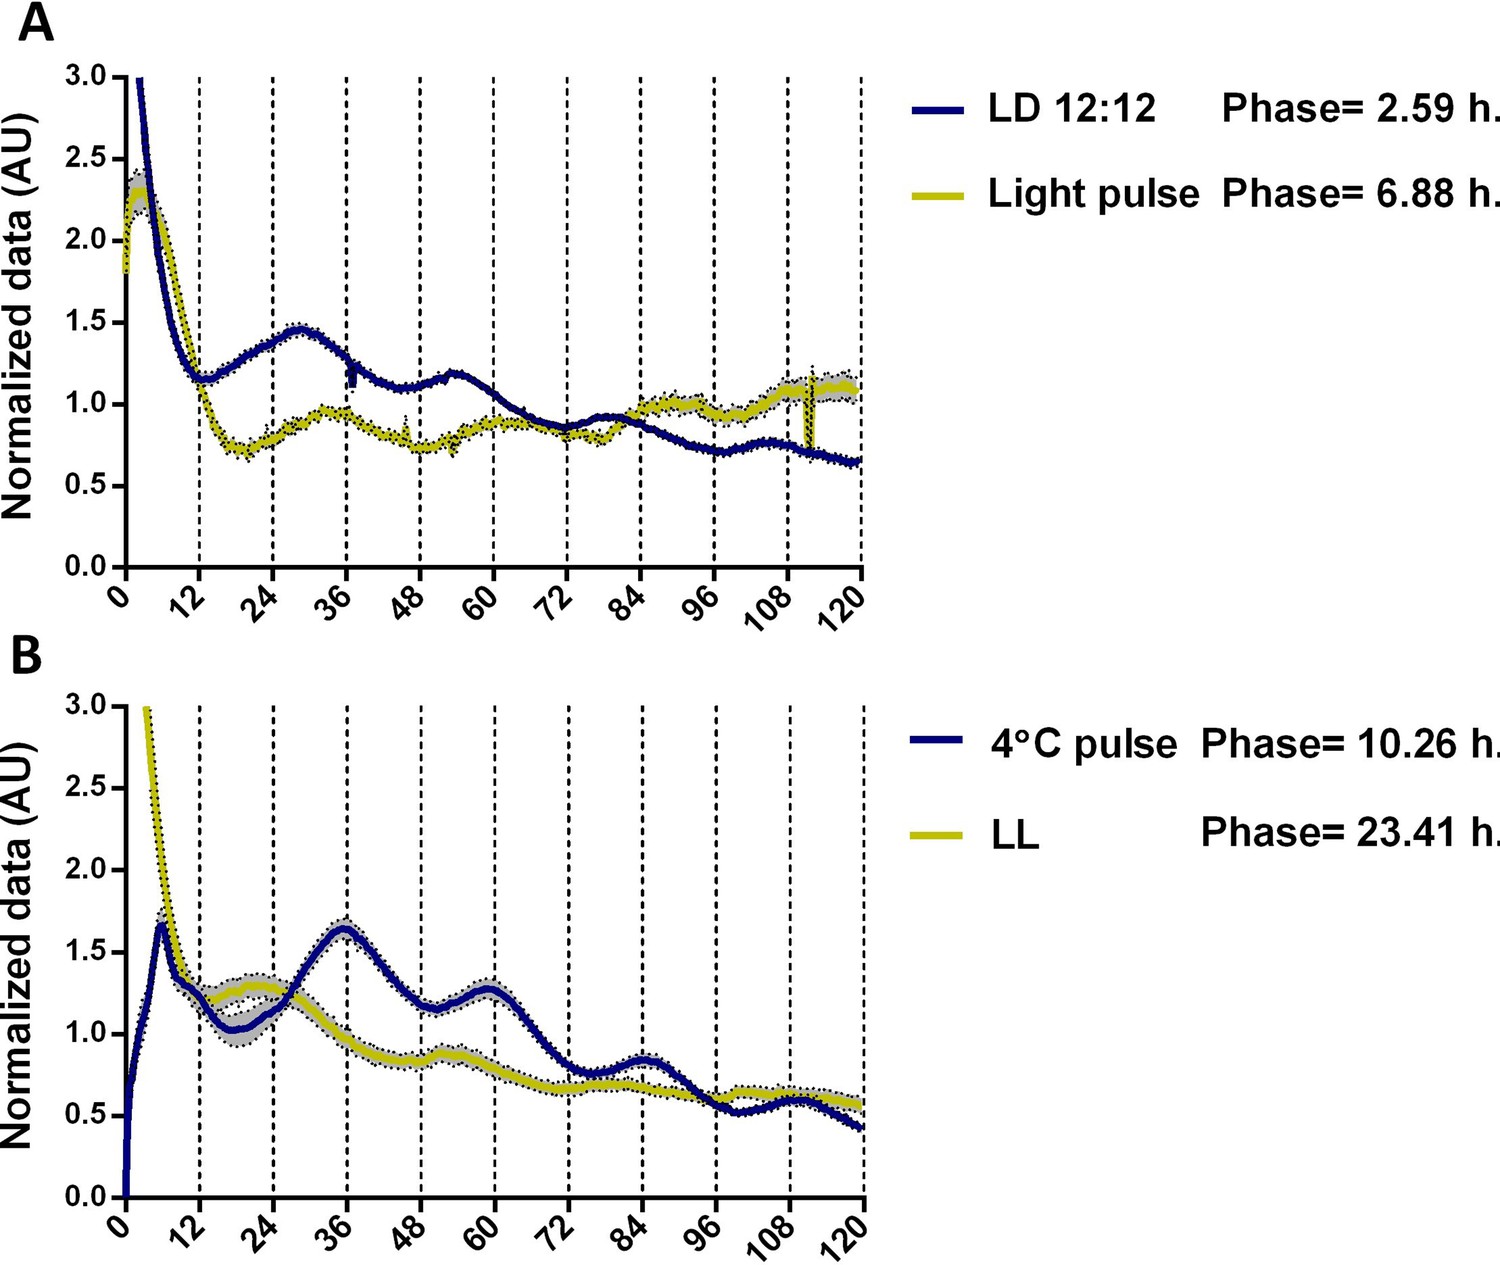
A phase shift of TaFRQLUC oscillations after different light entrainment and reset conditions.
(A) TaFRQLUC reporter strains (TaFRQLUC 2 and 4) were subjected to LD 12:12 hr 25°C entrainment (blue) or received a 20 min light pulse (yellow), which was given after 1 day in DD, before going into DD for LUC monitoring. A 4.29 hr phase shift is observed after an LP. (B) TaFRQLUC strains were kept 3 days in LL (yellow), before start monitoring, or received a 4°C temperature pulse in DD for 6 hr (blue) previous to transferring to LUC monitoring. A 10.85 hr phase shift is observed after the 4°C temperature pulse compared to the LL reset. Data were normalized to mean. An average of two biological replicates and 6–12 technical replicates is presented (SEM is represented with the gray area). Phase shifts were calculated using the BioDare platform using the first peak and circadian unit.
Figure 1—figure supplement 5
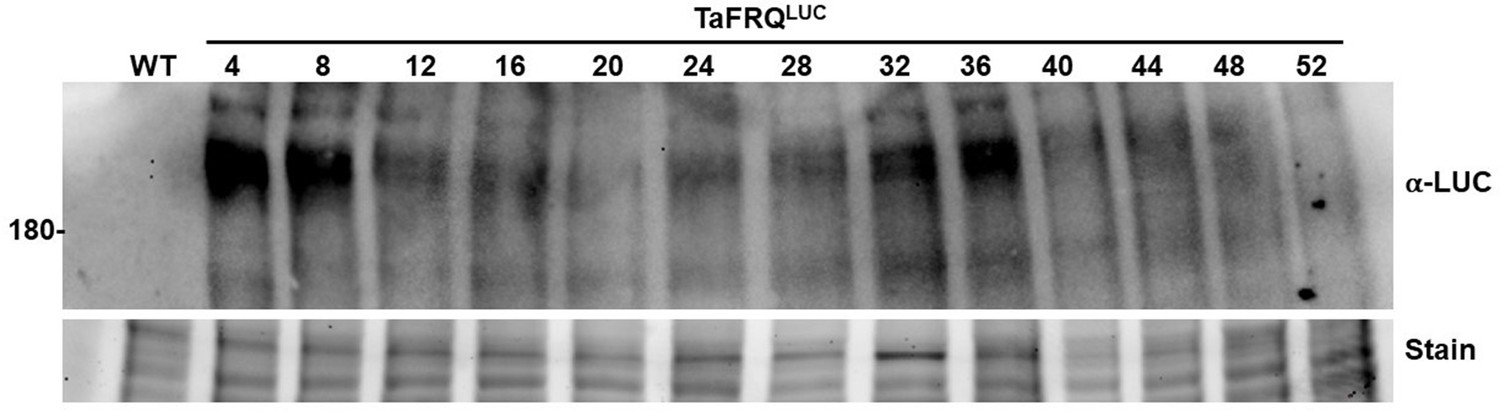
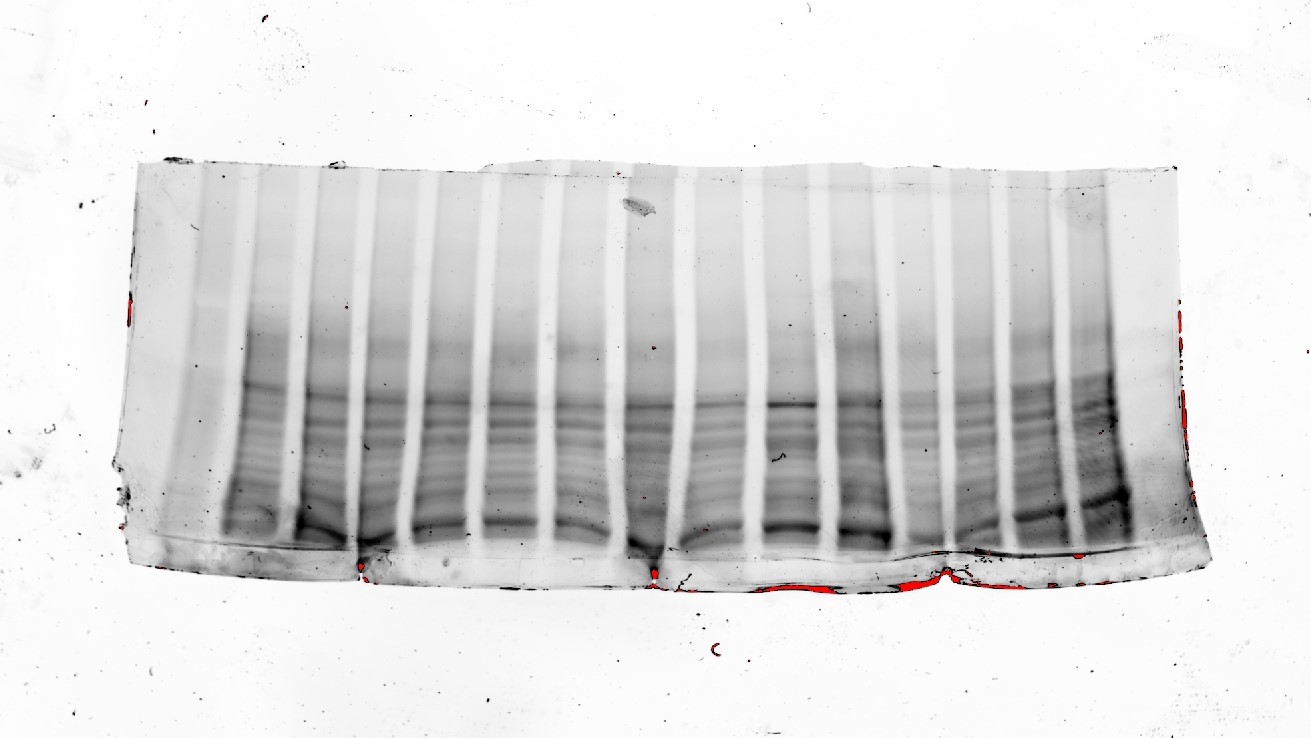
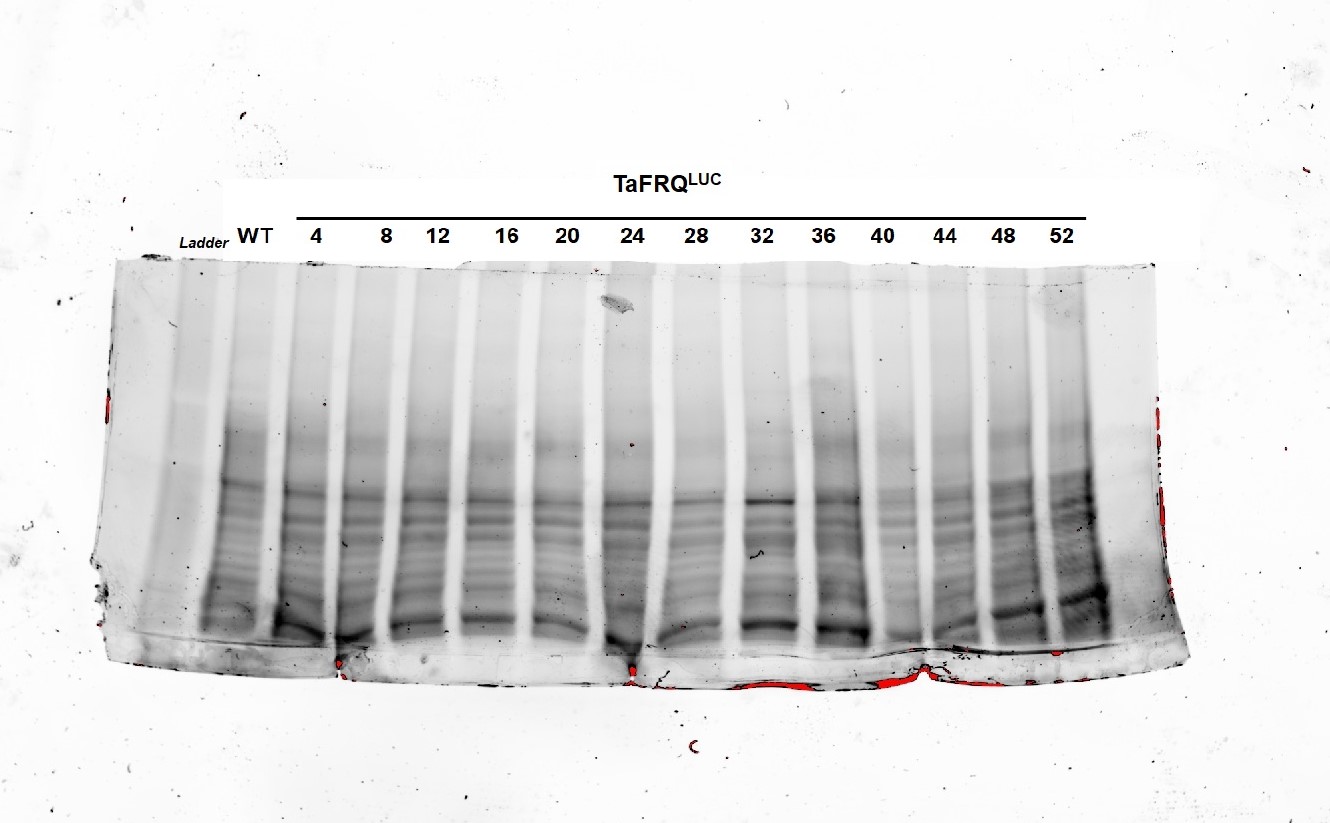
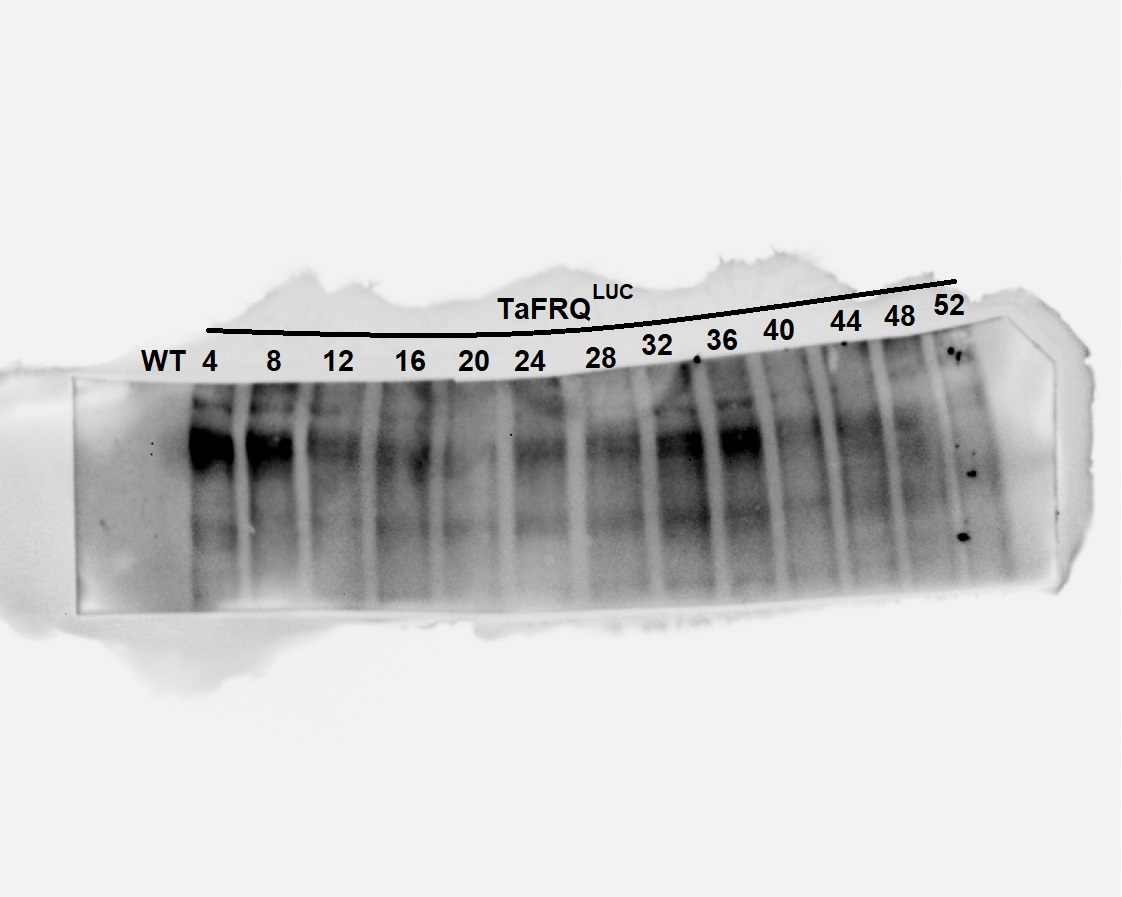
Oscillations of TaFRQLUC protein levels in DD during a 52 hr time course.
Reporter strains were inoculated in GYEC+ peas and received a strong light pulse, equivalent to an LL to DD transfer, to reset the clock and boost oscillations. Samples were taken every 4 hr in DD at 22°C.
-
Figure 1—figure supplement 5—source data 1
Related to Figure 1—figure supplement 5 (top).
Original protein gel of TaFRQLUC time course.
- https://cdn.elifesciences.org/articles/71358/elife-71358-fig1-figsupp5-data1-v2.jpg
-
Figure 1—figure supplement 5—source data 2
Related to Figure 1—figure supplement 5 (top).
Labeled protein gel of TaFRQLUC time course.
- https://cdn.elifesciences.org/articles/71358/elife-71358-fig1-figsupp5-data2-v2.jpg
-
Figure 1—figure supplement 5—source data 3
Related to Figure 1—figure supplement 5 (top).
Original Western blot of TaFRQLUC time course.
- https://cdn.elifesciences.org/articles/71358/elife-71358-fig1-figsupp5-data3-v2.tif
-
Figure 1—figure supplement 5—source data 4
Related to Figure 1—figure supplement 5 (top).
Labeled Western blot of TaFRQLUC time course.
- https://cdn.elifesciences.org/articles/71358/elife-71358-fig1-figsupp5-data4-v2.jpg
Figure 1—figure supplement 6
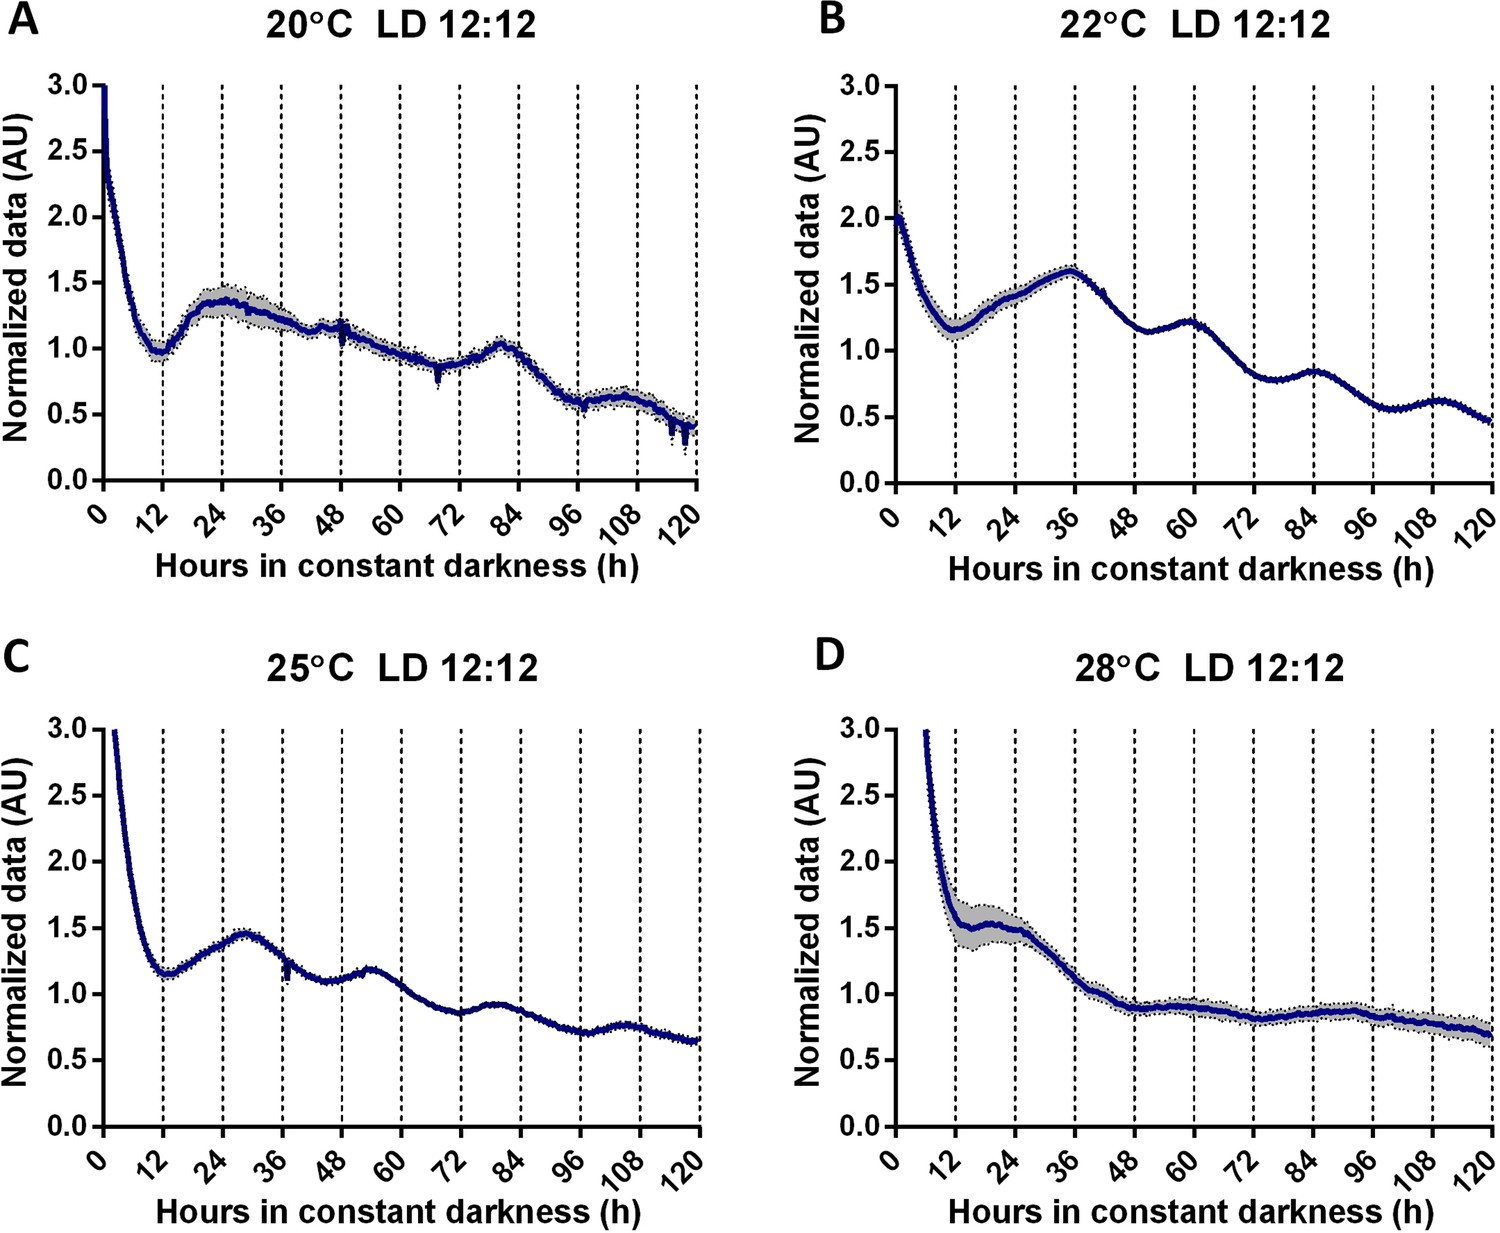
TaFRQLUC oscillations observed at different temperatures demonstrate temperature compensation in T. atroviride.
(A–D) TaFRQLUC reporter strains were entrained for 3 days under LD 12:12 hr cycles at 20, 22, 25, and 28°C, respectively, and transferred to DD to the indicated temperatures. TaFRQLUC strains display low-amplitude oscillations at 20°C, robust oscillations at 22 and 25°C, and no oscillations at 28°C. In all experiments, LUC activity was monitored under DD at the given temperature for 5 days. GYEC+ peas culture media was used in all experiments. Data were normalized to mean. The data correspond to an average of two biological replicates and eight technical replicates (SEM is represented with the gray area).
Figure 1—figure supplement 7
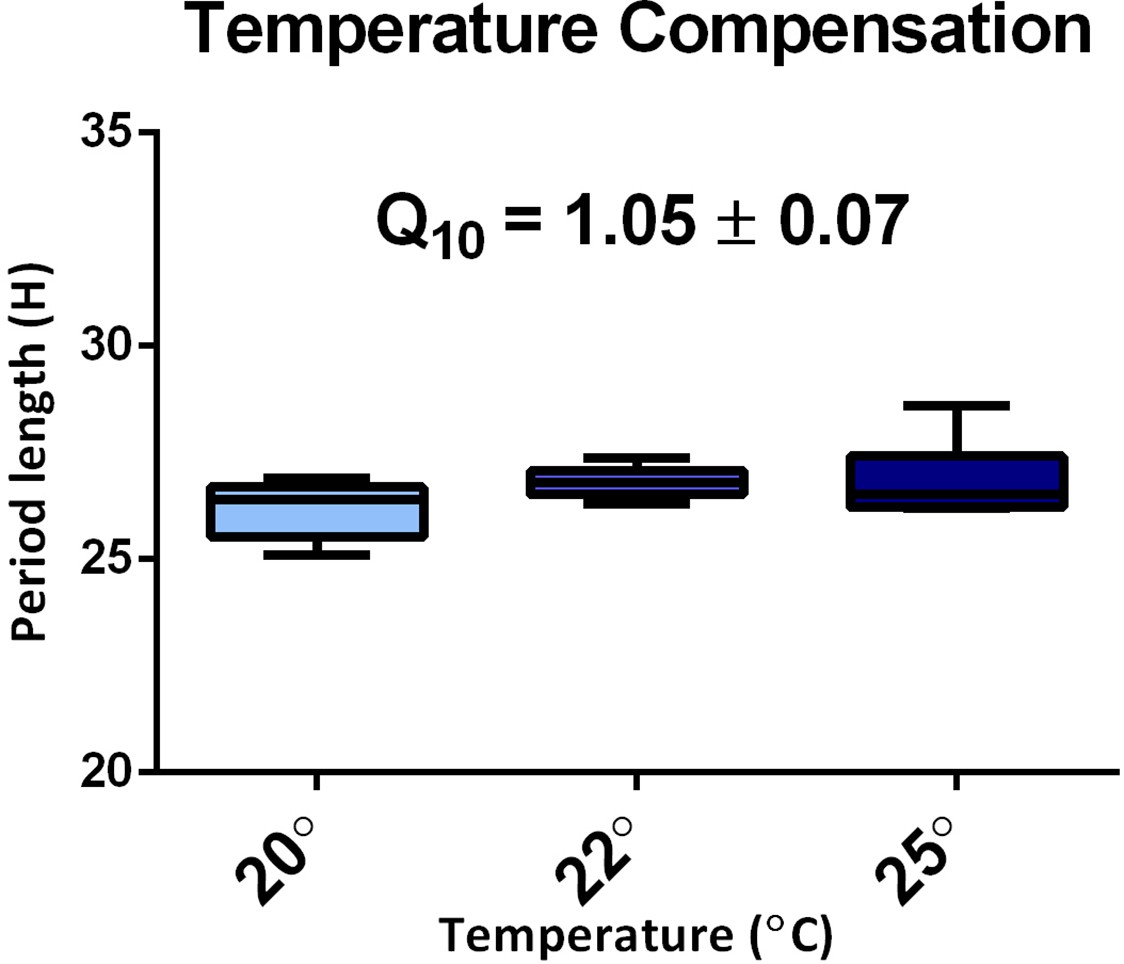
Temperature compensation in TaFRQLUC.
The average period of the two TaFRQLUC strains for each experimental condition (n = 3 for each strain). The mean Q10 value obtained for 20–25°C is presented.
Figure 1—figure supplement 8
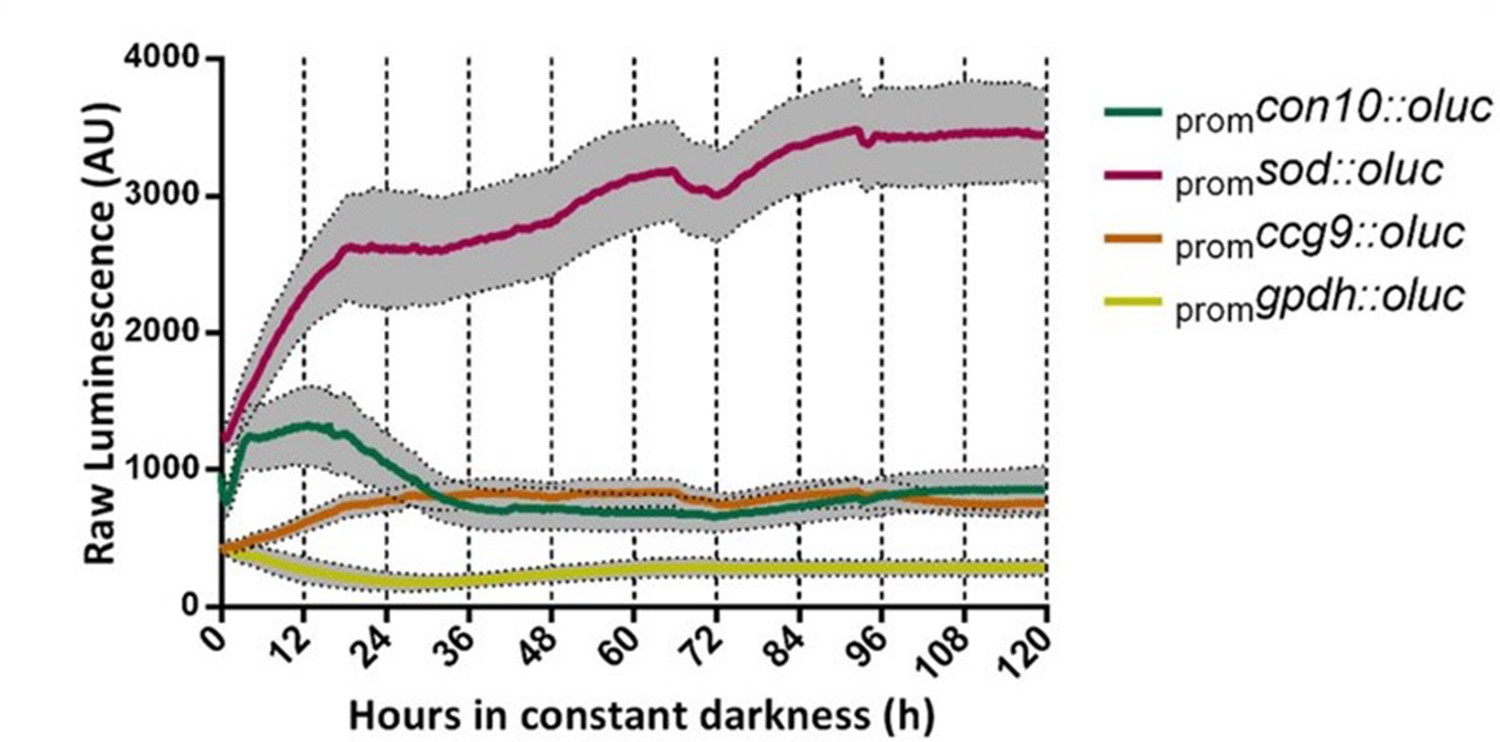
Evaluation of transcriptional luciferase reporters in T. atroviride.
(A) Selected promoters from T. atroviride do not lead to luc rhythmic expression in DD. Each transcriptional reporter strain was entrained for 3 days under LD (12:12 hr) conditions at 25°C in GYEC +peas culture media. After that, LUC activity was monitored under DD at 25°C for 5 days (SEM is represented with the gray area).
Figure 2 with 4 supplements
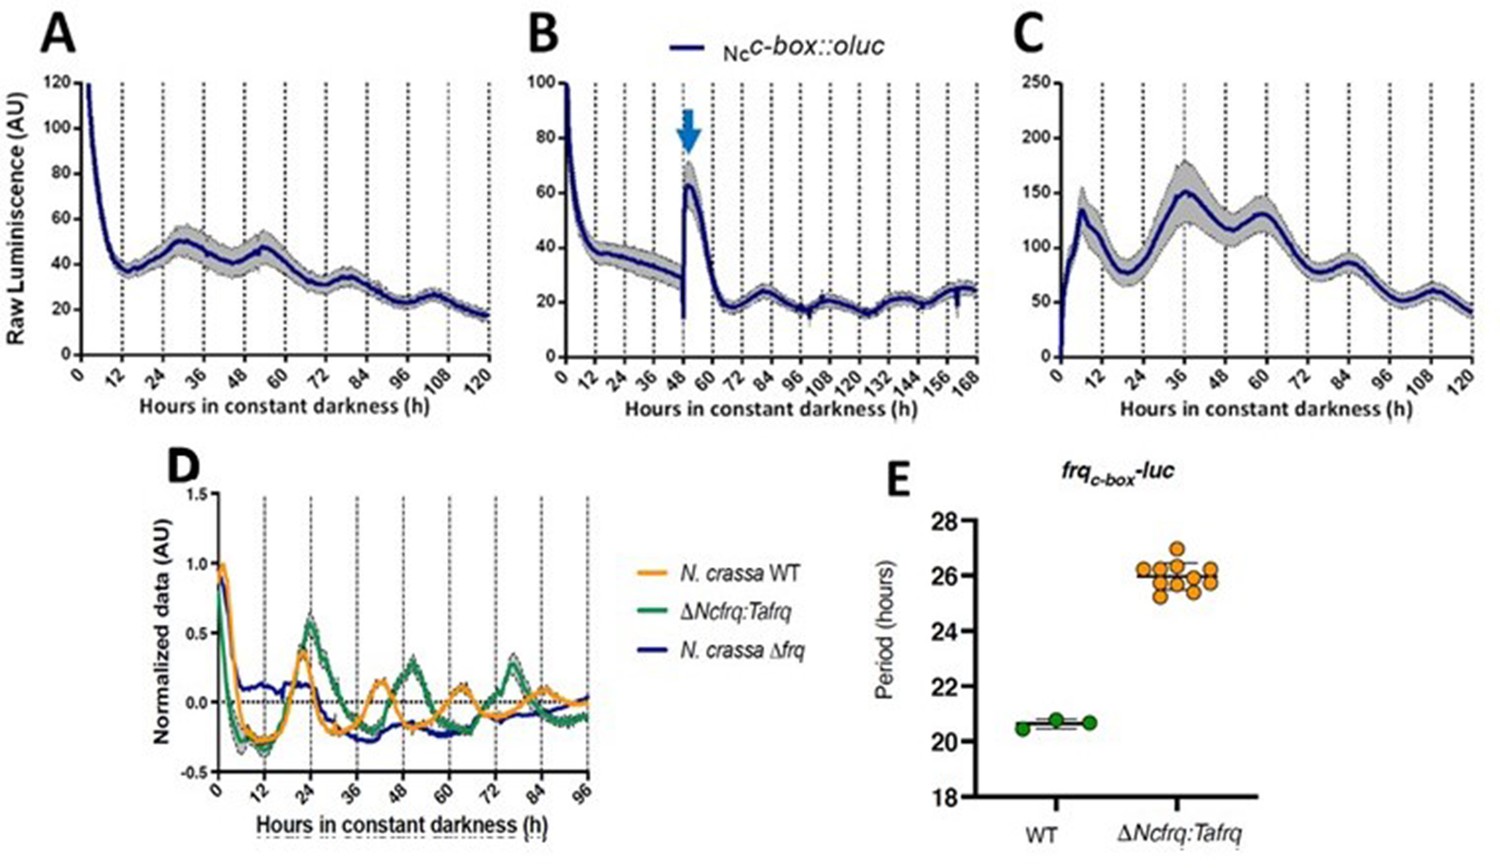
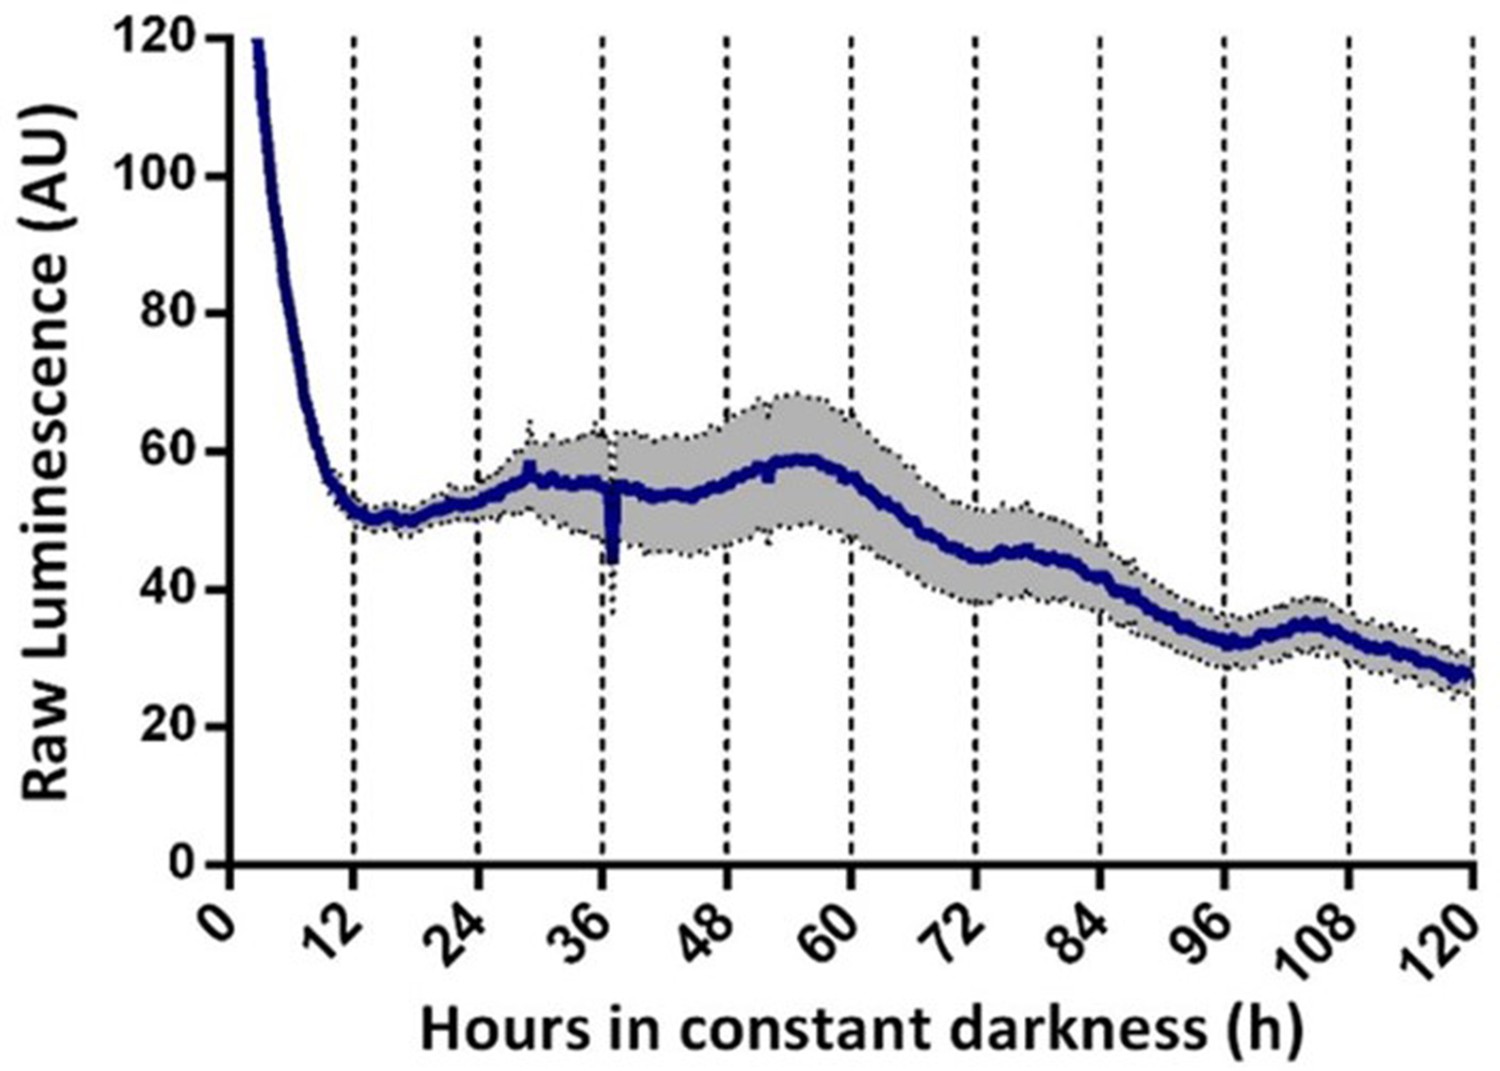
Functional conservation of circadian clock components between T. atroviride and N. crassa.
(A, B) Ncc-box-luc reporter strains were entrained for 3 days under LD (12:12 hr) cycles at 25°C and then transferred to DD where they were monitored unperturbed (A), or examined after a discrete light pulse (blue arrow), which produces a perceivable phase shift (B). (C) Strains were grown for 48 hr in LL and then transferred to DD, where a 4°C temperature treatment for 6 hr was applied. Then bioluminescence was monitored under constant darkness and 25°C. GYEC+ peas culture media was used in all cases. Raw data is presented with mean values of two biological replicates with three technical replicates each (SEM is represented with the gray area). (D, E) The expression of tafrq in N. crassa is able to restore circadian oscillation of a strain lacking its endogenous frq. The use of the transcriptional reporter frqc-box-luc reveals the presence of circadian rhythms in luciferase in the Δfrq::tafrq strain where Trichoderma FRQ was expressed. These oscillations have a longer period than WT N. crassa. Period determination was performed using BioDare 2.0, Linear Det, FFT-NLLS algorithm. A significant difference in period was found between WT N. crassa strain and the strain carrying T. atroviride FRQ (Mann–Whitney test, p-value=0.0055). Period ± SD. frqc-box-luc: WT: 20.6 ± 0,2; ΔNcfrq::tafrq: 25.9 ± 0.5. Source data can be found in Figure 2—source data 1.
-
Figure 2—source data 1
Source data of bioluminescence for each graph is provided as an .xlsx file.
Data is organized in individual sheets following the same order as in Figure 2.
- https://cdn.elifesciences.org/articles/71358/elife-71358-fig2-data1-v2.xlsx
Figure 2—figure supplement 1
Evaluation of Ncc-box-luc luciferase reporters in T. atroviride.
(A) Oscillations of Ncc-box-luc in T. atroviride in GYEC culture media after 3 days at LD 12:12 hr cycle entrainment. Raw data and mean values of two biological replicates with three technical replicates each are presented. Each transcriptional reporter strain was entrained for 3 days under LD (12:12 hr) conditions at 25°C in GYEC+ peas culture media. After that, LUC activity was monitored under DD at 25°C for 5 days (SEM is represented with the gray area).
Figure 2—figure supplement 2
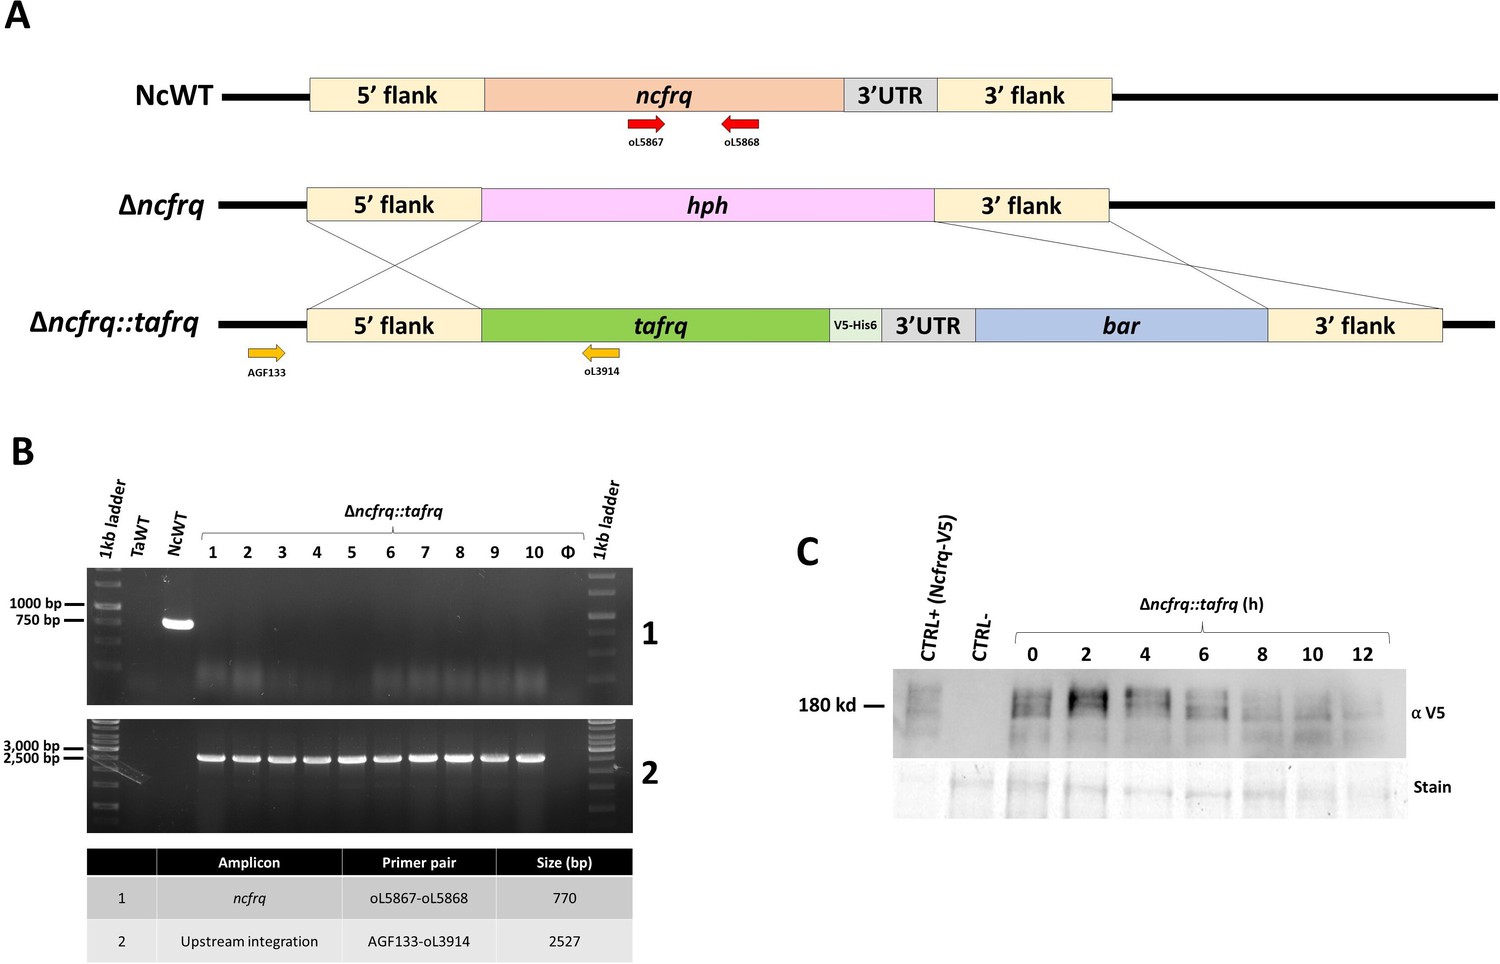
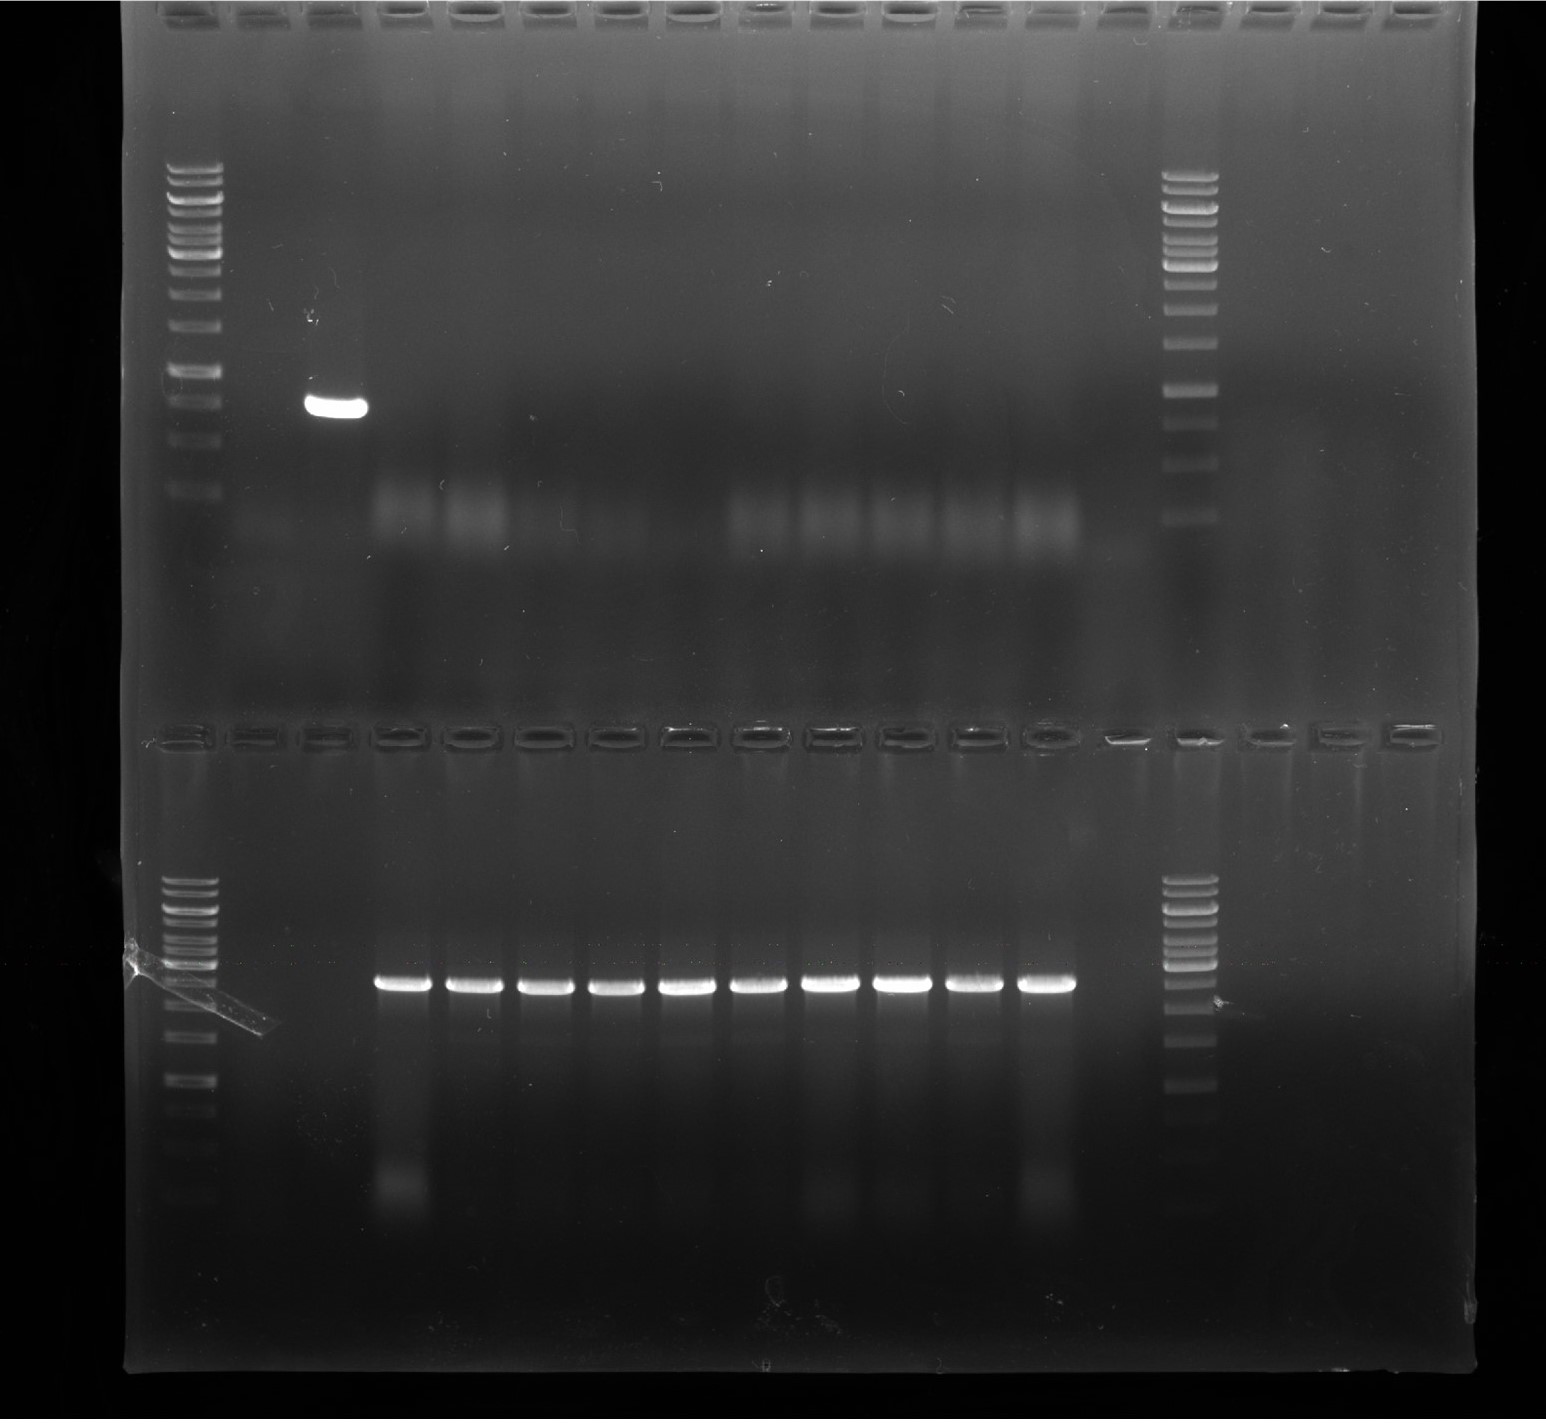
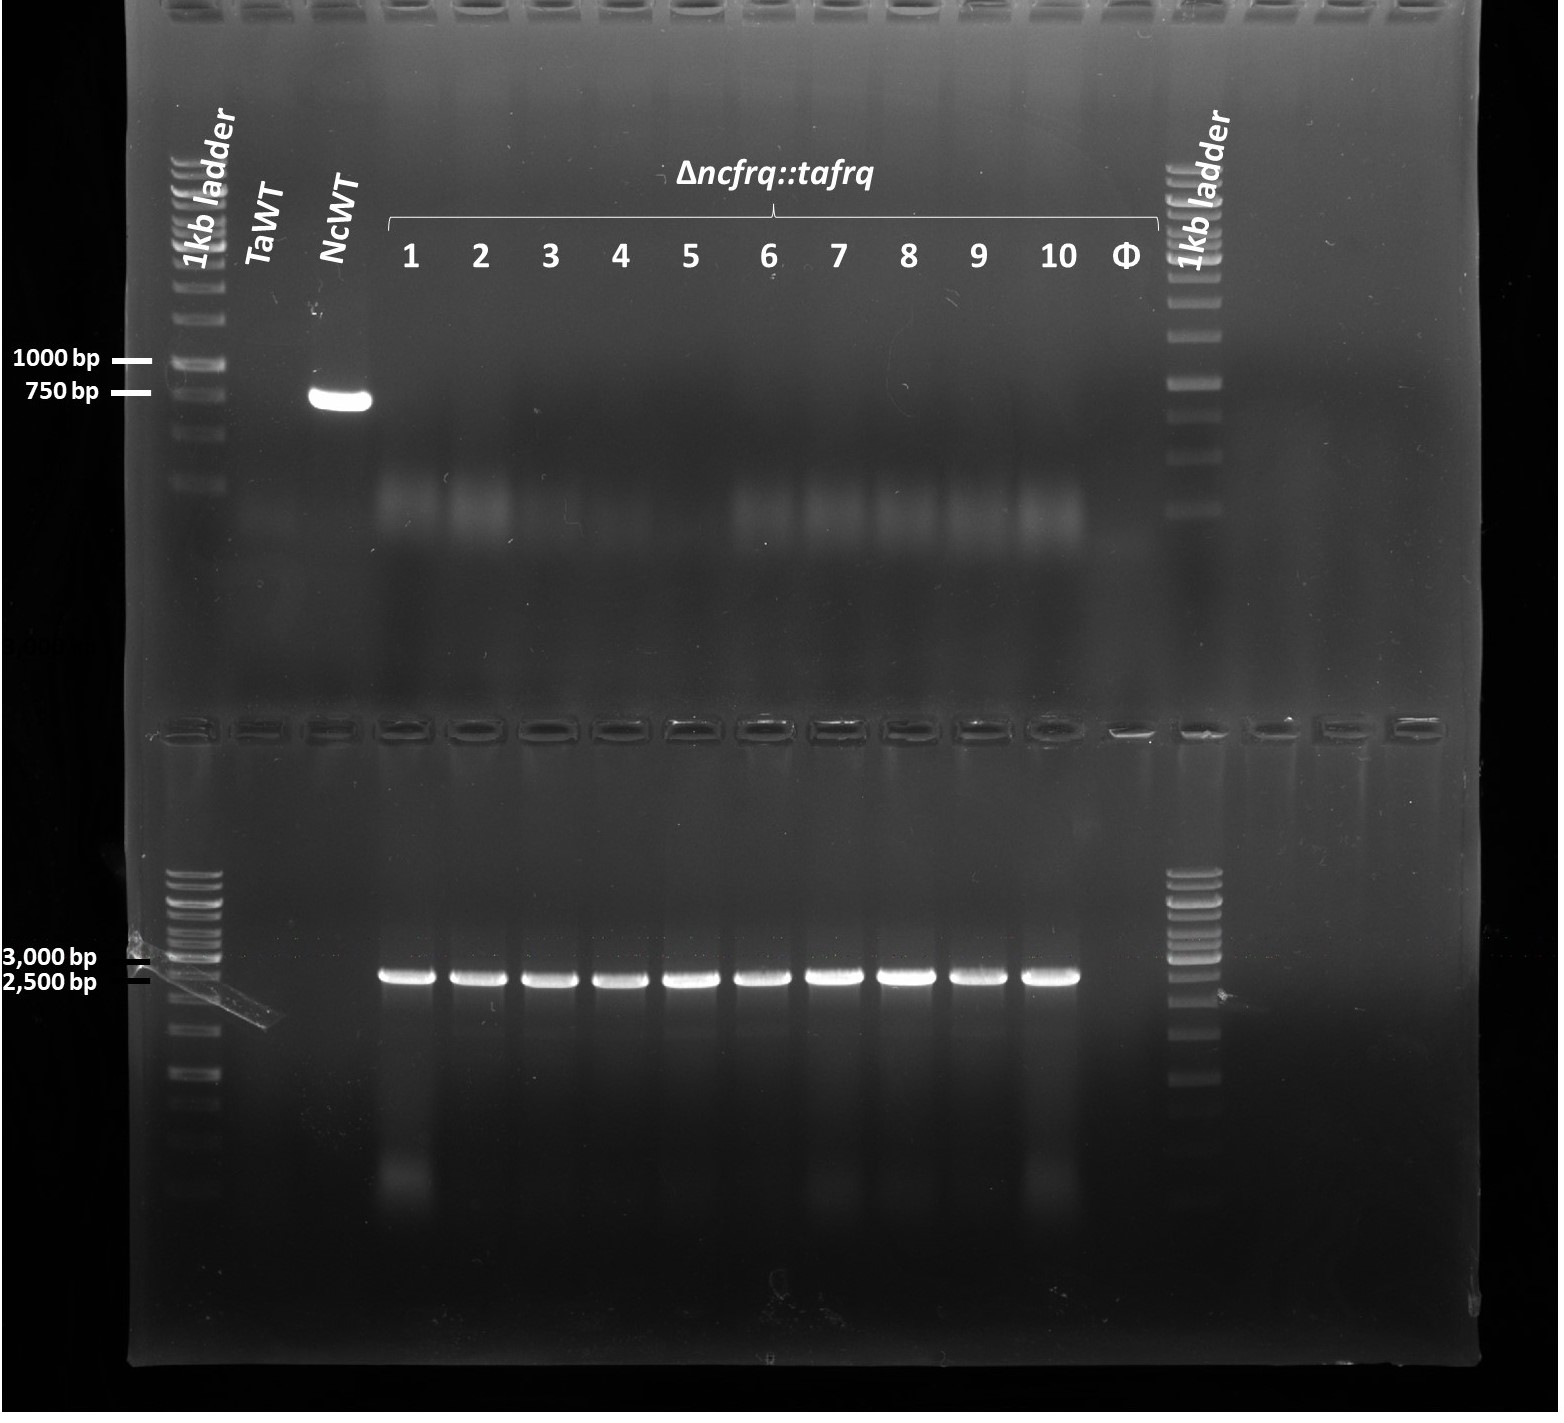
Generation of Δncfrq::tafrq strains in N. crassa.
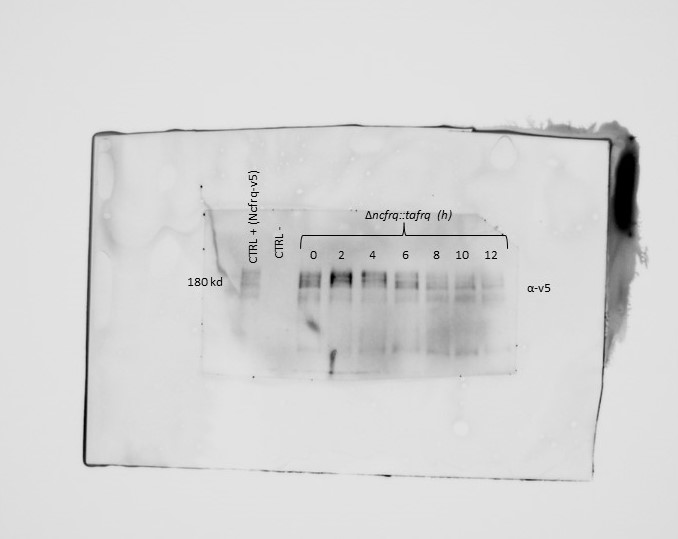
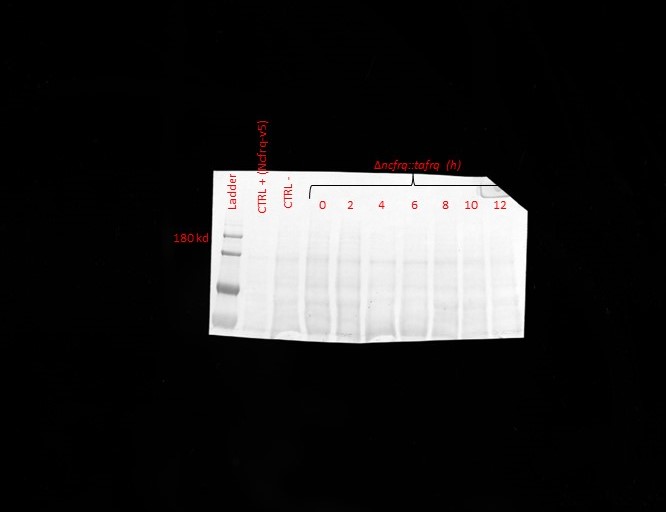
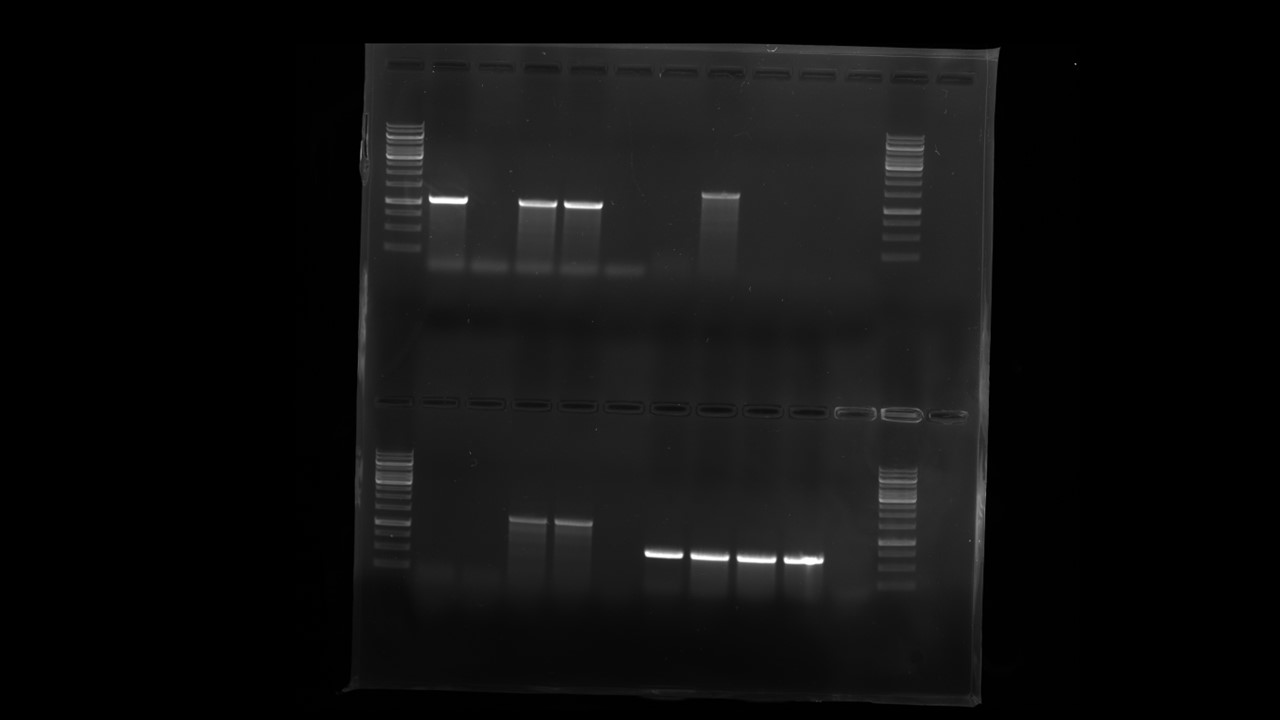
(A) Representation of the homologous recombination strategy employed to generate the Δncfrq::tafrq strain through complementation of a Δncfrq strain with tafrq, including a V5 tag at its C-terminus. (B) Agarose gel electrophoresis images demonstrating the correct integration of the Δncfrq::tafrq cassette and absence of ncfrq after homokaryonization. (C) Western blot analysis of the time course performed for TaFRQ-V5 in N. crassa (upper panel). The lower Δncfrq::tafrq shows the Coomassie blue-stained blot for total protein levels. The right panel demonstrates the relative protein levels of TaFRQ-V5 over time (C+ = control N. crassa FRQV5).
-
Figure 2—figure supplement 2—source data 1
Related to Figure 2—figure supplement 2B.
Original agarose gel of Δncfrq::tafrq diagnostic PCRs.
- https://cdn.elifesciences.org/articles/71358/elife-71358-fig2-figsupp2-data1-v2.jpg
-
Figure 2—figure supplement 2—source data 2
Related to Figure 2—figure supplement 2B.
Labeled agarose gel of Δncfrq::tafrq diagnostic PCRs.
- https://cdn.elifesciences.org/articles/71358/elife-71358-fig2-figsupp2-data2-v2.jpg
-
Figure 2—figure supplement 2—source data 3
Related to Figure 2—figure supplement 2C (top).
Original Δncfrq::tafrq Western blot anti-TaFRQ-V5 time course.
- https://cdn.elifesciences.org/articles/71358/elife-71358-fig2-figsupp2-data3-v2.tif
-
Figure 2—figure supplement 2—source data 4
Related to Figure 2—figure supplement 2C (top).
Labeled Δncfrq::tafrq Western blot anti-TaFRQ-V5 time course.
- https://cdn.elifesciences.org/articles/71358/elife-71358-fig2-figsupp2-data4-v2.jpg
-
Figure 2—figure supplement 2—source data 5
Related to Figure 2—figure supplement 2C (bottom).
Original Δncfrq::tafrq stained gel TaFRQ-V5 time course.
- https://cdn.elifesciences.org/articles/71358/elife-71358-fig2-figsupp2-data5-v2.tif
-
Figure 2—figure supplement 2—source data 6
Related to Figure 2—figure supplement 2C (bottom).
Labelled Δncfrq::tafrq stained gel TaFRQ-V5 time course.
- https://cdn.elifesciences.org/articles/71358/elife-71358-fig2-figsupp2-data6-v2.jpg
Figure 2—figure supplement 3
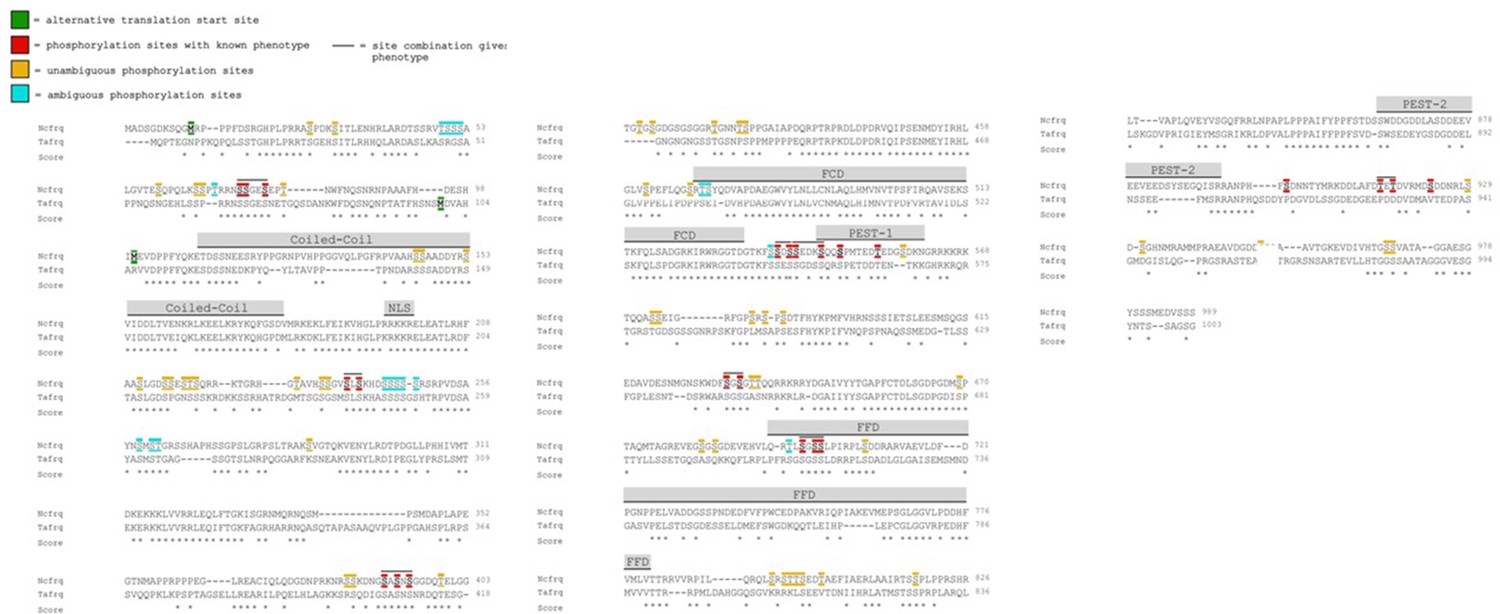
FRQ protein alignment between N. crassa and T. atroviride.
EMBOSS needle pairwise sequence alignment (Needleman–Wunsch algorithm). Translation start sites and phosphorylation sites, the latter identified and evaluated by Baker et al., 2009, are highlighted in Ncfrq, permitting comparison with corresponding sites in Tafrq.
Figure 2—figure supplement 4
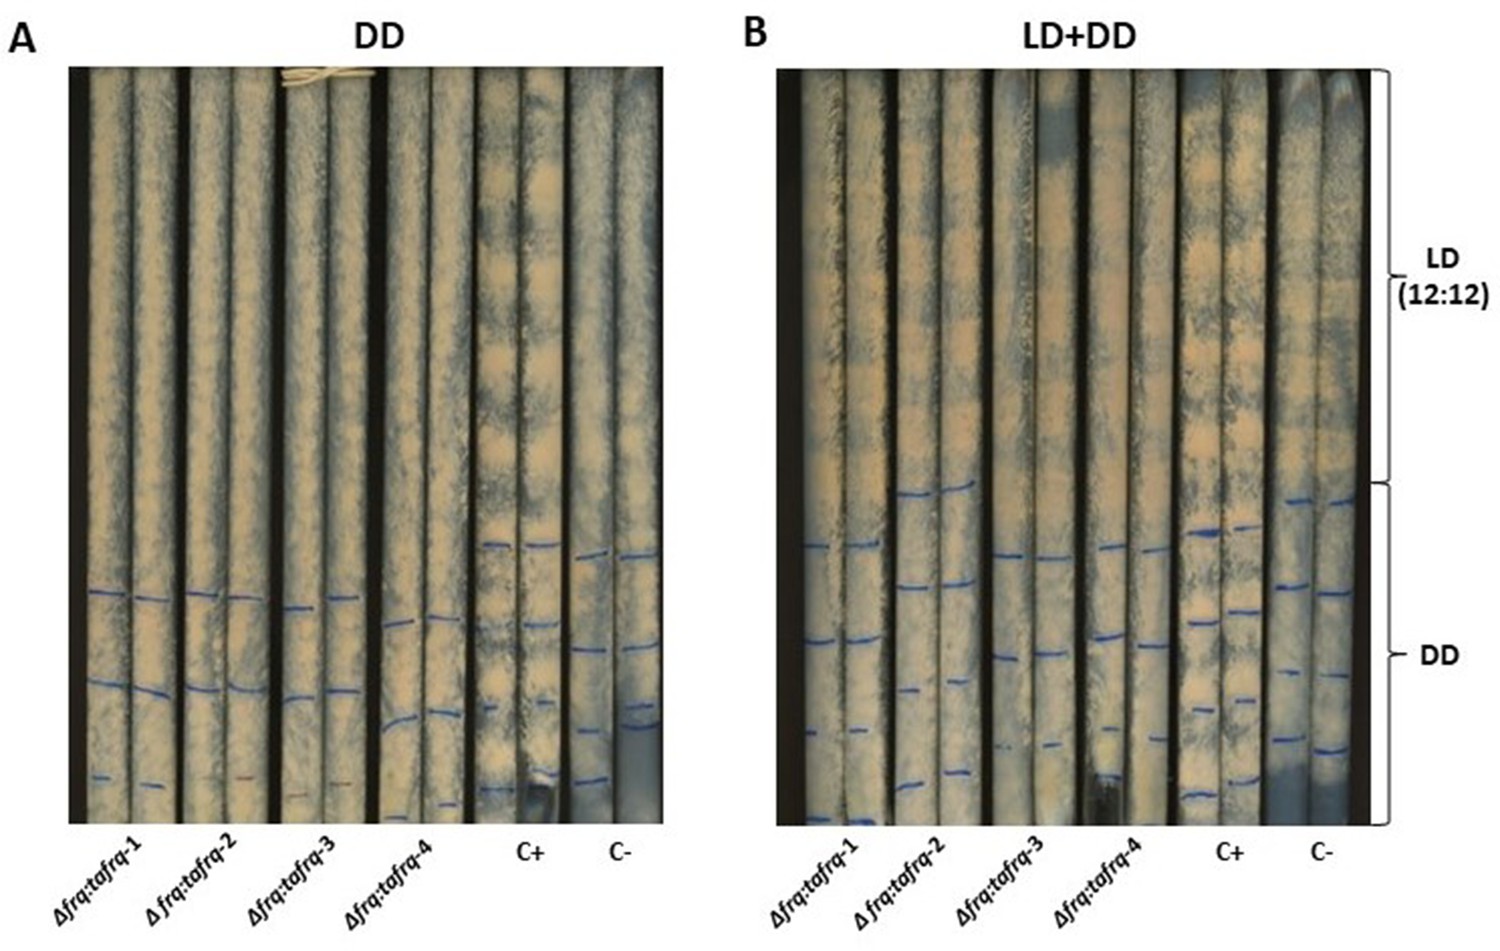
Race tube analysis of four Δncfrq::tafrq strains to evaluate clock-controlled rhythmic conidiation.
The four unique Δfrq::tafrq strains were grown alongside rhythmic (C+) and arrhythmic (C-) Neurospora strains (two race tubes each), as positive and negative controls, respectively. All strains were grown in race tubes containing minimal media for 8 days in (A) in constant darkness. (B) LD (12:12) conditions for 5 days followed by DD conditions for the remainder. The blue lines were marked every 24 hr after 5 days to enable calculation of period, not observed as conidiation output in our T. atroviride mutant strains.
Figure 3 with 4 supplements
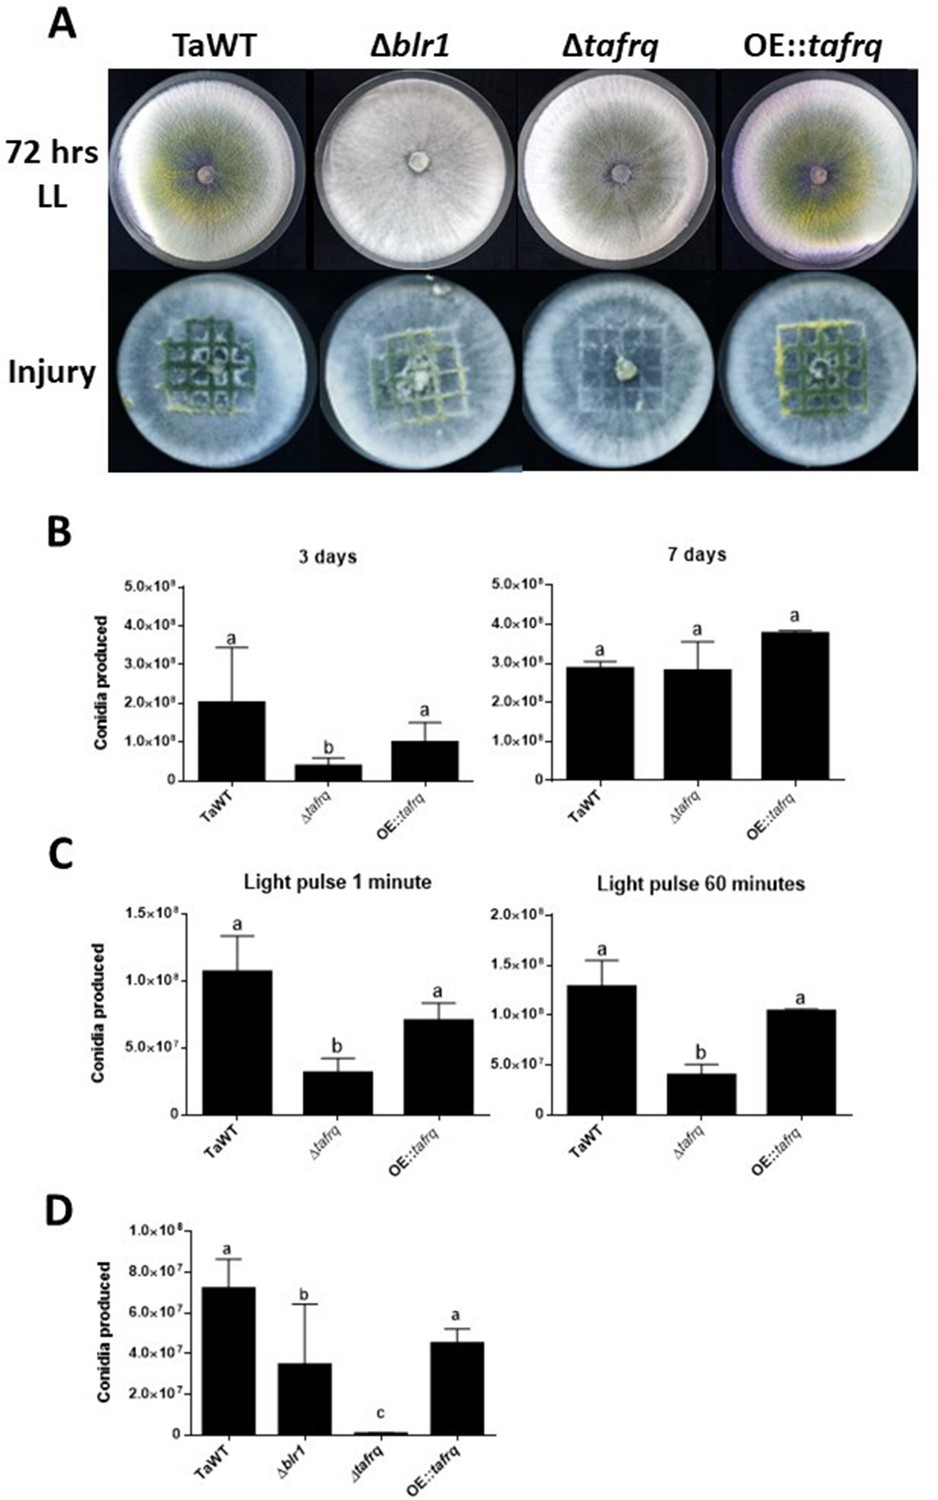
Effect of light and injury-induced in conidiation in clock component mutant strains of T. atroviride.
TaWT, Δblr1, Δtafrq, and OE::tafrq strains were grown in potato dextrose agar (PDA) at 25°C. (A) Sporulation was observed at 72 hr in LL, or after injury (mechanical damage) in DD conditions, as specified in ‘Materials and methods.’ (B) Conidia produced after 3 and 7 days of growth in LL. (C) Conidia production of Trichoderma’s strains after receiving a 1 and 60 min light pulse (LP). LP was applied to cultures previously grown for 36 hr in DD. (D) Conidia produced after mechanical damage. Strains were grown for 36 hr in DD, and injury was performed with a scalpel using a grid as reference. Later, damaged strains were kept in DD for 48 hr to allow conidia collection. Errors bars represent the mean ± SD of three biologicals for (B) and four for (C) replicates for each experiment. Different letters indicate significant differences based on Tukey’s test (p<0.05).
Figure 3—figure supplement 1
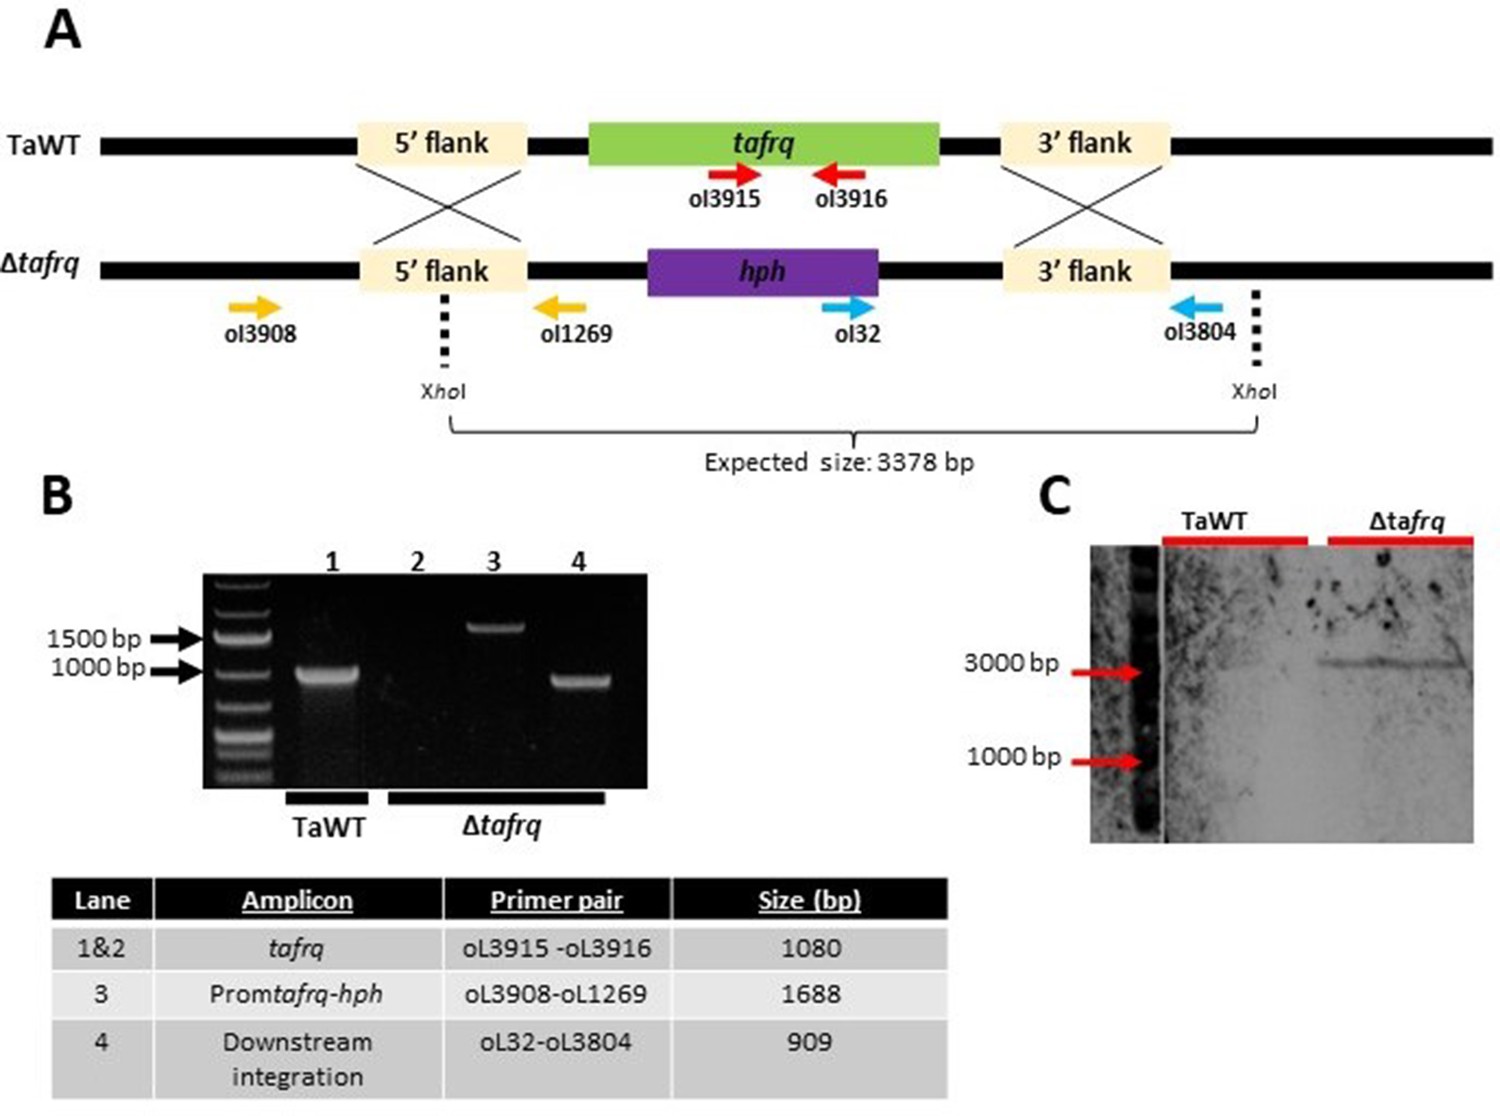
Generation of Δtafrq strain in T. atroviride.
(A) Schematic representation of the tafrq locus and the replacement with the hph cassette by homologous recombination. Horizontal arrows show primers used for diagnostic PCRs, indicating their relative position and orientation. XhoI restriction sites used for Southern blot (shown in C) are indicated. (B) Diagnostic PCR showing correct in locus integration of the hph replacement cassette. The table shows the expected PCR amplicon size of each depicted lane. (C) Southern blot analysis showing single-copy integration of the replacement cassette (shown in A). The hph amplicon was used as a probe. A 3378 bp signal was expected in Δtafrq as indicated in (A).
-
Figure 3—figure supplement 1—source data 1
Related to Figure 3—figure supplement 1B.
Original gel of Δtafrq diagnostic PCRs.
- https://cdn.elifesciences.org/articles/71358/elife-71358-fig3-figsupp1-data1-v2.jpg
-
Figure 3—figure supplement 1—source data 2
Related to Figure 3—figure supplement 1B.
Labeled gel of Δtafrq diagnostic PCRs.
- https://cdn.elifesciences.org/articles/71358/elife-71358-fig3-figsupp1-data2-v2.jpg
-
Figure 3—figure supplement 1—source data 3
Related to Figure 3—figure supplement 1C.
Original Southern blot of Δtafrq and TaWT.
- https://cdn.elifesciences.org/articles/71358/elife-71358-fig3-figsupp1-data3-v2.jpg
-
Figure 3—figure supplement 1—source data 4
Related to Figure 3—figure supplement 1C.
Labeled Southern blot of Δtafrq and TaWT.
- https://cdn.elifesciences.org/articles/71358/elife-71358-fig3-figsupp1-data4-v2.jpg
Figure 3—figure supplement 2
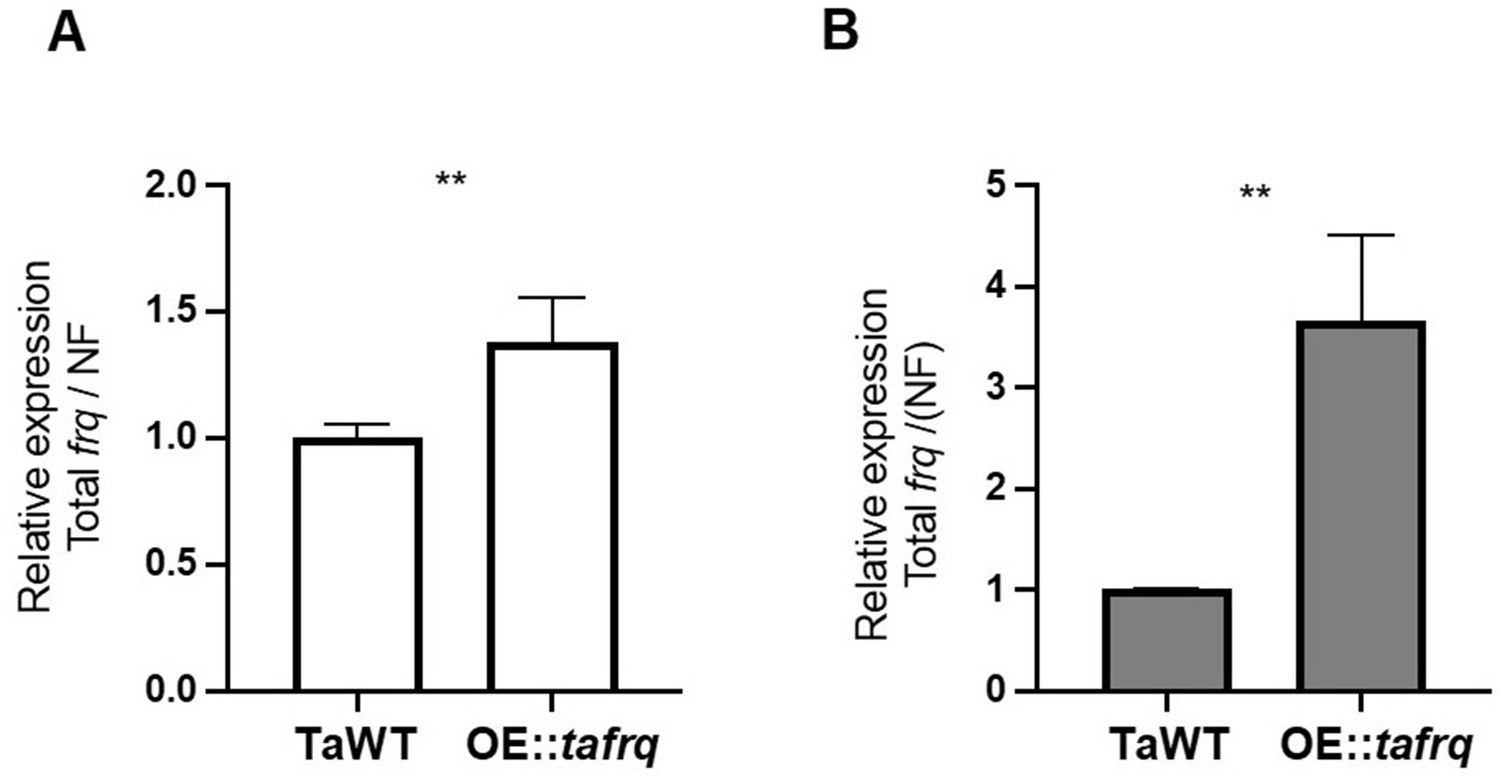
Expression profile of tafrq in TaWT and OE::tafrq strains.
Higher levels of frq RNA in OE::tafrq compared to WT strain are observed in LL culture conditions (A) and DD (B) for 48 hr. Mean and SD are plotted. Mann–Whitney test was performed between WT and OE::tafrq. Significant differences are indicated with asterisks (**p<0.05). Cytrate lyase and DNApolB genes were used as normalization factor (NF).
Figure 3—figure supplement 3
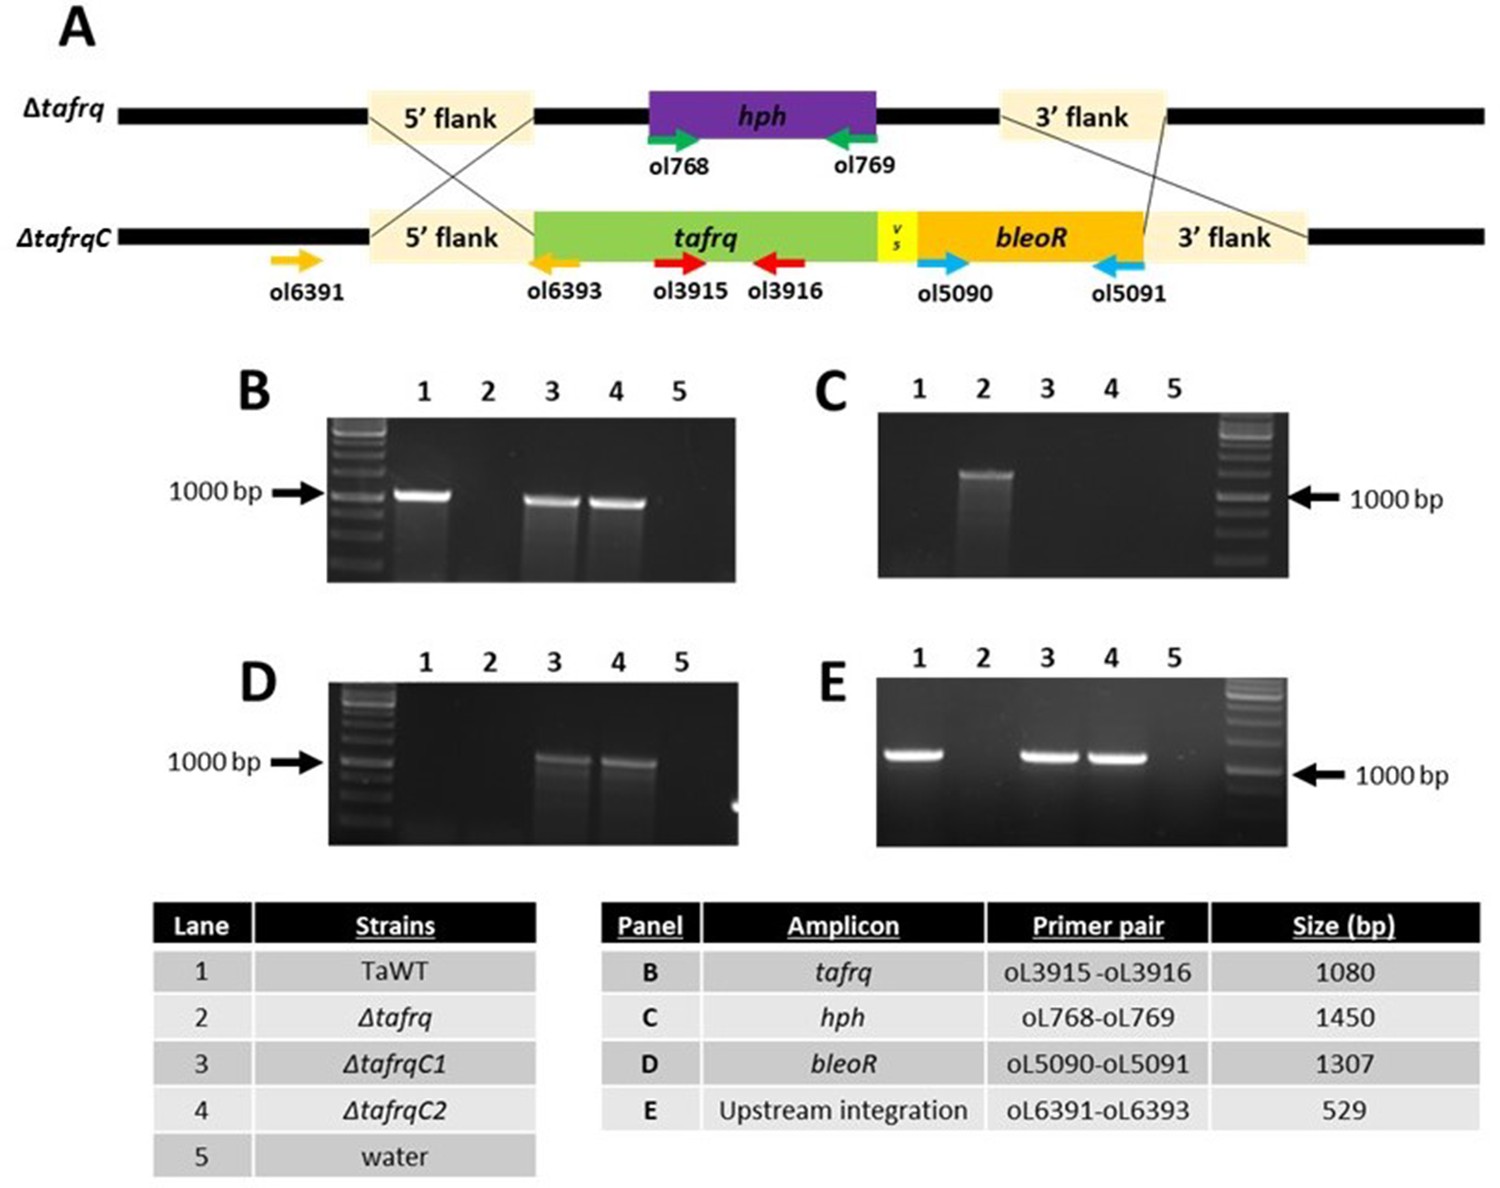
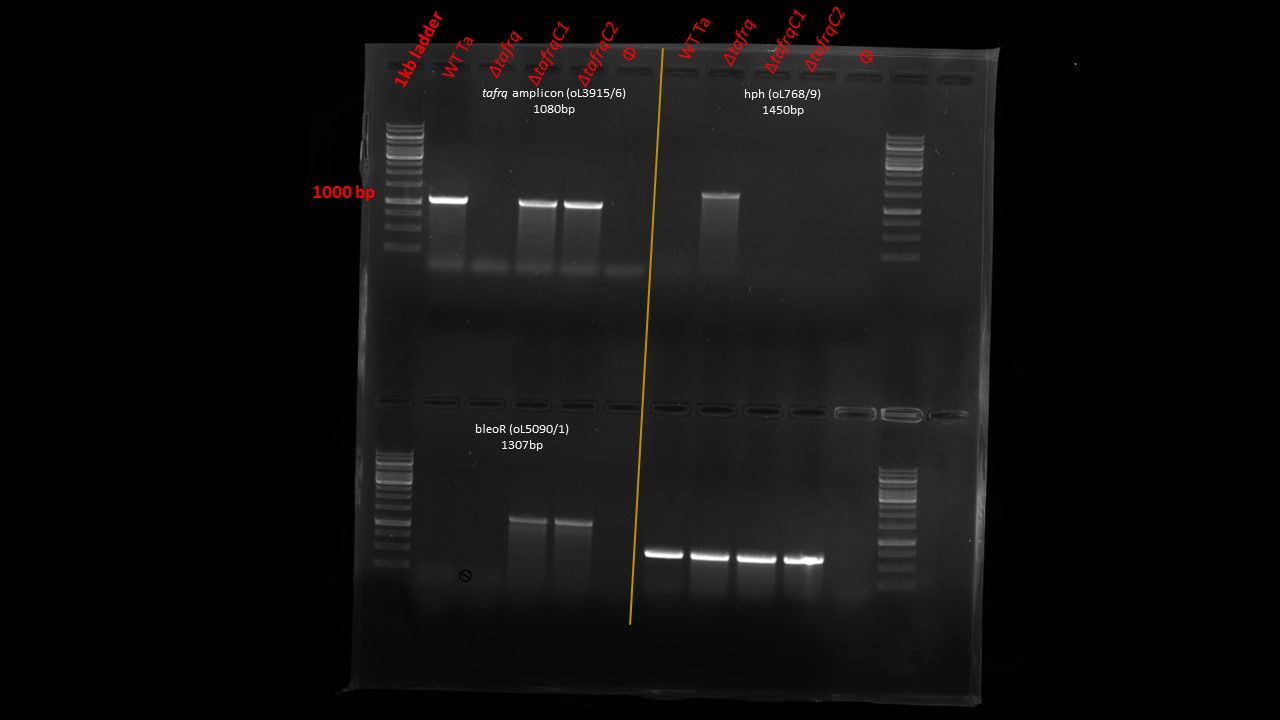
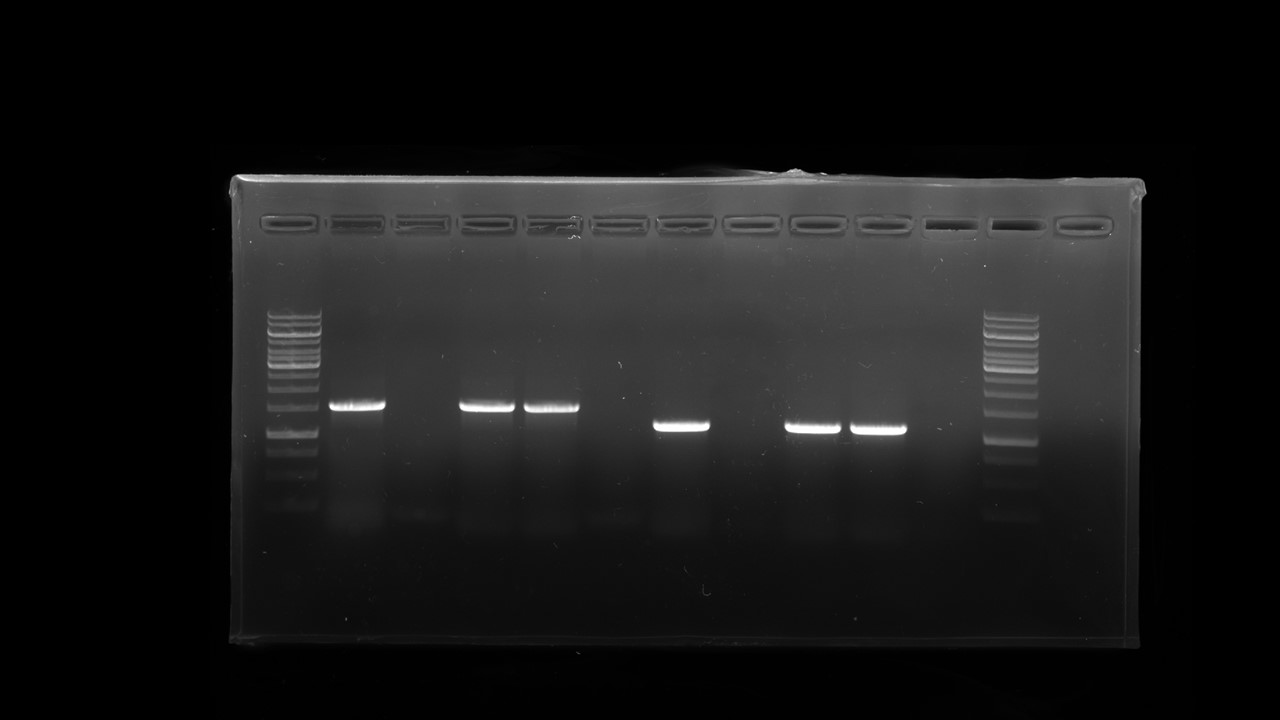
Δtafrq complementation.
(A) Representation of the Δtafrq locus and the complementation with tafrq using the bleoR cassette by homologous recombination. Arrows (horizontal) show primers used for diagnostic PCRs, indicating their relative position and orientation. (B–E) Diagnostic PCR showing tafrq (B), hph (C), and bleoR (D) absence/presence in the different strains used (WT, Δtafrq; and two independent ΔtafrqC1 and ΔtafrqC2 complemented strains) and the upstream integration of tafrq gene (E).
-
Figure 3—figure supplement 3—source data 1
Related to Figure 3—figure supplement 3B–D.
Original agarose gel of ∆ncfrq::tafrq diagnostic PCRs.
- https://cdn.elifesciences.org/articles/71358/elife-71358-fig3-figsupp3-data1-v2.jpg
-
Figure 3—figure supplement 3—source data 2
Related to Figure 3—figure supplement 3B–D.
Labeled agarose gel of ∆ncfrq::tafrq diagnostic PCRs.
- https://cdn.elifesciences.org/articles/71358/elife-71358-fig3-figsupp3-data2-v2.jpg
-
Figure 3—figure supplement 3—source data 3
Related to Figure 3—figure supplement 3E.
Original agarose gel of ∆ncfrq::tafrq diagnostic PCRs.
- https://cdn.elifesciences.org/articles/71358/elife-71358-fig3-figsupp3-data3-v2.jpg
-
Figure 3—figure supplement 3—source data 4
Related to Figure 3—figure supplement 3E.
Labeled agarose gel of ∆ncfrq::tafrq diagnostic PCRs.
- https://cdn.elifesciences.org/articles/71358/elife-71358-fig3-figsupp3-data4-v2.jpg
Figure 3—figure supplement 4
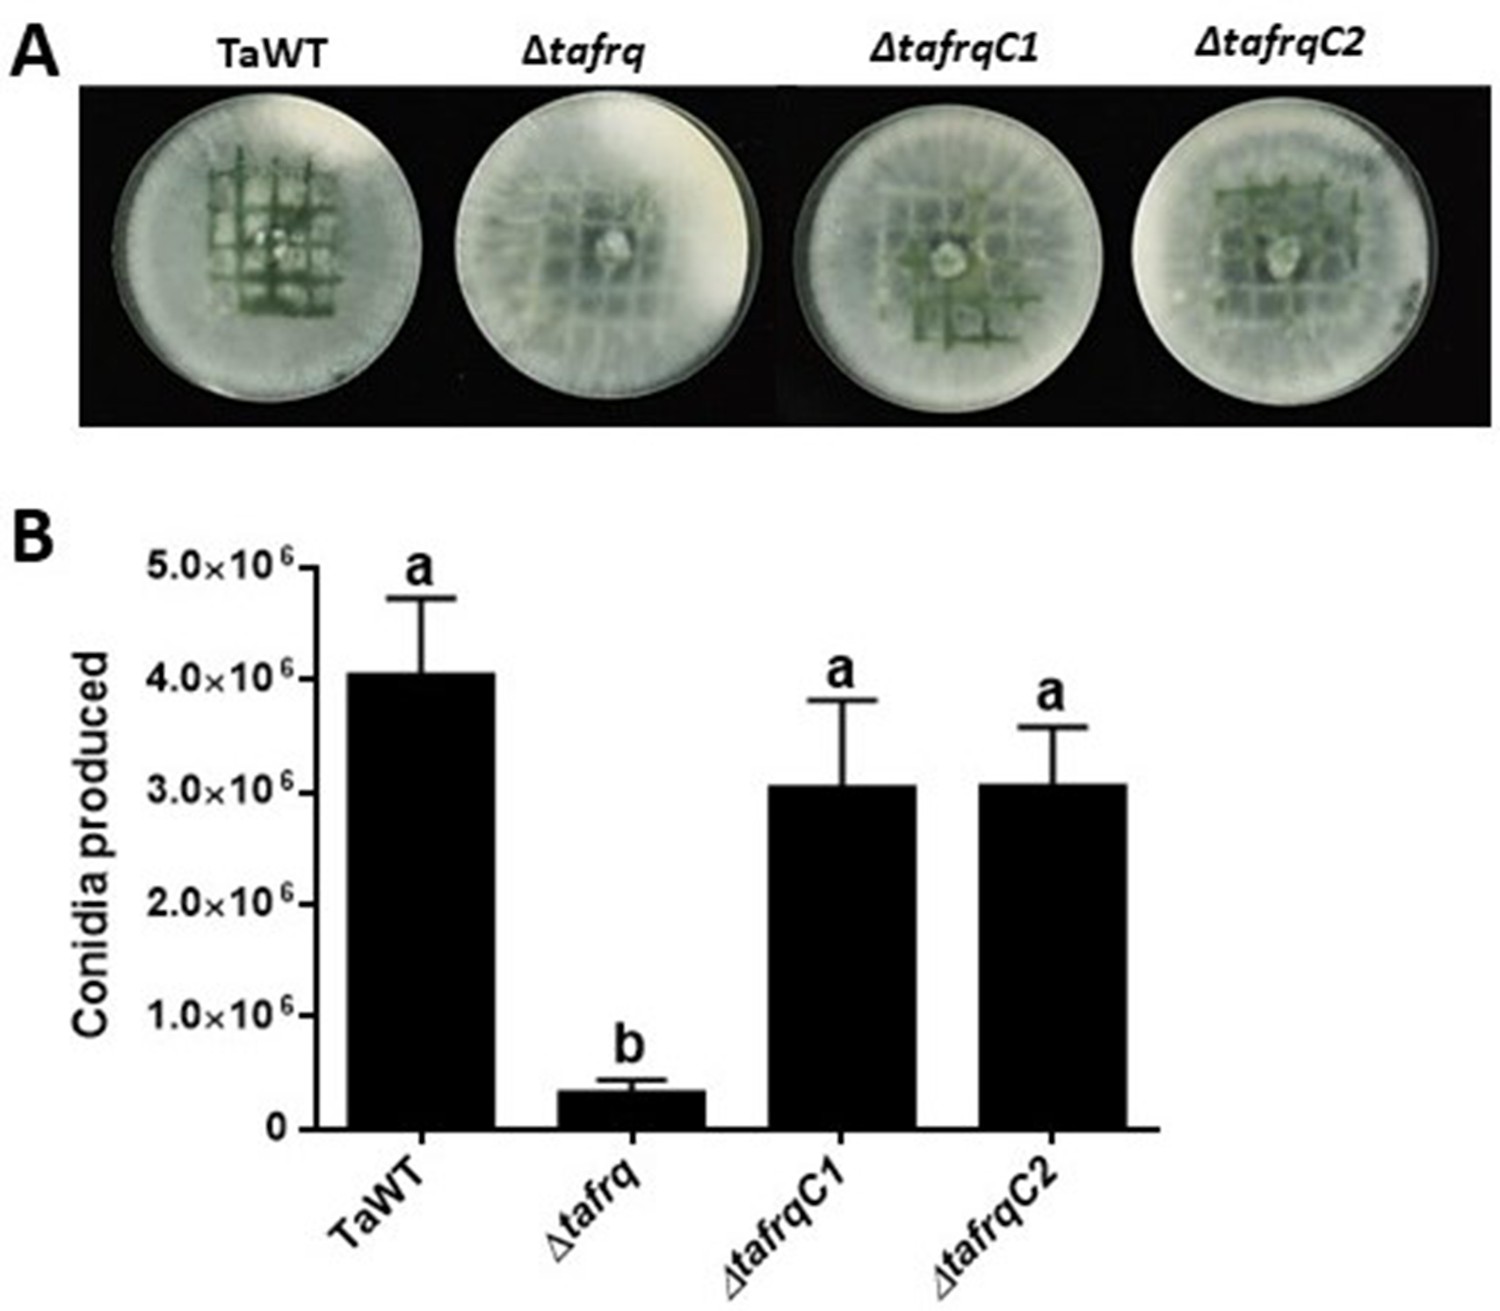
Injury-induced conidiation is recovered in Δtafrq-complemented strains.
Conidia produced by TaWT, Δtafrq, ΔtafrqC1, and ΔtafrqC2 strains after mechanical damage. Errors bars represent the mean ± SEM of two biological replicates with five replicates each. Different letters indicate significant differences based on Tukey’s test (p<0.05).
Figure 4 with 1 supplement
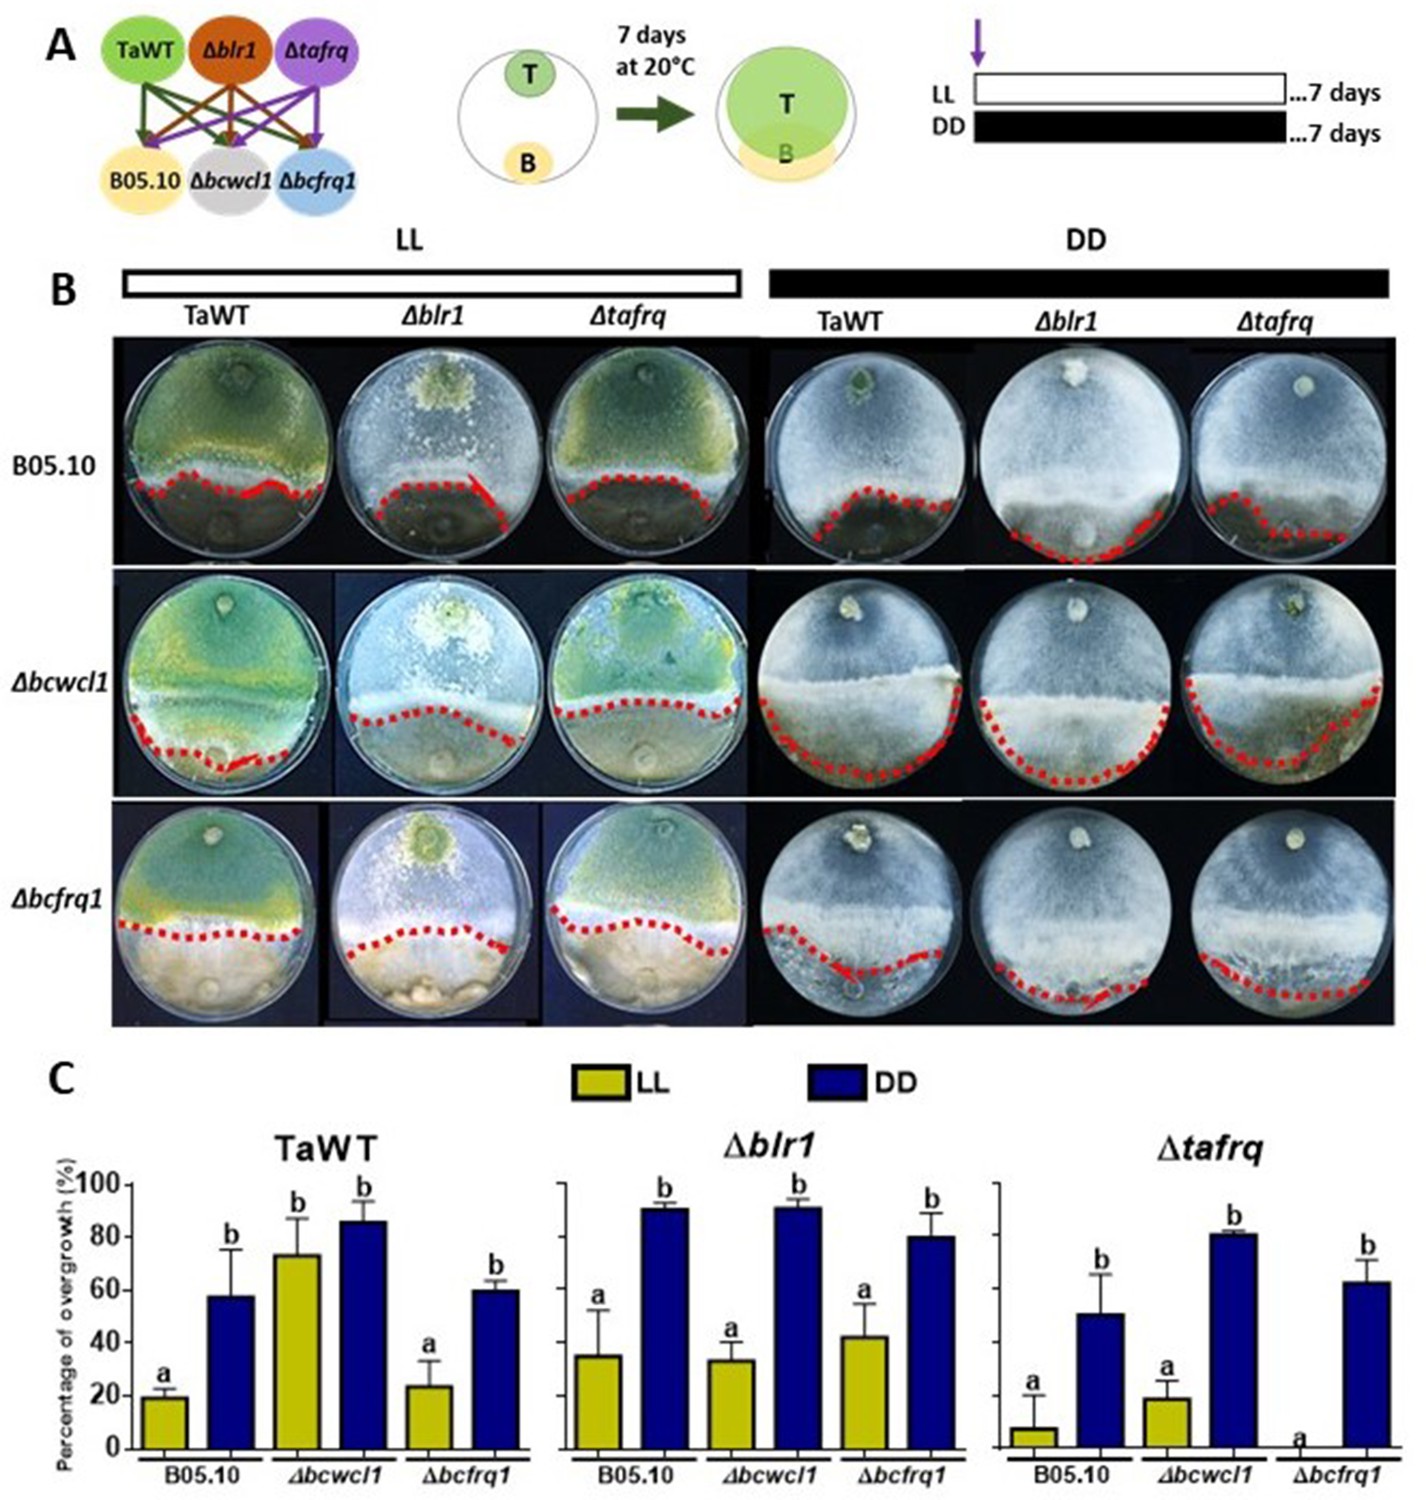
Core clock components, light, and darkness modulate the T. atroviride and B. cinerea interaction outcomes.
(A) Schematic representation of the experimental design (left) and confrontation assay (right). (B) After 7 days of cultivation in LL and DD conditions in potato dextrose agar (PDA) culture media, T. atroviride overgrowth was evaluated. Cultures were kept at 20°C during 7 days under the corresponding light regimes. Red dotted lines indicate the edge of Trichoderma over B. cinerea. A representative image of three biological replicates is shown. (C) Percentage of B. cinerea colony area covered by Trichoderma (percentage of overgrowth). Error bars represent the means ± SD of three biological replicates. Different letters indicate significant differences based on Tukey’s test (p<0.05).
Figure 4—figure supplement 1
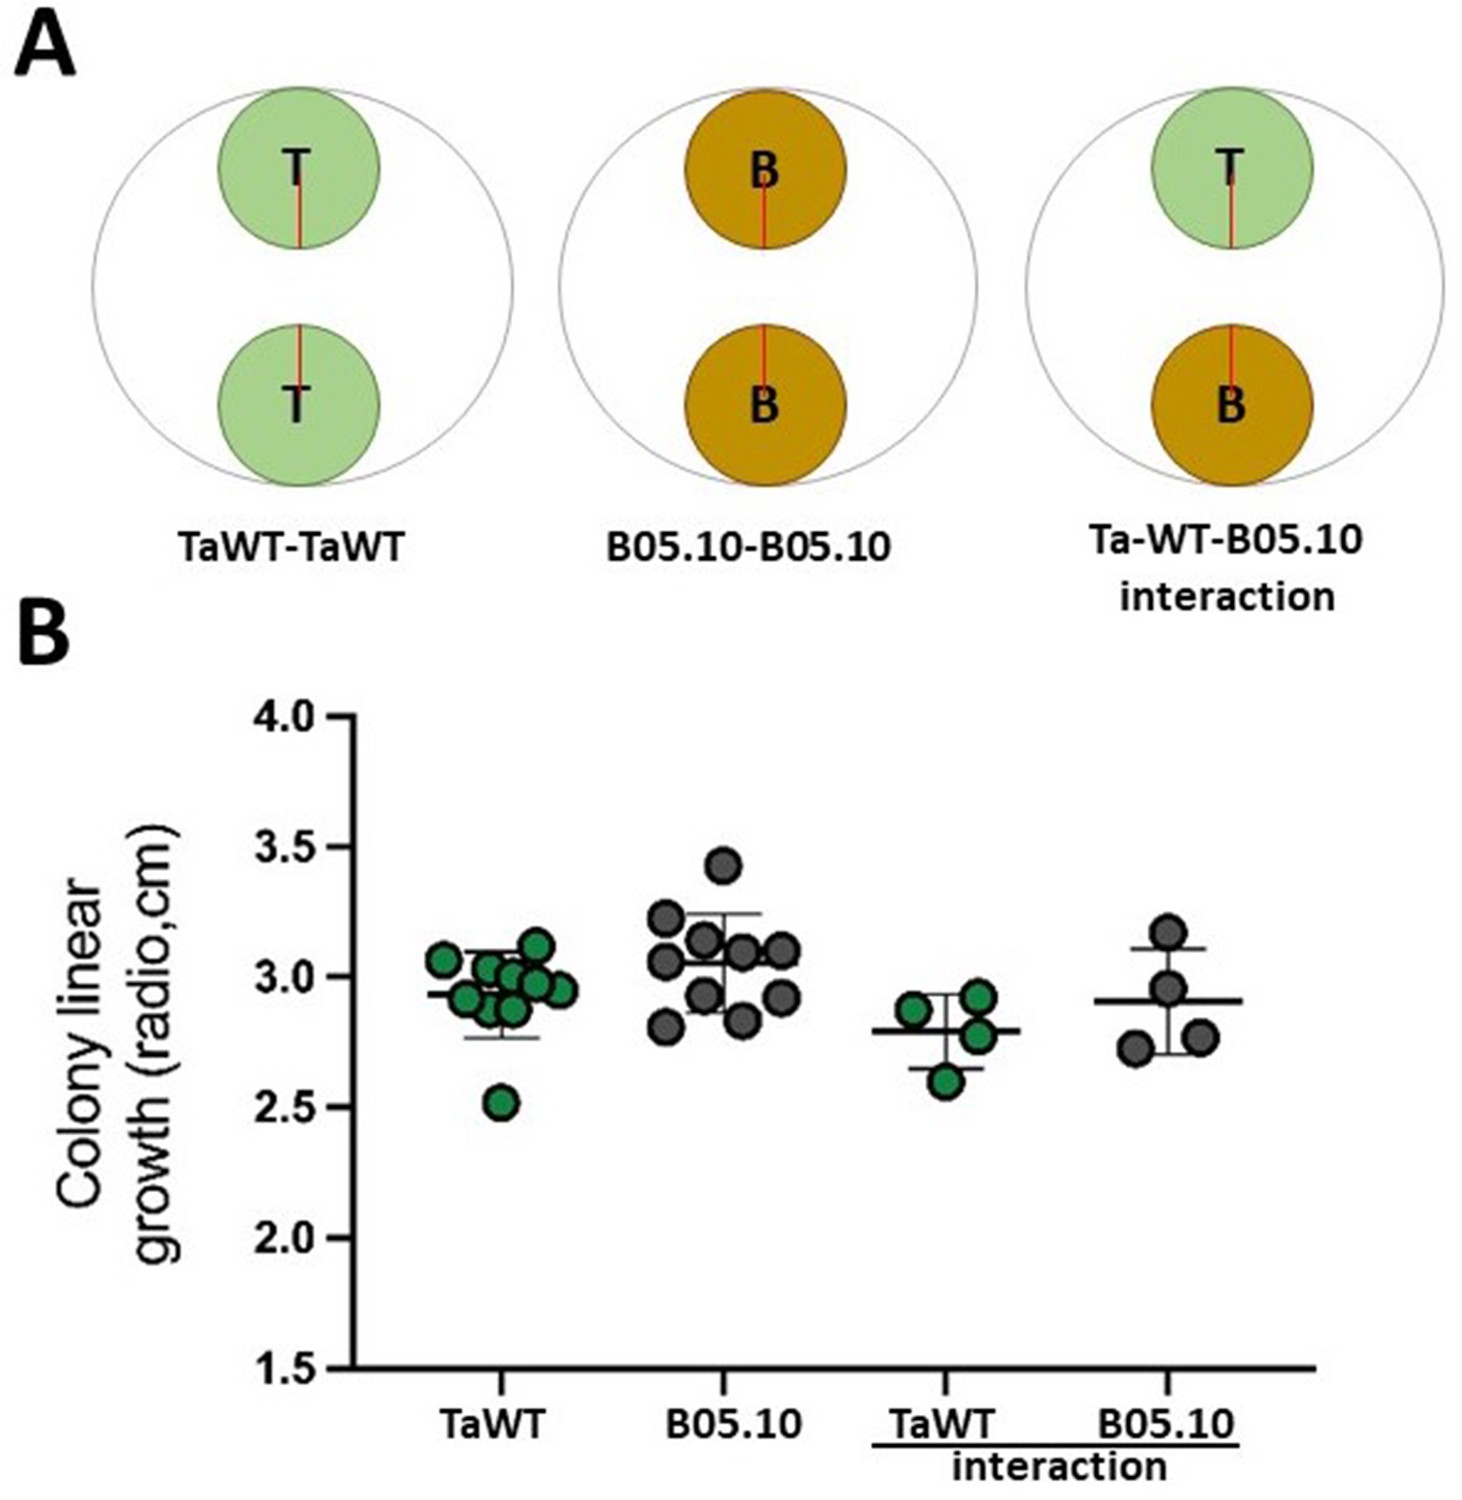
Control of growth rates of T. atroviride and B. cinerea in confrontation assays conducted in potato dextrose agar (PDA) conditions.
We evaluated if T. atroviride (‘T’) or B. cinerea’s (‘B’) growth was altered in the experimental conditions used in confrontation assays (PDA, 20°C in LL). The red line denotes the measured colony radio. TaWT and B05.10 strains were inoculated as indicated in panel (A). The radio of each colony was measured after 2 days of growth as depicted in (A). Data showed no statistical differences in growth radio at 2 days post-inoculation (dpi) (Kruska–Wallis, P<0.05.), as shown in (B).
Figure 5
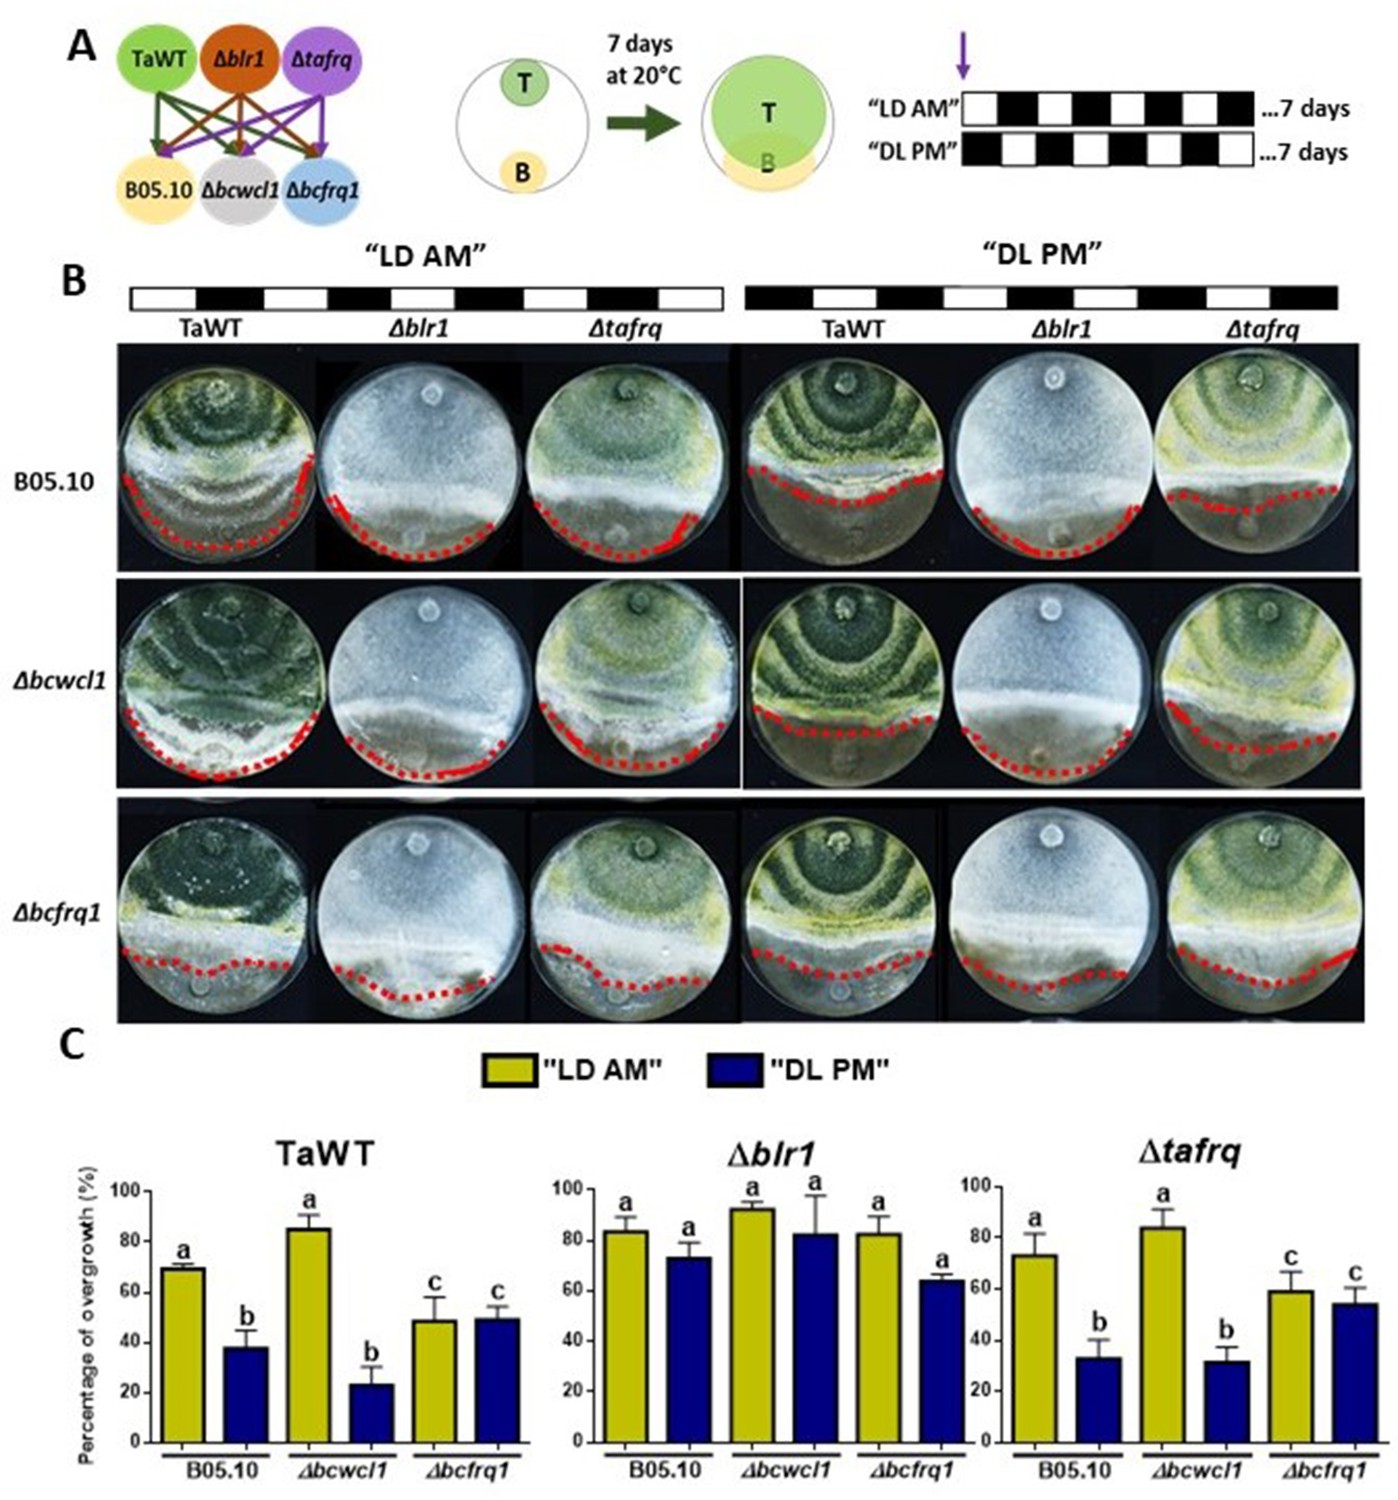
Core clock components of B. cinerea and T. atroviride have a role in the differential mycoparasitic interaction observed under LD cycles.
(A) Schematic representation of the experimental design (left) and confrontation assays (right) in which fungal strains were inoculated in potato dextrose agar (PDA) at dawn, that is, at lights on in the light:dark (LD or AM) cycle or at lights off in the dark:light cycle (DL or PM regime). In both cases, cultures were kept at 20°C during 7 days under the corresponding light regimes. (B) After 7 days of cultivation, overgrowth by T. atroviride was evaluated: red dotted lines indicate the edge of the latter over B. cinerea. A representative image of three biological replicates is shown. (C) Percentage of B. cinerea’s colony area covered by Trichoderma (percentage of overgrowth). Error bars represent the means ± SD of three biological replicates. Different letters indicate significant differences based on Tukey’s test (p<0.05).
Figure 6 with 1 supplement
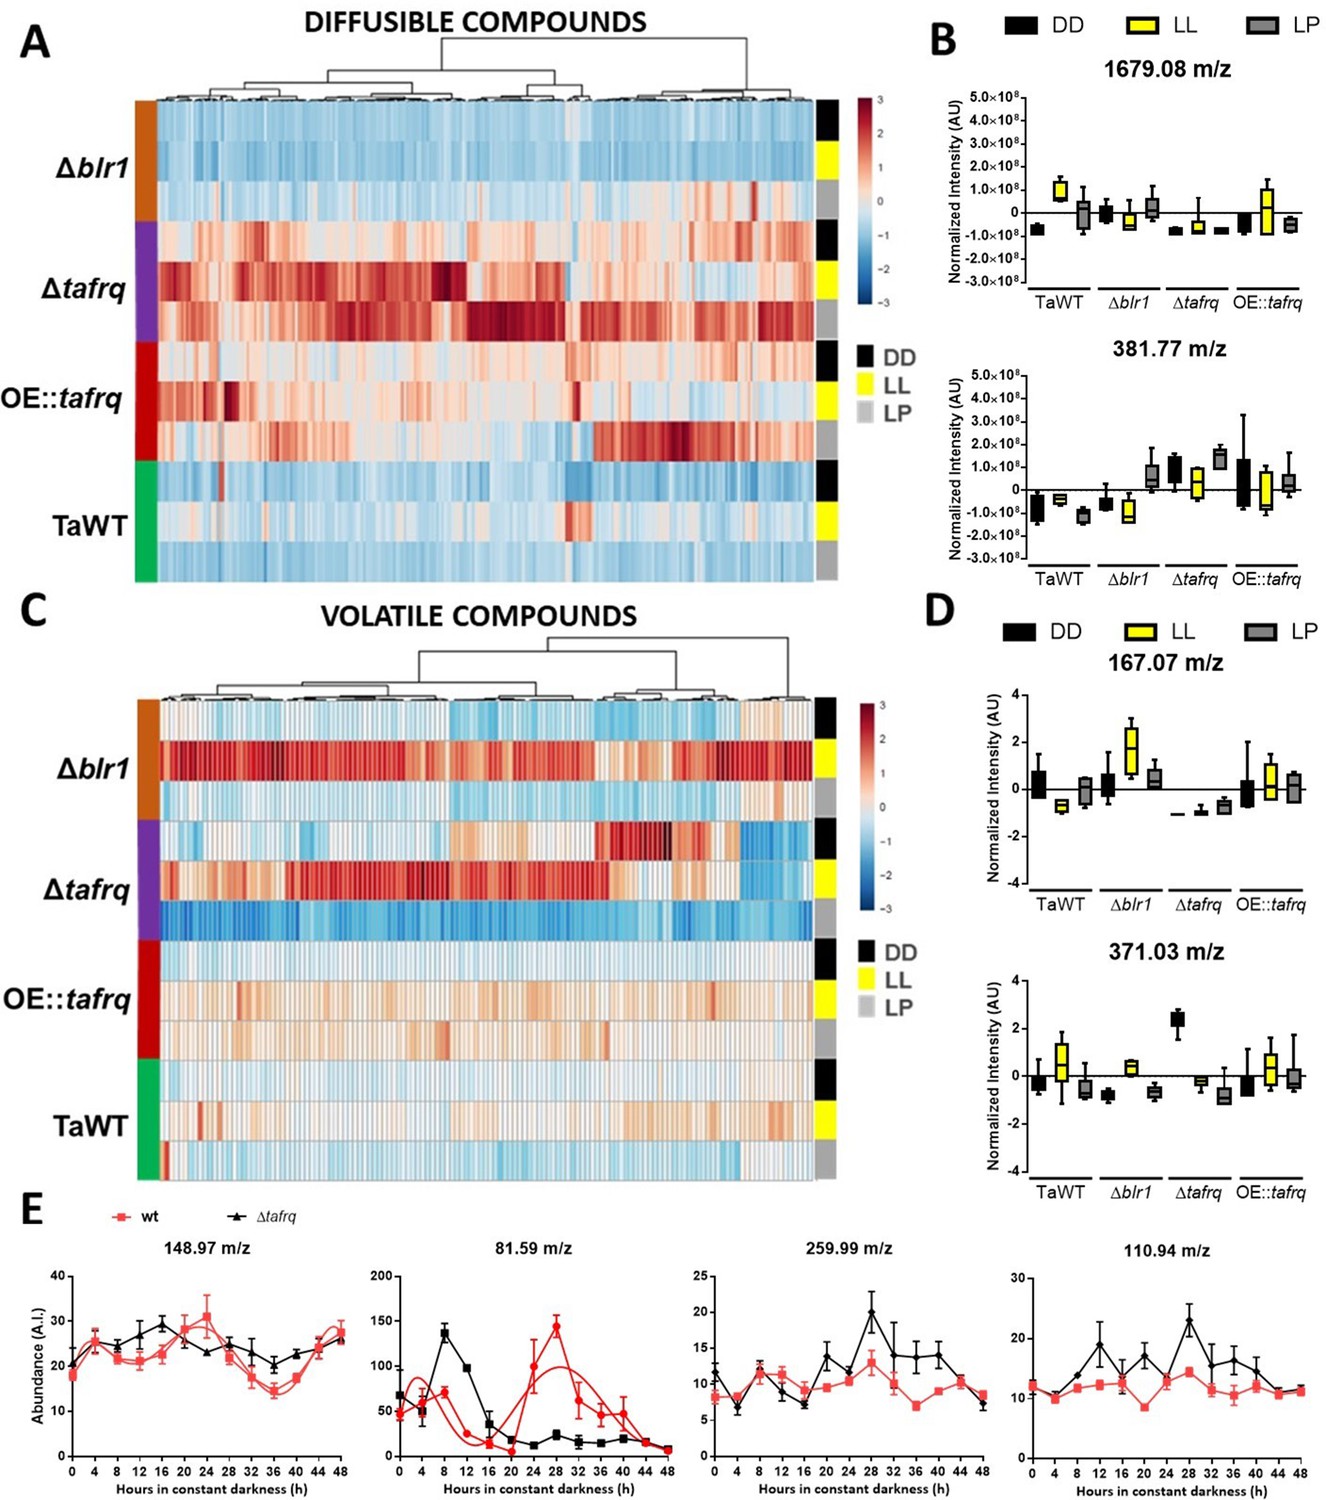
Secondary metabolism is regulated by light conditions and T. atroviride core clock components.
A global overview of secondary metabolites produced by TaWT and clock mutant strains grown in LL, DD, and after a light pulse (LP) grown in potato dextrose agar (PDA) at 20°C. (A) Diffusible compounds are augmented in Δtafrq. (B) Normalized intensity values for two particular diffusible compounds are shown: 1679.08 m/z is light-induced in TaWT and light-repressed in Δblr1 and Δtafrq; 381.77 m/z showed enhanced production in Δtafrq and OE::tafrq in all culture conditions. (C) Volatile organic compounds (VOCs) are induced by light in Δblr1 and Δtafrq. (D) Normalized intensity values for two VOCs: 6-PP (167.07 m/z) and 371.03 m/z. (E) For circadian VOCs production, TaWT and Δtafrq strains were grown in GYEC+ peas at 20°C during 3 days in LD 12:12 hr cycles and transferred to DD for circadian metabolic profiles. Samples were taken every 4 hr during 48 hr after the transition to DD. Circadian levels of ions 148.97 m/z and 81.59 m/z in TaWT, but arrhythmic in Δtafrq. Compounds 255.99 m/z and 110.94 m/z oscillate in neither strain.
Figure 6—figure supplement 1
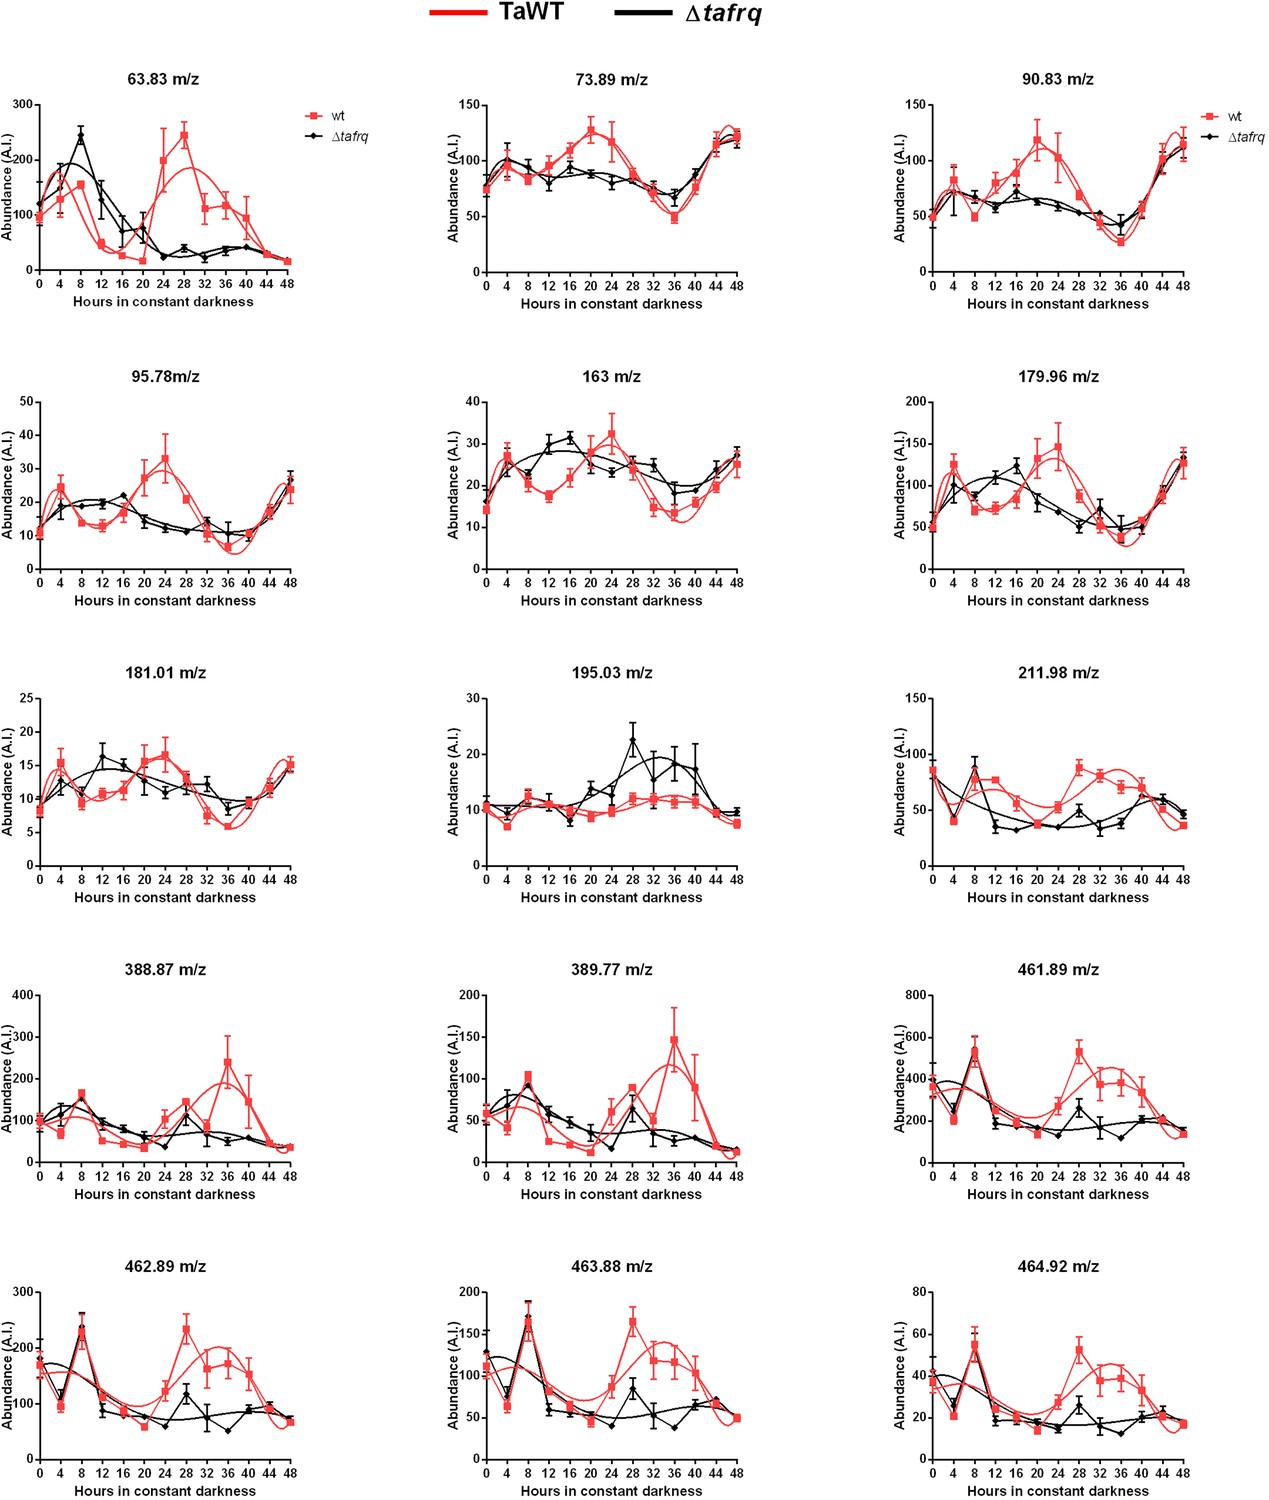
Circadian production of volatile organic compounds (VOCs) in T. atroviride.
VOCs were measured using low-temperature plasma ionization MS (LTP-MS). TaWT and Δtafrq strains were inoculated in GYEC+ peas media, entrained for 3 days in LD cycles, and then transferred to DD. Samples were taken every 4 hr for 48 hr (N = 6). Period and rhythmicity were calculated in the BioDare platform (see Supplementary file 4) described in the main text. A trend line is depicted in red.
Tables
Table 1
Induced and repressed diffusible and volatile organic compounds (VOCs) in each mutant strain compared to TaWT in constant darkness (DD), constant light (LL), and light pulse (LP).
| Diffusibles* | VOCs† | |||||||||||
|---|---|---|---|---|---|---|---|---|---|---|---|---|
| DD | LL | LP | DD | LL | LP | |||||||
| I | R | I | R | I | R | I | R | I | R | I | R | |
| Δblr1/TaWT | 26 | 3 | - | 129 | 66 | - | - | 5 | 17 | - | - | - |
| Δtafrq/TaWT | 67 | - | 137 | 2 | 218 | - | 23 | 13 | 16 | 2 | - | 10 |
| OE::tafrq/TaWT | 34 | - | 38 | - | 128 | - | - | - | - | - | 10 | - |
-
Data can be found in Table 1—source data 1.
-
*
Diffusible compounds with at least 2.0-fold change.
-
†
Volatile organic compounds with at least 1.5-fold change.
-
I=induced, R=repressed.
-
Table 1—source data 1
Fold changes of each comparison pair (Δblr1/TaWT, Δtafrq/TaWT and OE::tafrq/TaWT) can be found in a single individual sheet in the provided .xlsx file.
The table shows m/z value, fold change, and p-value for both diffusible and volatile organic compounds (VOCs) compounds produced in the three lighting conditions (LL, DD, and LP).
- https://cdn.elifesciences.org/articles/71358/elife-71358-table1-data1-v2.xlsx
Additional files
-
Supplementary file 1
Culture media used for in vivo luminescence assessment.
- https://cdn.elifesciences.org/articles/71358/elife-71358-supp1-v2.docx
-
Supplementary file 2
Period analysis of transcriptional reporters in T. atroviride using BioDare platform.
- https://cdn.elifesciences.org/articles/71358/elife-71358-supp2-v2.docx
-
Supplementary file 3
Mean overgrowth area of T. atroviride over B. cinerea in all confrontation assays performed.
- https://cdn.elifesciences.org/articles/71358/elife-71358-supp3-v2.docx
-
Supplementary file 4
Circadian metabolites of T. atroviride.
The period was estimated using FFT-NLSS, and rhythmicity was evaluated using BD2eJTK in the BioDare platform.
- https://cdn.elifesciences.org/articles/71358/elife-71358-supp4-v2.docx
-
Supplementary file 5
List of primers used for tafrq replacement cassette, complementation cassette, and diagnostics PCR.
Fw: direct orientation; Rv: reverse orientation.
- https://cdn.elifesciences.org/articles/71358/elife-71358-supp5-v2.docx
-
Supplementary file 6
List of primers used for OE::tafrq insertion cassette.
Fw: direct orientation; Rv: reverse orientation.
- https://cdn.elifesciences.org/articles/71358/elife-71358-supp6-v2.docx
-
Supplementary file 7
List of primers used for luciferase translational reporter (TaFRQLUC) insertion cassette.
Fw: direct orientation; Rv: reverse orientation.
- https://cdn.elifesciences.org/articles/71358/elife-71358-supp7-v2.docx
-
Supplementary file 8
List of primers used for luciferase transcriptional reporter insertion cassette.
Fw: direct orientation; Rv: reverse orientation.
- https://cdn.elifesciences.org/articles/71358/elife-71358-supp8-v2.docx
-
Supplementary file 9
List of primers used for frq::tafrqV5 replacement cassette in N. crassa and diagnostic PCRs.
Fw: direct orientation; Rv: reverse orientation.
- https://cdn.elifesciences.org/articles/71358/elife-71358-supp9-v2.docx
-
Supplementary file 10
RT-qPCR primers used and setting conditions.
- https://cdn.elifesciences.org/articles/71358/elife-71358-supp10-v2.docx
-
Transparent reporting form
- https://cdn.elifesciences.org/articles/71358/elife-71358-transrepform1-v2.pdf
Download links
A two-part list of links to download the article, or parts of the article, in various formats.
Downloads (link to download the article as PDF)
Open citations (links to open the citations from this article in various online reference manager services)
Cite this article (links to download the citations from this article in formats compatible with various reference manager tools)
Circadian oscillations in Trichoderma atroviride and the role of core clock components in secondary metabolism, development, and mycoparasitism against the phytopathogen Botrytis cinerea
eLife 11:e71358.
https://doi.org/10.7554/eLife.71358


