Serine ADP-ribosylation marks nucleosomes for ALC1-dependent chromatin remodeling
- Department of Biochemistry, The University of Texas Southwestern Medical Center, United States
- Preclinical Pharmacology Core, Department of Biochemistry, University of Texas Southwestern Medical Center, United States
Figures
Figure 1 with 1 supplement

Analysis of serine mono- and poly-ADPr by the PARP1:HPF1 complex on synthetic peptide substrates.
(A) A schematic showing the workflow employed to analyze peptide poly-APDr by the recombinant PARP1:HPF1 complex. Peptide products are separated by polymer length via RP-HPLC. The yellow star represents a serine-linked ADP-ribose modification, ‘n’ represents variable polymer length, and the orange circle indicates the site of linear ADP-ribose polymerization. (B) RP-HPLC and MS analysis of substrate peptides (histone H3 wild-type or S10A mutant, amino acids 1–20) and corresponding PARP1:HPF1 reaction products (for raw MS data, see Supplementary file 1). RP-HPLC gradients are from 0 to 35% Solvent B (2–22 min). (C) A schematic describing the ADP-ribosylhydrolase-based characterization strategy. Enzymes and their respective reaction products are depicted. (D) RP-HPLC traces from PARG- or ARH3-treated H3 peptide ADPr reactions that were optimized for ADP-ribose chain elongation. The number of ADP-ribose units was verified by MS analysis. (E) Product analysis of a PARP1 ADPr reaction in the presence of increasing HPF1 concentrations. Histone H3 substrate peptide starting material and each unique ADP-ribosylated product were quantified via HPLC chromatogram peak integration (see Methods and Figure 1—figure supplement 1D). The columns represent the percent substrate conversion to each ADP-ribosylated product. Data are represented as mean ± s.d. (n = 3).
Figure 1—figure supplement 1
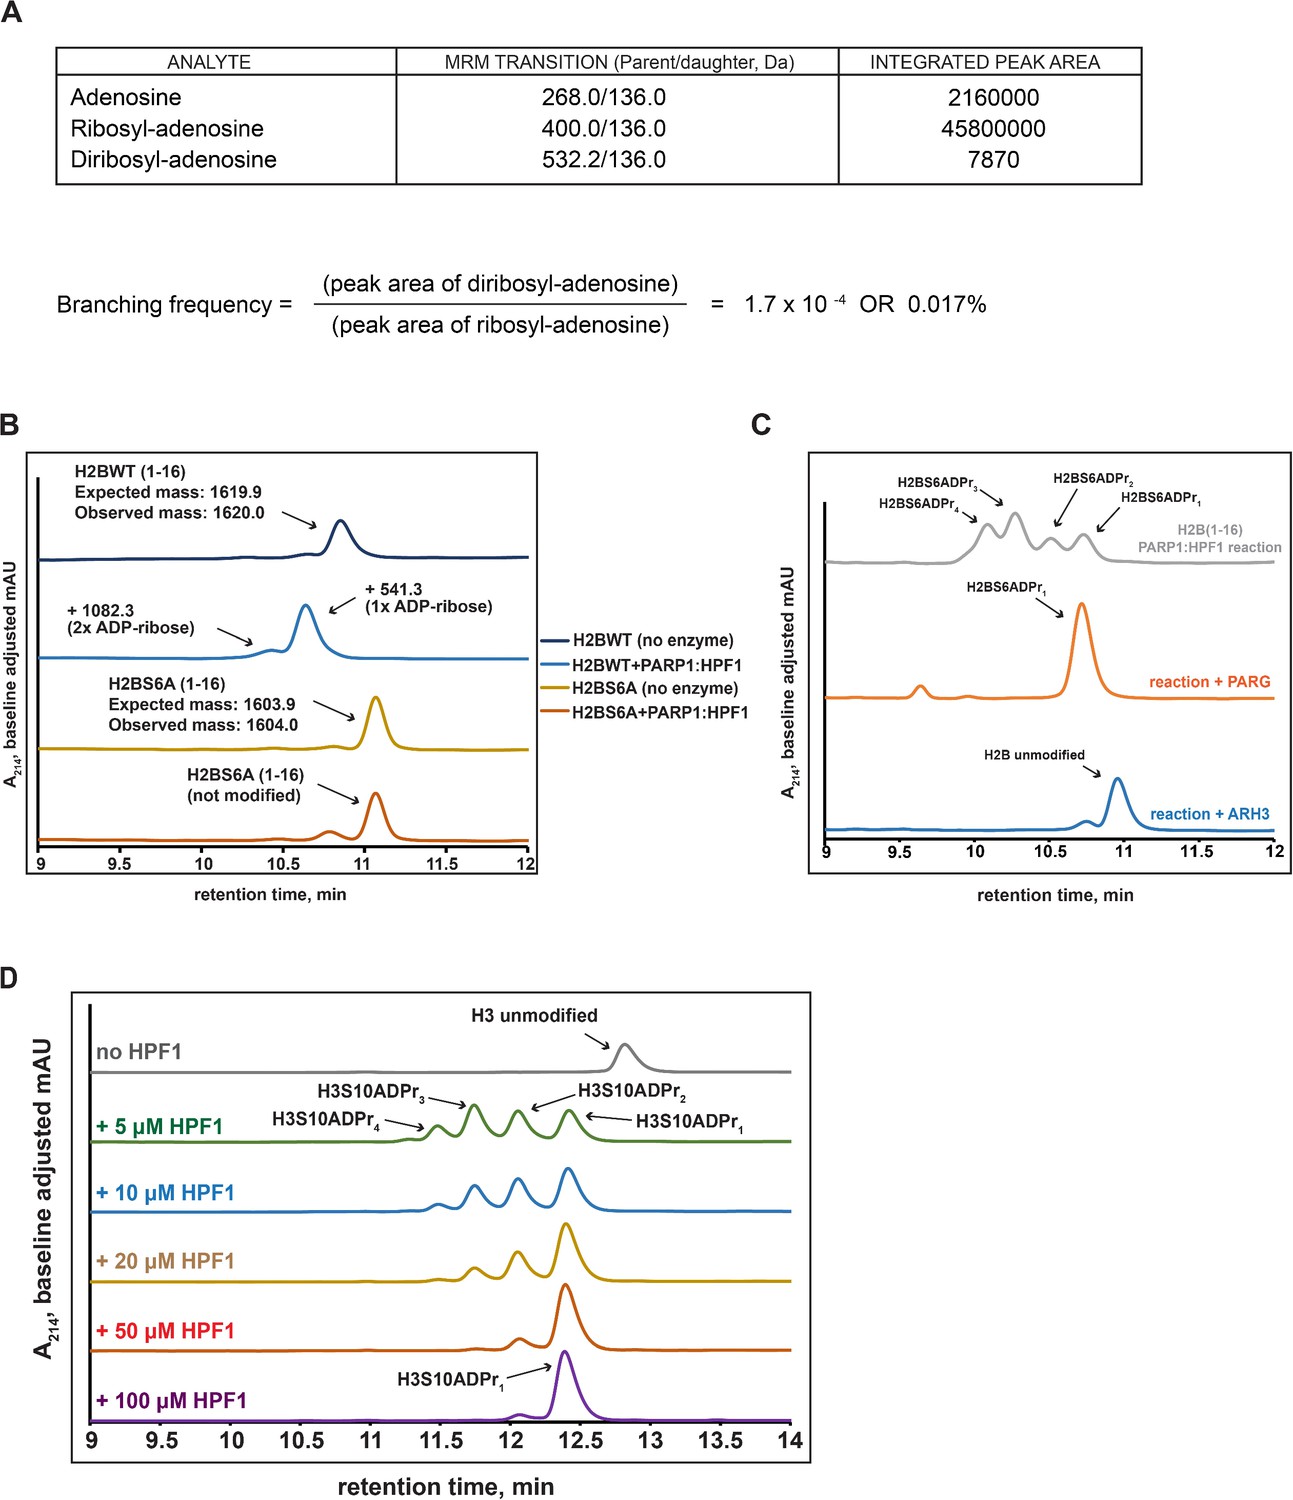
The recombinant PARP1:HPF1 complex installs linear poly-ADP-ribose chains at biologically relevant target sites.
(A) Summary of LC-MS/MS analysis of enzymatic digestion products from PAR chains installed on a peptide using our technology. The spectra were produced on a Sciex QTRAP 6500+ mass spectrometer. (B) RP-HPLC and MS analysis of substrate peptides (H2B wild-type or S6A mutant, amino acids 1–16) and corresponding PARP1:HPF1 reaction products. RP-HPLC gradients are from 0 to 35% Solvent B (2–22 min). (C) RP-HPLC traces from PARG- or ARH3-treated H2B peptide ADPr reactions that were optimized for ADP-ribose chain elongation. The number of ADP-ribose units was verified by MS analysis. (D) Representative RP-HPLC analyses of ADPr reactions from Figure 1E containing PARP1 (1 μM), unmodified H3 substrate peptide (amino acids 1–20; 180 μM), NAD+ (2 mM), and various HPF1 concentrations (indicated on corresponding trace). RP-HPLC gradients are from 0 to 35% Solvent B (2–22 min). For peak area integration values, see Supplementary Dataset.
Figure 2 with 2 supplements
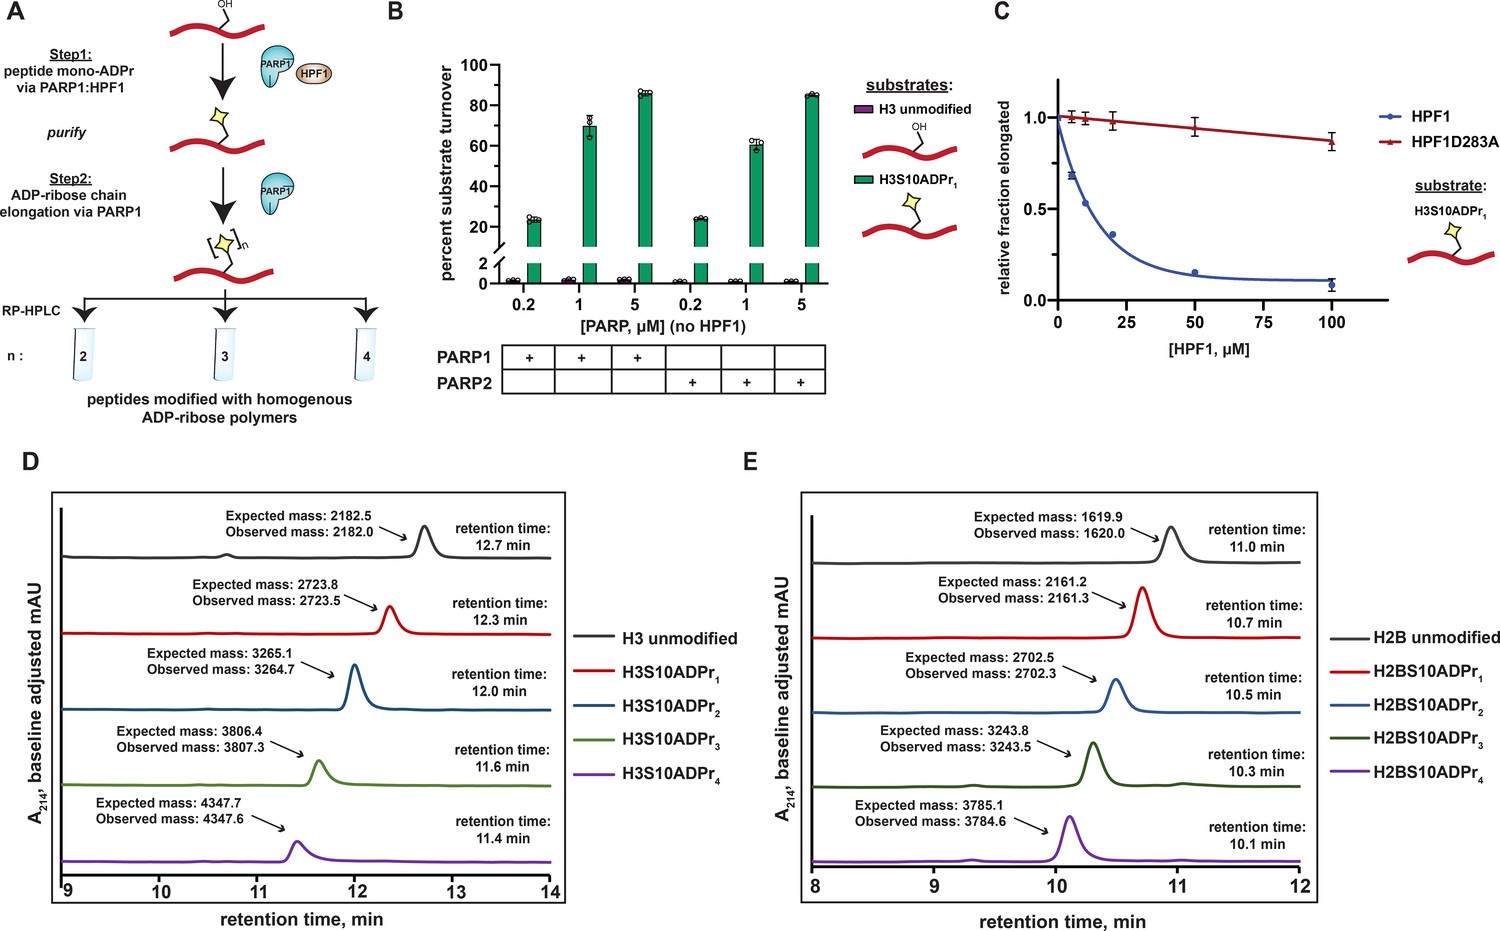
A two-step enzymatic process to prepare poly-ADP-ribosylated peptides with defined ADP-ribose chain lengths.
(A) A schematic showing the two-step enzymatic procedure implemented to synthesize and purify poly-ADP-ribosylated peptides. The mono-ADP-ribosylated peptide product from Step 1 was purified using preparative RP-HPLC prior to use in Step 2. (B) Substrate turnover analysis of PARP1 and PARP2 ADPr reactions in the absence of HPF1. Purple bars represent total percent turnover of an unmodified H3 peptide to mono- or poly-ADP-ribosylated products. Green bars represent total percent turnover of the H3S10ADPr1 peptide to poly-ADP-ribosylated products (for poly-ADP-ribosylated product distribution, see Figure 2—figure supplement 1A and B). Data are represented as mean ± s.d. (n = 3). (C) Analysis of PARP1 elongation activity on the H3S10ADPr1 peptide substrate in the presence of increasing amounts of HPF1 or HPF1D283A. Fraction elongated represents the fraction of H3S10ADPr1 peptide converted to poly-ADP-ribosylated products. Data are normalized to fraction of substrate elongated in the absence of HPF1. Data are represented as mean ± s.d. (n = 3). The curves represent the fit of the data into a non-linear regression model for one-phase exponential decay. ( D) RP-HPLC and MS analysis of mono- and poly-ADP-ribosylated H3 peptides that have been purified to homogeneity via semi-preparative HPLC. (E) As in (D), but for H2B (amino acids 1–16) peptides.
Figure 2—figure supplement 1
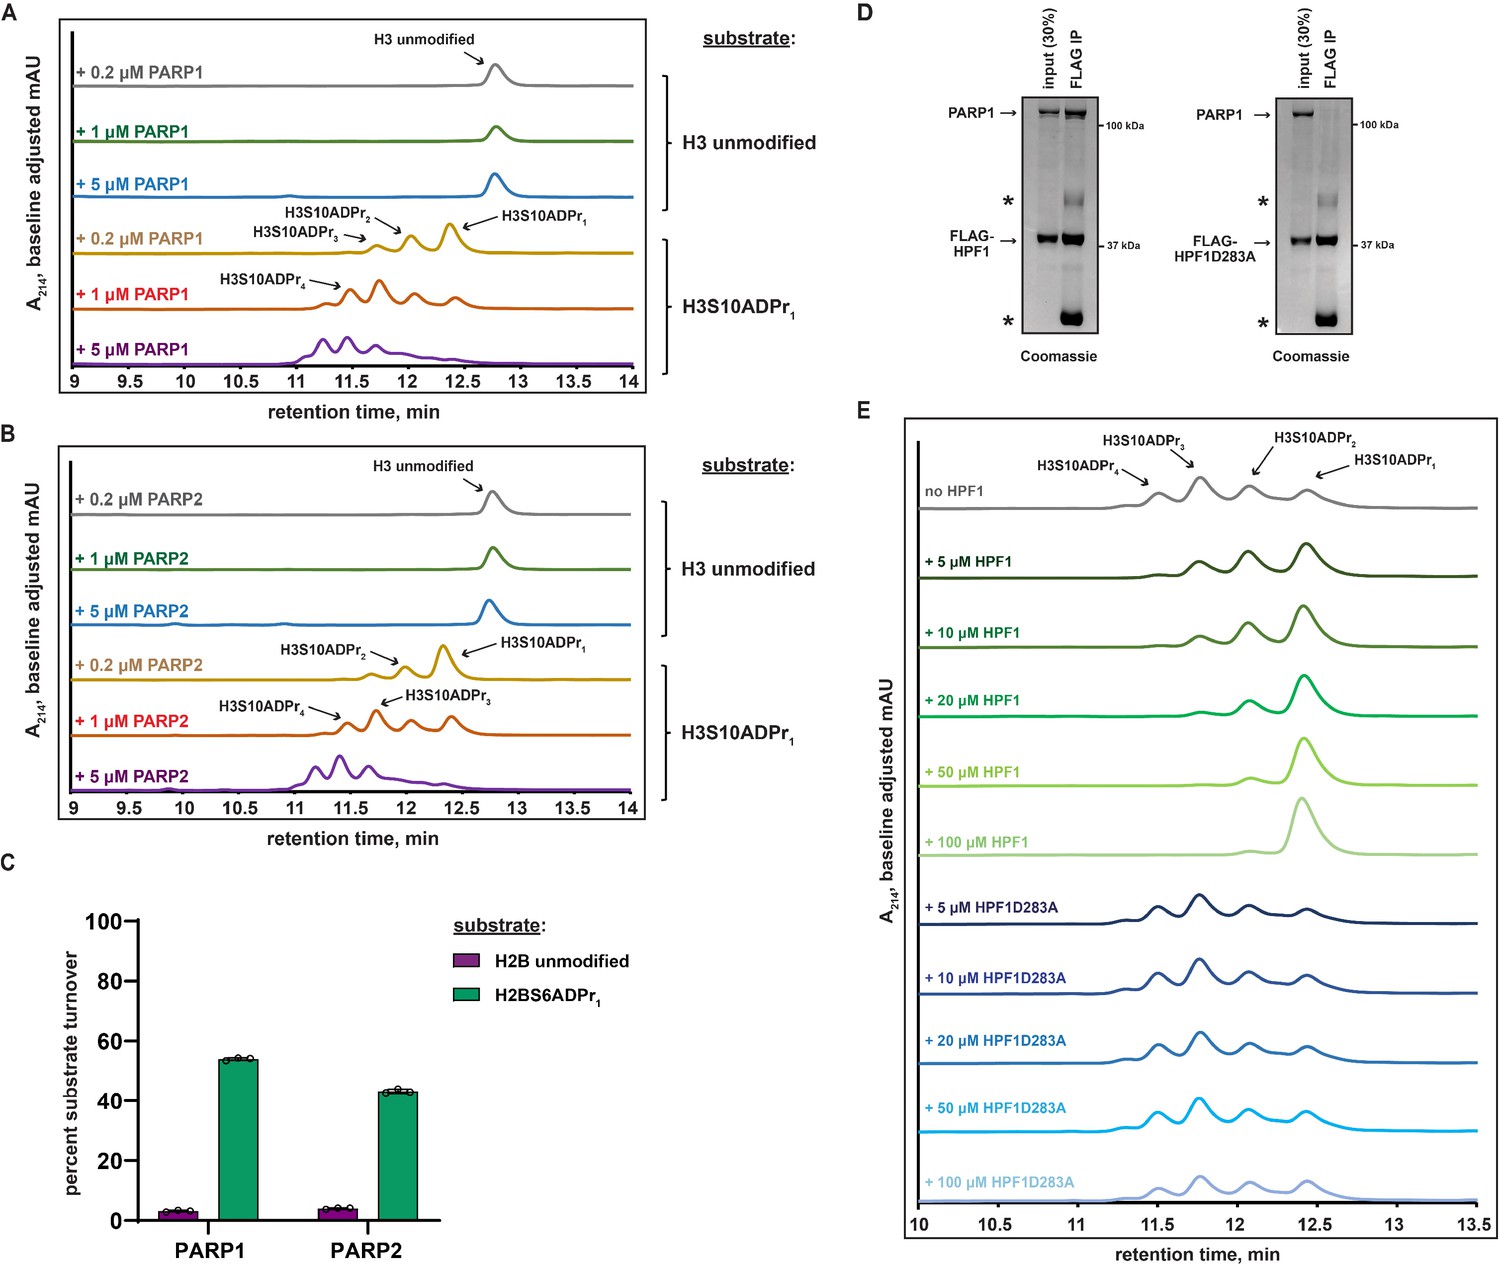
PARP1 and PARP2 efficiently elongate ADP-ribose chains from mono-ADP-ribosylated peptides.
(A) Representative RP-HPLC analyses of ADPr reactions from Figure 2B containing various PARP1 concentrations (indicated on corresponding trace), unmodified H3 or H3S10ADPr1 substrate peptide (amino acids 1–20; 180 μM), NAD+ (2 mM), and no HPF1. RP-HPLC gradients are from 0 to 35% Solvent B (2–22 min). For peak area integration values, see Supplementary Dataset. (B) As in (A), but with various PARP2 concentrations (indicated on corresponding trace). (C) Substrate turnover analysis of ADPr reactions containing PARP1 (1 μM) or PARP2 (1 μM), the indicated H2B substrate peptide (amino acids 1–16; 40 μM), NAD+ (2 mM), and no HPF1. Purple bars represent total percent turnover of an unmodified H2B peptide to mono- or poly-ADP-ribosylated products. Green bars represent total percent turnover of the H2BS6ADPr1 peptide to poly-ADP-ribosylated products. For peak area integration values, see Supplementary Dataset. Data are represented as mean ± s.d. (n = 3). (D) Coomassie blue-stained SDS-PAGE gel showing FLAG-HPF1:PARP1 or FLAG-HPF1D283A:PARP1 immunoprecipitation (IP) experiments. *Gel migration species corresponding to the immunoglobulin chains from the anti-FLAG M2 magnetic beads. (E), Representative RP-HPLC analyses of ADPr reactions from Figure 2c containing PARP1 (1 μM), H3S10ADPr1 substrate peptide (amino acids 1–20; 180 μM), NAD+ (2 mM), and various HPF1 or HPF1D283A concentrations (concentration indicated on corresponding trace). RP-HPLC gradients are from 0 to 35% Solvent B (2–22 min). For peak area integration values, see Supplementary Dataset.
-
Figure 2—figure supplement 1—source data 1
Uncropped SDS-PAGE gel from Figure 2—figure supplement 1D (Coomassie stain).
- https://cdn.elifesciences.org/articles/71502/elife-71502-fig2-figsupp1-data1-v3.zip
Figure 2—figure supplement 2
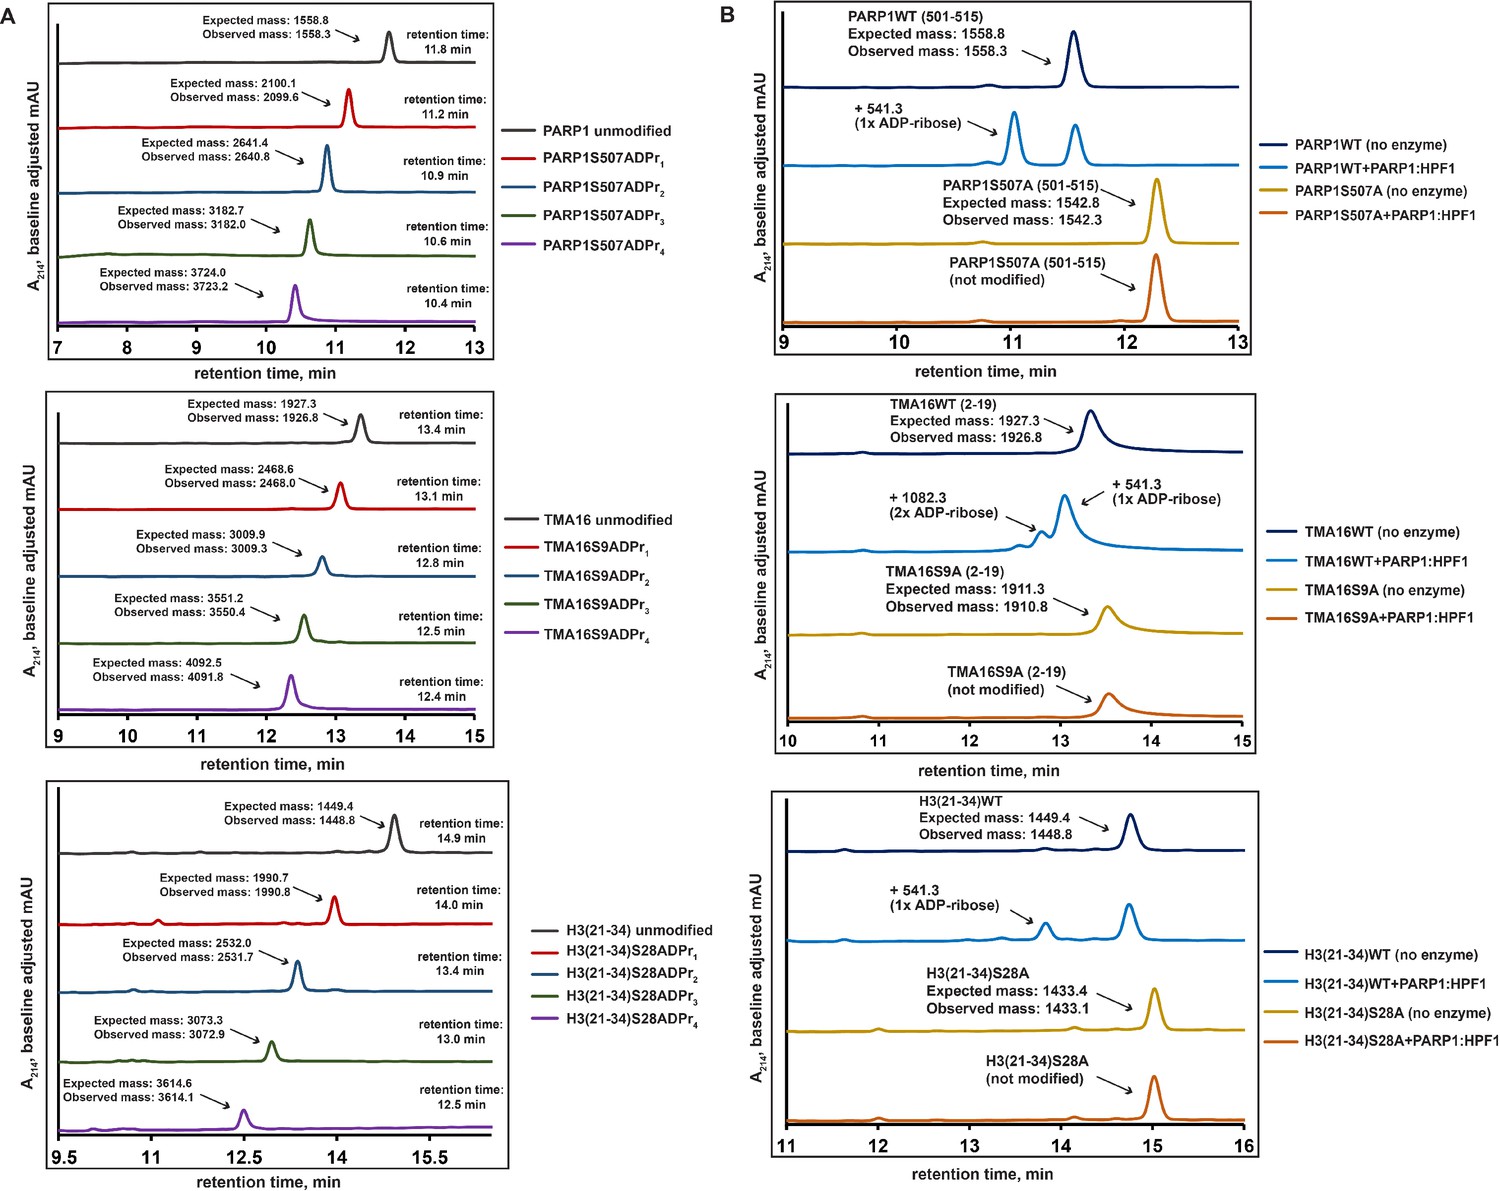
The two-step enzymatic process is broadly applicable to install poly-ADP-ribosylation at PARP1:HPF1 target sites.
(A) RP-HPLC and MS analysis of mono- and poly-ADP-ribosylated PARP1(501-515), TMA16(2-19) and H3(21–34) peptides that have been purified to homogeneity using semi-preparative HPLC. RP-HPLC gradients are from 0 to 35% Solvent B (2–22 min) (B) RP-HPLC and MS analysis of substrate peptides (PARP1 wild-type or S507A mutant, TMA16 wild-type or S9A mutant, H3(21–34) wild-type or S28A mutant) and corresponding PARP1:HPF1 reaction products. RP-HPLC gradients are from 0 to 35% Solvent B (2–22 min). For LC-MS characterization, see Supplementary file 1.
Figure 3
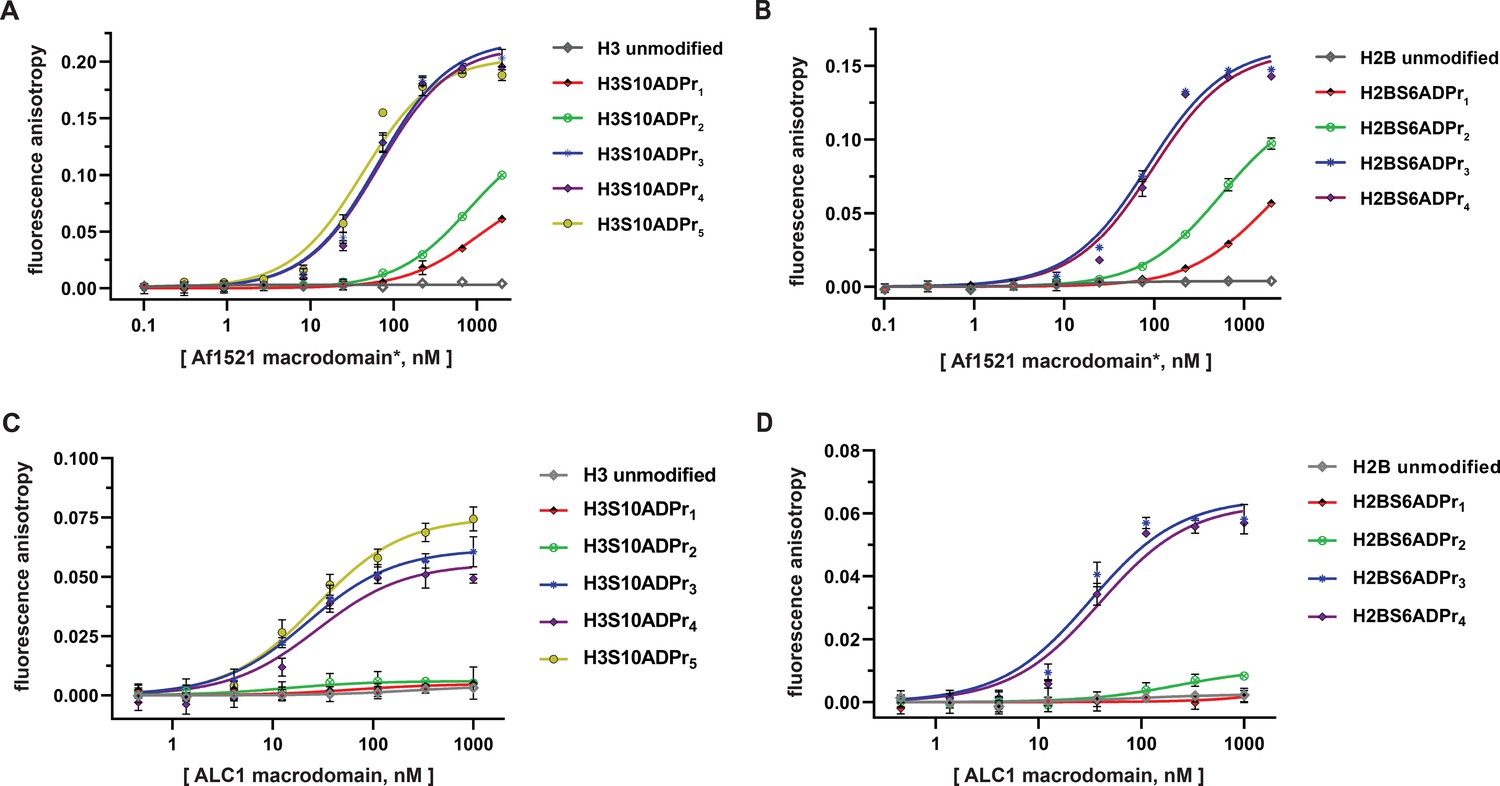
The ALC1 macrodomain engages ADP-ribosylated H2B and H3 peptides with equal affinity.
(A) Fluorescence polarization (FP) assays to evaluate binding affinities of different ADP-ribosylated, fluorescein-labeled H3 (1–20) peptides to the Af1521 macrodomain. Data are represented as mean ± s.d. (n = 3). All curves represent fit of the data into a non-linear regression equation for one-site, specific binding (for Kd, app values, see Supplementary file 4). *The Af1521 macrodomain is from the commercially available pan-ADP-ribose detection reagent. (B) As in (A), but with fluorescein-labeled H2B (1-16) peptides. (C) FP assays as described in (A) to evaluate binding affinities of ADP-ribosylated, fluorescein-labeled H3 (1–20) peptides to the ALC1 macrodomain. (D) As in (C), but with fluorescein-labeled H2B (1-16) peptides.
Figure 4
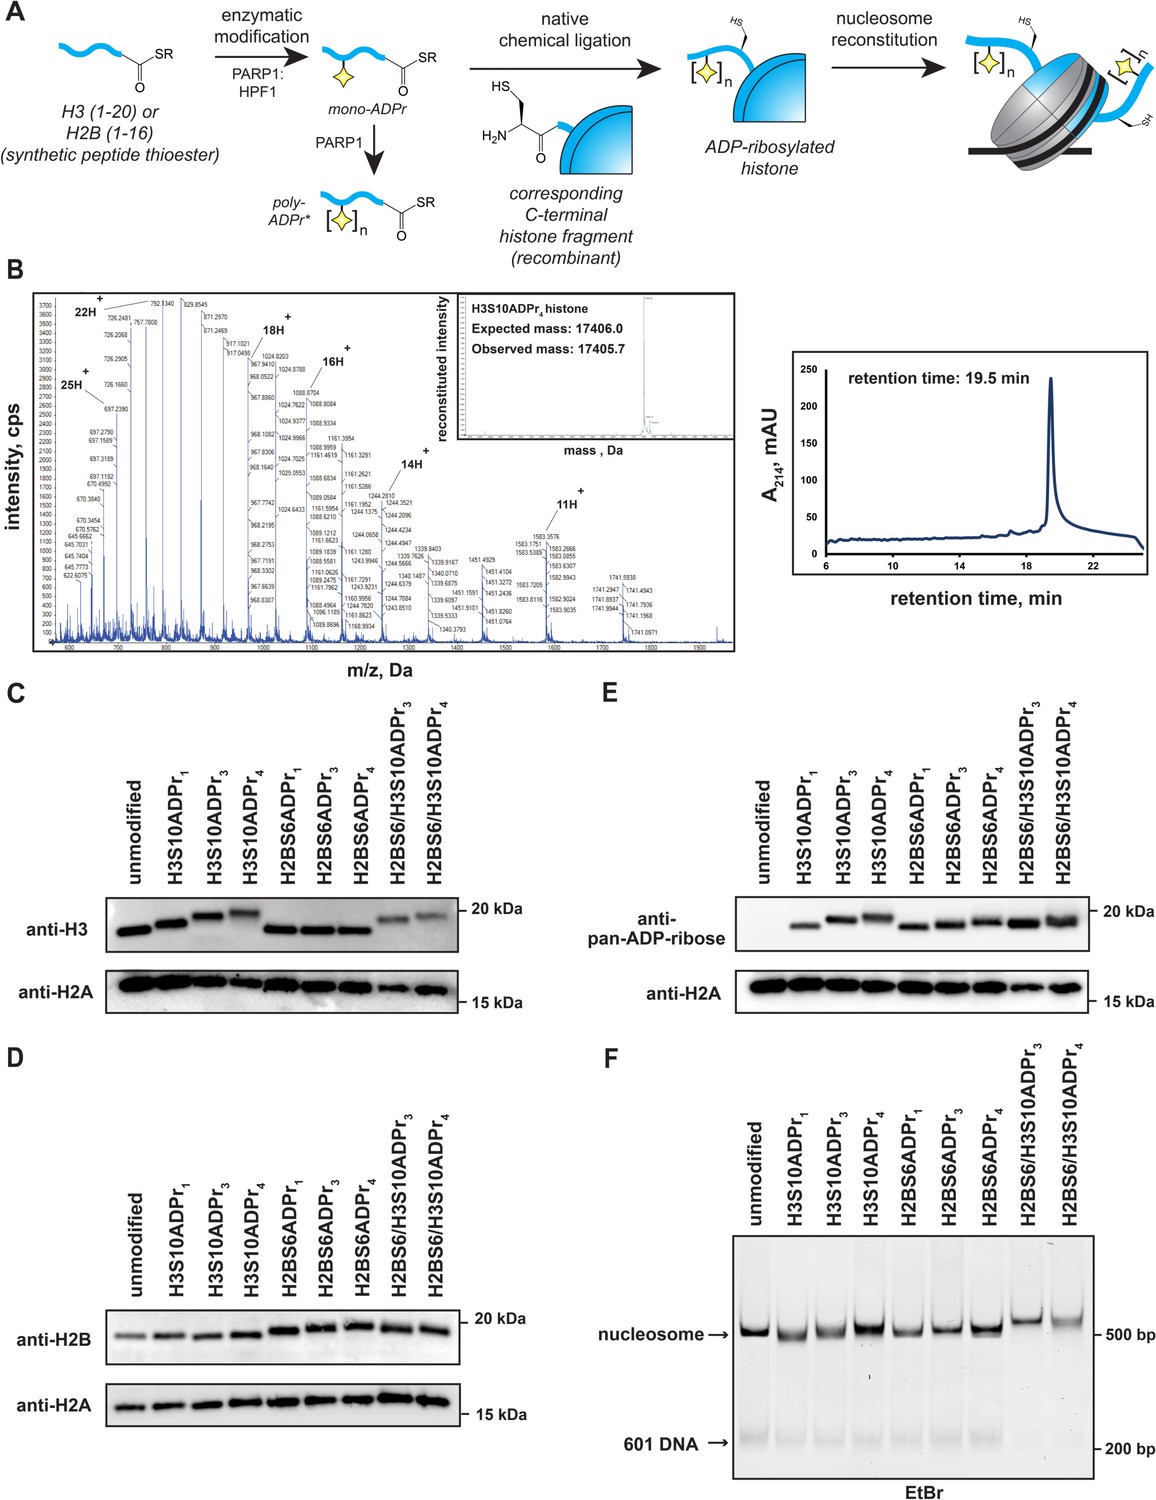
Installation of homogenous ADP-ribose polymers onto reconstituted nucleosomes via a chemoenzymatic strategy.
(A) A schematic depicting the protein semi-synthesis-based strategy to install homogenous ADP-ribose polymers at specific sites on histone proteins. The nucleosome cartoon includes DNA (black line), as well as the histone protein octamer core (gray = recombinant histones, blue = semi-synthetic histone). *The poly-ADP-ribosylated peptides are separated via HPLC to yield homogenous species prior to the ligation reaction. (B) Representative HPLC/MS characterization of the full-length H3S10ADP4 protein. Raw ESI-MS spectra, MS deconvolution, and RP-HPLC chromatogram are shown. RP-HPLC gradient is from 0 to 80% Solvent B (2–22 min). For additional histone HPLC and MS characterizations, see Supplementary file 5. (C) Western blot analysis of histone H3 following nucleosome assembly. ADP-ribose-dependent gel migration shifts (12% bis-tris SDS-PAGE gel in MES running buffer) demonstrate sample homogeneity. (D) Histone H2B analysis as described in (C). (E) Pan-ADP-ribose western blot analysis of all assembled nucleosomes. (F) Native gel analysis of assembled nucleosomes. Single nucleosome bands and trace levels of free 601 DNA demonstrate sample homogeneity and assembly efficiency. EtBr = ethidium bromide stain.
-
Figure 4—source data 1
Uncropped western blots and TBE gel from Figure 4.
- https://cdn.elifesciences.org/articles/71502/elife-71502-fig4-data1-v3.zip
Figure 5 with 2 supplements
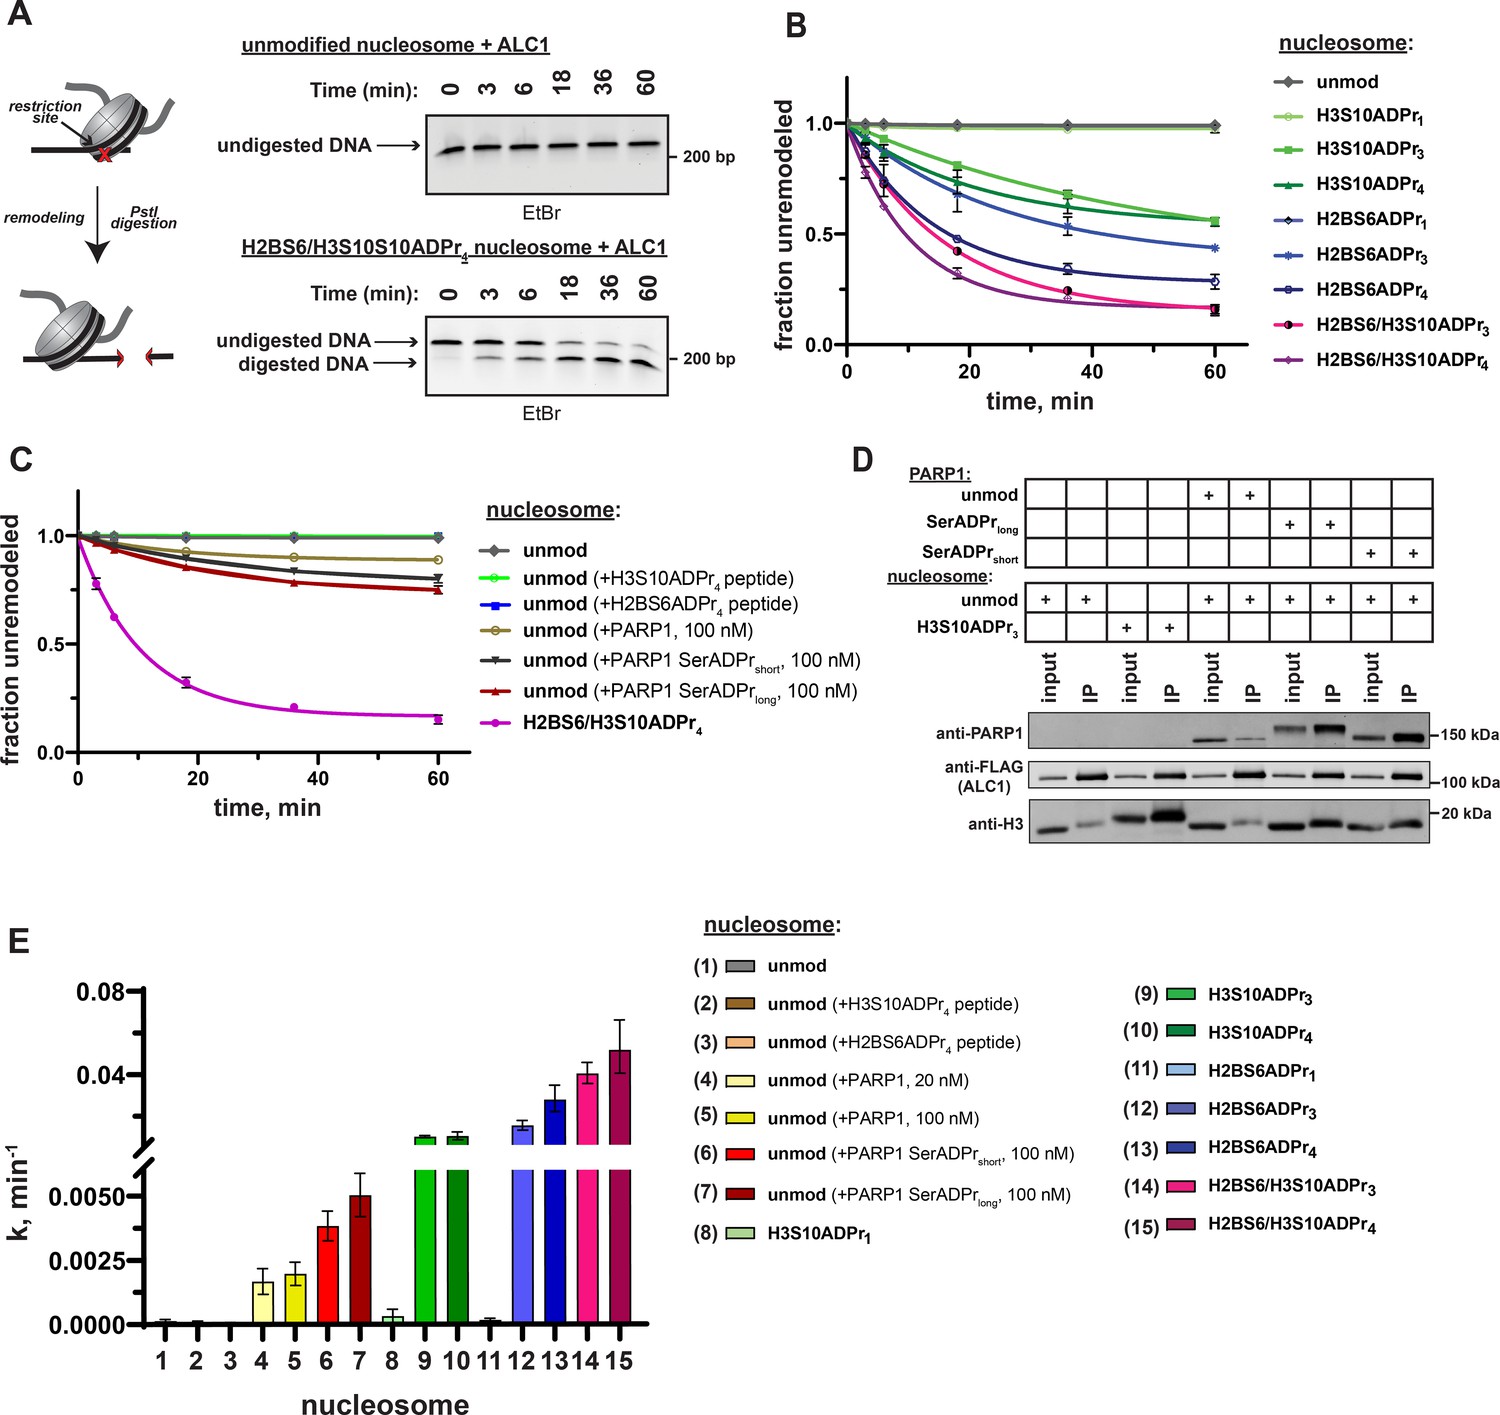
ADPr at H2BS6 and H3S10 convert nucleosomes into robust ALC1 substrates.
(A) Schematic depicting the REA assay for chromatin remodeling and representative TBE gel analyses of recombinant ALC1 activity on unmodified or H2BS6/H3S10ADPr4 nucleosomes. (B) ALC1 nucleosome remodeling assay time-course wherein each reaction comprises ALC1 and the indicated nucleosome (‘unmod’ = unmodified). (C) As in (B), but each reaction comprises ALC1, unmodified nucleosome (20 nM), and the indicated modified histone peptide or PARP1. Modified histone peptide concentration is equal to the corresponding full-length histone concentration (40 nM). The H2BS6/H3S10ADPr4 nucleosome remodeling data is included for direct comparison. (D) Western blot analysis of a FLAG immunoprecipitation (IP) wherein ALC1 is FLAG-tagged and its association with nucleosomes is analyzed in the presence and absence of unmodified or automodified PARP1. The corresponding input (5%) was loaded alongside the IP (elution) lanes for comparison. (E) ALC1 remodeling rate constants calculated from data in (B, C) and Figure 5—figure supplement 2A. Rate constants were determined by fitting data to a non-linear regression model for one phase exponential decay. Data in (B) and (C) are represented as mean ± s.d. (n = 3), while the error bars in (E) represent 95% CI. Curves in (B) and (C) represent data fitting to a non-linear regression model for one-phase exponential decay.
-
Figure 5—source data 1
Uncropped TBE gels and western blot from Figure 5.
- https://cdn.elifesciences.org/articles/71502/elife-71502-fig5-data1-v3.zip
Figure 5—figure supplement 1
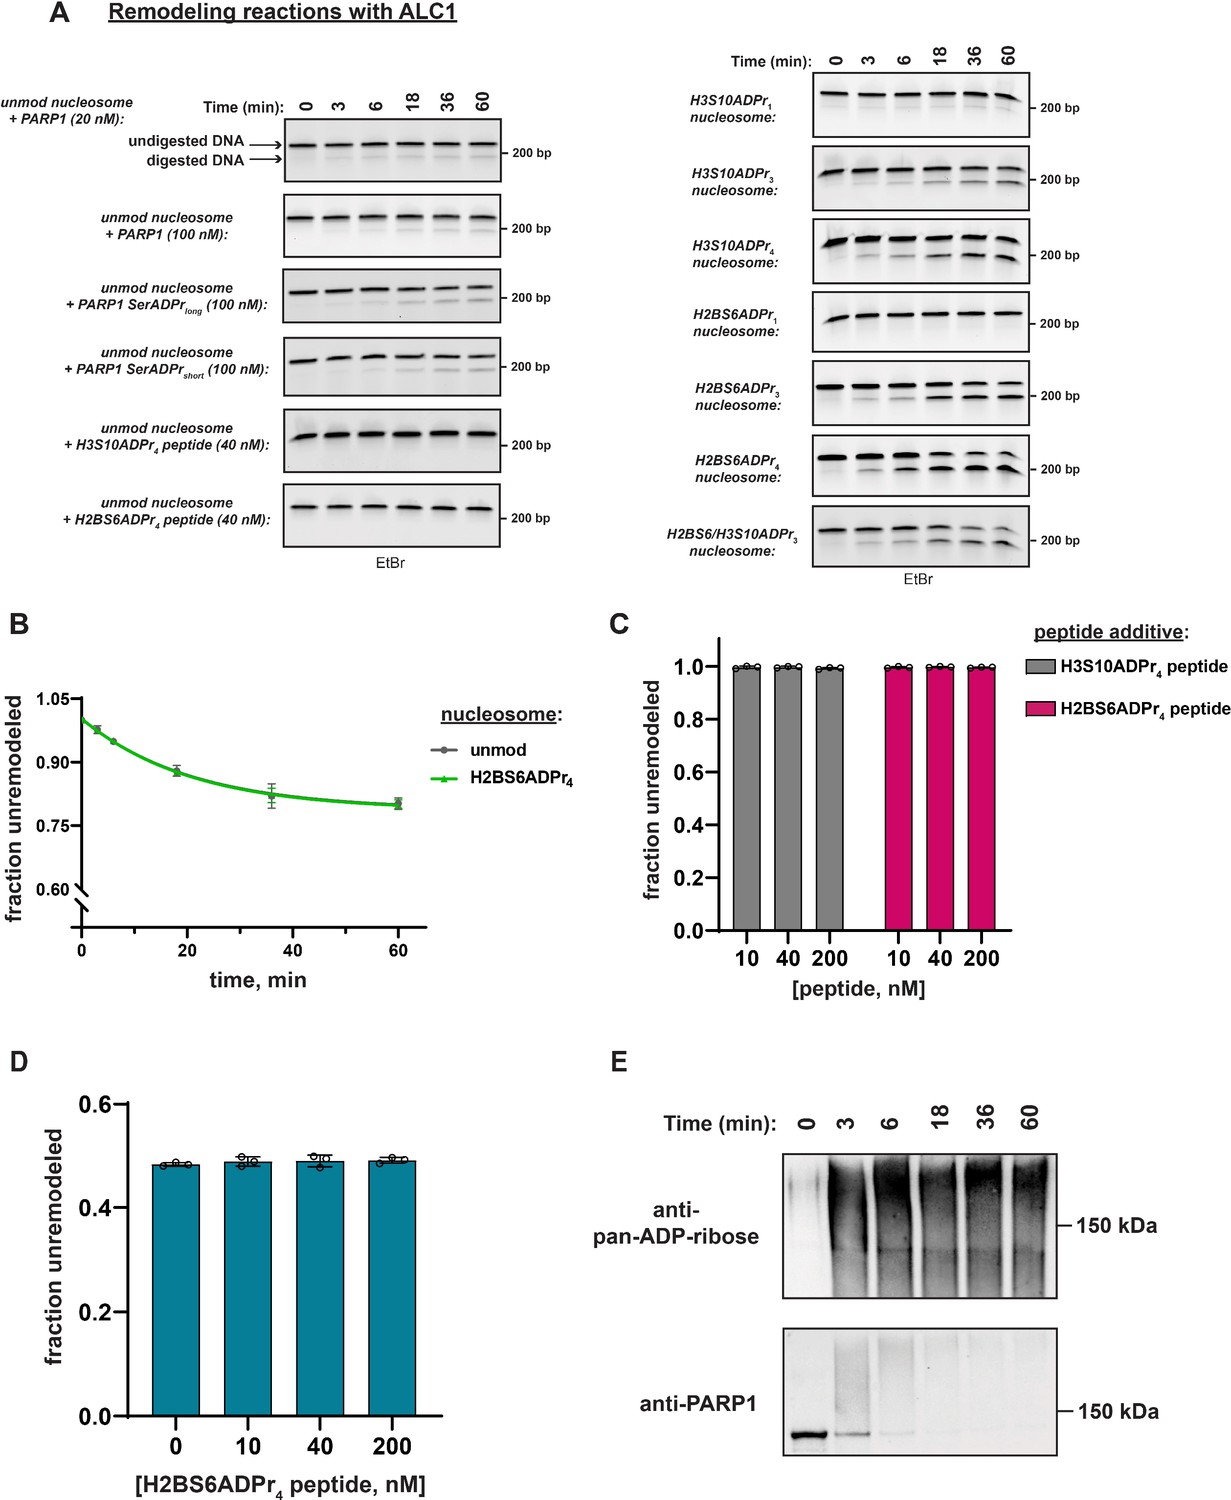
Characterization of ALC1 remodeling activity in presence of various macrodomain ligands.
(A) Representative TBE gel analyses corresponding to recombinant ALC1 time course remodeling activity assay on the indicated nucleosome substrates and peptide additives where applicable. Densitometry values are included in Supplementary Dataset. EtBr = ethidium bromide stain. (B) ALC1(1–673) nucleosome remodeling assay time-course for unmodified and H2BS6ADPr4 nucleosome substrates, each at a concentration of 20 nM. The curves represent fit of the data into a non-linear regression model for one-phase exponential decay. (C) Single time-point (1 h) ALC1 nucleosome remodeling assay wherein each reaction comprises ALC1, an unmodified nucleosome substrate (20 nM), the indicated PARP1 concentration, and NAD+ (2 mM). Data are represented as mean ± s.d. (n = 3). (D) Single time-point (1 h) ALC1 nucleosome remodeling assay wherein each reaction comprises ALC1, H2BS6ADPr4 nucleosome substrate (20 nM), and the indicated concentration of H2BS6ADPr4 peptide. Data are represented as mean ± s.d. (n = 3). (E) PARP1 and pan-ADP-ribose western blot analyses following an ALC1 remodeling reaction time-course that includes unmodified nucleosome, PARP1 (20 nM), and NAD+.
-
Figure 5—figure supplement 1—source data 1
Uncropped TBE gels and western blot from Figure 5—figure supplement 1.
- https://cdn.elifesciences.org/articles/71502/elife-71502-fig5-figsupp1-data1-v3.zip
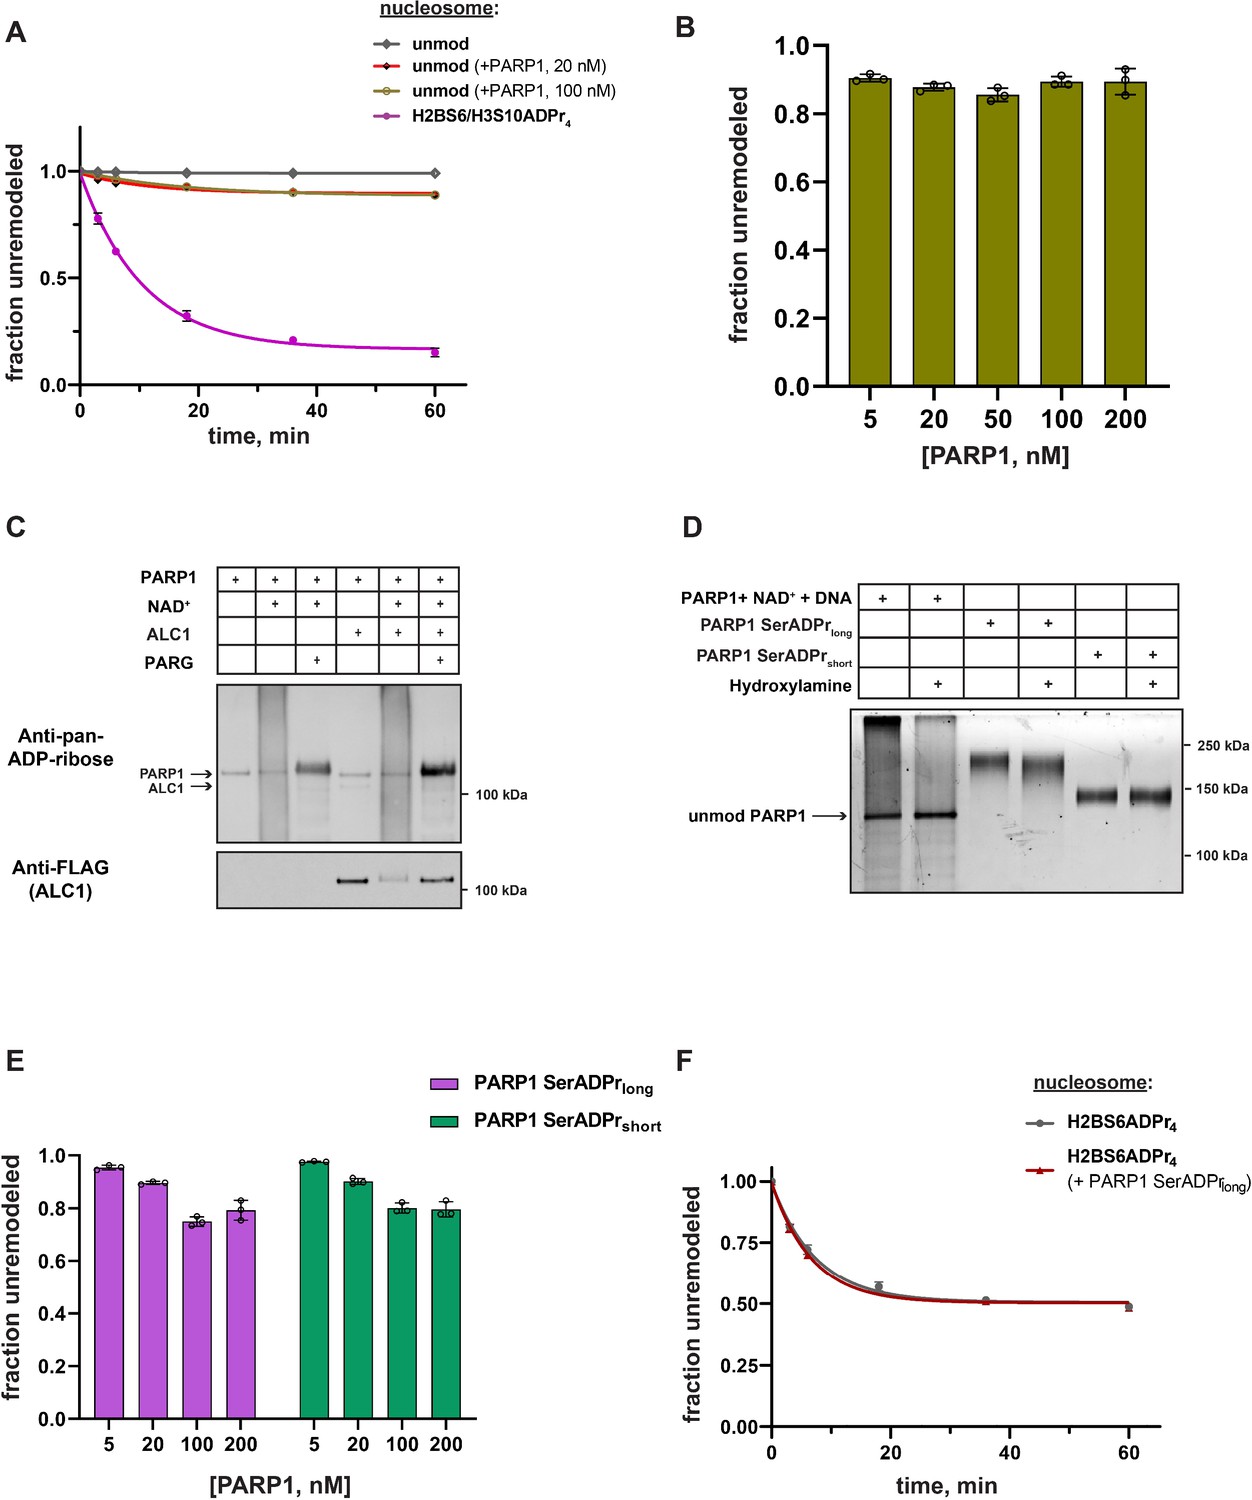
Figure 5—figure supplement 2
Characterization of ALC1 remodeling activity in presence of automodified PARP1.
(A) ALC1 nucleosome remodeling assay time-course wherein each reaction comprises ALC1 and the indicated nucleosome (20 nM), and the indicated automodified PARP1 concentration. The H2BS6/H3S10ADPr4 nucleosome remodeling data is included for direct comparison. (B) Single time-point (1 h) ALC1 nucleosome remodeling assay wherein each reaction comprises ALC1, an unmodified nucleosome substrate (20 nM), and the indicated automodified PARP1 concentration. Data are represented as mean ± s.d. (n = 3). (C) Pan-ADP-ribose and FLAG western blot analyses of nucleosome remodeling reactions (1 hr) containing the indicated components. PARG was added at a concentration of 1 μM. (D) Silver-stained gel image depicting the effect of hydroxylamine treatment on ADP-ribosylated PARP1 modified under different conditions, with and without HPF1. (E) Single time-point (1 h) ALC1 nucleosome remodeling assay wherein each reaction comprises ALC1, an unmodified nucleosome substrate (20 nM), and the indicated serine-auto-ADP-ribosylated PARP1 concentration. Data are represented as mean ± s.d. (n = 3). (F) ALC1 nucleosome remodeling assay time-course wherein each reaction comprises H2BS6ADPr4 nucleosome substrate at a concentration of 20 nM, with or without PARP1 SerADPrlong (100 nM). The curves represent fit of the data into a non-linear regression model for one-phase exponential decay.
-
Figure 5—figure supplement 2—source data 1
Uncropped western blot from Figure 5—figure supplement 2.
- https://cdn.elifesciences.org/articles/71502/elife-71502-fig5-figsupp2-data1-v3.zip
Figure 6 with 1 supplement
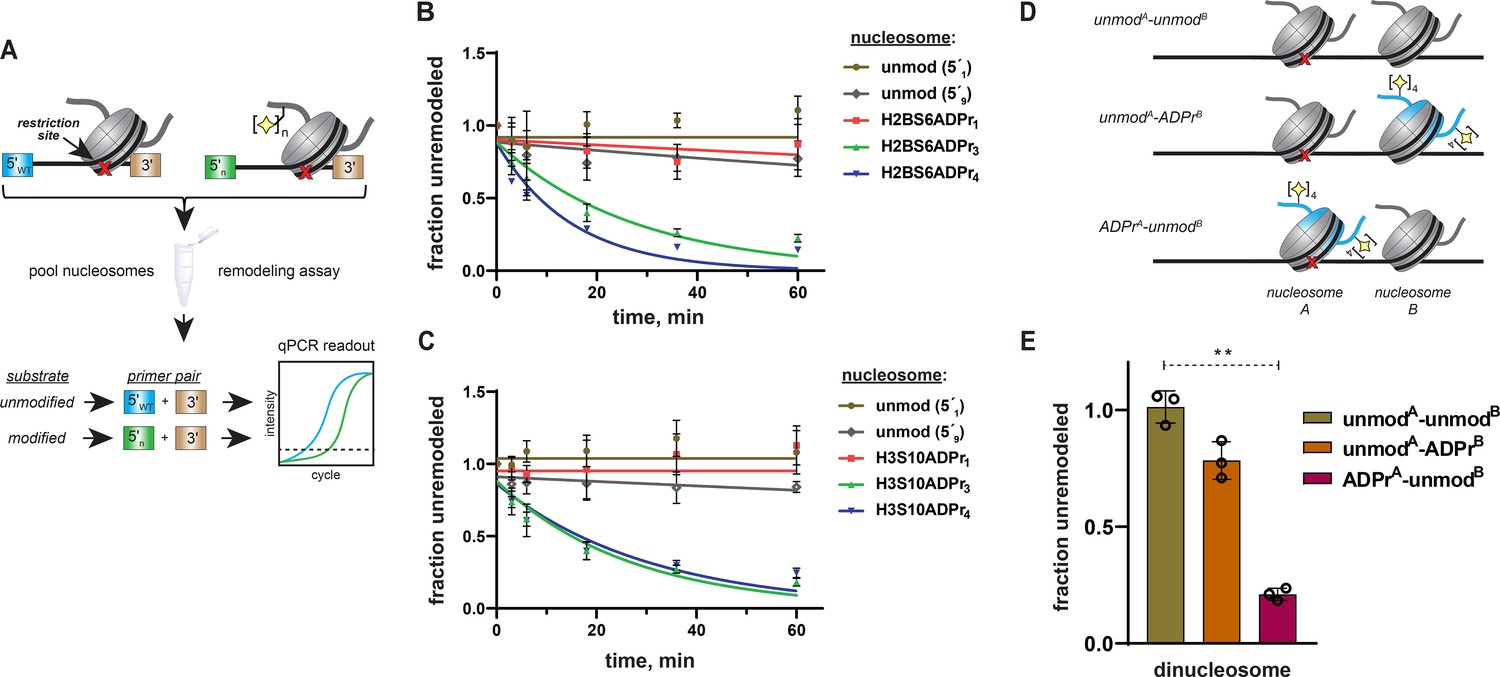
Specificity of ALC1 is preserved in heterogenous nucleosome populations and on asymmetrically ADP-ribosylated dinucleosome substrates.
(A) Schematic depicting the strategy to prepare heterogenous nucleosome substrate pools and determine ALC1 remodeling activity on specific nucleosomes. (B) ALC1 nucleosome remodeling assay time-course for each nucleosome in the histone H2B mixed substrate pool. Two unmodified nucleosomes with different 5′ primer sequences (5′1 and 5′9) were included as internal controls. (C) As in (B), but with the histone H3 substrate pool. (D) A diagram depicting the various dinucleosome constructs assembled in this study. Blue shade represents the modified histone H2B, the red cross represents the PstI restriction site and the yellow star represents the ADP-ribose modification. (E), Chromatin remodeling assays with ALC1 on the indicated dinucleosome substrates. ** indicates p-value < 0.001, obtained using an unpaired Student’s t-test with Welch’s correction. Data in (B), (C), and (E) are represented as mean ± s.d. (n = 3). Curves in (B) and (C) represent data fitting to a non-linear regression model for one-phase exponential decay.
Figure 6—figure supplement 1

ALC1 remodeling analysis on heterogenous nucleosome populations.
(A) Primer efficiency curves corresponding to all primer:template pairs described in Figure 6B and C. (B) Native TBE gel analysis of dinucleosome assembly, which depicts ligation efficiency. EtBr = ethidium bromide stain. (C) Representative TBE gel analysis corresponding to ALC1 remodeling activity observed on the indicated dinucleosome substrates. Densitometry values are included in Supplementary Dataset.
-
Figure 6—figure supplement 1—source data 1
Uncropped TBE gels from Figure 6—figure supplement 1.
- https://cdn.elifesciences.org/articles/71502/elife-71502-fig6-figsupp1-data1-v3.zip
Figure 7 with 1 supplement
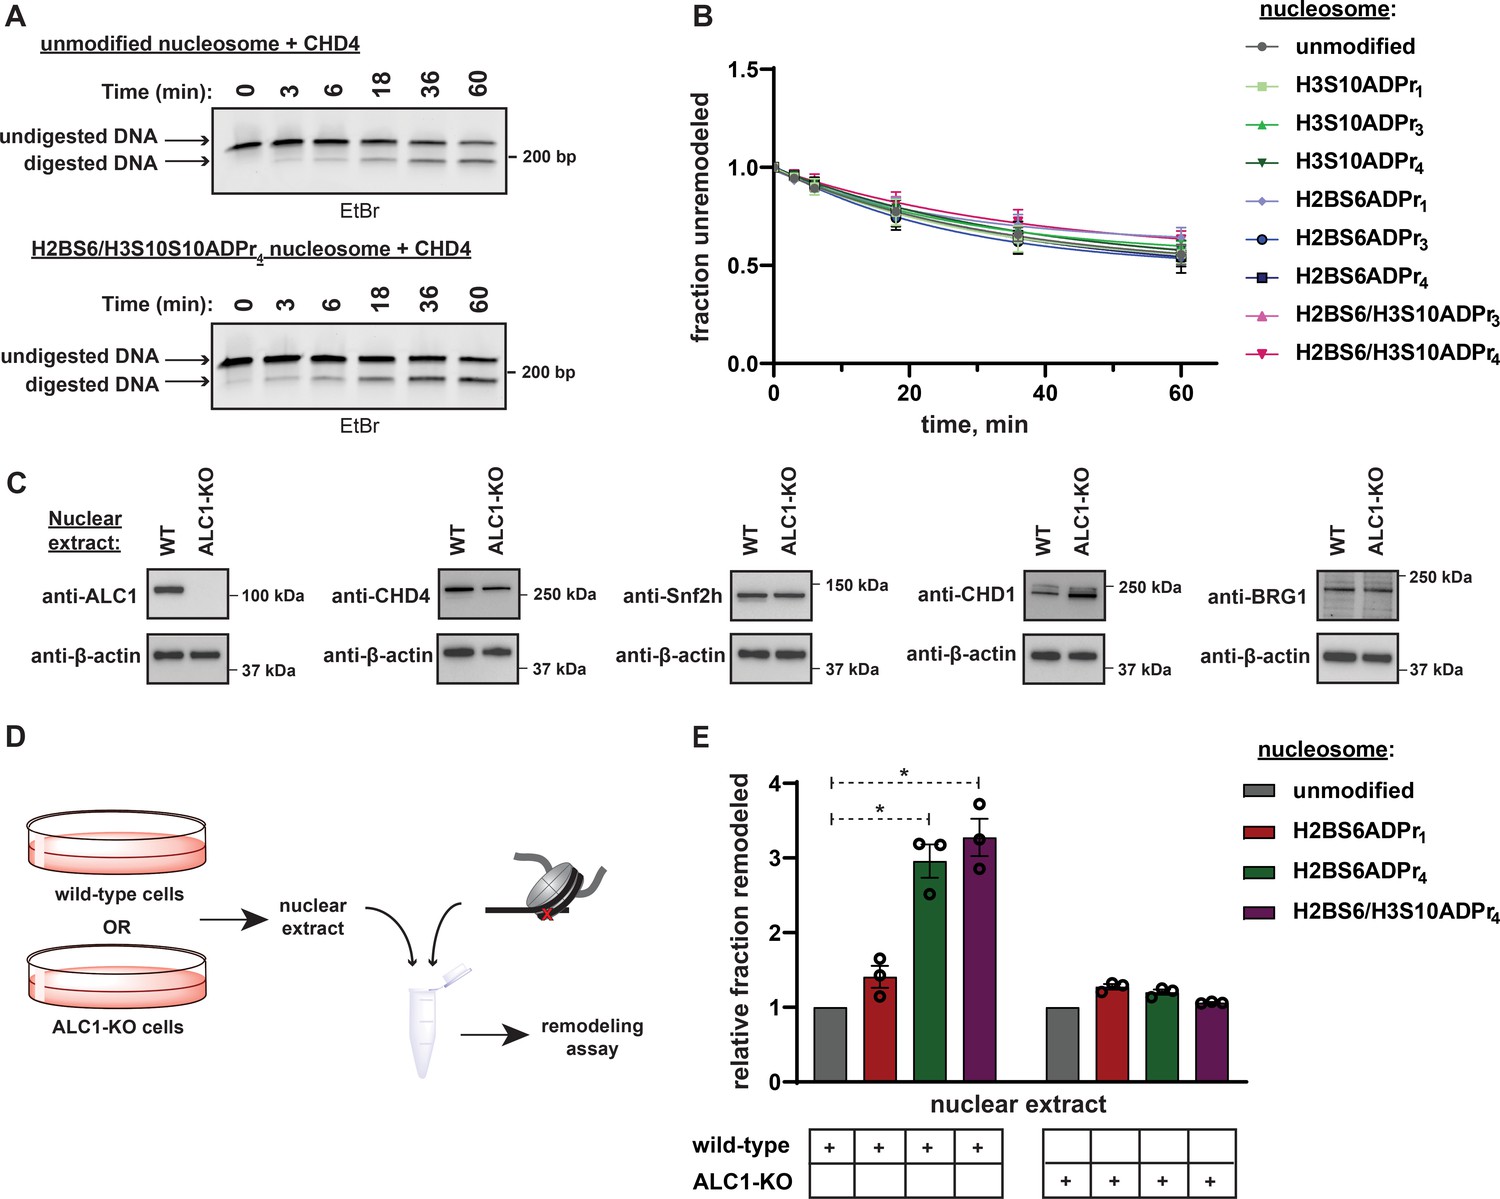
Nucleosome serine ADPr stimulates ALC1-dependent chromatin remodeling activity in nuclear extracts.
(A) Representative TBE gel analysis from a REA assay corresponding to recombinant CHD4 chromatin remodeling activity on unmodified or H2BS6/H3S10ADPr4 nucleosomes. (B) CHD4 nucleosome remodeling assay time-course wherein each reaction comprises CHD4 and the indicated nucleosome substrate. Data are represented as mean ± s.d. (n = 3). Curves represent fit of data into a non-linear regression model for one-phase exponential decay. (C) Western blot analysis demonstrating the presence of various chromatin remodelers in the wild-type or ALC1 knock-out (KO) HEK293T nuclear extracts. (D) Schematic depicting the strategy to analyze chromatin remodeling activity in wild-type or ALC1-KO HEK293T nuclear extracts. (E) Nuclear extract nucleosome remodeling activity assay wherein each reaction comprises the indicated nucleosome substrate and wild-type or ALC1-KO HEK293T cell nuclear extracts. Total remodeling for each ADP-ribosylated nucleosome substrate relative to the unmodified nucleosome substrate in the respective nuclear extract is shown. Data are represented as mean ± s.e.m. (n = 3). * indicates p-value < 0.02, obtained using an unpaired Student’s t-test with Welch’s correction.
-
Figure 7—source data 1
Uncropped TBE gels and western blots from Figure 7.
- https://cdn.elifesciences.org/articles/71502/elife-71502-fig7-data1-v3.zip
Figure 7—figure supplement 1

H3S10ADPr and H2BS6ADPr specifically sensitize nucleosomes to chromatin remodeling by ALC1.
(A) BLAST alignment of the ATPase domains from ALC1 (amino acids 60–497) and CHD4 (amino acids 738–1202). (B) Representative TBE gel analyses corresponding to recombinant CHD4 time course remodeling activity assay on the indicated nucleosome substrates. Densitometry values are included in Supplementary Dataset. EtBr = ethidium bromide stain. (C) Representative TBE gel analyses corresponding to wild-type or ALC1 knock-out (KO) HEK293T nuclear extract chromatin remodeling activity on the indicated nucleosome substrates. Densitometry values are included in Supplementary Dataset. EtBr = ethidium bromide stain. (D) Western blot showing the effect of incubating nucleosomes with or without nuclear extract on the ADPr status of the nucleosomes. (E) Values for fraction remodeled for each nucleosome substrate in the respective nuclear extract for the experiment in (C). Data are represented as mean ± s.e.m. (n = 3).
-
Figure 7—figure supplement 1—source data 1
Uncropped TBE gels and western blots from Figure 7-figure supplement 1.
- https://cdn.elifesciences.org/articles/71502/elife-71502-fig7-figsupp1-data1-v3.zip
Tables
Key resources table
| Reagent type (species) or resource | Designation | Source or reference | Identifiers | Additional information |
|---|---|---|---|---|
| Recombinant DNA reagent | PARP1 (pACEBac1) (plasmid) | This study | See Materials and methods | |
| Recombinant DNA reagent | PARP2 (pACEBac1) (plasmid) | Addgene | 111,574 | |
| Recombinant DNA reagent | HPF1 (pET30) (plasmid) | This study | See Materials and methods | |
| Recombinant DNA reagent | HPF1D283A (pET30) (plasmid) | This study | See Materials and methods | |
| Recombinant DNA reagent | ARH3 (pET30) (plasmid) | Addgene | 111,578 | |
| Recombinant DNA reagent | PARG (pET30) (plasmid) | This study | See Materials and methods | |
| Recombinant DNA reagent | ALC1 macrodomain (pET30) (plasmid) | This study | See Materials and methods | |
| Recombinant DNA reagent | ALC1 ATPase domain (pET30) (plasmid) | This study | See Materials and methods | |
| Recombinant DNA reagent | ALC1 (pACEBac1) (plasmid) | This study | See Materials and methods | |
| Recombinant DNA reagent | CHD4 (pACEBac1) (plasmid) | This study | See Materials and methods | |
| Recombinant DNA reagent | Histone H2A (pET30) (plasmid) | This study | See Materials and methods | |
| Recombinant DNA reagent | Histone H2B (pET30) (plasmid) | This study | See Materials and methods | |
| Recombinant DNA reagent | Histone H2B truncated (pET30) (plasmid) | This study | See Materials and methods | |
| Recombinant DNA reagent | Histone H3 (pET30) (plasmid) | This study | See Materials and methods | |
| Recombinant DNA reagent | Histone H3 truncated (pET30) (plasmid) | This study | See Materials and methods | |
| Recombinant DNA reagent | Histone H4 (pET30) (plasmid) | This study | See Materials and methods | |
| Sequence-based reagent | DNA oligonucleotides | This study | See Supplementary file 10 | |
| Antibody | Antibodies used for western blot | See Supplementary file 11 | ||
| Strain, strain background (Escherichia coli) | Mach1 (Escherichia coli) | ThermoFisher | C862003 | |
| Strain, strain background (Escherichia coli) | DH10Bac | ThermoFisher | 10361012 | |
| Strain, strain background (Escherichia coli) | Rosetta 2 | Sigma Aldrich | 714,023 | |
| Cell line (Spodoptera frugiperda) | Sf9 | ThermoFisher | 11496015 | |
| Cell line (Homo sapiens) | HEK293T | ATCC | CRL-3216 | |
| Peptide, recombinant protein | FLAG peptide | GenScript | RP10586-1 | Sequence:DYKDDDDK |
| Commercial assay or kit | Gibson Assembly Master Mix | New England Biolabs (NEB) | E2611S | |
| Commercial assay or kit | iTaq Universal SYBR Green Supermix | BioRad | 1725121 | |
| Commercial assay or kit | Pierce BCA Protein Assay Kit | ThermoFisher | 23,227 | |
| Chemical compound, drug | β-Nicotinamide adenine dinucleotide hydrate | Sigma Aldrich | N0632 | |
| Chemical compound, drug | Adenosine triphosphate | Sigma Aldrich | A26209-1G | |
| Chemical compound, drug | HisPur Ni-NTA Resin | ThermoFisher | 88,223 | |
| Chemical compound, drug | Anti-FLAG M2 Magnetic beads | Millipore Sigma | M8823-5ML | |
| Chemical compound, drug | Phusion High-Fidelity DNA Polymerase | NEB | M0530L | |
| Chemical compound, drug | PstI enzyme | NEB | R0140M | |
| Chemical compound, drug | DraIII enzyme | NEB | R3510S | |
| Chemical compound, drug | T4 Polynucleotide Kinase | NEB | M0201S | |
| Chemical compound, drug | T4 DNA Ligase | NEB | M0202L | |
| Chemical compound, drug | Cellfectin II Reagent | ThermoFisher | 10362100 | |
| Chemical compound, drug | Sf-900 II SFM Media | ThermoFisher | 10902096 | |
| Chemical compound, drug | Fetal Bovine Serum | ThermoFisher | 10438026 | |
| Chemical compound, drug | DMEM, high glucose, pyruvate | ThermoFisher | 11995065 | |
| Chemical compound, drug | Penicillin-Streptomycin | ThermoFisher | 15140122 | |
| Chemical compound, drug | Lipofectamine 2000 | ThermoFisher | 11-668-019 | |
| Chemical compound, drug | Puromycin dihydrochloride | ThermoFisher | A1113803 | |
| Chemical compound, drug | Hydroxylamine hydrochloride | Sigma Aldrich | 379,921 | |
| Chemical compound, drug | N,N-dimethylformamide | Oakwood Chemical | 046776 | |
| Chemical compound, drug | Dichloromethane | Oakwood Chemical | 035912 | |
| Chemical compound, drug | Trifluoroacetic acid | Oakwood Chemical | 102,164 | |
| Chemical compound, drug | Acetonitrile | Oakwood Chemical | 099891 | |
| Chemical compound, drug | Formic Acid, LC/MS Grade | Thermo Fisher | A117-50 | |
| Chemical compound, drug | N,N'-Diisopropylcarbodiimide | Oakwood Chemical | M02889 | |
| Chemical compound, drug | Ethyl cyanohydroxyiminoacetate | Oakwood Chemical | 043278 | |
| Chemical compound, drug | N,N-Diisopropylethylamine | Sigma Aldrich | 496,219 | |
| Chemical compound, drug | Thionyl chloride | Sigma Aldrich | 230,464 | |
| Chemical compound, drug | Triisopropylsilane | Sigma Aldrich | 233,781 | |
| Chemical compound, drug | Piperidine | Sigma Aldrich | 104,094 | |
| Chemical compound, drug | PyAOP | Oakwood Chemical | 024898 | |
| Chemical compound, drug | Econo-Pac Chromatography Columns | Bio-Rad | 7321011 | |
| Chemical compound, drug | Sodium nitrite | Sigma Aldrich | 237,213 | |
| Chemical compound, drug | TCEP | GoldBio | TCEP50 | |
| Chemical compound, drug | Sodium 2-mercaptoethanesulfonate | Sigma Aldrich | 63,705 | |
| Chemical compound, drug | 2,2,2-Trifluoroethanethiol | Sigma Aldrich | 374008–1 G | |
| Chemical compound, drug | Trityl-OH ChemMatrix | Biotage | 7-420-1310 | |
| Chemical compound, drug | Rink-Amide-ChemMatrix | Biotage | 7-600-1310 | |
| Chemical compound, drug | Fmoc-Ala-OH | Oakwood Chemical | M03347 | |
| Chemical compound, drug | Fmoc-Arg(pbf)-OH | Oakwood Chemical | M03398 | |
| Chemical compound, drug | Fmoc-Thr(tBu)-OH | Oakwood Chemical | M03389 | |
| Chemical compound, drug | Fmoc-Lys(Boc)-OH | Oakwood Chemical | M03419 | |
| Chemical compound, drug | Fmoc-Gln(trt)-OH | Combi-Blocks | QB-0626 | |
| Chemical compound, drug | Fmoc-Ser(tBu)-OH | Combi-Blocks | SS-0149 | |
| Chemical compound, drug | Fmoc-Gly-OH | Oakwood Chemical | M03361 | |
| Chemical compound, drug | Fmoc-Leu-OH | Oakwood Chemical | M03365 | |
| Chemical compound, drug | Fmoc-Pro-OH | Oakwood Chemical | M03372 | |
| Chemical compound, drug | Fmoc-Cys(Trt)-OH | Oakwood Chemical | M03395 | |
| Chemical compound, drug | Boc-L-thiazolidine-4-carboxylic acid | Combi-Blocks | SS-9673 | |
| Chemical compound, drug | 5 (6)-Carboxyfluorescein | Sigma Aldrich | 21877–1 G-F | |
| Chemical compound, drug | SEA-PS Resin | Iris Biotech | 8551520001 | |
| Software, algorithm | Prism | GraphPad | ||
| Software, algorithm | Fiji Image J | Open source | ||
| Software, algorithm | Microsoft Office | Microsoft | ||
| Software, algorithm | Adobe Creative Cloud | Adobe | ||
| Software, algorithm | SnapGene | GSL Biotech LLC | ||
| Software, algorithm | ChemDraw | PerkinElmer | ||
| Software, algorithm | BLAST | NCBI | ||
| Other | Liberty Blue Automated Peptide Synthesizer | CEM | 925,600 | |
| Other | Agilent 1,260 Infinity II with quaternary pump and variable wavelength detector | Agilent | G7111B/G7114A | |
| Other | Agilent 1,260 Infinity II with preparatory pump and variable wavelength detector | Agilent | G7161A/G7114A | |
| Other | Agilent LC/MSD | Agilent | G6125BA | |
| Other | X500B QTOF | Sciex | X500B QTOF | |
| Other | 300 SB-C18, 4.6 × 100 mm, 3.5 um | Agilent | 861973–902 | |
| Other | XBridge Peptide C18 column, 5 um, 4.6 mm x 150 mm | Waters | 186003624 | |
| Other | XBridge Peptide C18 column, 5 um, 10 mm x 250 mm | Waters | 186008193 | |
| Other | XBridge Peptide C18 column, 10 um, 19 mm x 250 mm | Waters | 186003673 | |
| Other | AKTA pure 25 L | GE Healthcare | 29018224 | |
| Other | AKTA start | GE Healthcare | 29237234 | |
| Other | HiLoad 16/60 Superdex 200 pg | GE Healthcare | 28989335 | |
| Other | Superdex 200 Increase 10/300 GL | GE Healthcare | 28990944 | |
| Other | HiTrap Heparin HP | GE Healthcare | 17040701 | |
| Other | 5% Criterion TBE Polyacrylamide Gel | Bio-Rad | 3450048 | |
| Other | 4%–12% Criterion XT Bis-Tris Protein Gel, | Bio-Rad | 3450124 | |
| Other | Cytation 5 Imaging reader | Biotek | 17103120 | |
| Other | Green FP filter set: EX 485/20 | EM 528/20 | DM 510, polarizers | Biotek | 8040561 | |
| Other | Chemidoc MP Imaging System | Bio-Rad | 734BR2154 | |
| Other | CFX384 Real Time System C1000 Touch Thermal cycler | Bio-Rad | 786BR02877 |
Additional files
-
Supplementary file 1
RP-HPLC and ESI-MS characterization of all unmodified and ADP-ribosylated peptides described in this study.
- https://cdn.elifesciences.org/articles/71502/elife-71502-supp1-v3.pdf
-
Supplementary file 2
LC-MS/MS analysis of enzymatic digestion products from PAR chains installed on a peptide using our technology.
The spectra were produced on a Sciex QTRAP 6500+ mass spectrometer.
- https://cdn.elifesciences.org/articles/71502/elife-71502-supp2-v3.zip
-
Supplementary file 3
ESI-MS characterization of all fluorescein-labeled peptides described in this study.
- https://cdn.elifesciences.org/articles/71502/elife-71502-supp3-v3.pdf
-
Supplementary file 4
Affinity measurements from fluorescent polarization-based binding assays described in Figure 3.
- https://cdn.elifesciences.org/articles/71502/elife-71502-supp4-v3.docx
-
Supplementary file 5
RP-HPLC and ESI-MS characterization of all thioester peptides and corresponding ligation products described in this study.
- https://cdn.elifesciences.org/articles/71502/elife-71502-supp5-v3.pdf
-
Supplementary file 6
Chromatin remodeling rate constants for single-substrate assays with ALC1 and CHD4.
- https://cdn.elifesciences.org/articles/71502/elife-71502-supp6-v3.docx
-
Supplementary file 7
Chromatin remodeling rate constants for multi-substrate assays with ALC1.
- https://cdn.elifesciences.org/articles/71502/elife-71502-supp7-v3.docx
-
Supplementary file 8
Comparison of one-step and two-step enzymatic strategies to generate poly-ADP-ribosylated peptides.
A, Representative HPLC chromatogram corresponding to a reaction comprising 40 μM unmodified H2B (amino acids 1–16) peptide, 2 μM PARP1 and 10 μM HPF1. B, Representative HPLC chromatogram corresponding to a reaction comprising 40 μM H2BS6ADPr1 peptide and 2 μM PARP1. We observe that the presence of 10 μM HPF1, while necessary for maximum substrate turnover here, restricts the amount of poly-ADP-ribosylated products formed in the reaction. Hence, separation of the two enzymatic steps, that is, ‘priming’ of unmodified peptide with mono-ADP-ribose using PARP1:HPF1 and ‘elongation’ of mono-ADP-ribosylated peptide with PARP1, not only allows us to obtain longer ADP-ribose chains on the peptide but also makes the process more efficient in terms of resource consumption and yield.
- https://cdn.elifesciences.org/articles/71502/elife-71502-supp8-v3.docx
-
Supplementary file 9
Proof-of-concept for the strategy to synthesize site-specifically ADP-ribosylated proteins via C-terminal or sequential protein ligations.
A, A schematic depicting the strategy for C-terminal ligation of ADP-ribosylated peptides. SEA = bis(2-sulfanylethyl)amido functional group. B, ESI-MS and RP-HPLC characterization of a C-terminal ligation product which has tetra-ADP-ribose on S10 and S28 residues of the H3 peptide (amino acids 1–34), as well as a reduced C-terminal SEA moiety. RP-HPLC gradient is from 0%–80% Solvent B (2–22 min). The yellow star represents ADP-ribose modification. ‘n’ and ‘n׳’ represent the number of ADP-ribose units on the corresponding modification sites.
- https://cdn.elifesciences.org/articles/71502/elife-71502-supp9-v3.pdf
-
Supplementary file 10
Sequences of the various DNA oligonucleotides described in this study.
- https://cdn.elifesciences.org/articles/71502/elife-71502-supp10-v3.docx
-
Supplementary file 11
Details of the various antibodies used in this study.
- https://cdn.elifesciences.org/articles/71502/elife-71502-supp11-v3.docx
-
Transparent reporting form
- https://cdn.elifesciences.org/articles/71502/elife-71502-transrepform1-v3.pdf
Download links
A two-part list of links to download the article, or parts of the article, in various formats.
Downloads (link to download the article as PDF)
Open citations (links to open the citations from this article in various online reference manager services)
Cite this article (links to download the citations from this article in formats compatible with various reference manager tools)
Serine ADP-ribosylation marks nucleosomes for ALC1-dependent chromatin remodeling
eLife 10:e71502.
https://doi.org/10.7554/eLife.71502


