The transcription factor Xrp1 orchestrates both reduced translation and cell competition upon defective ribosome assembly or function
- Department of Genetics, Albert Einstein College of Medicine, United States
- Institute for Fundamental Biomedical Research, Biomedical Sciences Research Center "Alexander Fleming”, Greece
- Department of Developmental and Molecular Biology, Albert Einstein College of Medicine, United States
- Department of Opthalmology and Visual Sciences, Albert Einstein College of Medicine, United States
Figures
Figure 1 with 2 supplements
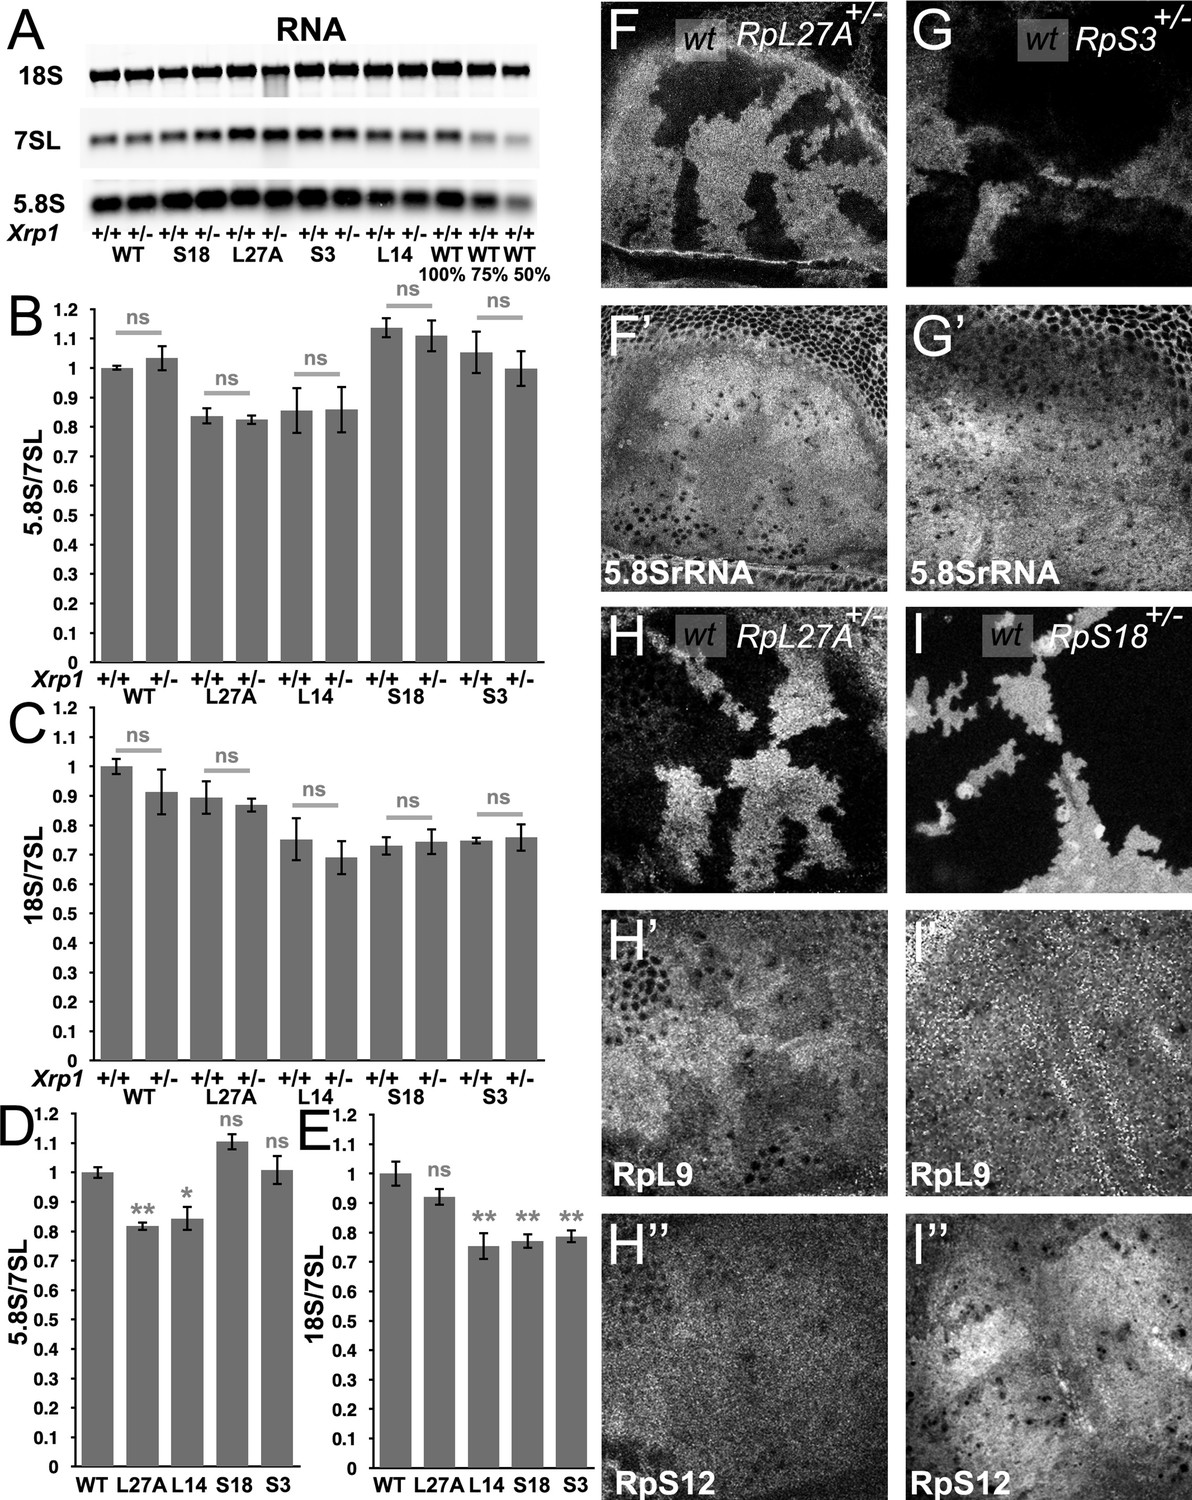
Modest changes in ribosomal subunit concentrations in Rp mutant wing discs.
(A) Similar amounts of wing disc RNA from indicated genotypes separated and transferred for northern blotting with, in this case, probes specific for the 18 S rRNA of the ribosomal SSU, the 7SL non-coding RNA for the Signal Recognition Particle, and the 5.8 S rRNA of the ribosomal LSU. Right-most two lanes show serial dilutions of the wild type sample. Panels B-E show signal quantification from multiple such northerns. (B) Xrp1 mutation did not affect LSU concentration in any Rp genotype. Significance shown only for Xrp1+/+ to Xrp1+/- between otherwise similar genotypes. Padj values were one in all cases. (C) Xrp1 mutation did not affect SSU concentration in any Rp genotype. Significance shown only for Xrp1+/+ to Xrp1+/- between otherwise similar genotypes. Padj values were one in all cases. (D) Two RpL mutations reduced LSU concentrations. Significance shown only for comparisons between mutant genotypes and the wild type. Exact Padj values were: 0.00423, 0.0117, 0.0877, 0.858 respectively. (E) Two RpS mutations, as well as RpL14, reduced SSU concentrations. Significance shown only for comparisons between mutant genotypes and the wild type. Exact Padj values were: 0.135, 0.000218, 0.000395, 0.000602 respectively. WT genotype: p{hs:FLP}/w118; p{arm:LacZ} FRT80B/+, Xrp1+/- genotype: p{hs:FLP}/w118; FRT82B Xrp1M2–73/+, L27A+/- genotype: p{hs:FLP}/ p{hs:FLP}; RpL27A- p{arm:LacZ}FRT40/+; FRT80B/+, L27A+/-; Xrp1+/- genotype: p{hs:FLP}/ p{hs:FLP}; RpL27A- p{arm:LacZ}FRT40/+; FRT82B Xrp1M2–73/+, L14+/- genotype: p{hs:FLP}/ p{hs:FLP}; FRT42/+; RpL141 /+, L14+/-; Xrp1+/- genotype: p{hs:FLP}/ p{hs:FLP}; FRT42/+; RpL141/ FRT82 B Xrp1M2–73, S3+/- genotype: p{hs:FLP}/ p{hs:FLP}; FRT42/+; FRT82 RpS3 p{arm:LacZ}/+, S3+/-; Xrp1+/- genotype: p{hs:FLP}/ p{hs:FLP}; FRT82 RpS3 p{arm:LacZ}/FRT82B Xrp1M2–73, S18+/- genotype: p{hs:FLP}/ p{hs:FLP}; FRT42 RpS18 p{ubi:GFP} /+; FRT80B/+, S18+/-; Xrp1+/- genotype: p{hs:FLP}/ p{hs:FLP}; FRT42 RpS18 p{ubi:GFP} /+; FRT82B Xrp1M2–73/+ Panels F-I show comparisons between antibody labelings of 5.8 S rRNA, anti-RpL9, or anti-RpS12 between wild type and Rp+/- cells in mosaic wing imaginal discs. (F,F’) RpL27A mutation reduced levels of 5.8SrRNA. (G,G’) RpS3 mutation had negligible effect on 5.8 S rRNA levels. (H,H’,H”) RpL27A mutation reduced levels of the LSU component RpL9 but a small effect on the SSU component RpS12. (I,I’,I”) RpS18 mutation reduced levels of the SSU component RpS12 but not of the LSU component RpL9. Statistics:One-way Anova with Bonferroni-Holm multiple comparison correction was performed for panels B-E, which were each based on three biological replicates. ns - p ≥ 0.05.* - p < 0.05.** - p < 0.01. Genotypes: F, H: p{hs:FLP}/ p{hs:FLP}; RpL27A- p{arm:LacZ} FRT40/FRT40, G: p{hs:FLP}/ p{hs:FLP}; FRT82 RpS3 p{arm:LacZ} /FRT82B, I: p{hs:FLP}/ p{hs:FLP}; FRT42 RpS18 p{Ubi:GFP}/FRT42.
-
Figure 1—source data 1
Full and unedited blots corresponding to panel A.
- https://cdn.elifesciences.org/articles/71705/elife-71705-fig1-data1-v3.pdf
-
Figure 1—source data 2
Northern data underlying panels B-E.
- https://cdn.elifesciences.org/articles/71705/elife-71705-fig1-data2-v3.xlsx
Figure 1—figure supplement 1
Cytoplasmic location of ribosome components.
Specimens including those from Figure 1F and G showing the nuclear channel that was recorded simultaneously in many experiments. (A) This very apical confocal plane passes through only a few nuclei, particularly in wild type cells, verifying that the anti-5.8S rRNA signal is predominantly cytoplasmic, consistent with mature LSU. (B) This very apical confocal plane largely excludes nuclei, verifying that the anti-5.8S rRNA signal is predominantly cytoplasmic, consistent with mature LSU. (C) This slightly less apical focal plane predominantly grazes nuclei only of wild type cells, verifying that little anti-5.8S rRNA signal is nuclear. (D) This very basal confocal plane, which largely excludes nuclei for wild type regions, shows no discernible difference in cytoplasmic anti-5.8S rRNA signal between wild type and RpS17/+ cells. Genotypes: A: p{hs:FLP}/ p{hs:FLP}; RpL27A- p{arm:LacZ} FRT40/FRT40, B,C: p{hs:FLP}/ p{hs:FLP}; FRT82 RpS3 p{arm:LacZ} /FRT82B, D: p{hs:FLP}/+; RpS17 p{arm:LacZ} FRT80B/FRT80B.
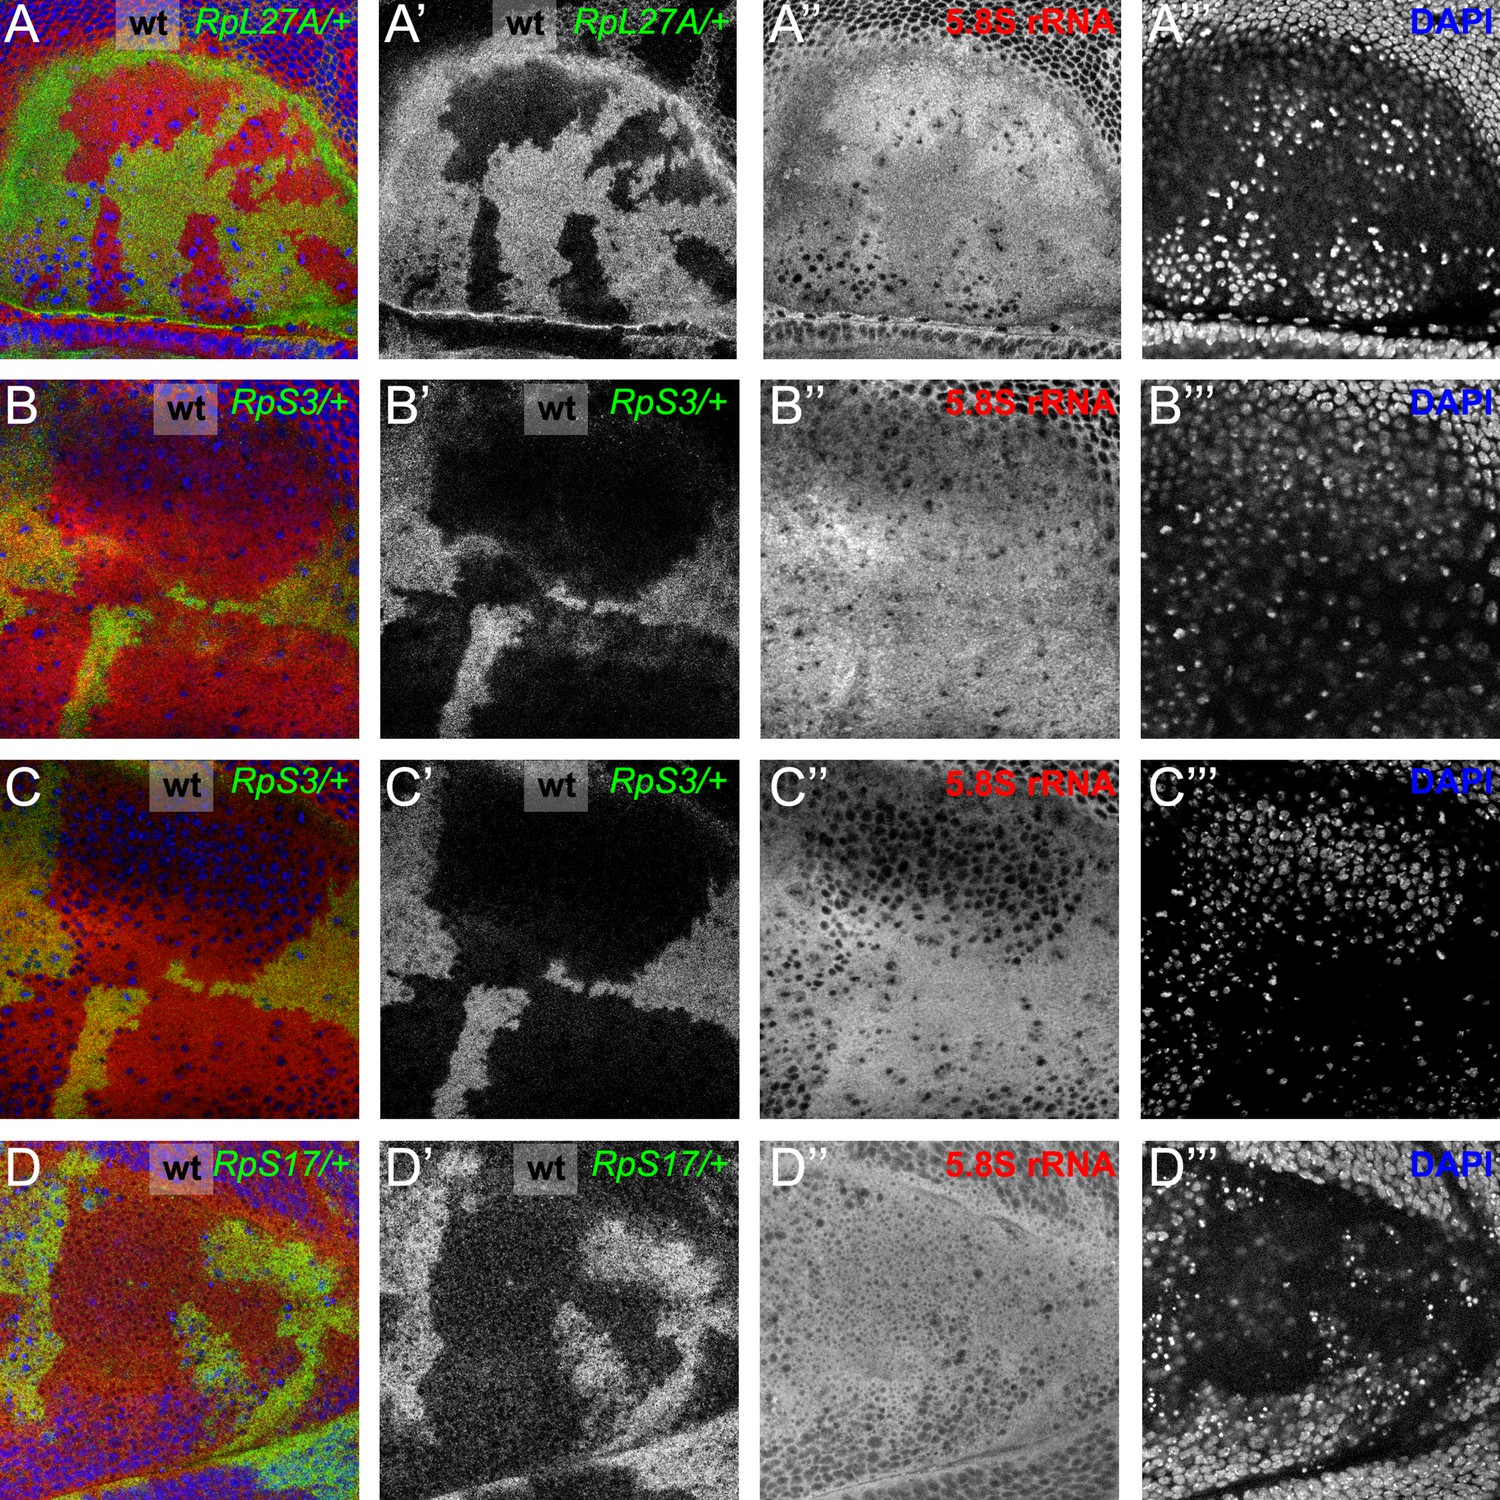
Figure 1—figure supplement 2
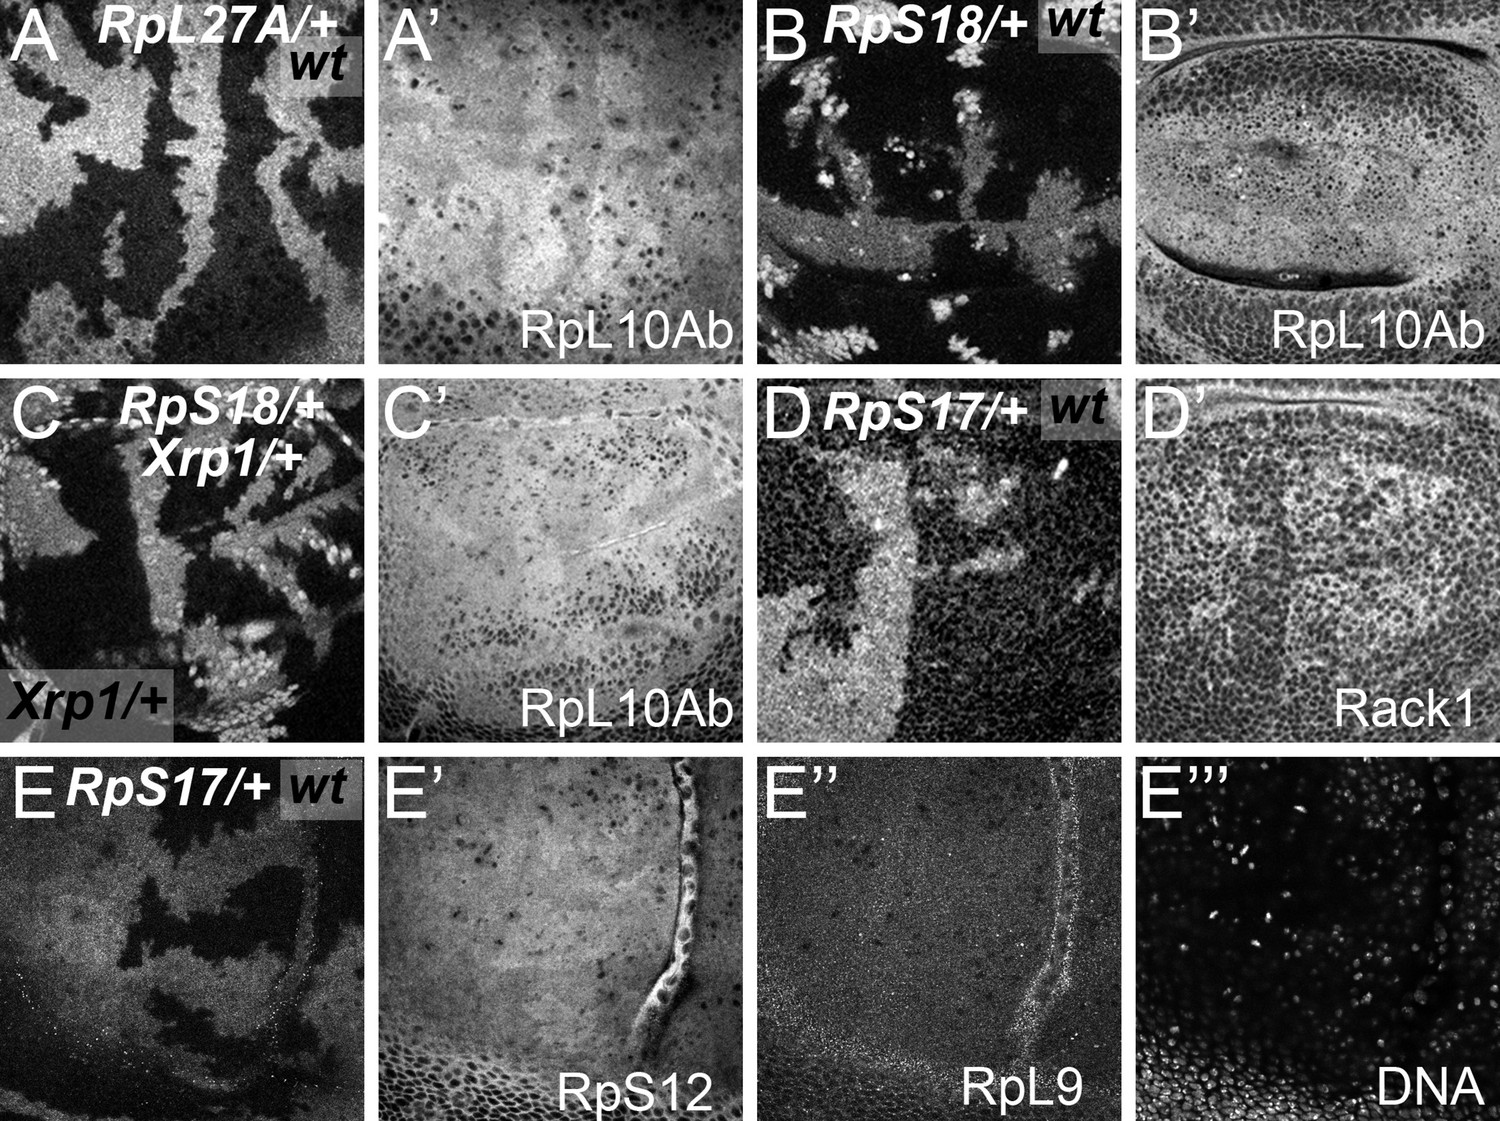
More examples of ribosome levels in Rp mutant genotypes.
Panels (A–E) show mosaic wing discs containing Rp+/+ cells (black) and cells of indicated Rp+/- genotypes (white). Panels (A’-E’ and E’’) show these same discs labelled with the antibodies against the indicated Rp. Panel E’’’ indicates DNA, in these cases indicating an apical confocal plane above most nuclei. (A) RpL27A+/- cells contained less of the LSU component RpL10Ab. (B) RpS18+/- cell contained more of the LSU component RpL10Ab. (C) RpS18+/- Xrp1+/- cells contained more of the LSU component RpL10Ab than RpS18+/+Xrp1+/- cells. (D) RpS17+/- cell contained less of the SSU component Rack1. (E) RpS17+/- cell contained less of the SSU component RpS12 but levels of the LSU component RpL9 were indistinguishable from RpS17+/+ cells. Genotypes: A: p{hs:FLP}/ p{hs:FLP}; RpL27A- p{arm:LacZ} FRT40/FRT40, B: p{hs:FLP}/ p{hs:FLP}; FRT42 RpS18 p{Ubi:GFP}/FRT42, C: p{hs:FLP}/ p{hs:FLP}; FRT42 RpS18 p{Ubi:GFP}/FRT42; FRT82B Xrp1M2-73/+,D-E: p{hs:FLP}/+; RpS17 p{arm:LacZ} FRT80B/FRT80B.
Figure 2 with 2 supplements
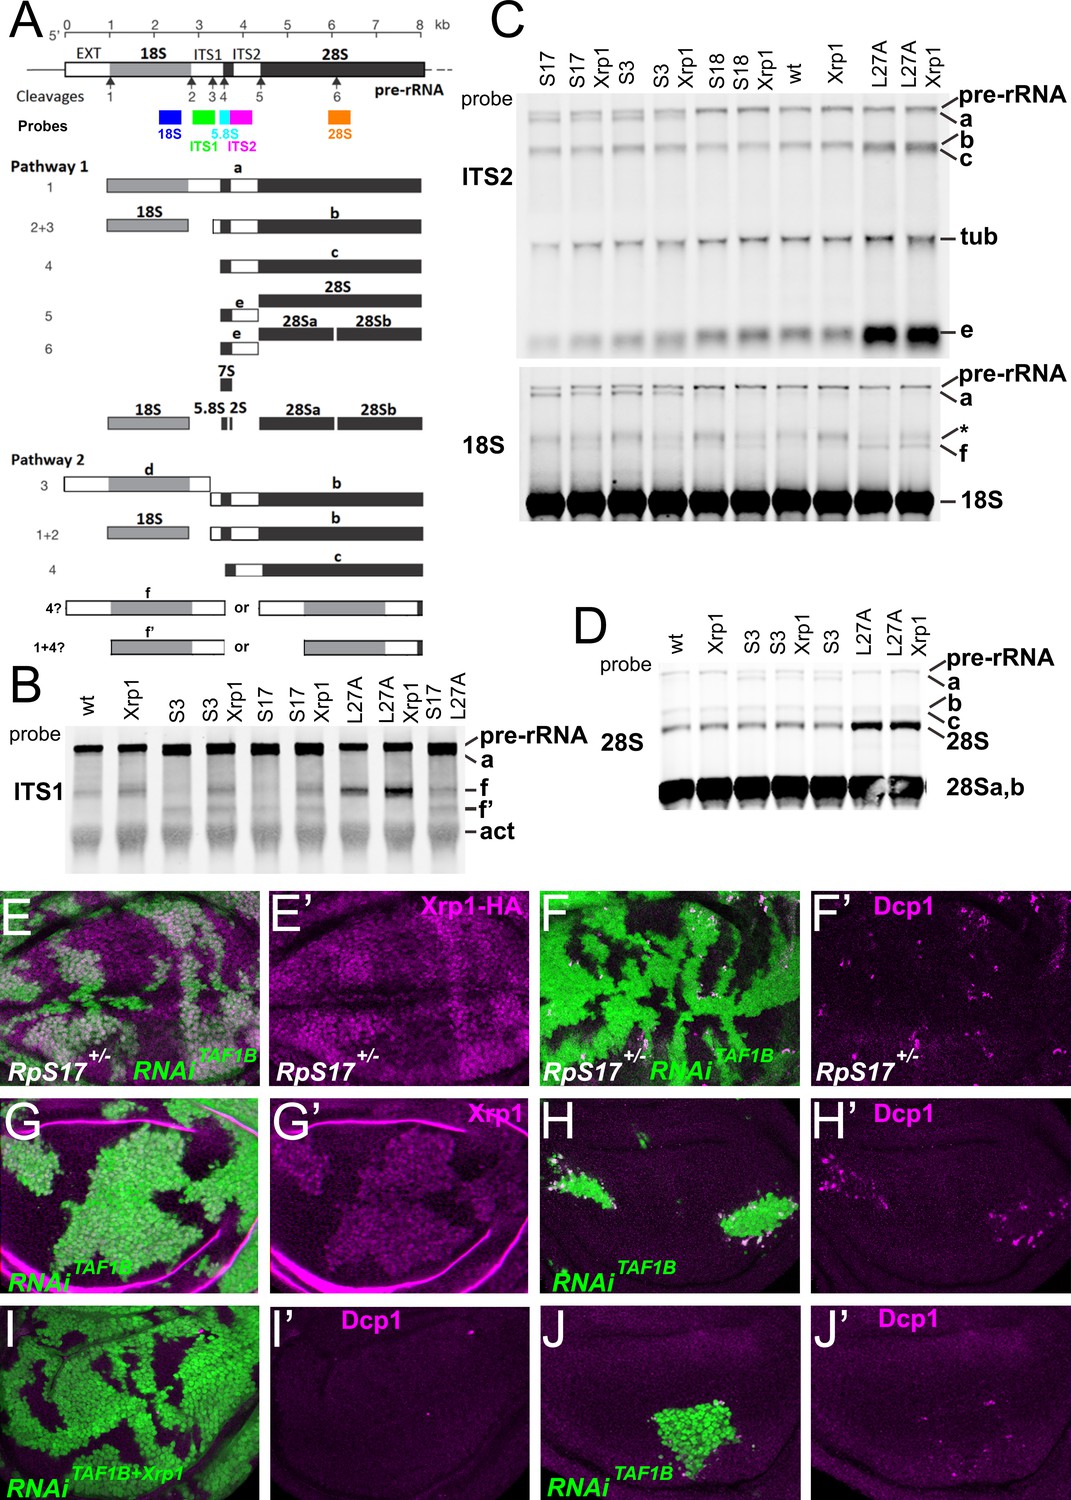
Ribosome biogenesis defects and their consequences.
(A) Two pathways of rRNA processing and the intermediates that result were characterized in D. melanogaster embryos by Long and Dawid. Mature 18 S, 5.8 S and 28Sa,b rRNAs are processed from the pre-RNA, along with the removal of two interval sequences ITS1 and ITS2. The cleavages sites were described by Long and Dawid. Colored boxes indicate the probes used in the present study. The 5.8 S probe overlaps with 147 bases at 3’of the ITS1 region, excluding cleavage site 3. Additional intermediates f and f’ were observed in the wing imaginal disc samples. These were recognized by ITS1, 5.8 S (Figure 2—figure supplement 1) and 18 S probe and therefore extended beyond the cleavage site 3, although whether beyond site four was uncertain. (B–D) Northern blots of total RNA purified from wild-type and Rp+/- wing discs, probed as indicated. (B) Reprobed with ITS1 after an initial actin probe. (C) Reprobed with ITS2 and then 18 S probes after an initial tubulin probe. Intermediates b, f and the 28 S rRNA (which in Drosophila is a precursor to the mature 28Sa and 28 Sb rRNAs) were detected in wild type and Xrp1+/- wing discs, other intermediates only in Rp+/- genotypes. RpS3+/- and RpS17+/- had lower levels of pre-RNA and intermediate (f) but accumulate intermediates (a) and (f’), which might indicate delays in cleavages 2 and 3. RpS18+/- had increased levels of pre-RNA and intermediate (f). RpL27+/- accumulated bands (b, c, e, and f) and 28 S. The effect on (f) suggests crosstalk between RpL27A and SSU processing. (E–I) show single confocal planes from mosaic third instar wing imaginal discs. (E) TAF1B depletion (green) increased Xrp1-HA levels in RpS17+/- discs (magenta, see also E’). (F) TAF1B depletion (green) increased in RpS17+/- discs led to cell death at the boundaries with undepleted cells (active Dcp1 staining in magenta, see also F’). (G) TAF1B depletion (green) also increased Xrp1 protein levels in RpS17+/+ discs (magenta, see also G’). (H) TAF1B depletion (green) led to cell death at the boundaries with undepleted cells (active Dcp1 staining in magenta, see also H’). (I) Co-depletion of Xrp1 with TAF1B (green) largely abolished cell death at the clone interfaces (active Dcp1 staining in magenta, see also I’). (J) Clones of cells depleted for TAF1B in parallel with panel I, showing reduced clones size and number (green), and competitive cells death at boundaries magenta, see also J’. Additional data related to this Figure is presented in Figure 2—figure supplement 1. Genotypes: Northerns: similar to Figure 1 and additionally: S17+/- genotype: p{hs:FLP}/ p{hs:FLP}; FRT42/+; FRT80 RpS17 p{arm:LacZ} /+, S17+/-; Xrp1+/- genotype: p{hs:FLP}/ p{hs:FLP}; FRT80 RpS17 p{arm:LacZ} /FRT82B Xrp1M2–73, S17+/-, L27A+/- genotype: p{hs:FLP}/ p{hs:FLP}; RpL27A- p{arm:LacZ} FRT40/+; FRT80 RpS17 p{arm:LacZ} /+, E, F: p{hs:FLP}/+; UAS- RNAiTAF1B /+;RpS17, act> CD2> Gal4, UAS-GFP /+ (line: v105873), G, H: p{hs:FLP}/+; UAS- RNAiTAF1B /+;act> CD2> Gal4, UAS- GFP /+ (line: Bl 61957), I: p{hs:FLP}/+; UAS- RNAiTAF1B /UAS-RNAiXrp1;act> CD2> Gal4, UAS- GFP /+ (line: Bl 61957), J: p{hs:FLP}/+; UAS- RNAiTAF1B /TRE-dsRed;act> CD2> Gal4, UAS- GFP /+ (line: Bl 61957) (processed in parallel with 2I).
-
Figure 2—source data 1
Full and unedited blots corresponding to panel B.
- https://cdn.elifesciences.org/articles/71705/elife-71705-fig2-data1-v3.pdf
-
Figure 2—source data 2
Full and unedited blots corresponding to panel C.
- https://cdn.elifesciences.org/articles/71705/elife-71705-fig2-data2-v3.pdf
-
Figure 2—source data 3
Full and unedited blots corresponding to panel D.
- https://cdn.elifesciences.org/articles/71705/elife-71705-fig2-data3-v3.pdf
Figure 2—figure supplement 1
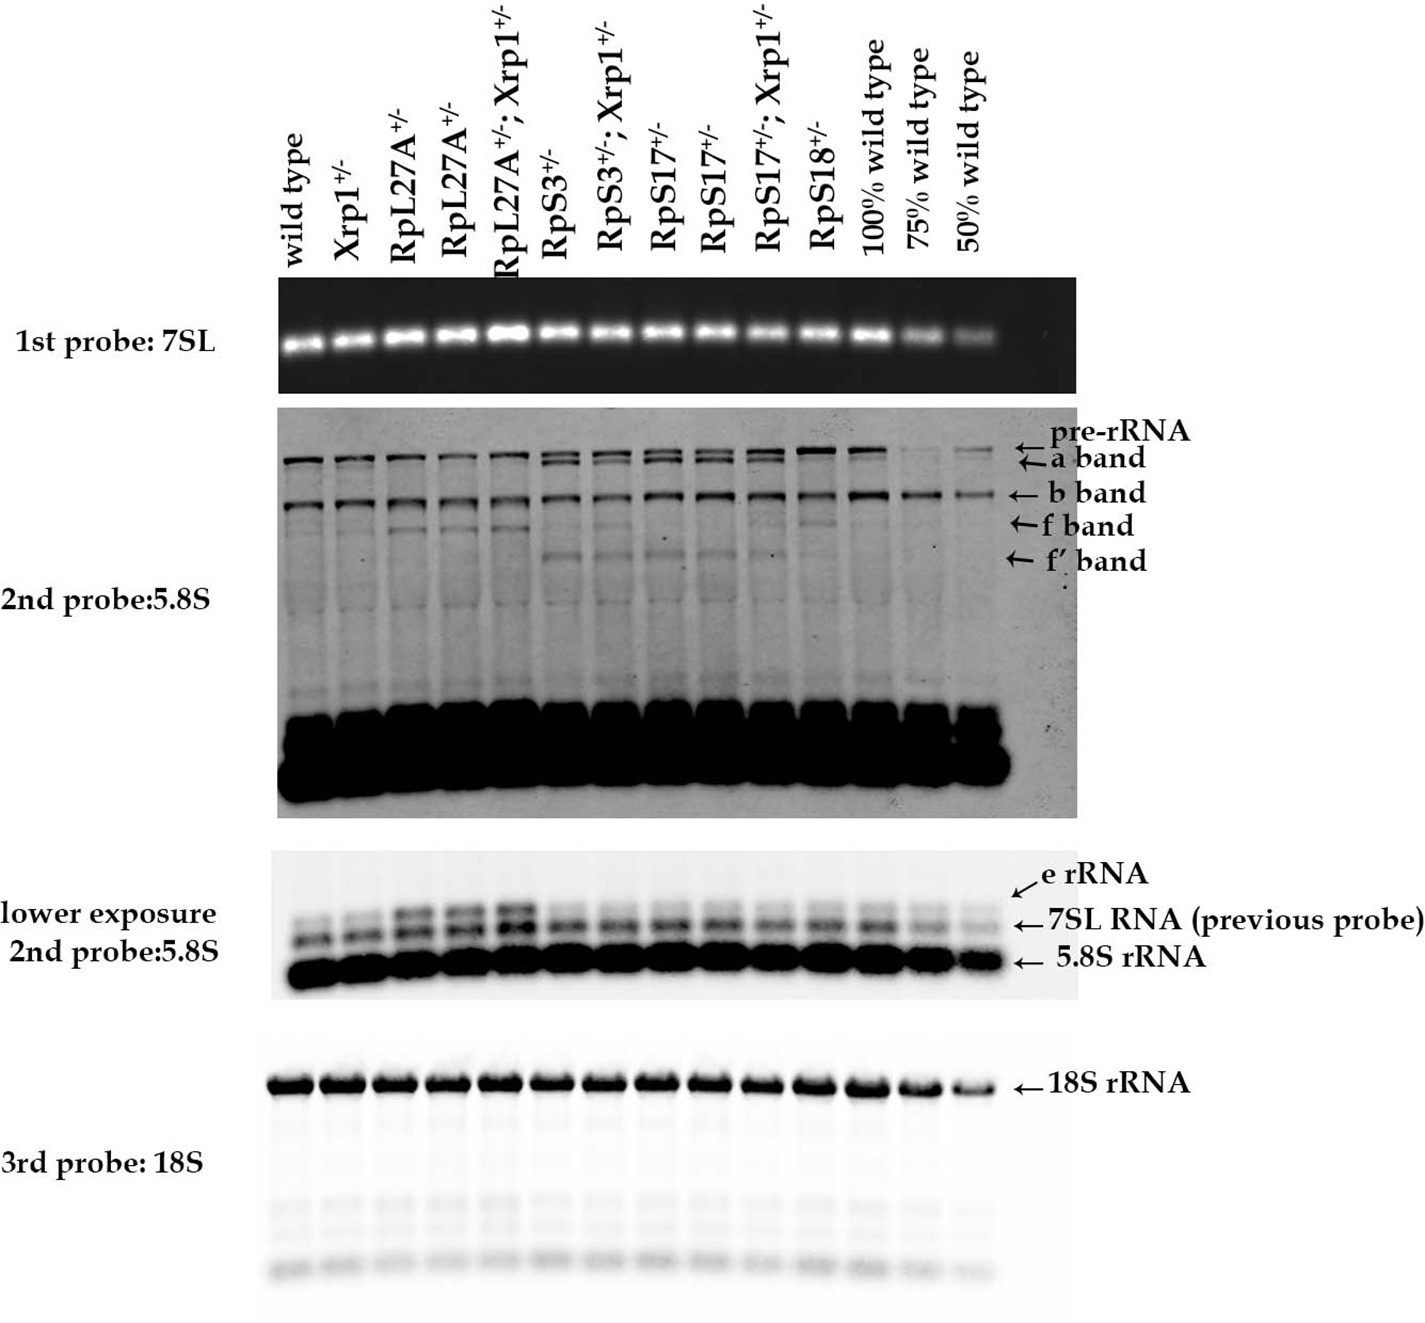
Additional northern blots detecting rRNA intermediates.
Northern blots of total RNA purified from wild-type and Rp+/-wing discs, reprobed with 5.8 S probe and then 18 S probe after an initial 7SL probe.
-
Figure 2—figure supplement 1—source data 1
Full and unedited blots corresponding to Figure 2—figure supplement 1.
- https://cdn.elifesciences.org/articles/71705/elife-71705-fig2-figsupp1-data1-v3.pdf
Figure 2—figure supplement 2
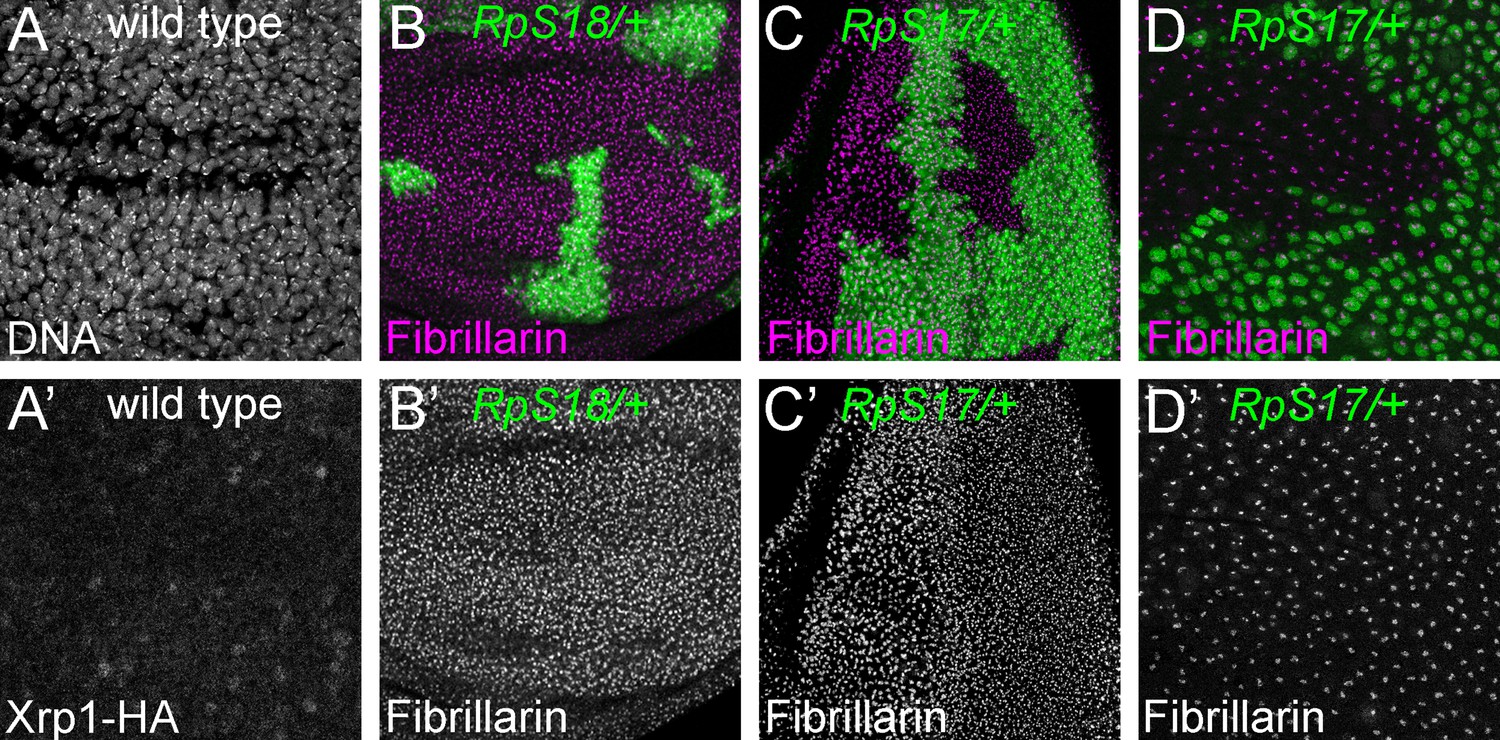
Nucleoli in wild type and Rp mutant cells.
(A) Confocal section of Xrp1-HA wing disc showing many nuclei labelled for DNA. (A’) HA labeling reveals minimal Xrp1 expression in this otherwise wild type wing disc. Xrp1-HA is not obvious in nucleoli. (B) Mosaic wing disc containing RpS18+/- cells (green). Anti-fibrillarin labeling of nucleoli reveals no obvious differences between RpS18+/- and RpS18+/+ cells (projected in magenta; see also B’). (C) Mosaic eye disc containing RpS17+/- cells (green). Anti-fibrillarin labeling of nucleoli reveals no obvious differences between RpS17+/- and RpS17+/+ cells (projected in magenta; see also (C’)). (D) Peripodial membrane from mosaic eye eye disc containing RpS17+/- cells (green). Anti-fibrillarin labeling of nucleoli reveals no obvious differences between RpS17+/- and RpS17+/+ cells (projected in magenta; see also (D’)). Genotypes::A: p{hs:FLP}/ p{hs:FLP}; FRT42/FRT42; Xrp1-HA/Xrp1-HA B: p{hs:FLP}/ p{hs:FLP}; FRT42 RpS18 p{Ubi:GFP}/FRT42, C,D: p{hs:FLP}/+; RpS17 p{Ubi:GFP} FRT80B/FRT80B.
Figure 3 with 1 supplement
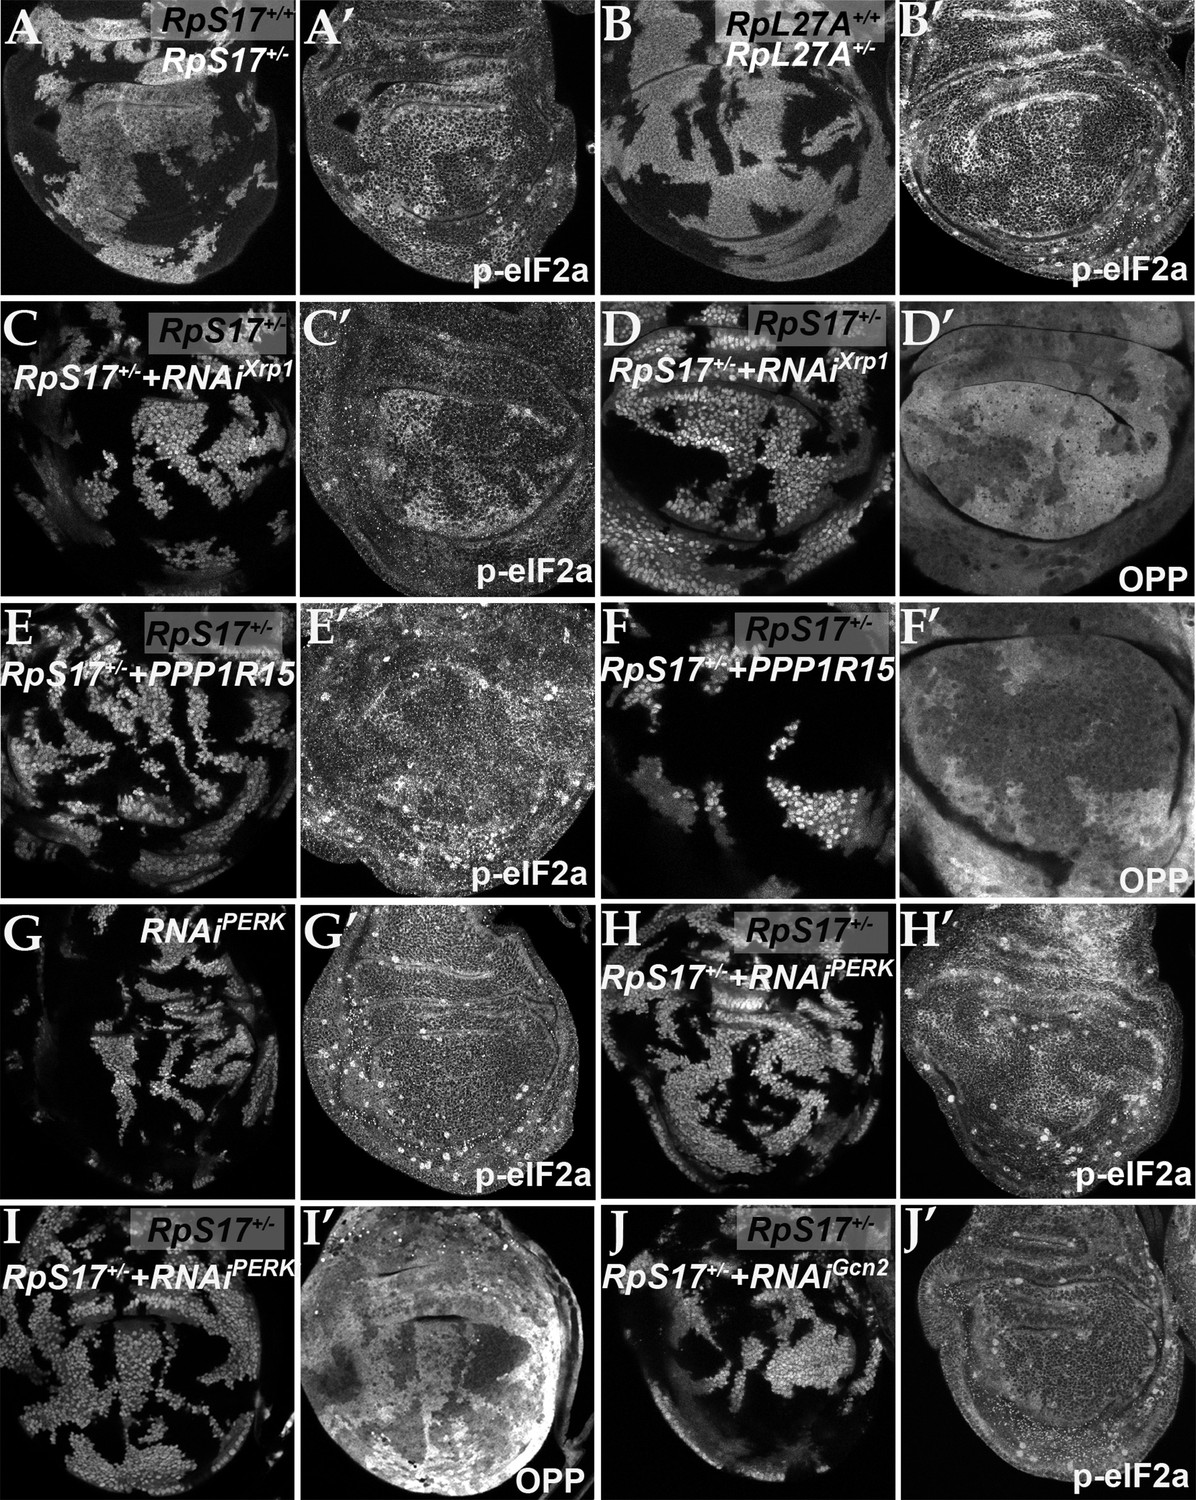
eIF2α is phosphorylated in ribosomal protein mutants via Xrp1 and PERK.
Panels A-J show single confocal planes from third instar wing imaginal discs. (A) Mosaic of RpS17+/- and RpS17+/+ cells. p-eIF2α levels were increased in RpS17+/- cells (see A’). (B) Mosaic of RpL27A+/- and RpL27A+/+ cells. p-eIF2α levels were increased in RpL27A+/- cells (see B’). (C) Clones of cells expressing Xrp1-RNAi in a RpS17+/- wing disc in white p-eIF2α levels were reduced by Xrp1 depletion (see C’). (D) Clones of cells expressing Xrp1-RNAi in a RpS17+/- wing disc in white. Translation rate was restored by Xrp1 depletion (see D’). (E) Clones of cells over-expressing PPP1R15 in a RpS17+/- wing disc in white. p-eIF2α levels were reduced by PPP1R15 over-expression (see E’). (F) Clones of cells over-expressing PPP1R15 in a RpS17+/- wing disc in white. Translation rate was restored by PPP1R15 over-expression (see F’). (G) Clones of cells expressing PERK-RNAi in an otherwise wild type wing disc in white. p-eIF2α levels were unaffected (see G’). Note that in this and some other panels mitotic cells are visible near the apical epithelial surface. Mitotic figures, which lack OPP incorporation, are labeled by the anti-p- eIF2α antibody from Thermofisher, but not by the anti-p- eIF2α antibody from Cell Signaling Technologies. (H) Clones of cells expressing PERK-RNAi in a RpS17+/- wing disc in whiite. p-eIF2α levels were reduced by PERK knockdown (see H’). (I) Clones of cells expressing PERK-RNAi in a RpS17+/- wing disc in white. Translation rate was restored by PERK knockdown (see I’). (J) Clones of cells expressing Gcn2-RNAi in a RpS17+/- wing disc in white. p-eIF2α levels were not reduced by Gcn2 knockdown (see J’). Further data relevant to this Figure are shown in Figure 3—figure supplement 1. Genotypes: A: p{hs:FLP}/+; RpS17 p{arm:LacZ} FRT80B/FRT80B, B: p{hs:FLP}/ p{hs:FLP}; RpL27A- p{arm:LacZ} FRT40/FRT40, C, D: p{hs:FLP}/+; RpS17, act> CD2> Gal4, UAS-GFP /UAS- RNAiXrp1, E,F: p{hs:FLP}/+; UAS-PPP1R15/+; RpS17, act> CD2> Gal4, UAS-GFP /+, G: p{hs:FLP}/+; UAS- RNAiPERK /+;act> CD2> Gal4, UAS-GFP /+, H, I: p{hs:FLP}/+; UAS- RNAiPERK /+; RpS17, act> CD2> Gal4, UAS-GFP /+, J: p{hs:FLP}/+; UAS- RNAiGcn2/+; RpS17, act> CD2> Gal4, UAS-GFP /+.
Figure 3—figure supplement 1
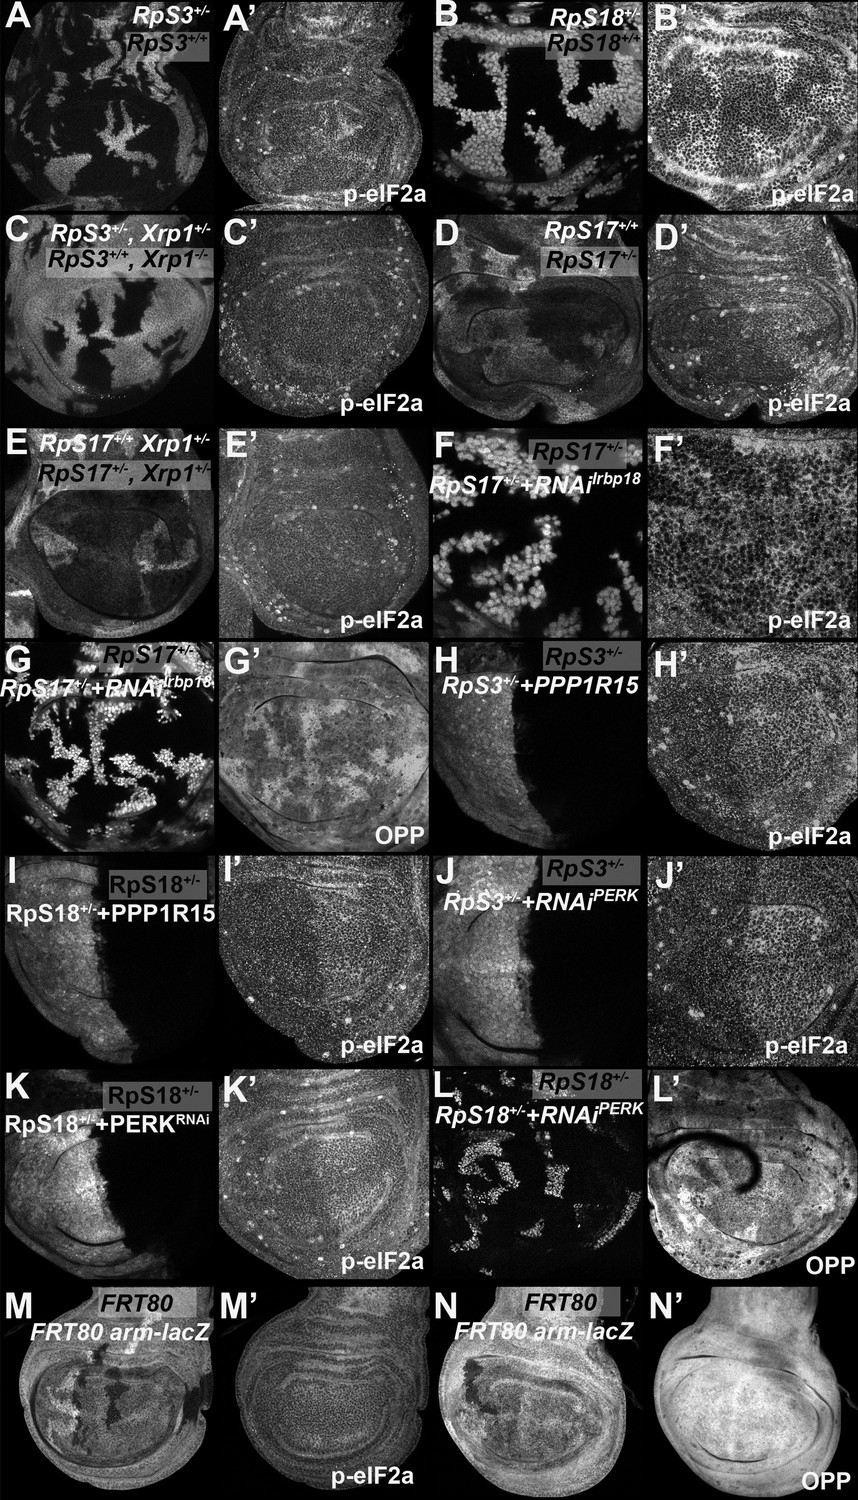
eIF2α phosphorylation in Rp+/- cell depends on Xrp1 and Irbp18.
Panels A-L show single confocal planes from third instar wing imaginal discs. (A) Mosaic of RpS3+/- and RpS3+/+ cells. p-eIF2α levels were increased in RpS3+/- cells (see A’). (B) Mosaic of RpS18+/- and RpS18+/+ cells. p-eIF2α levels were increased in RpS18+/- cells (see B’). (C) Mosaic of RpS3+/-Xrp1+/-and RpS3+/+Xrp-/- cells. p-eIF2α levels were unaffected in RpS3+/- cells when Xrp1 was mutated (see C’). (D) Mosaic of RpS17+/- and RpS17+/+ cells (the latter brighter white, having two copies of β-gal transgene). p-eIF2α levels were increased in RpS17+/- cells (see D’). (E) Mosaic of RpS17+/- and RpS17+/+ cells in an Xrp1+/- disc, (RpS17+/+ brighter white, having two copies of β-gal transgene). p-eIF2α levels were unaffected in RpS17+/- cells (see E’). (F) Clones of cells expressing Irbp18 RNAi in a RpS17+/- wing disc in white. p-eIF2α levels were reduced by Irbp18 knock-down (see F’). (G) Clones of cells expressing Irbp18 RNAi in a RpS17+/- wing disc in white. Translation rate was restored by Irbp18 knock-down (see G’). (H) Cells over-expressing PPP1R15 in the posterior compartment of a RpS3+/- wing disc in white. p-eIF2α levels were reduced by PPP1R15 over-expression (see H’). (I). Cells over-expressing PPP1R15 in the posterior compartment of a RpS18+/- wing disc in white. p-eIF2α levels were reduced by PPP1R15 over-expression (see I’). (J) Cells expressing PERK RNAi in the posterior compartment of a RpS3+/- wing disc in white. p-eIF2α levels were reduced by PERK knock-down (see J’). (K). Cells expressing PERK RNAi in the posterior compartment of a RpS18+/- wing disc in white. p-eIF2α levels were reduced by PERK knock-down (see K’). (L) Clones of cells expressing PERK RNAi in a RpS18+/- wing disc in white. Translation rate was restored by PERK knock-down (see L’). (M) Neutral clones expressing or lacking LacZ expression did not affect p-eIF2α levels (see M’). (N) Neutral clones expressing or lacking LacZ expression did not affect OPP incorporation (see N’). Genotypes: A: p{hs:FLP}/ p{hs:FLP}; FRT82 RpS3 p{arm:LacZ} /FRT82B, B: p{hs:FLP}/ p{hs:FLP}; FRT42 RpS18 p{Ubi:GFP}/FRT42, C: p{hs:FLP}/ p{hs:FLP}; FRT82 RpS3 p{arm:LacZ} /FRT82B Xrp1M2-73, D: p{hs:FLP}/ p{hs:FLP}; RpS17 FRT80B/p{arm:LacZ} FRT80B, E: p{hs:FLP}/ p{hs:FLP}; RpS17 FRT80B/p{arm:LacZ} FRT80B Xrp1M2–73, F-G: p{hs:FLP}/+; RpS17, act> CD2> Gal4, UAS-GFP /UAS- RNAiIrbp18, H: en-GAL4, UAS-GFP /UAS-PPP1R15; FRT82 RpS3/+, I: RpS18-,en-GAL4, UAS-GFP /UAS-PPP1R15, J: en-GAL4, UAS-GFP / UAS- RNAiPERK; FRT82 RpS3/+, K: RpS18-,en-GAL4, UAS-GFP /UAS- RNAiPERK, L: p{hs:FLP}/+; UAS- RNAiPERK / RpS18-; act> CD2> Gal4, UAS-His-RFP/+, M, N: p{hs:FLP}/ p{hs:FLP}; FRT80B/p{arm:LacZ} FRT80B.
Figure 4 with 1 supplement
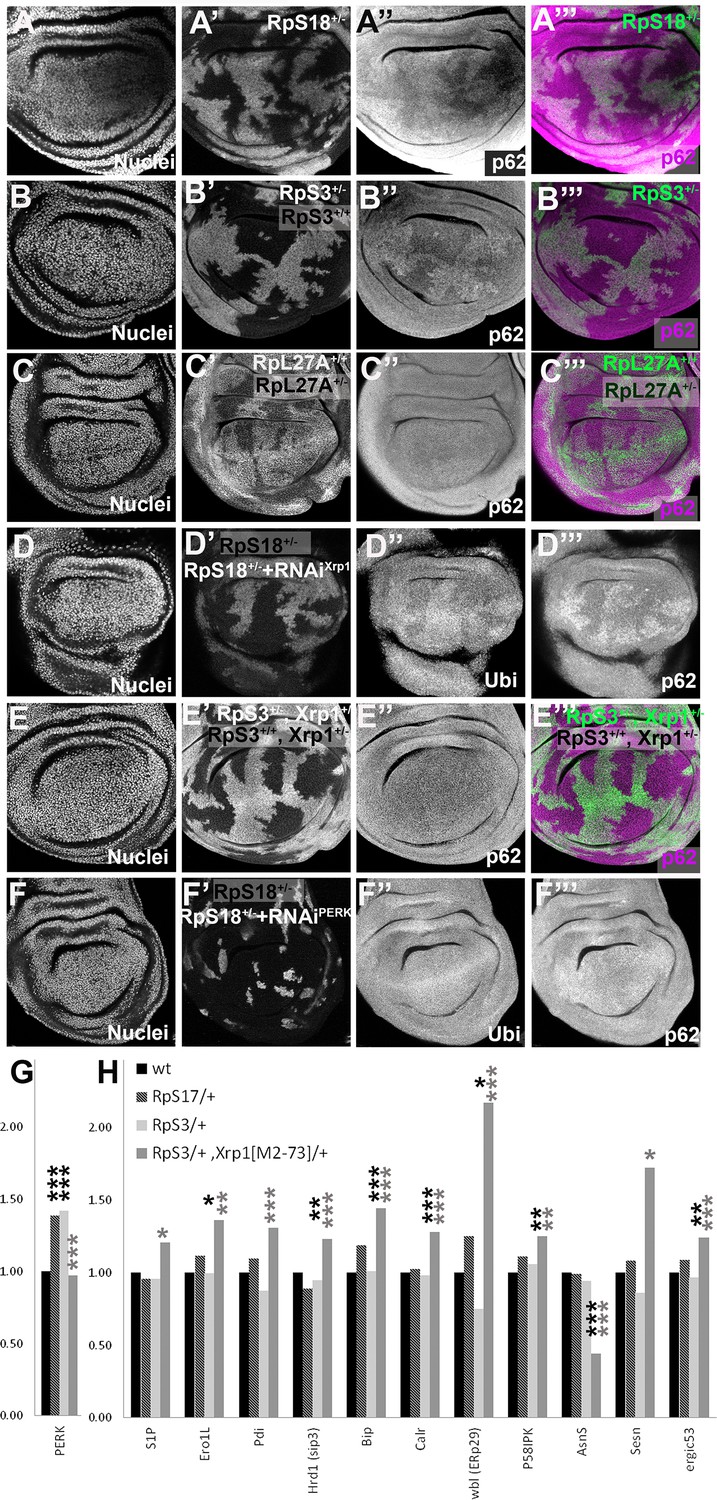
Xrp1-dependent aggregates and gene expression changes in RpS+/- cells.
Panels A-E show single confocal planes from third instar wing imaginal discs, mosaic for the genotypes indicated. In all cases, the plane passes through the central nuclei-containing disk portion for the genotypes shown. (A) p62 was higher in RpS18+/- cells than RpS18+/+ cells. (B) p62 was higher in RpS3+/- cells than RpS3+/- cells. (C) p62 was comparable in RpL27A+/- cells and RpL27A+/+ cells. (D) Clones of cells expressing Xrp1-RNAi in a RpS18+/- wing disc in white. Levels of both p62 and ubiquitinylated proteins were reduced by Xrp1 knock-down. (E) Mosaic of RpS3+/- and RpS3+/+ cells in Xrp1+/- wing disc. No increase in p62 was seen in RpS3+/- cells (compare panel B). (F) Clones of cells expressing PERK-RNAi in a RpS18+/- wing disc in white. Levels of both p62 and ubiquitinylated proteins remained unaffected by PERK knock-down (G). PERK mRNA levels (fold changes in mRNA-seq replicates relative to the wild-type controls according to Deseq2) for the indicated genotypes. PERK mRNA was increased in both RpS17+/- and RpS3+/- wing discs but not RpS3+/-, Xrp1M2-73/+ cells. (H) mRNA levels for 11 genes participating in the Unfolded Protein Response. All were significantly affected only in the RpS3+/- Xrp1 M2-73/+ genotype. Statistics: Asterisks indicate statistical significance determined by Deseq2 (*: padj <0.05, **: padj <0.005, ***: padj <0.0005) compared to wild type control (black asterisks) or to RpS3+/- genotype (grey asterisks). Comparisons not indicated were not significant ie padj ≥0.05 eg PERK mRNA in RpS3+/- Xrp1 M2-73/+ compared to wild type control. Further data relevant to this Figure are shown in Figure 4—figure supplement 1. Data are based on mRNA-sequencing of 3 biological replicates for each genotype. Genotypes: A: p{hs:FLP}/ p{hs:FLP}; FRT42 RpS18 p{Ubi:GFP}/FRT42, B: p{hs:FLP}/ p{hs:FLP}; FRT82 RpS3 p{arm:LacZ} /FRT82B, C: p{hs:FLP}/ p{hs:FLP}; RpL27A- p{arm:LacZ} FRT40/FRT40, D: p{hs:FLP}/+; UAS- RNAiXrp1/ GstD lacZ, RpS18-; act> CD2> Gal4, UAS-GFP /+, E: p{hs:FLP}/ p{hs:FLP}; FRT82 RpS3 p{arm:LacZ} /FRT82B Xrp1M2-73, F: p{hs:FLP}/+; UAS- RNAiPERK / GstD-lacZ, RpS18-; act> CD2> Gal4, UAS-GFP /+,G-H: wt: w 11-18 /+; FRT82B/+, RpS17/+: w11-18 /y w p{hs:FLP}; RpS17 p{ubi:GFP} FRT80B/+, RpS3/+: w11-18 /y w p{hs:FLP}; FRT82 RpS3 p{arm:LacZ/+, RpS3/+, Xrp1[M2-73]/+: w11-18 /y w p{hs:FLP}; FRT82 RpS3 p{arm:LacZ}/ FRT82B Xrp1M2–73.
Figure 4—figure supplement 1
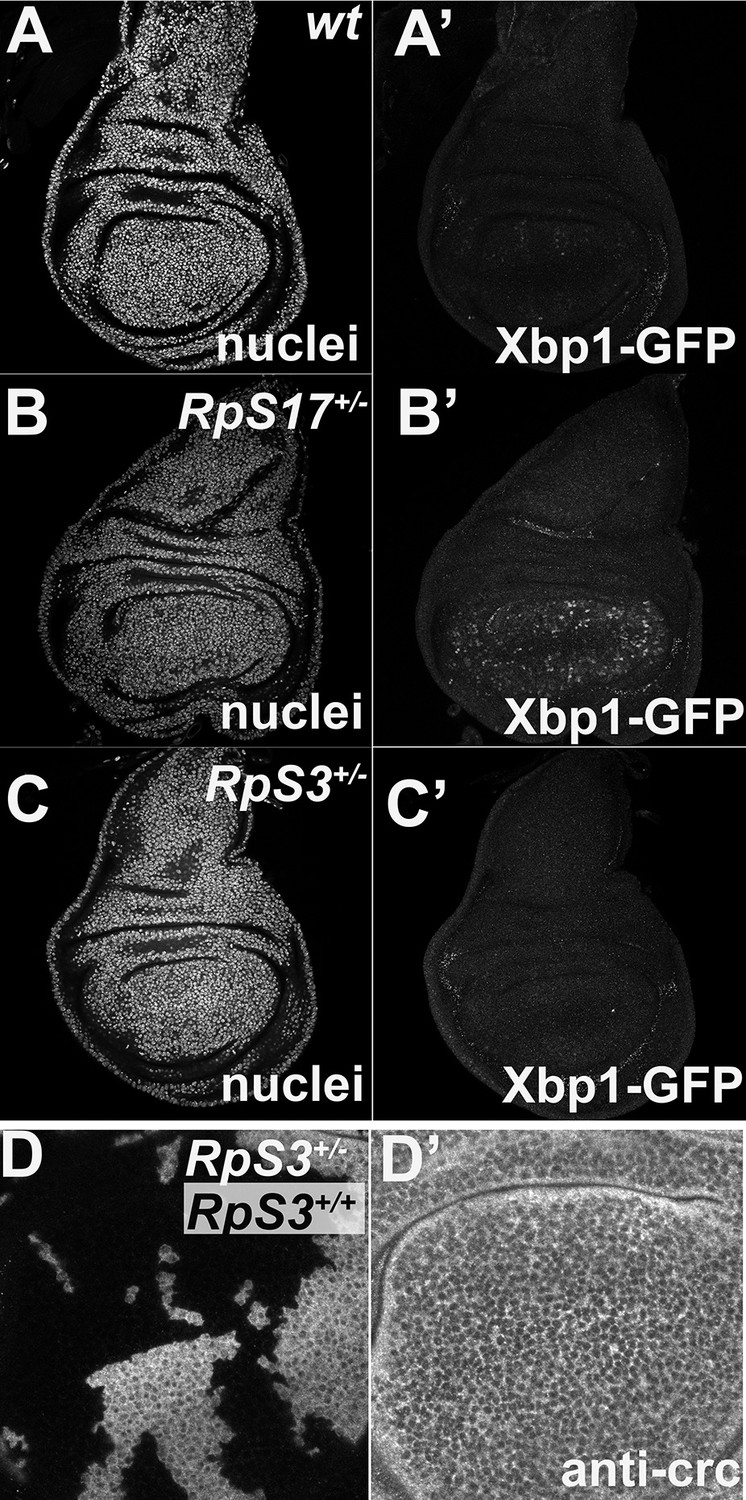
Little UPR detected in Rp+/- wing discs.
Panels show single confocal planes from third instar wing imaginal discs expressing the UPR reporter UAS-Xbp1-GFP in the wing pouch under nub-Gal4 control. GFP expression indicates an unfolded protein response. (A) Little evidence for UPR in wild type wing discs. (B) Elevated UPR in RpS17+/- wing discs. (C) Little evidence for UPR in RpS3+/- wing discs. (D) No upregulation of Crc/ATF4 in RpS3+/- cells. Genotypes: A: Xbp1-EGFP/nubGal4; +/+, B: Xbp1-EGFP/nubGal4; RpS17 p{arm:LacZ} FRT80B /+, C: Xbp1-EGFP/nubGal4; FRT82 RpS3 p{arm:LacZ} /+ D: p{hs:FLP}/ p{hs:FLP}; FRT82 RpS3 p{arm:LacZ} /FRT82B.
Figure 5 with 3 supplements

eIF2α phosphorylation can induce Xrp1 expression and cell competition.
All panels show single confocal planes from third instar wing imaginal discs, mosaic for the genotypes indicated. All the sections pass through the central region of the disc proper containing nuclei in all genotypes, as indicated by the DNA stain in blue in some panels. (A) Clones expressing white RNAi (green). Clones induced by 7 min heat shock. (B) Clones expressing PPP1R15 RNAi (green)were fewer and smaller than the control (compare panel A). Clones induced by 7 min heat shock. (C) Clones expressing PPP1R15 RNAi (white) contain phosphorylated eIF2α (see C’). (D) Clones induced by 25 ± 5 min heat shock, which results in larger clone areas (white). Labelled clones expressing PPP1R15 RNAi reduced translation rate (see D’). (E) Labelled clones expressing PPP1R15 RNAi (green) underwent competitive apoptosis at interfaces with wild type cells (activated caspase Dcp1 in magenta; see also E’). (F) Nub-Gal4 drives gene expression in the wing pouch, shown in green for RFP, with little expression of Xrp1-HA (magenta; see also F’). (G) PPP1R15 RNAi induces Xrp1-HA expression in the wing pouch (magenta; see also G’). (H) Clones co-expressing PPP1R15 RNAi and Xrp1 RNAi (green) lacked competitive apoptosis (activated caspase Dcp1 in magenta; see also H’). (I) Clones expressing PPP1R15 RNAi (green). Experiment performed in parallel to panel H. Note competitive apoptosis at interfaces with wild type cells (activated caspase Dcp1 in magenta; see also I’), and smaller clone size. Cell death at the basal surface of the same disc shown in Figure 5—figure supplement 1F. (J) Clones co-expressing PPP1R15 RNAi and Xrp1 RNAi (white) showed less eIF2α phosphorylation than for PPP1R15 RNAi alone (compare panel C). Sample prepared in parallel to panel C (in the same tube from fixation to staining). (K) Xrp1 knock-down restored normal translation rate to cell clones expressing PPP1R15 RNAi (green; see also K’). Sample prepared in parallel to panel D (in the same tube from fixation to staining). Additional data relevant to this Figure is shown in Figure 5—figure supplement 1. Genotypes: A: {hs:FLP}/+; act> CD2> Gal4, UAS-GFP / UAS – RNAiw, B: {hs:FLP}/+; act> CD2> Gal4, UAS-GFP / UAS – RNAiPPP1R15 (line: BL 33011) (samples were processed on the same day, not on the same tube), C: {hs:FLP}/+; UAS – RNAiPPP1R15 /TRE-dsRed; act> CD2> Gal4, UAS-GFP /+(line: v107545) (processed in parallel with 5 J), D: {hs:FLP}/+; act> CD2> Gal4, UAS-GFP / UAS – RNAiPPP1R15 (line: BL 33011), E: {hs:FLP}/+; UAS – RNAiPPP1R15 /+; act> CD2> Gal4, UAS-GFP /+ (line: v107545),F: nubGal4, UAS-RFP/+; Xrp1-HA/RNAiw, G: nubGal4, UAS-RFP/ UAS – RNAiPPP1R15; Xrp1-HA/+ (line: v107545), H, J, K: {hs:FLP}/+; UAS – RNAiPPP1R15 / UAS-RNAiXrp1; act> CD2> Gal4, UAS-GFP /+ (line: v107545) (5 H processed in parallel with 5I. Also, 5 K processed in parallel with Figure 5—figure supplement 1B) (line RNAiPPP1R15: v107545 and line RNAiXrp1: v107860), I: {hs:FLP}/+; UAS – RNAiPPP1R15 /TRE-dsRed; act> CD2> Gal4, UAS-GFP /+ (line RNAiPPP1R15: v107545).
Figure 5—figure supplement 1
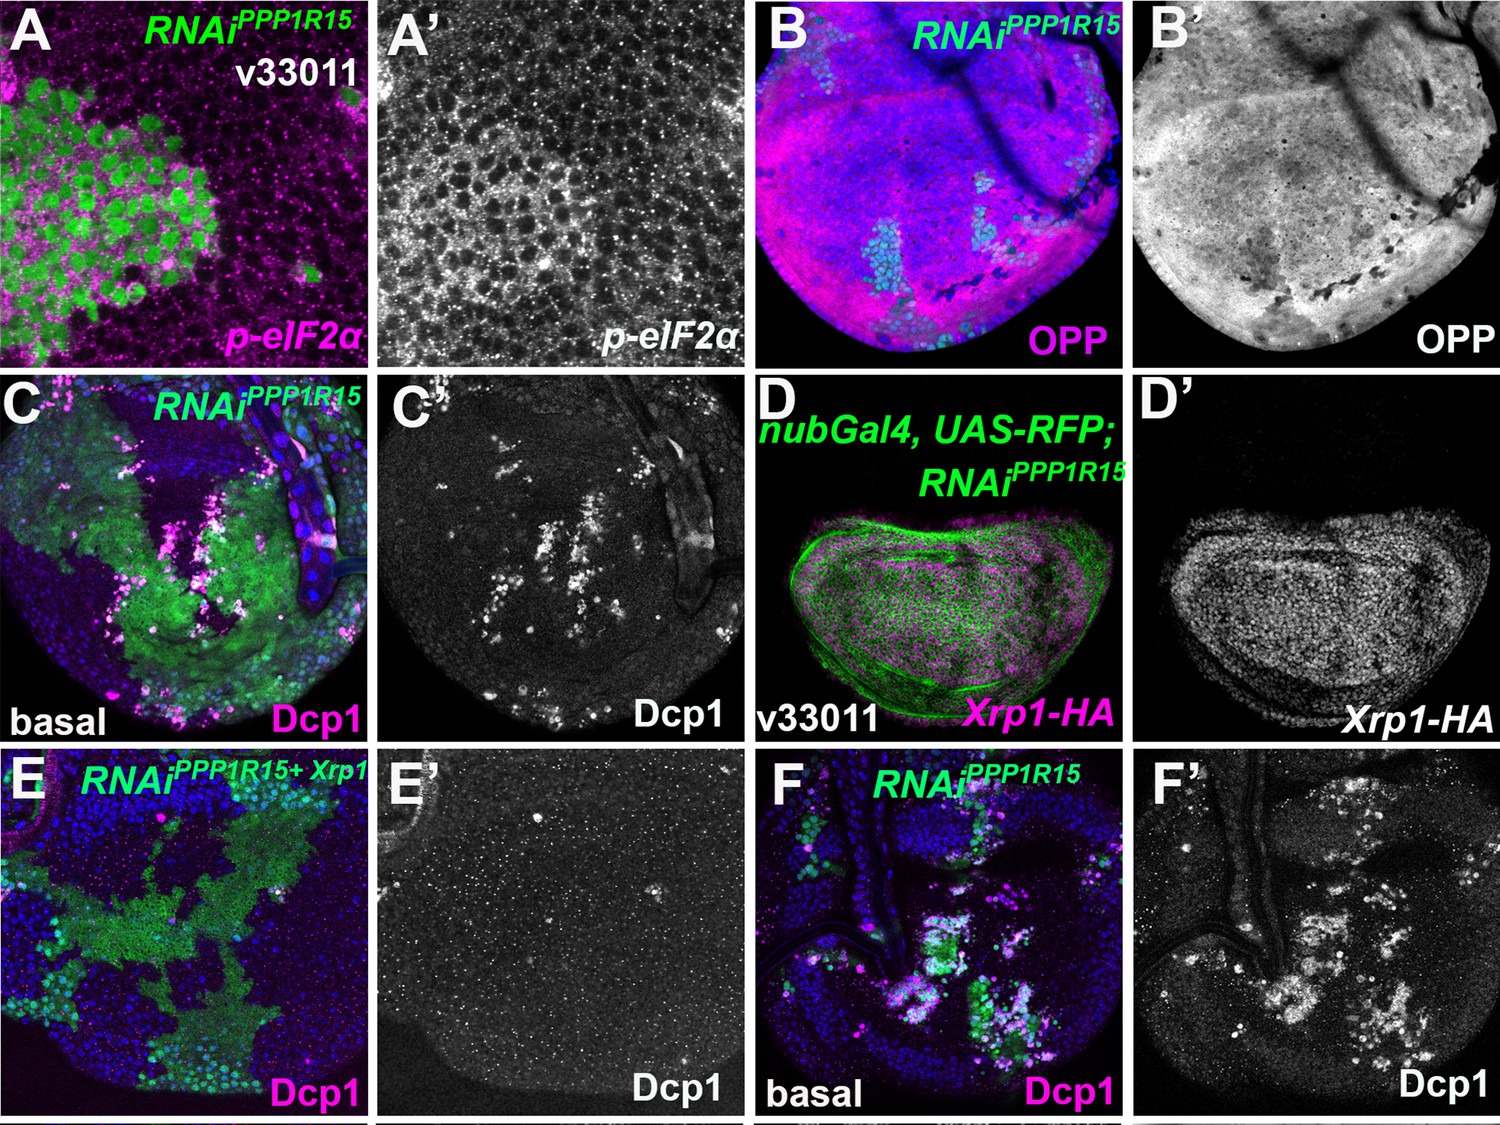
eIF2α phosphorylation induces Xrp1 expression and cell competition.
Single confocal planes from third instar wing imaginal discs. (A) Clones expressing PPP1R15-RNAi had increased p-eIF2α levels (A’). (B) Clones expressing PPP1R15-RNAi had reduced translation (OPP) (B’). (C) Basal section of the same disc shown in Figure 5E. More dying PPP1R15-RNAi cells labeled for active caspase (magenta, see also C’) accumulate basally at the boundaries with the wild-type cells. (D) nub-Gal4 driving PPP1R15 RNAi in the wing pouch (green) led to Xrp1-HA expression (magenta; see also D’). (E) Basal confocal section of the wing disc also shown in Figure 5H, mosaic for cells expressing PPP1R15 RNAi and Xrp1 RNAi (green). Even at these basal levels, apoptosis was almost completely rescued by Xrp1 knockdown (magenta, see also E’). (F) Basal confocal section of wing disc mosaic for wild-type cells and cells expressing PPP1R15 RNAi also shown in Figure 5I and a parallel control to panel E. Note extensive cell death basally (magenta, see also F’), as well as smaller clone size (green). Genotypes: A: {hs:FLP}/+; act> CD2> Gal4, UAS-GFP / UAS – RNAiPPP1R15 (line: BL 33011), B: {hs:FLP}/+; UAS – RNAiPPP1R15 /+; act> CD2> Gal4, UAS-GFP /+ (line: v107545) (processed in parallel with Figure 5K), C: {hs:FLP}/+; UAS – RNAiPPP1R15 /+; act> CD2> Gal4, UAS-GFP /+ (line: v107545) (basal side of the same disc in Figure 5E), D: nubGal4, UAS-RFP/ UAS – RNAiPPP1R15; Xrp1-HA/+ (line: Bl 33011), E: {hs:FLP}/+; UAS – RNAiPPP1R15 /+; act> CD2> Gal4, UAS-GFP /+ (line: v107545) (basal side of the same disc in Figure 5H), F: {hs:FLP}/+; UAS – RNAiPPP1R15 /UAS-RNAiXrp1; act> CD2> Gal4, UAS-GFP /+ (line RNAiPPP1R15: v107545 and line RNAiXrp1: v107860) (basal side of the same disc in Figure 5I).
Figure 5—figure supplement 2
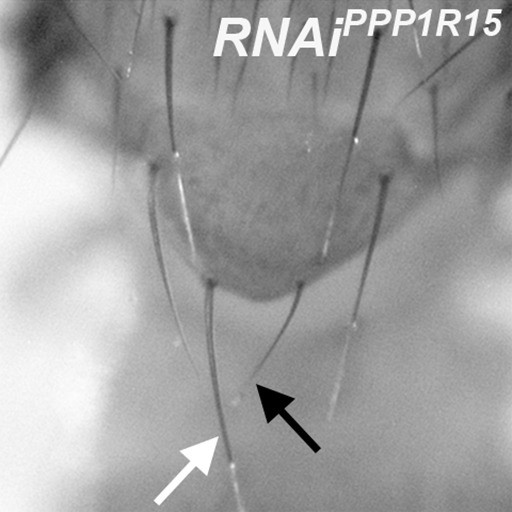
eIF2α phosphorylation reduces bristle size.
Minute-like short, thin bristles occur on adults containing clones depleted for PPP1R15, for example compare highlighted posterior scutellar bristle (black arrow) with normal contralateral bristle (white arrow). Genotype: p{hs:FLP}/+; UAS- RNAi PPP1R15/+;act> CD2> Gal4, UAS- GFP /+ (line: Bl 33011).
Figure 5—figure supplement 3
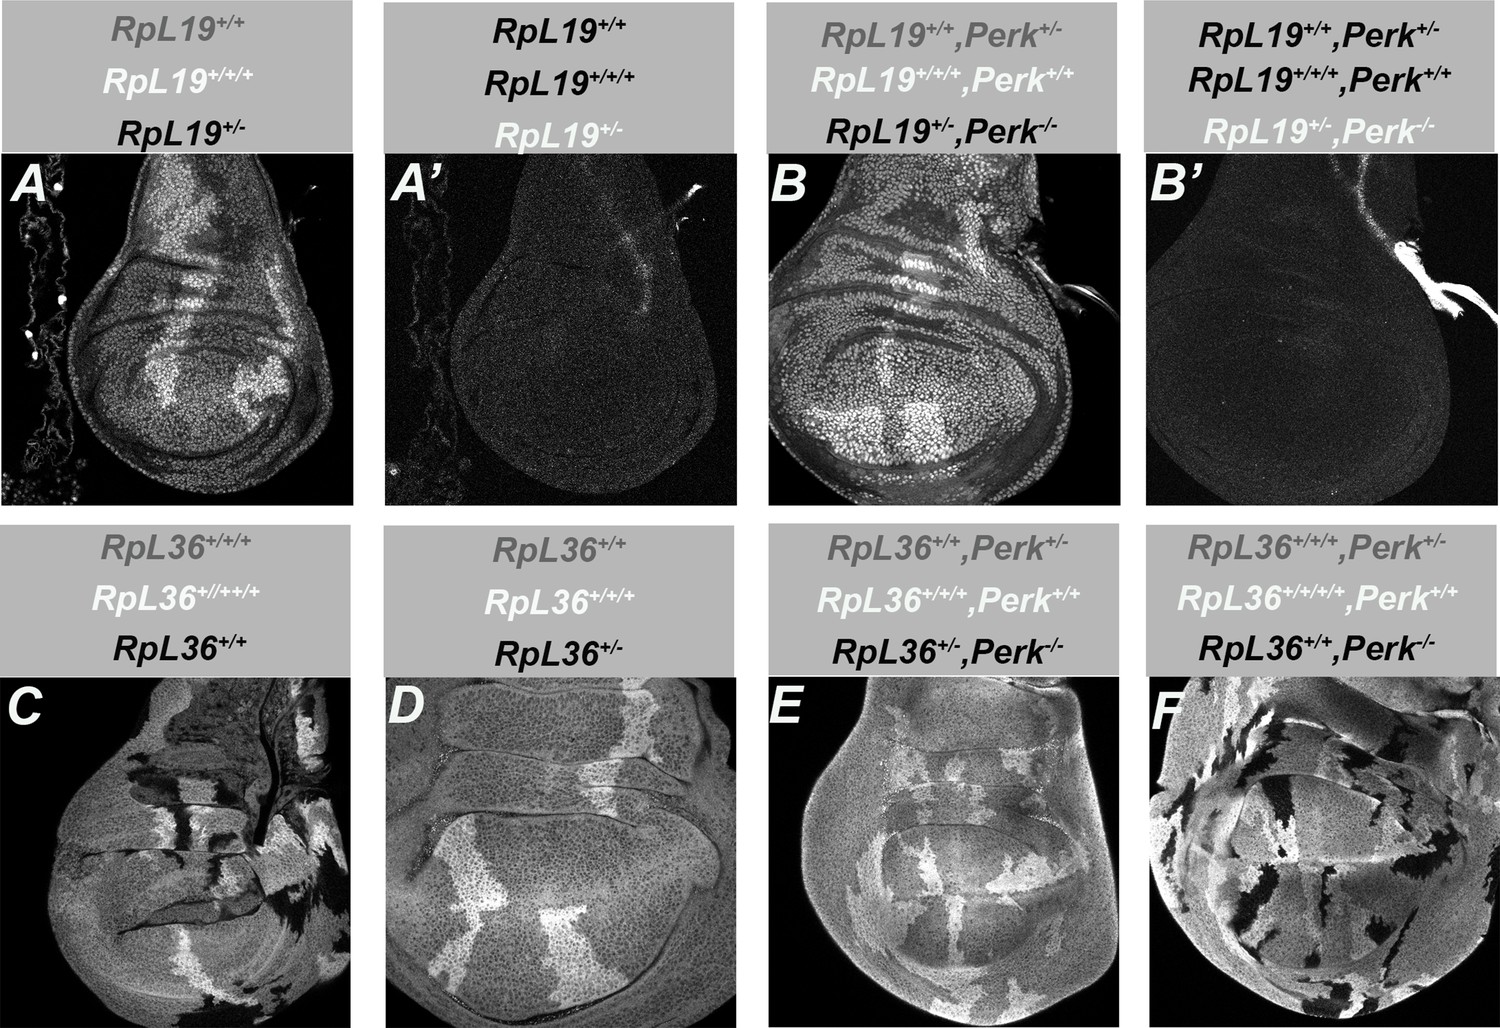
eIF2α phosphorylation is not required for cell competition.
All panels show single confocal planes from third instar wing imaginal discs, mosaic for the genotypes indicated. (A) When mitotic recombination generated twin clones of RpL19+/+/+ cells (brightly labeled) and RpL19+/- ± (black) in the RpL19+/+ background (gray), the RpL19+/- ± did not survive. This was also shown by the absence of mCherry expression, which would have been labelled white in panel A’. (B) Clones of perk-/- RpL19+/- ± (black) were also not seen after recombination in the perk+/- RpL19+/+ background (gray) led to twin clones of perk+/+ RpL19+/+/+ cells (brightly labeled). Any clones of perk-/- RpL19+/- ± would also have been detected through mCherry expression, which would have been labelled white in panel B’. (C) Clones of both RpL36+/+/+/+ cells (brightly labeled) and RpL36+/+ cells (black) survived in the RpL36+/+/+ background (gray). (D) No clones of RpL36+/- ± (black) were seen after recombination in the RpL36+/+ background (gray) generated twin clones of RpL36+/+/+ cells (brightly labeled). (E) No clones of perk-/- RpL36+/- ± (black) were seen after recombination in the perk+-/- RpL36+/+ background (gray) generated twin clones of perk+/+ RpL36+/+/+ cells (brightly labeled). (F) Clones of perk-/- RpL36+/+ cells (black) were readily obtained after recombination in the perk+-/- RpL36+/+/+ background (gray) generated twin clones of perk+/+ RpL36+/+/+/+ cells (brightly labeled). Genotypes: A,A’: y w, hs-FLP; Act5C > GAL4 w, UAS-mCherry-CAAX, Df(2 R)M60E; FRT82B, ubi-GFP-nls, tubP-GAL80, M{RpL19 genomic}ZH-86Fb/FRT82B. B,B’: y w, hs-FLP; Act5C > GAL4 w, UAS-mCherry-CAAX, Df(2 R)M60E; FRT82B, ubi-GFP-nls, tubP-GAL80, M{RpL19 genomic}ZH-86Fb/FRT82B Perknull C: FM7/hs-FLP; FRT82B p{RpL36+} p{arm:LacZ}/FRT82B. D: Df(1)R194/hs-FLP; FRT82B p{RpL36+} p{arm:LacZ}/FRT82B. E: Df(1)R194/hs-FLP; FRT82B p{RpL36+} p{arm:LacZ}/FRT82B PERKnull F: FM7/hs-FLP; FRT82B p{RpL36+} p{arm:LacZ}/FRT82B PERKnull The FM7 and Df(1)R194 genotypes used in panels C-F were unmarked in wing discs. The experiment with FRT82B led to the two classes of discs with and without clones shown in panels C and D, and the experiment with FRT82B perk- led to the two classes of discs with and without clones shown in panels E and F. A parallel experiment with FRT82B Xrp1-, which rescues RpL36+/- ± (Lee et al., 2018) led only to wing discs with clones equal in size and frequency to reciprocal twin clones.
Figure 6 with 2 supplements
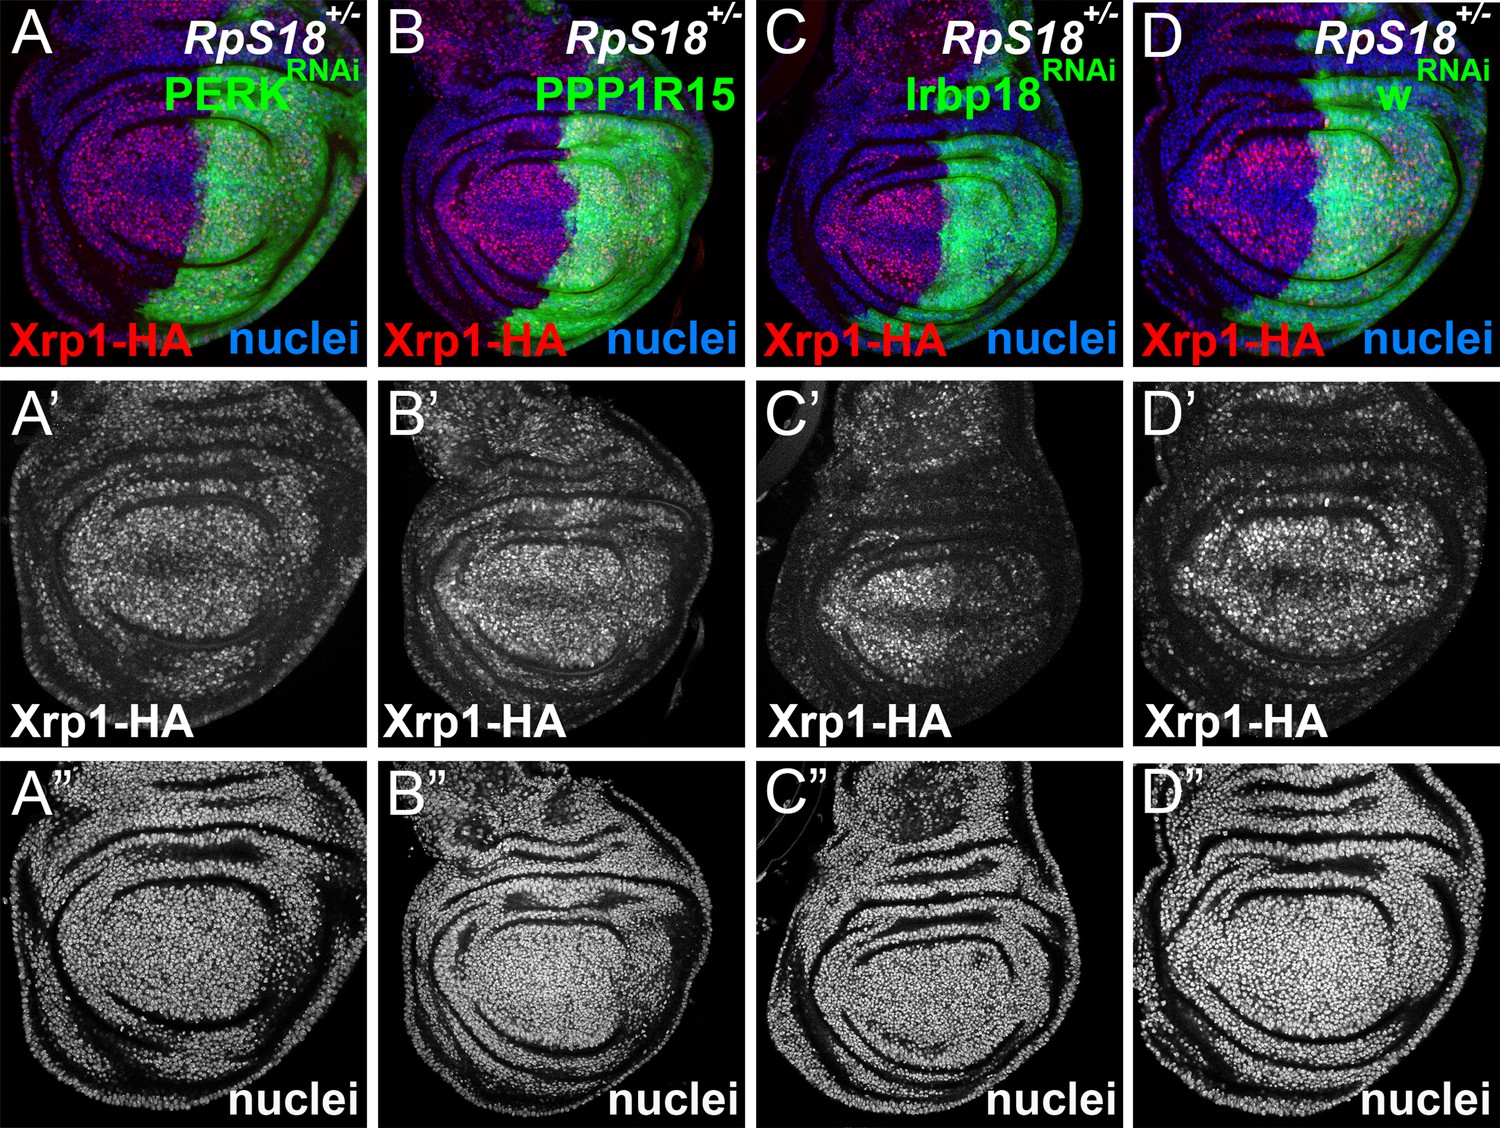
eIF2α phosphorylation is dispensable for Xrp1 expression in Minutes.
All panels show single confocal planes from RpS18+/- third instar wing imaginal discs, co-expressing GFP and the indicated constructs in the posterior compartments. All the sections pass through the central region of the disc proper containing nuclei, as indicated by the DNA stain in blue. (A) Perk knock-down had no effect on Xrp1 expression in RpS18+/-. (B) PPP1R15 over-expression had no effect on Xrp1 expression in RpS18+/-. (C) Irbp18 knock-down strongly reduced Xrp1 expression in RpS18+/-. (D) Knock-down for the w gene had no effect on Xrp1 expression in RpS18+/-. Genotypes: A: RpS18-, en-GAL4, UAS-GFP / UAS- RNAiPERK; Xrp1-HA /+, B: RpS18-,en-GAL4, UAS-GFP / UAS-PPP1R15; Xrp1-HA /+, C: RpS18-,en-GAL4, UAS-GFP /+; Xrp1-HA /UAS- RNAiIrbp18, D:RpS18-,en-GAL4, UAS-GFP /+; Xrp1-HA /UAS- RNAiw.
Figure 6—figure supplement 1
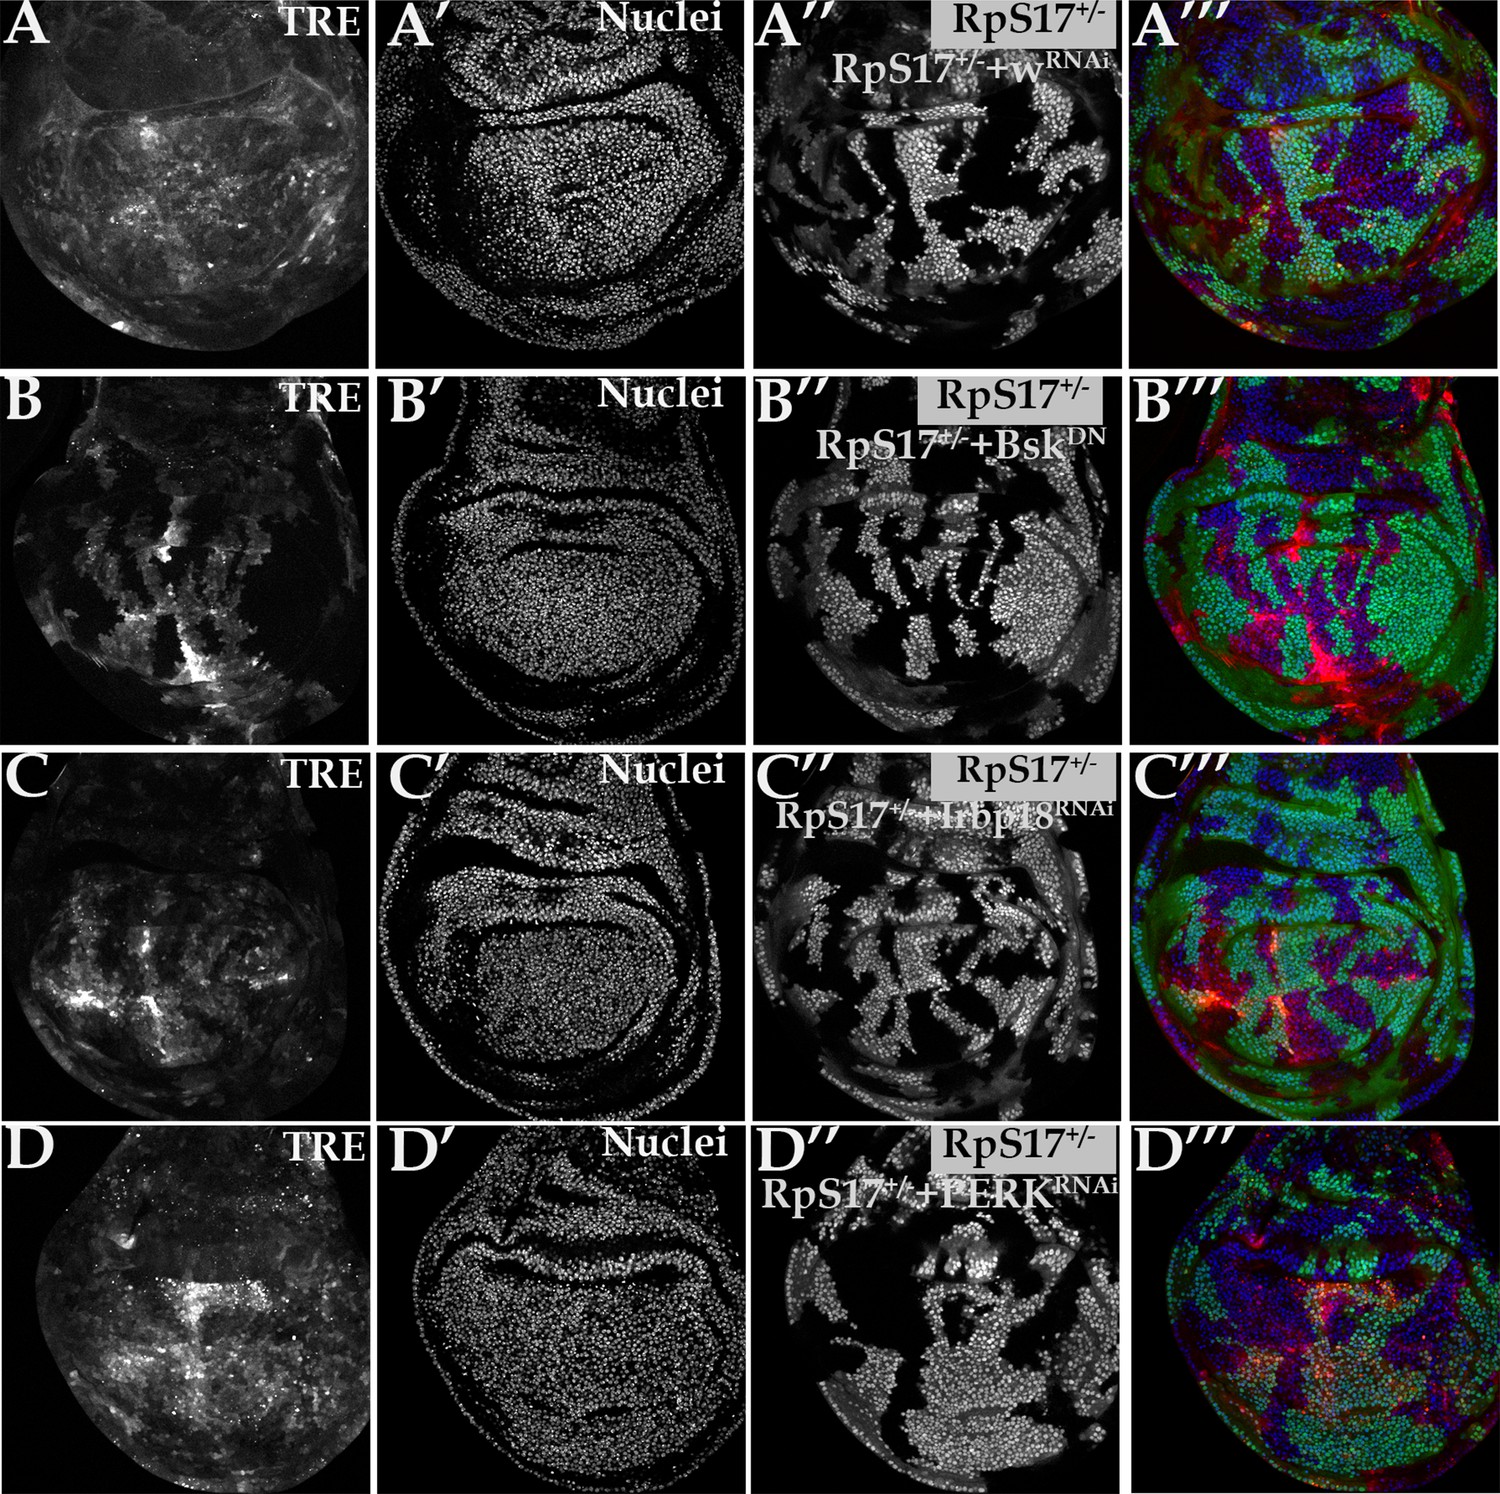
PERK is dispensable for Xrp1-dependent JnK activity in Minute cells.
All panels show single confocal planes from RpS17+/- third instar wing imaginal discs, co-expressing GFP and the indicated constructs in the green-labeled clones. All the sections pass through the central region of the disc proper containing nuclei, as indicated by the DNA stain. (A) Clonal knockdown of the w gene did not affect TRE-dsRed, a reporter for JNK activity; (B) BskDN expression extinguished TRE-dsRed from cell clones, confirming JNK-dependence of this reporter; (C) Irbp18 knock-down extinguished TRE-dsRed from cell clones, confirming Xrp1/Irbp18-dependence of this reporter, as previously concluded from non-clonal experiments (Lee et al., 2018); (D) PERK knock-down had little effect on TRE-dsRed, suggested that JNK is activated by Xrp1/Irbp18 independently of eIF2α phosphorylation. Genotypes: A: p{hs:FLP}/+; TRE-dsRed/+; RpS17, act> CD2> Gal4, UAS-GFP /UAS- RNAiw, B: p{hs:FLP}/+; TRE-dsRed/+; RpS17, act> CD2> Gal4, UAS-GFP /UAS- BskDN, C: p{hs:FLP}/+; TRE-dsRed/+; RpS17, act> CD2> Gal4, UAS-GFP /UAS- RNAiIrbp18, D: p{hs:FLP}/+; TRE-dsRed/ UAS- RNAiPERK; RpS17, act> CD2> Gal4, UAS-GFP /+.
Figure 6—figure supplement 2
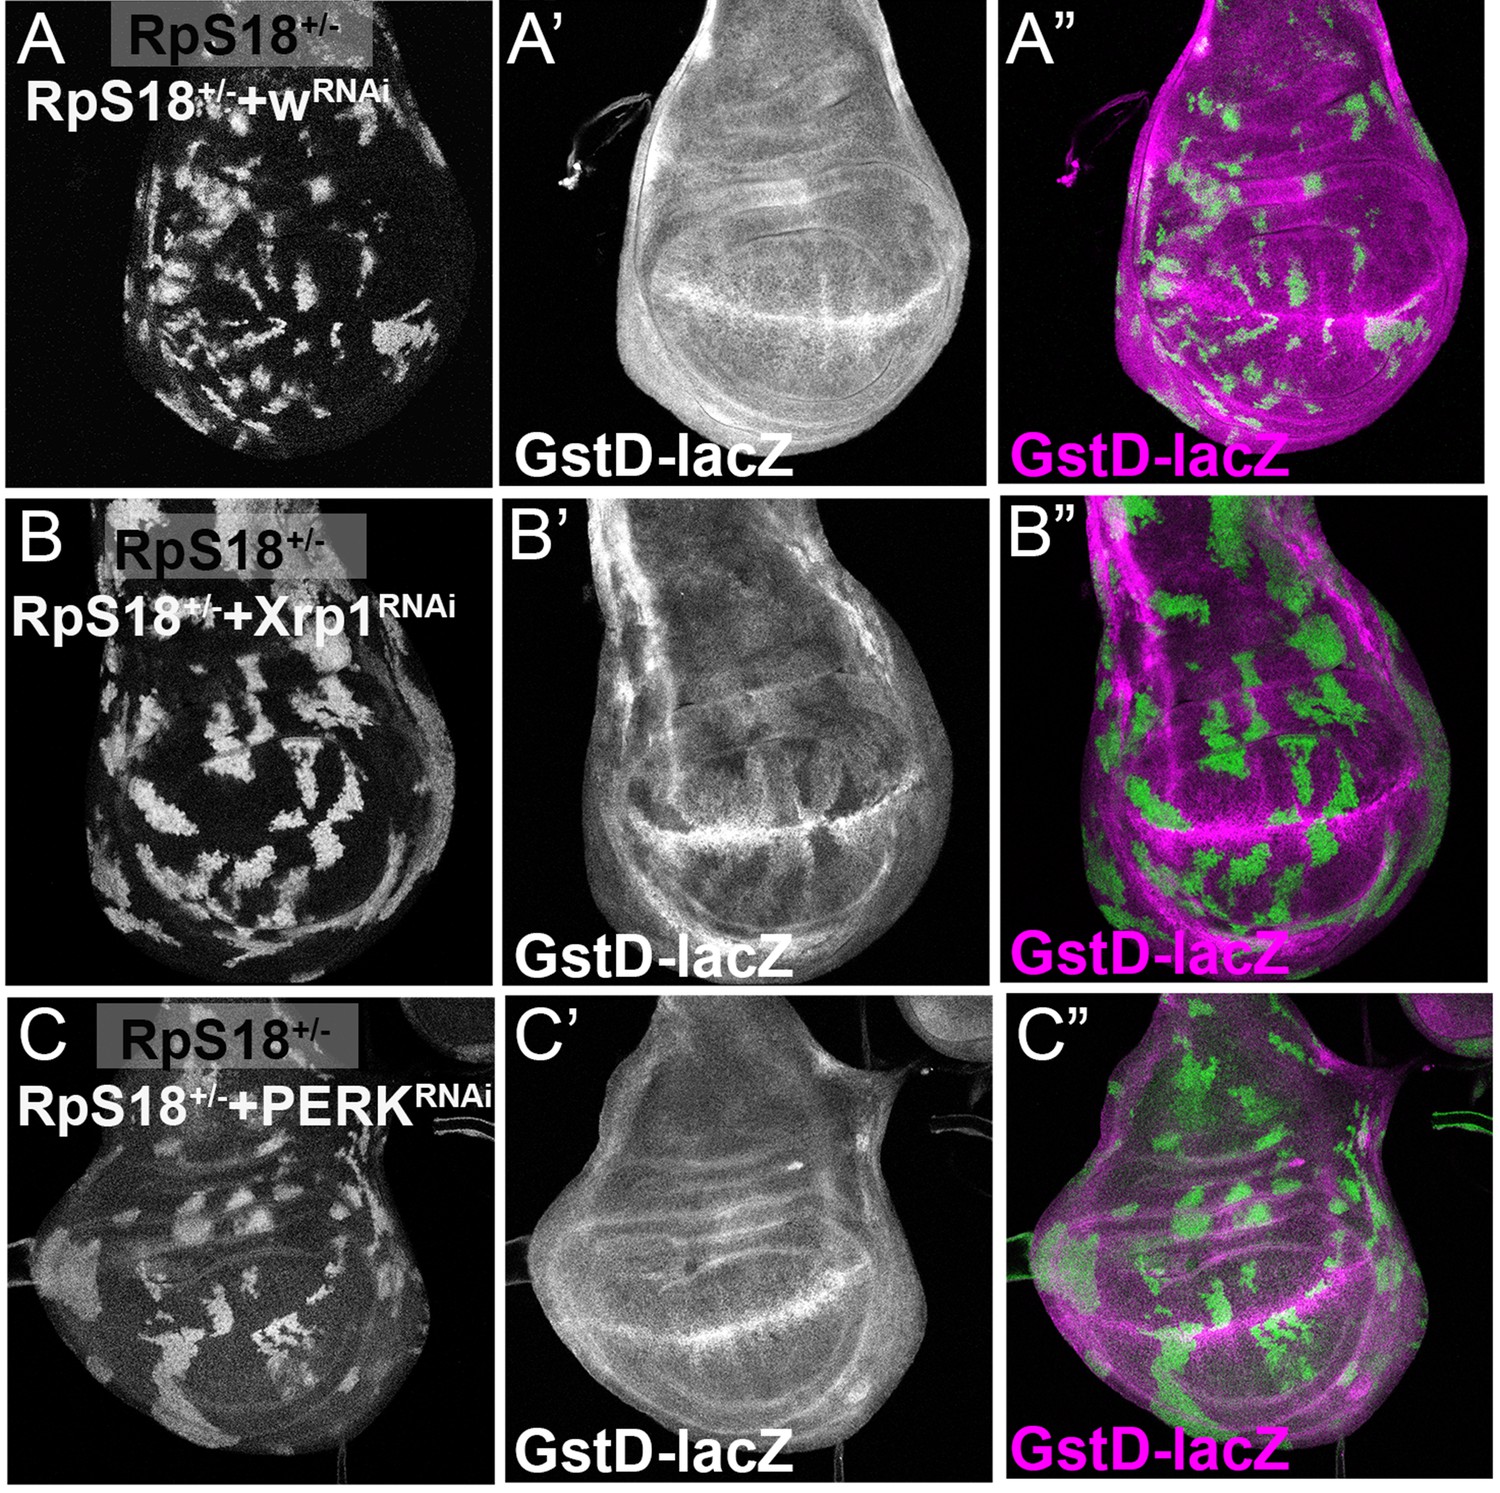
PERK is dispensable for Xrp1-dependent GstD1 activity in Minute cells.
All panels show single confocal planes from RpS18+/- third instar wing imaginal discs, co-expressing GFP and the indicated constructs in the green-labeled clones. (A) Clonal knockdown of the w gene did not affect GstD1-LacZ, a reporter for oxidative stress response; (B) Xrp1 knock-down extinguished GstD1-LacZ from cell clones, confirming Xrp1-dependence of this reporter, as seen in non-clonal experiments (Lee et al., 2018); (C) PERK knock-down had no effect on GstD1-LacZ, suggested that Xrp1 regulates GstD1-LacZ independently of eIF2α phosphorylation. Genotypes: A: p{hs:FLP}/+;GstD1-lacZ, RpS18-/+; act> CD2> Gal4, UAS-GFP / UAS-RNAiw, B: p{hs:FLP}/+; UAS- RNAiXrp1/ GstD1 lacZ, RpS18-; act> CD2> Gal4, UAS-GFP/+, C: p{hs:FLP}/+; UAS- RNAiPERK / GstD1-lacZ, RpS18-; act> CD2> Gal4, UAS-GFP/+.
Figure 7 with 3 supplements
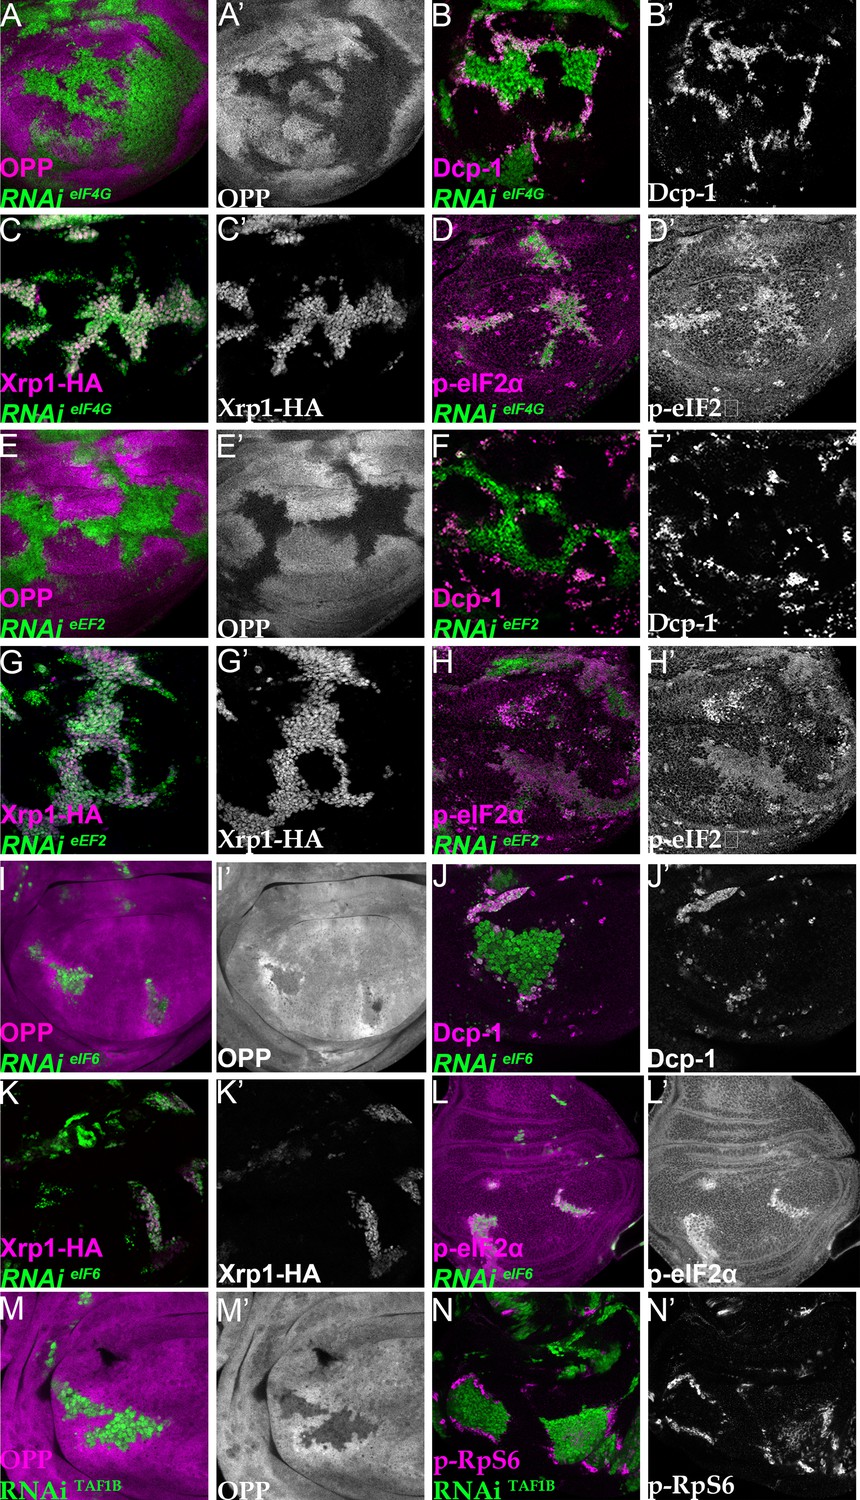
Depletion of translation factors induces Xrp1 expression, eIF2α phosphorylation, reduced translation, and cell competition.
Clones of cells depleted for translation factors are labelled in green. In each case, translation factor depletion reduced translation rate, resulted in competitive cell death at interfaces with wild type cells, induced Xrp1-HA expression, and led to eIF2α phosphorylation. Translation rate, dying cells (activated caspase Dcp1), Xrp1-HA and p-eIF2α are indicated in magenta and in separate channels as labelled. To clarify cell-autonomy, cell death is also shown in higher magnification in Figure 7—figure supplement 2. (A–D) Clones expressing RNAi for eIF4G. (E–H) Clones expressing RNAi for eEF2. (I–L) Clones expressing RNAi for eIF6. In all cases (panels A,E,I), wild-type cells near to cells depleted for translation factors show higher translation rate than other wild type cells. (M) Clones of cells depleted for TAF1B (green) also showed a cell-autonomous reduction in translation rate and non-autonomous increase in nearby wild-type cells (translation rate in magenta, see also M’). (N) Clones of cells depleted for TAF1B (green) showed a non-autonomous increase in RpS6 phosphorylation in nearby cells (magenta, see also N’). Additional data relevant to this Figure is shown in Figure 7—figure supplement 1 and Figure 7—figure supplement 2. Genotypes: A, B, D: {hs:FLP}/+; UAS – RNAieIF4G /+; act> CD2> Gal4, UAS-GFP /+ (line: v17002), C:{hs:FLP}/+; UAS – RNAieIF4G /+; act> CD2> Gal4, UAS-GFP /Xrp1-HA (line: v17002), E, F, H: {hs:FLP}/+; UAS – RNAieEF2 /+; act> CD2> Gal4, UAS-GFP /+ (line: v107268), G: {hs:FLP}/+; UAS – RNAieEF2 /+; act> CD2> Gal4, UAS-GFP / Xrp1-HA (line: v107268), I, J, L:{hs:FLP}/+; UAS – RNAi eIF6 /+; act> CD2> Gal4, UAS-GFP / + (line: v108094), K: {hs:FLP}/+; UAS – RNAieIF6 /+; act> CD2> Gal4, UAS-GFP / Xrp1-HA(line: v108094), M, N: p{hs:FLP}/+; UAS-RNAiTAF1B/+;act> CD2> Gal4, UAS- GFP /+ (line: Bl 61957).
Figure 7—figure supplement 1
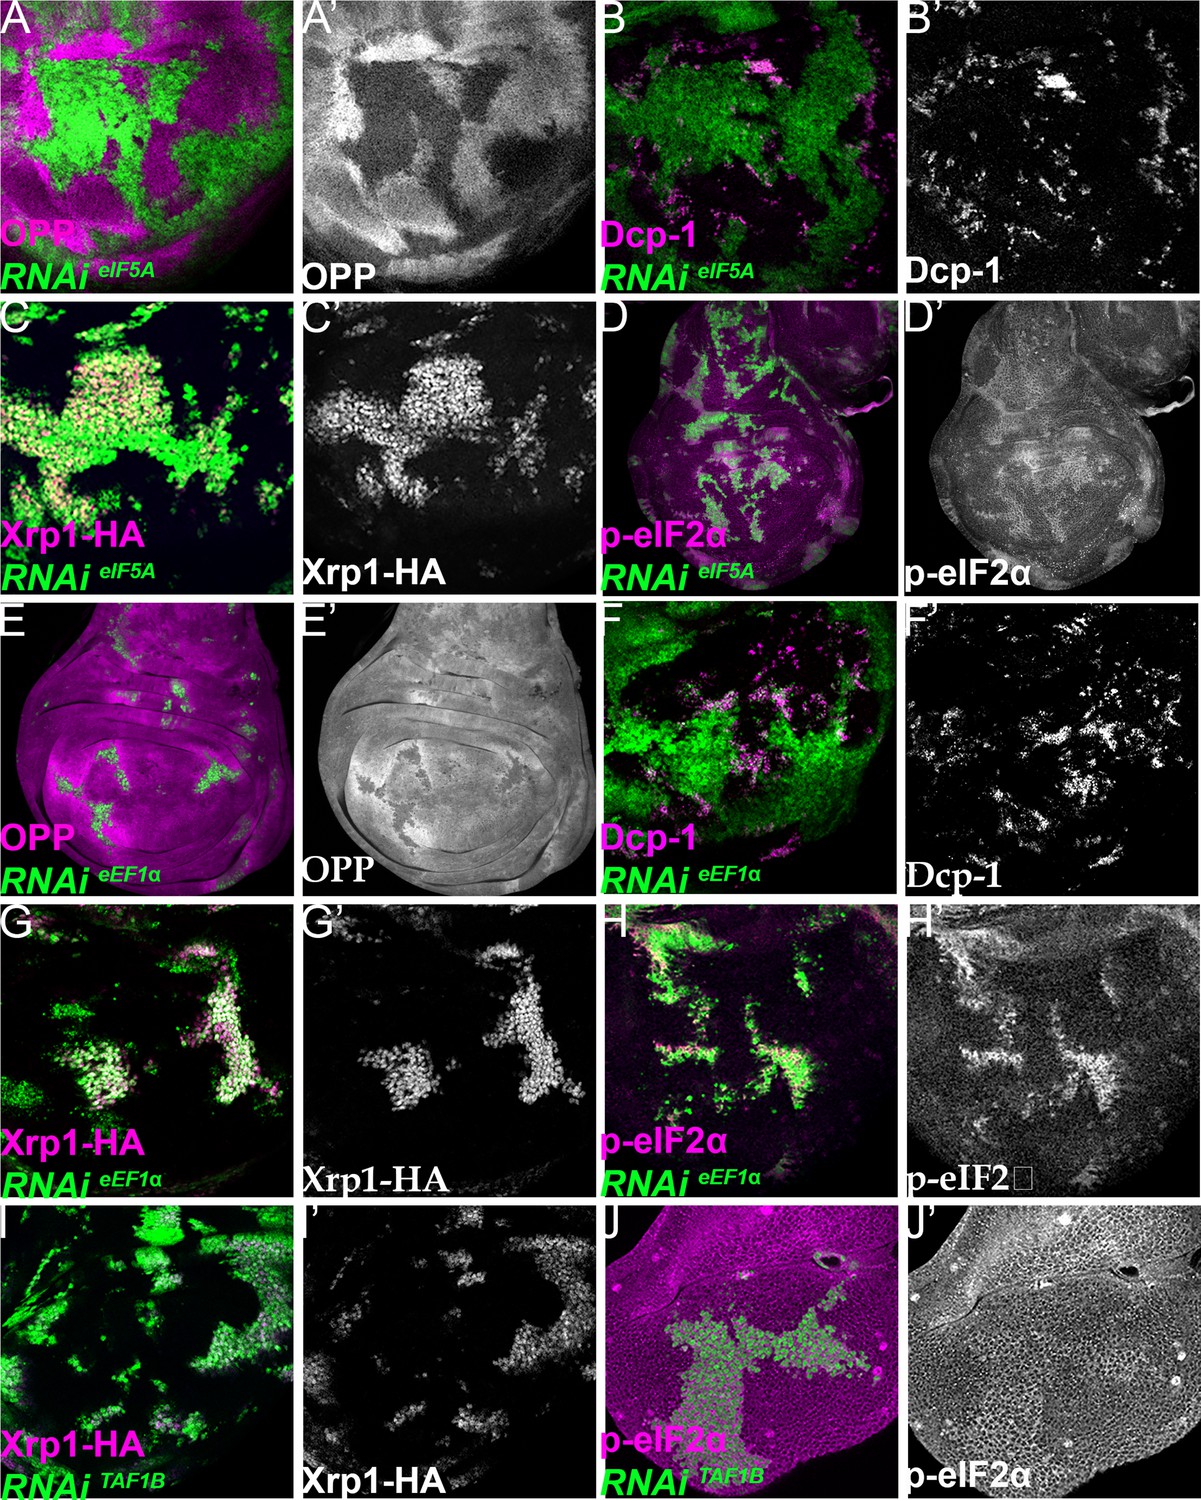
Xrp1 expression, eIF2α phosphorylation, reduced translation, and cell competition after depletion of additional translation factors.
Clones of cells depleted for translation factors are shown in green. In each case, translation factor depletion reduced translation rate, resulted in competitive cell death at interfaces with wild-type cells, induced Xrp1-HA expression, and led to eIF2α phosphorylation. Translation rate, dying cells (activated caspase Dcp1), Xrp1-HA and p-eIF2α are indicated in magenta and in separate channels as labelled. To clarify cell-autonomy, cell death is also shown in higher magnification in Figure 7—figure supplement 2. (A–D) Clones expressing RNAi for eIF5A. (E–H) Clones expressing RNAi for eEF1α. (I,J) Clones expressing RNAi for TAF1B. (I,J) Clones expressing RNAi for TAF1B. Genotypes: A, B, D: {hs:FLP}/+; UAS – RNAieIF5A /+; act> CD2> Gal4, UAS-GFP / + (line: v101513), C: {hs:FLP}/+; UAS – RNAi eIF5A /+; act> CD2> Gal4, UAS-GFP / Xrp1-HA (line: v101513), E, F, H: {hs:FLP}/+; UAS – RNAieEF1α1 /+; act> CD2> Gal4, UAS-GFP /+ (line: v104502), G: {hs:FLP}/+; UAS – RNAieEF1α1 /+; act> CD2> Gal4, UAS-GFP / Xrp1-HA (line: v104502), I: p{hs:FLP}/+; UAS- RNAiTAF1B /+;act> CD2> Gal4, UAS- GFP / Xrp1-HA (line: v105873), J: p{hs:FLP}/+; UAS- RNAiTAF1B /+;act> CD2> Gal4, UAS- GFP /+ (line: Bl 61957).
Figure 7—figure supplement 2
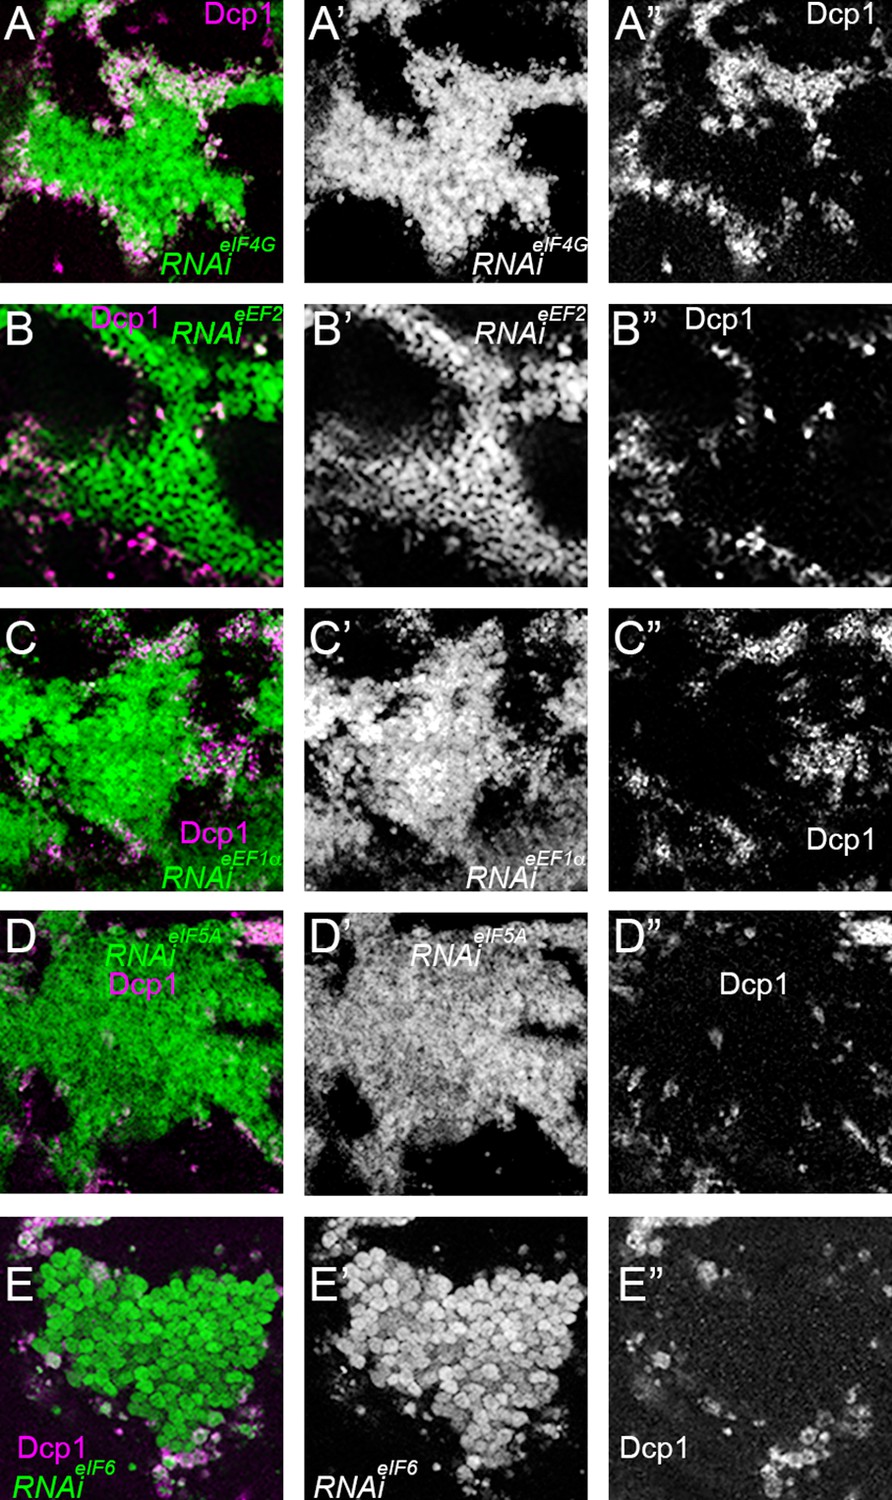
Cell-autonomy of cell death after translation factor depletion.
All panels show cell death, indicated by Dcp1 labeling in magenta in panels A-E and in white in panels A”-E”, associated with clones of cells depleted for the indicated translation factors (green in panels A-E and white in panels A’-E’). The images shown are enlargements of portions of Figure 7B, F and J and Figure 7—figure supplement 1 panels B, F. In all cases, the large majority of the dying cells are cells depleted for translation factors close to the wild-type cells (black in panels A-E and A’-E’), with only a few depleted cells dying away from the clone boundary, and only a few dying wild-type cells. (A-A”) RNAi for eIF4G; (B) RNAi for eEF2; (C) RNAi for eEF1α(D) RNAi for eIF5A; (E) RNAi for eIF6.
Figure 7—figure supplement 3
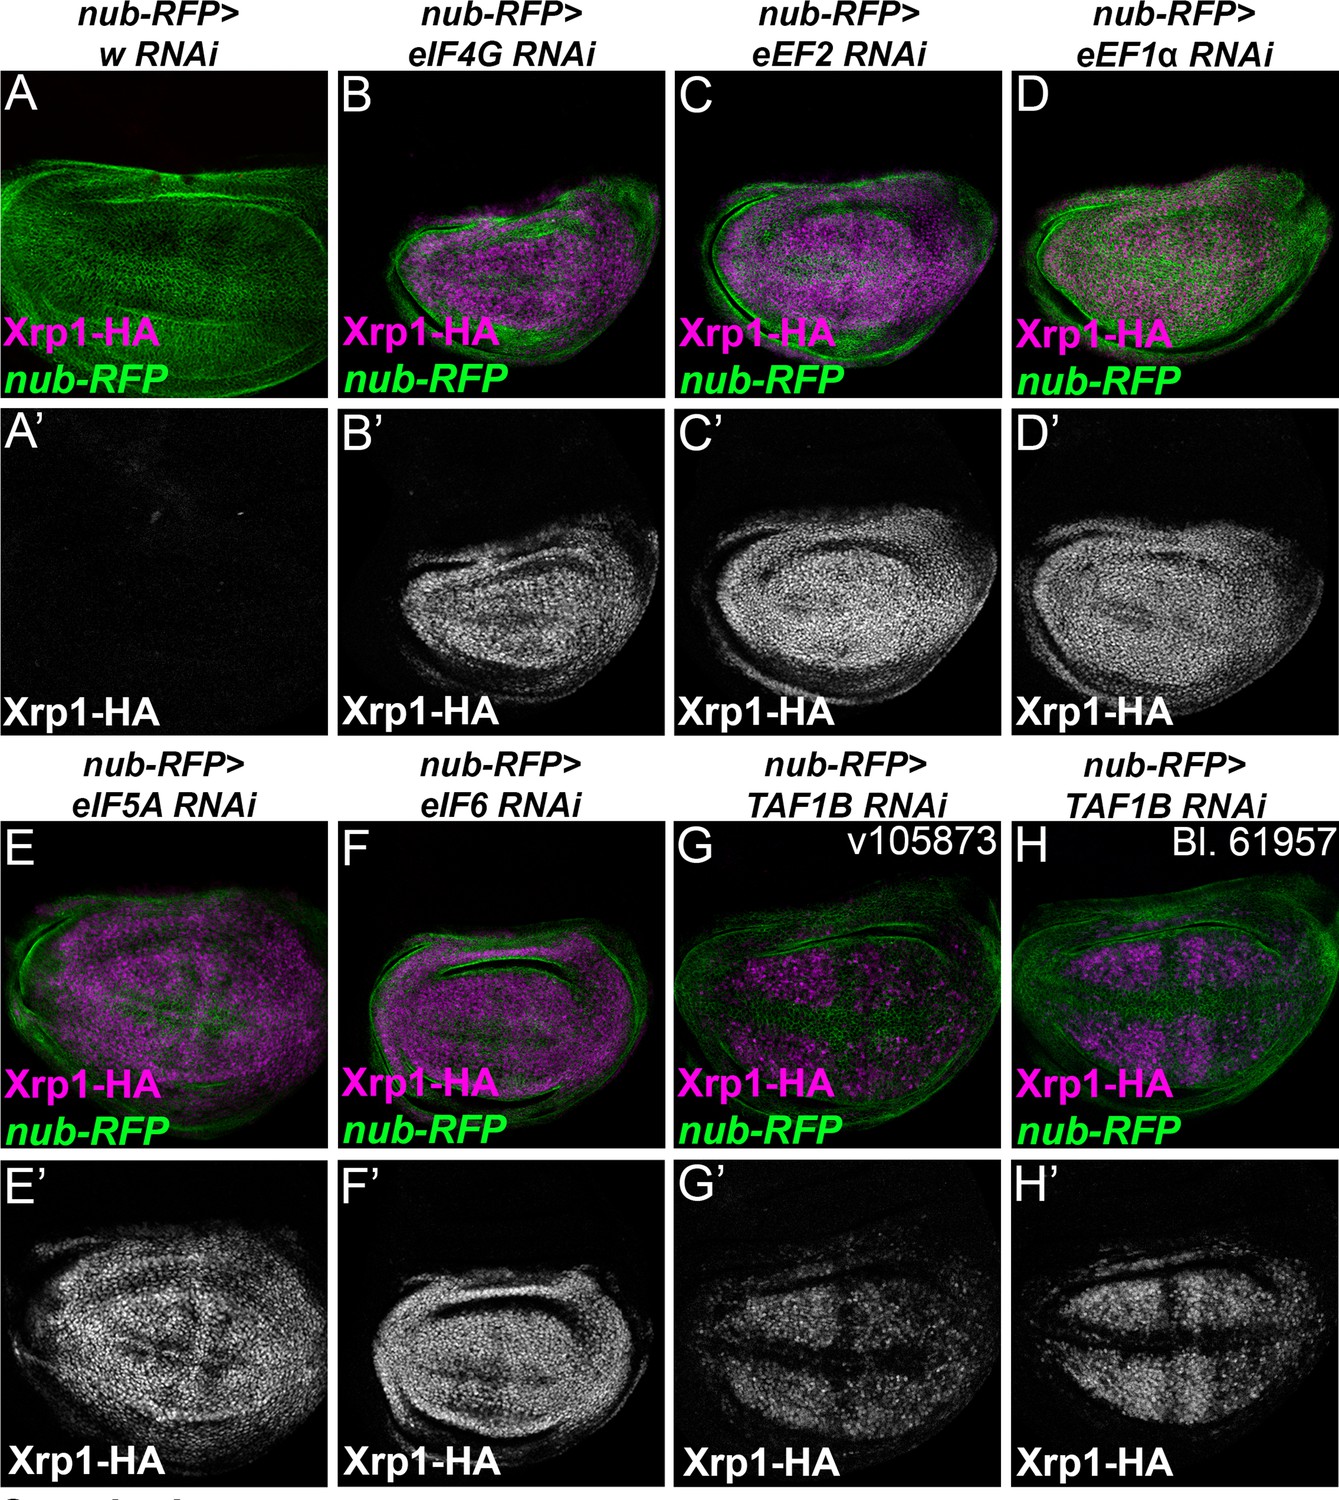
Translation factor knock-down induces Xrp1 expression.
Knock down of translation factors using nub-Gal4 to drive RNAi in the wing pouch (green) induced Xrp1-HA expression (magenta, and separate channels as indicated). (A) In the control of nub-Gal4 expressing RFP along with w-RNAi, negligible Xrp1-HA was detected (see A’). (B) eIF4G-RNAi. (C) eEF2- RNAi. (D) eEF1α1-RNAi. (E) eIF5A-RNAi. (F) eIF6-RNAi. (G) TAF1B-RNAi (H) TAF1B-RNAi. Genotypes: A: nubGal4, UAS-RFP/+; Xrp1-HA/RNAiw, B: nubGal4, UAS-RFP/ UAS – RNAieIF4G; Xrp1-HA/+, C: nubGal4, UAS-RFP/ UAS –RNAieEF2; Xrp1-HA/+, D: nubGal4, UAS-RFP/ UAS – RNAieEF1α1; Xrp1-HA/+, E: nubGal4, UAS-RFP/ UAS – RNAi eIF5A; Xrp1-HA/+, F: nubGal4, UAS-RFP/ UAS – RNAi eIF6; Xrp1-HA/+, G: nubGal4, UAS-RFP/ RNAiTAF1B; Xrp1-HA/+ (v105873), H: nubGal4, UAS-RFP/ RNAiTAF1B; Xrp1-HA/+ (line: BL 61957).
Figure 8 with 4 supplements
Interrupting the translation cycle activates Xrp1-dependent cell competition, independently of diminished translation.
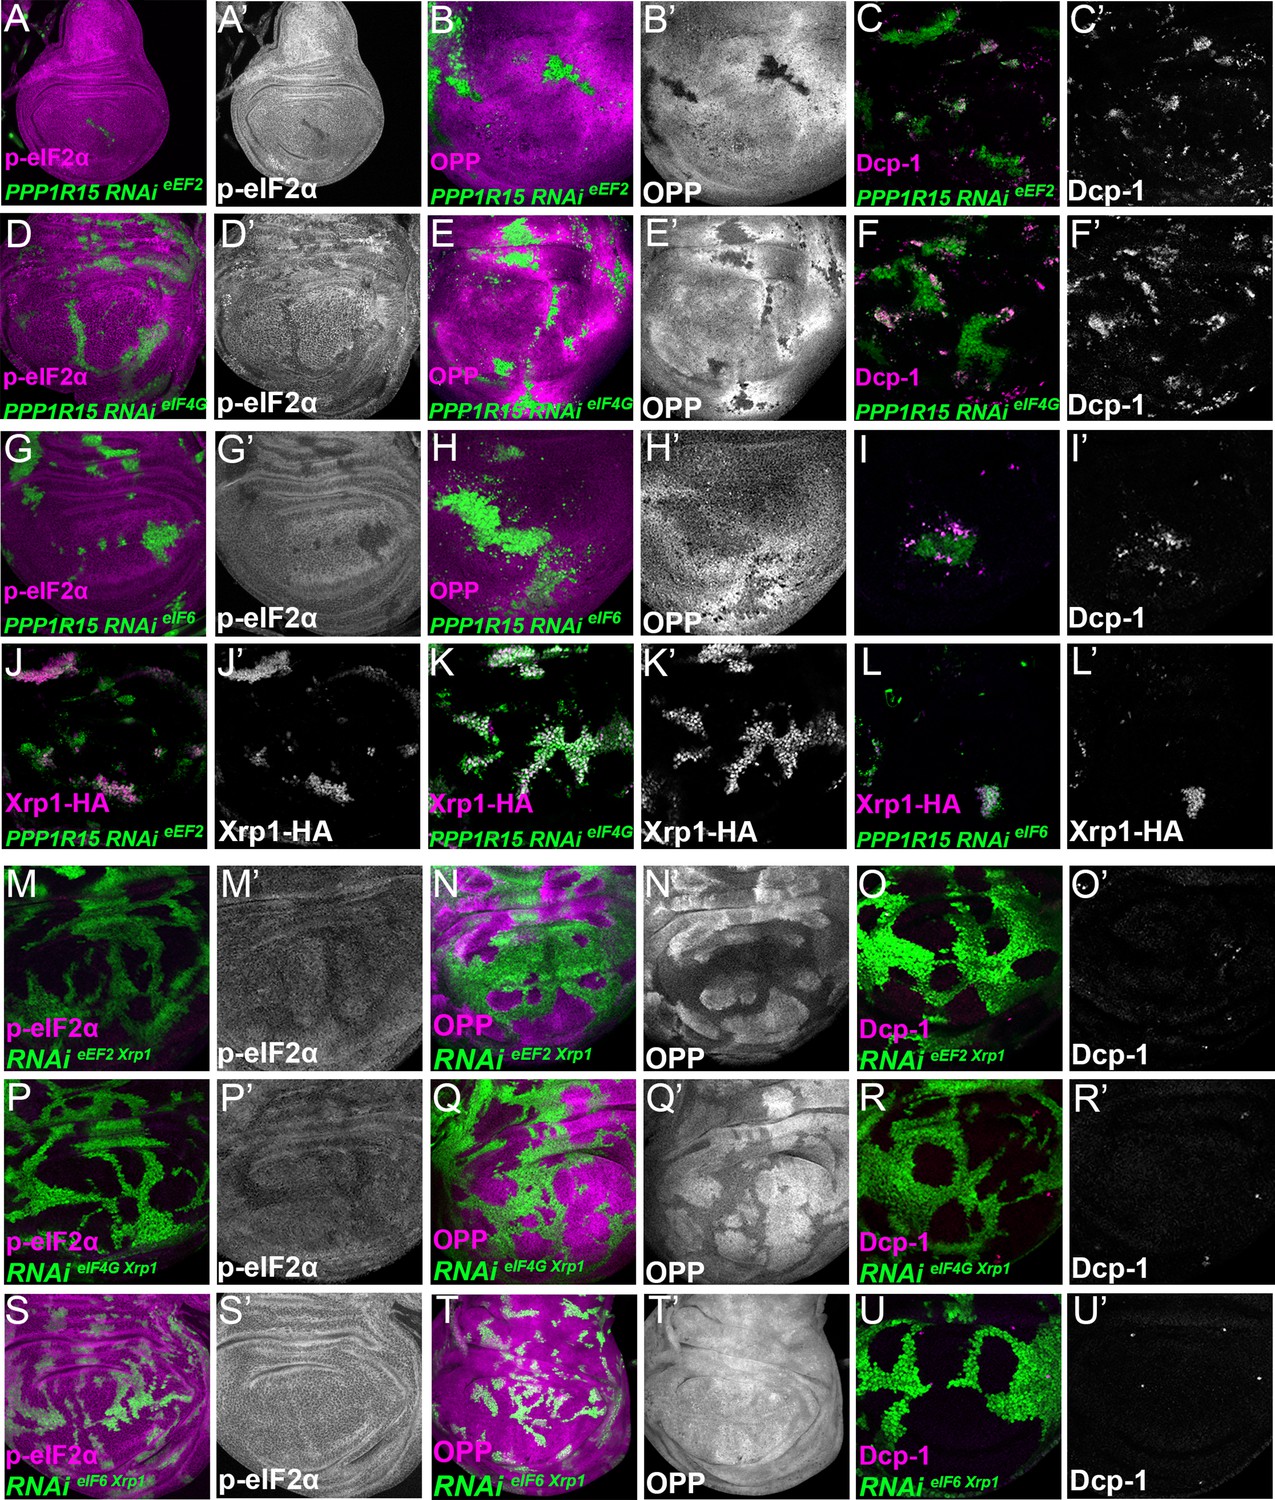
Single confocal planes from third instar wing imaginal discs. p-eIF2α levels, translation rate (ortho-propargyl puromycin), dying cells (activated caspase Dcp1) and Xrp1-HA are indicated in magenta and in separate channels as labelled. (A–L) Clones of cells depleted for translation factors which also overexpress PPP1R15 are shown in green. In each case, PPP1R15 overexpression was sufficient to reduce eIF2α phosphorylation to near control levels (or even lower), but it did not restore normal translation rates, did not affect Xrp1-HA levels and did not reduce competitive cell death. (A–C) Clones co-expressing PPP1R15 and RNAi for eEF2. (D–F) Clones co-expressing PPP1R15 and RNAi eIF4G. (G-I) Clones co-expressing PPP1R15 and RNAi for eIF6. (J–K) Xrp1-HA expression (magenta) in clones co-expressing PPP1R15 and RNAi for eEF2 (J), eIF4G (K), or eIF6 (L). (M–U) Clones of cells depleted for translation factors which also express Xrp1-RNAi are shown in green. (M–O) Clones depleted for Xrp1 as well as eEF2 expressed phospho-eIF2α at near to control levels, only partially restored overall translation rate, but lacked competitive cell death. (P–R) Clones depleted for Xrp1 as well as eIF4G expressed phospho-eIF2α at near to control levels, only partially restored overall translation rate, but lacked competitive cell death. (S–U) Clones depleted for Xrp1 as well as eIF6 expressed phospho-eIF2α at near to control levels, restored overall translation rate and lacked competitive cell death. Genotypes: A-C: {hs:FLP}/+; UAS – RNAieEF2/ UAS-PPP1R15; act> CD2> Gal4, UAS-GFP / +, D-F: {hs:FLP}/+; UAS – RNAieIF4G /UAS-PPP1R15; act> CD2> Gal4, UAS-GFP / +, G-I: {hs:FLP}/+; UAS – RNAieIF6/ UAS-PPP1R15; act> CD2> Gal4, UAS-GFP / +, J: {hs:FLP}/+; UAS – RNAieEF2/ UAS-PPP1R15; act> CD2> Gal4, UAS-GFP / Xrp1-HA, K: {hs:FLP}/+; UAS – RNAieIF4G /UAS-PPP1R15; act> CD2> Gal4, UAS-GFP / Xrp1-HA, L: {hs:FLP}/+; UAS – RNAieIF6/ UAS-PPP1R15; act> CD2> Gal4, UAS-GFP / Xrp1-HA, M-O: {hs:FLP}/+; UAS – RNAieEF2/ UAS- RNAiXrp1; act> CD2> Gal4, UAS-GFP /+, P-R: {hs:FLP}/+; UAS – RNAieIF4G /UAS- RNAiXrp1; act> CD2> Gal4, UAS-GFP / +, S-U: {hs:FLP}/+; UAS – RNAieIF6/ UAS- RNAiXrp1; act> CD2> Gal4, UAS-GFP / +.
Figure 8—figure supplement 1
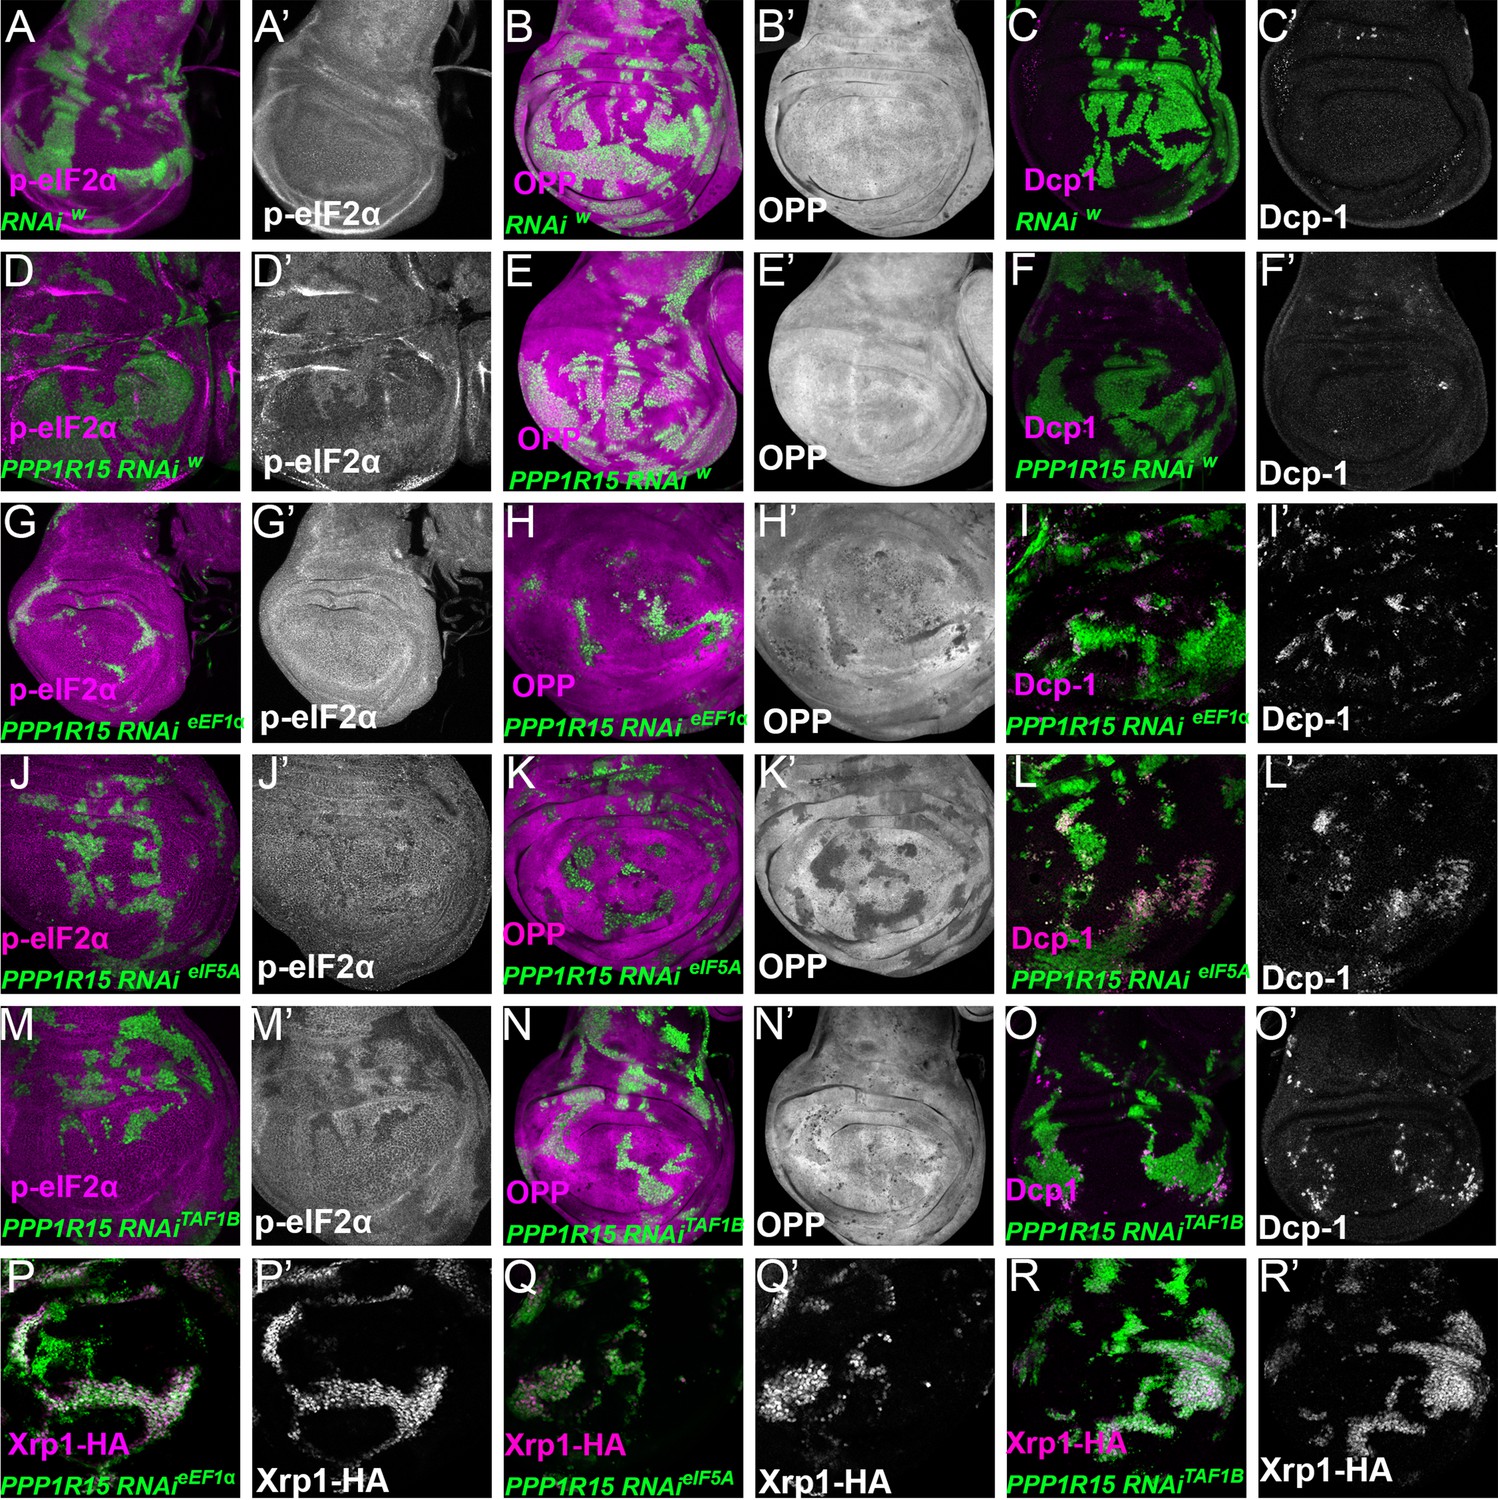
Translation and transcription factor knock down affect global translation, cell competition, and Xrp1 expression, independently of PPP1R15 over-expression.
Single confocal planes from third instar wing imaginal discs. p-eIF2α levels, translation rate (ortho-propargyl puromycin), dying cells (activated caspase Dcp1) and Xrp1-HA are indicated in magenta and in separate channels as labelled. (A–C) Control clones overexpressing RNAi against white showed no effect in p-eIF2a levels(A), translational rates (B) or cell death (C). (D–F) Clones of cells depleted for white gene which also overexpress PPP1R15 (shown in green) present lower levels of eIF2α phosphorylation, but had no effect on translational levels or cell death. (G–R) Clones of cells depleted for translation factors which also overexpress PPP1R15 are shown in green. PPP1R15 overexpression reduced eIF2α phosphorylation in the cells depleted for eEF1α (G), eIF5A (J) or TAF1B (M), but did not restore translation levels back to normal (H, K,N). PPP1R15 overexpression did not reduce Xrp1-HA levels or rescue competitive cell death in the cells depleted for eEF1α (I, P), eIF5A (L, Q) or TAF1B (O, R). Genotypes: A-C: {hs:FLP}/+; act> CD2> Gal4, UAS-GFP / UAS – RNAiw, D-F: {hs:FLP}/+; UAS-PPP1R15/+; act> CD2> Gal4, UAS-GFP / UAS – RNAiw,G-I: {hs:FLP}/+; UAS – RNAieEF1α1 /UAS-PPP1R15; act> CD2> Gal4, UAS-GFP /+ (line: v104502), J-L: {hs:FLP}/+; UAS – RNAieIF5A /UAS-PPP1R15; act> CD2> Gal4, UAS-GFP / + (line: v101513), M-O: p{hs:FLP}/+; UAS- RNAiTAF1B /UAS-PPP1R15;act> CD2> Gal4, UAS- GFP /+ (line: v105873), P: {hs:FLP}/+; UAS – RNAieEF1α1 /UAS-PPP1R15; act> CD2> Gal4, UAS-GFP / Xrp1-HA (line: v104502), Q: {hs:FLP}/+; UAS – RNAieIF5A / UAS-PPP1R15; act> CD2> Gal4, UAS-GFP / Xrp1-HA (line: v101513), R: p{hs:FLP}/+; UAS- RNAiTAF1B / UAS-PPP1R15;act> CD2> Gal4, UAS- GFP / Xrp1-HA (line: v105873).
Figure 8—figure supplement 2
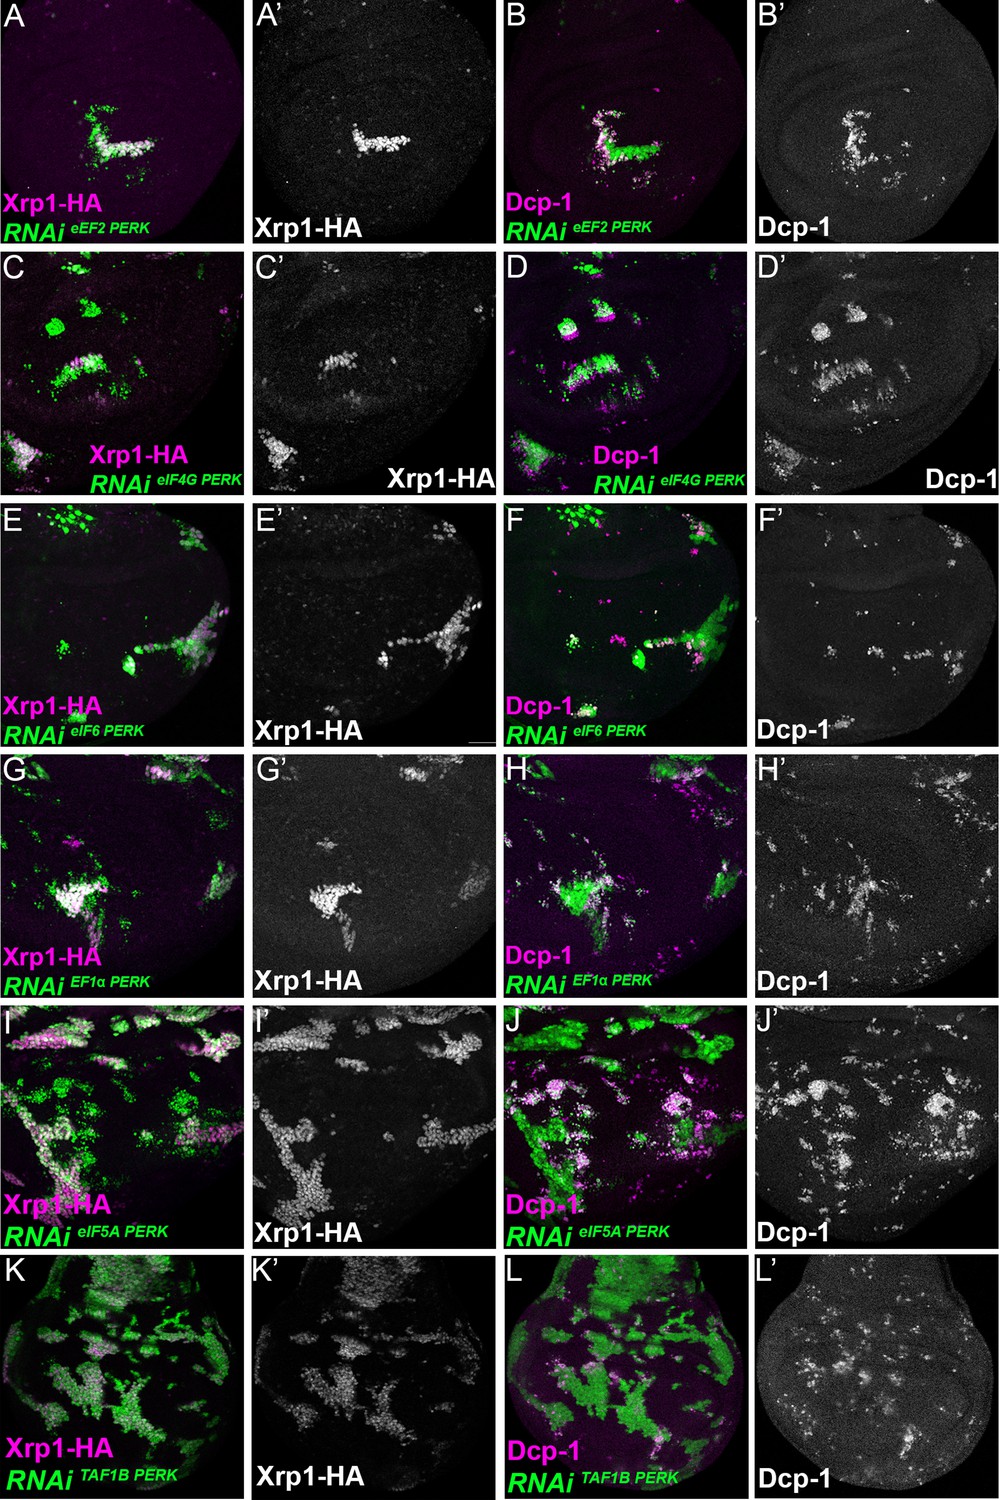
Translation and transcription factor knock down affect Xrp1 expression, and cell survival, independently of PERK knock-down.
Single confocal planes from third instar wing imaginal discs. Dying cells (activated caspase Dcp1) and Xrp1-HA are indicated in magenta and in separate channels as labelled. Clones of cells depleted for translation factors which also overexpress PERK-RNAi (v110278)are shown in green. In no case did PERK depletion affect Xrp1-HA induction or suppress competitive cell death. (A,B) Clones expressing RNAi for both eEF2 and PERK. (C,D) Clones expressing RNAi for both eIF4G and PERK. (E,F) Clones expressing RNAi for both eIF6 and PERK. (G,H) Clones expressing RNAi for both eEF1α1 and PERK. (I,J). Clones expressing RNAi for both eIF5A and PERK. (K,L). Clones expressing RNAi for both TAF1B and PERK. Genotypes: A: {hs:FLP}/+; UAS – RNAieEF2/ UAS-RNAiPERK; act> CD2> Gal4, UAS-GFP / Xrp1-HA, B: {hs:FLP}/+; UAS – RNAieEF2/ UAS-RNAiPERK; act> CD2> Gal4, UAS-GFP /+, C: {hs:FLP}/+; UAS – RNAieIF4G /UAS-RNAiPERK; act> CD2> Gal4, UAS-GFP / Xrp1-HA, D: {hs:FLP}/+; UAS – RNAieIF4G /UAS-RNAiPERK; act> CD2> Gal4, UAS-GFP /+, E: {hs:FLP}/+; UAS – RNAieIF6/UAS-RNAiPERK; act> CD2> Gal4, UAS-GFP / Xrp1-HA, F: {hs:FLP}/+; UAS – RNAieIF6/ UAS-RNAiPERK; act> CD2> Gal4, UAS-GFP /+, G: {hs:FLP}/+; UAS – RNAi eEF1α1/UAS-RNAiPERK; act> CD2> Gal4, UAS-GFP / Xrp1-HA, H: {hs:FLP}/+; UAS – RNAieEF1α1 /UAS-RNAiPERK; act> CD2> Gal4, UAS-GFP /+, I: {hs:FLP}/+; UAS – RNAieIF5A/UAS-RNAiPERK; act> CD2> Gal4, UAS-GFP / Xrp1-HA, J: {hs:FLP}/+; UAS – RNAieIF5A /UAS-RNAiPERK; act> CD2> Gal4, UAS-GFP /+, K: {hs:FLP}/+; UAS – RNAiTAF1B/UAS-RNAiPERK; act> CD2> Gal4, UAS-GFP / Xrp1-HA, L: {hs:FLP}/+; UAS – RNAiTAF1B /UAS-RNAiPERK; act> CD2> Gal4, UAS-GFP /+.
Figure 8—figure supplement 3
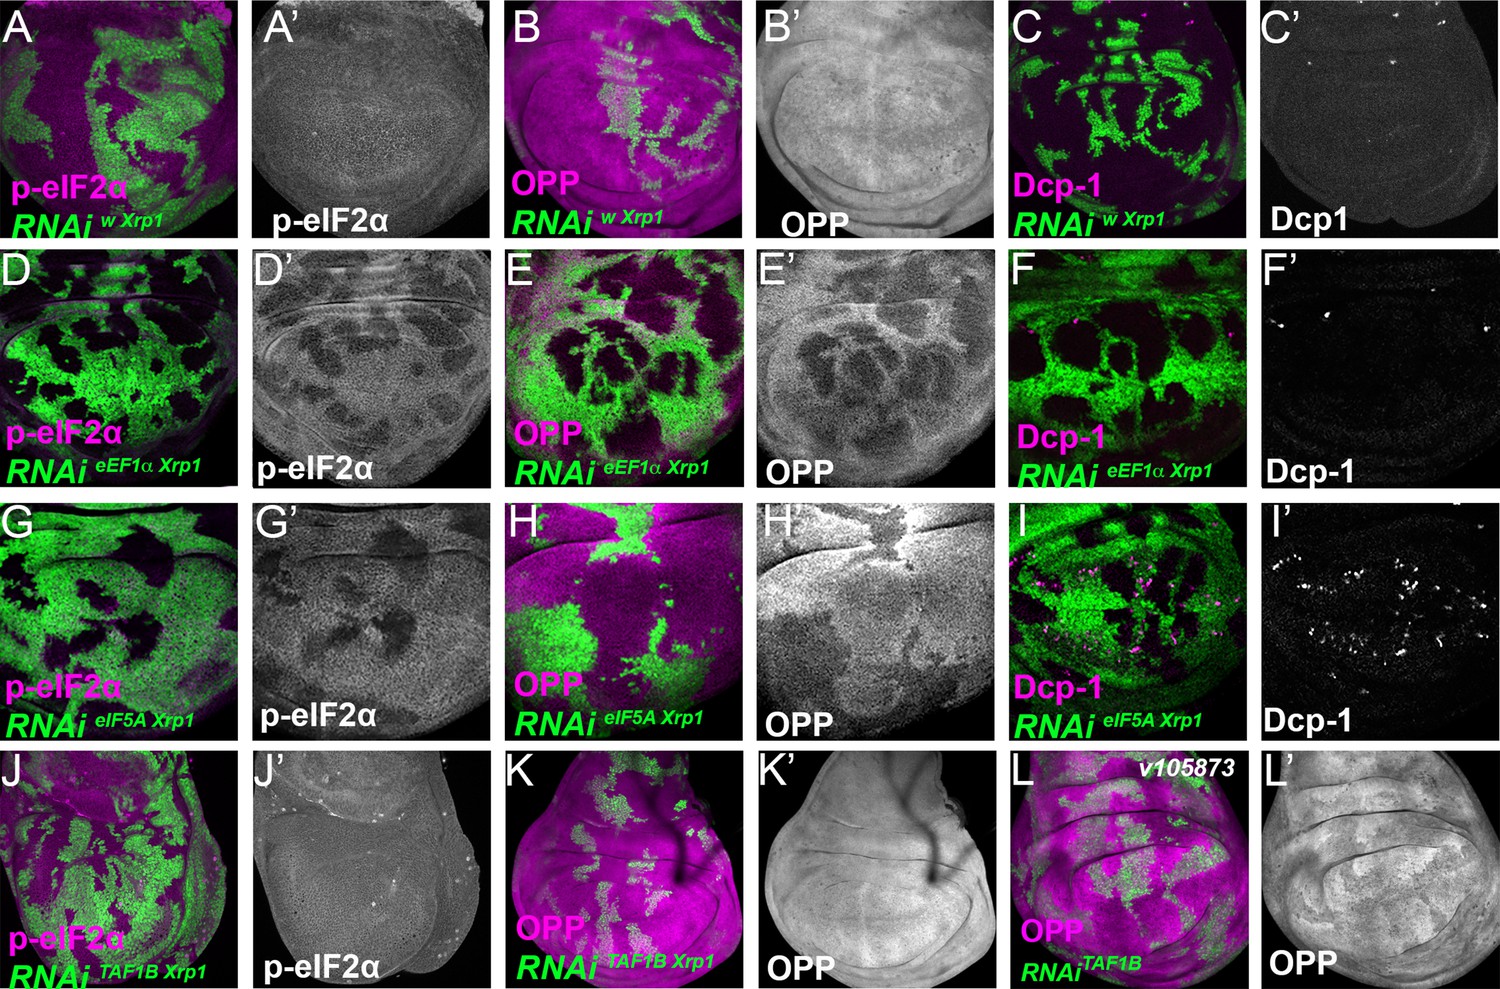
Role of Xrp1 in eIF2α phosphorylation and global translation after knockdown of translation or transcription factors.
Single confocal planes from third instar wing imaginal discs. p-eIF2α levels, translation rate (ortho-propargyl puromycin), dying cells (activated caspase Dcp1) and Xrp1-HA are indicated in magenta and in separate channels as labelled. (A–C) Control clones overexpressing RNAis against both white and Xrp1 showed no effect in p-eIF2a levels(A), translational rates (B) or cell death (C). (D–F) Clones depleted for Xrp1 as well as eEF1α retained high levels of eIF2α phosphorylation but actually showed a global translation rate higher than wild type cells. They lacked competitive cell death. (G–I) Clones of cells depleted eIF5A that also express RNAi for Xrp1 are shown in green. Xrp1-depletion did not reduce eIF2α phosphorylation or restore translation levels, but it reduced levels of competitive cell death (compare panel I and panel B in Figure 7—figure supplement 1). (J–L) Clones depleted for Xrp1 as well as TAF1B expressed phospho-eIF2α at near to control levels and completely restored overall translation rate. Genotypes: A-C: {hs:FLP}/+; UAS- RNAiXrp1/+; act> CD2> Gal4, UAS-GFP / UAS – RNAiw, D-F: {hs:FLP}/+; UAS – RNAieEF1α1 / UAS-RNAiXrp1; act> CD2> Gal4, UAS-GFP /+ (line: v104502), G-I: {hs:FLP}/+; UAS – RNAieIF5A / UAS- RNAiXrp1; act> CD2> Gal4, UAS-GFP /+ (line: v101513), J-K: {hs:FLP}/+; UAS – RNAiTAF1B / UAS- RNAiXrp1; act> CD2> Gal4, UAS-GFP /+ (line: v105873), L: {hs:FLP}/+; UAS – RNAiTAF1B / +; act> CD2> Gal4, UAS-GFP /+ (line: v105873).
Figure 8—figure supplement 4
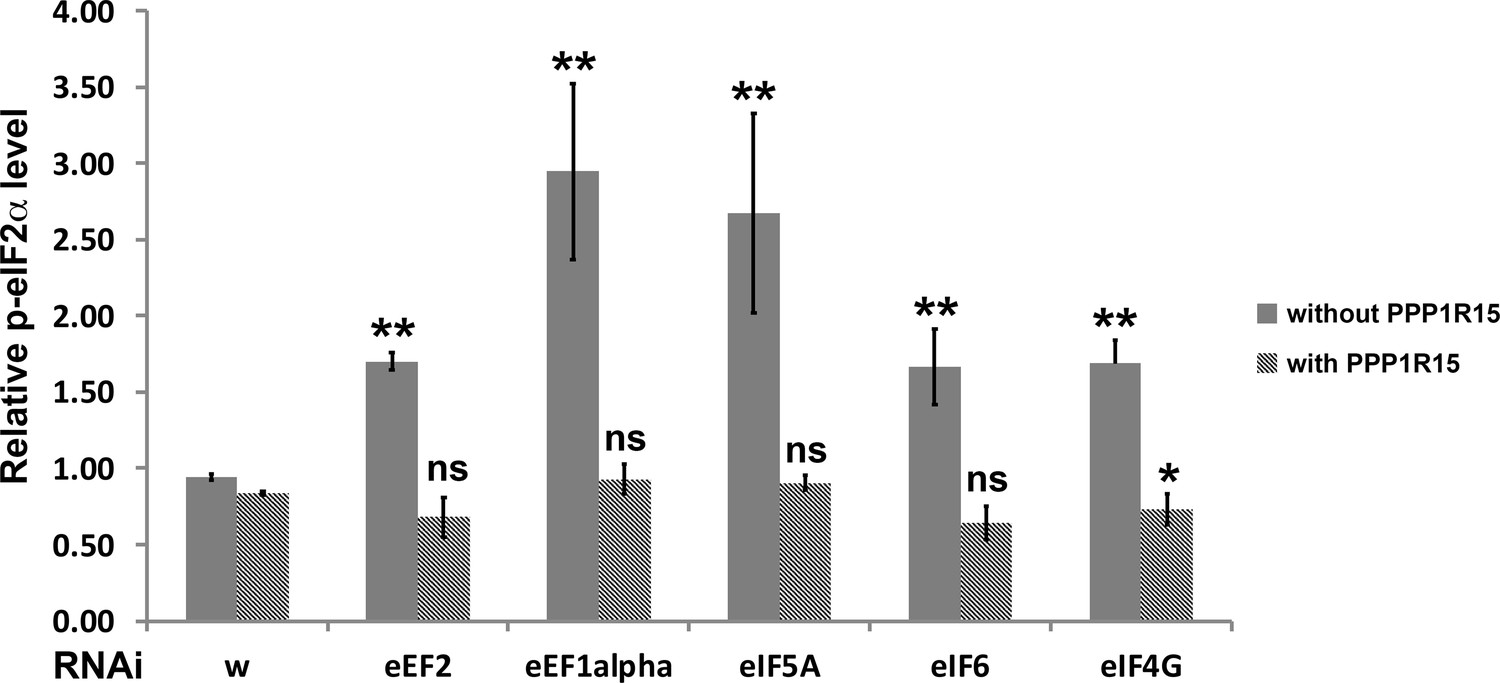
Quantification of p-eIF2α levels.
Relative p-eIF2α levels within RNAi-expressing clones from Figures 6 and 7 (and supplements) were measured as average pixel intensities of single confocal planes using Fiji. Results for clones in each wing disc were pooled and normalized to the p-eIF2α level of wild type regions of the same disc. Mean and standard deviation from multiple discs are shown. Statistical significance is shown for each genotype compared to the w RNAi control or w RNAi+ PPP1 R15 over-expression control, respectively (** - p < 0.01; * - p < 0.05; ns – p ≥ 0.05). In addition, every genotype differed significantly when PPP1R15 was over-expressed. Exact p values, compared to wRNAi: eEF2, p = 3.19 × 10⁻⁶; eEF1α, p = 0.00263; eIF5A, p = 0.00588; eIF6, p = 0.00204; eIF4G, p = 0.00104. Exact p values, compared to wRNAi+ PPP1 R15 over-expression: eEF2+ PPP1 R15, p = 0.175; eEF1α, p = 0.068; eIF5A, p = 0.071; eIF6, p = 0.0954; eIF4G, p = 0.0227. Exact p values, comparing the same genotypes with and without PPP1R15 over-expression: w, p = 0.00231; eEF2, p = 1.95 × 10⁻⁵;eEF1α, p = 0.00255; eIF5A, p = 0.00584; eIF6, p = 0.00104; eIF4G, p = 1.32 × 10⁻⁷. Statistics: pairs of genotypes were compared by t test and the Benjamini-Hochberg procedure for multiple testing used to adjust FDR to 0.05.
Figure 9
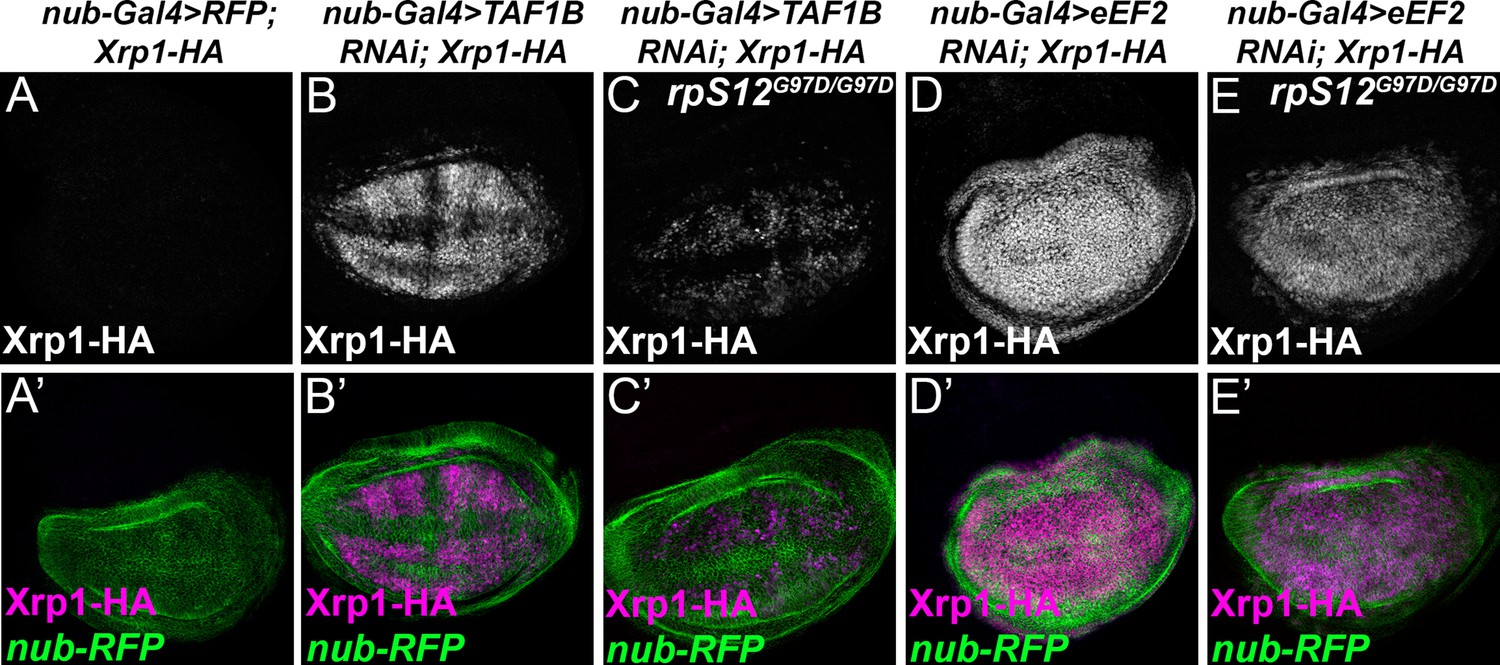
RpS12-dependence of Xrp1 expression.
Figures show projections of Xrp1-HA expression from the wing discs of indicated genotypes. (A) Neglegible Xrp1-HA (magenta in A’) was expressed in control discs where nub-Gal4 drove only reporter RFP expression in the wing pouch (green in A’-E’). (B) TAF1B knockdown resulted in Xrp1-HA expression (magenta in B’). (C) Xrp1-HA expression was greatly reduced when TAF-1B was knocked-down in the rpS12G97D background (see also magenta in C’). (D) eEF2 knockdown resulted in strong Xrp1-HA expression (magenta in D’). (E) Xrp1-HA expression was only moderately reduced when eEF2 was knocked-down in the rpS12G97D background (see also magenta in E’). Genotypes: A: nubGal4, UAS-RFP/+; Xrp1-HA/Xrp1-HA,B: nubGal4, UAS-RFP/ UAS – RNAiTAF1B;Xrp1-HA/ Xrp1-HA (line: v105873), C: nubGal4, UAS-RFP/ UAS –RNAiTAF1B; Rps12G97D, Xrp1-HA/ Rps12G97D, Xrp1-HA, D: nubGal4, UAS-RFP/ UAS – RNAieEF2;Xrp1-HA/ Xrp1-HA, E: nubGal4, UAS-RFP/ UAS –RNAieEF2; Rps12G97D, Xrp1-HA/ Rps12G97D, Xrp1-HA.
Figure 10 with 3 supplements
Transcriptional regulation by Xrp1.
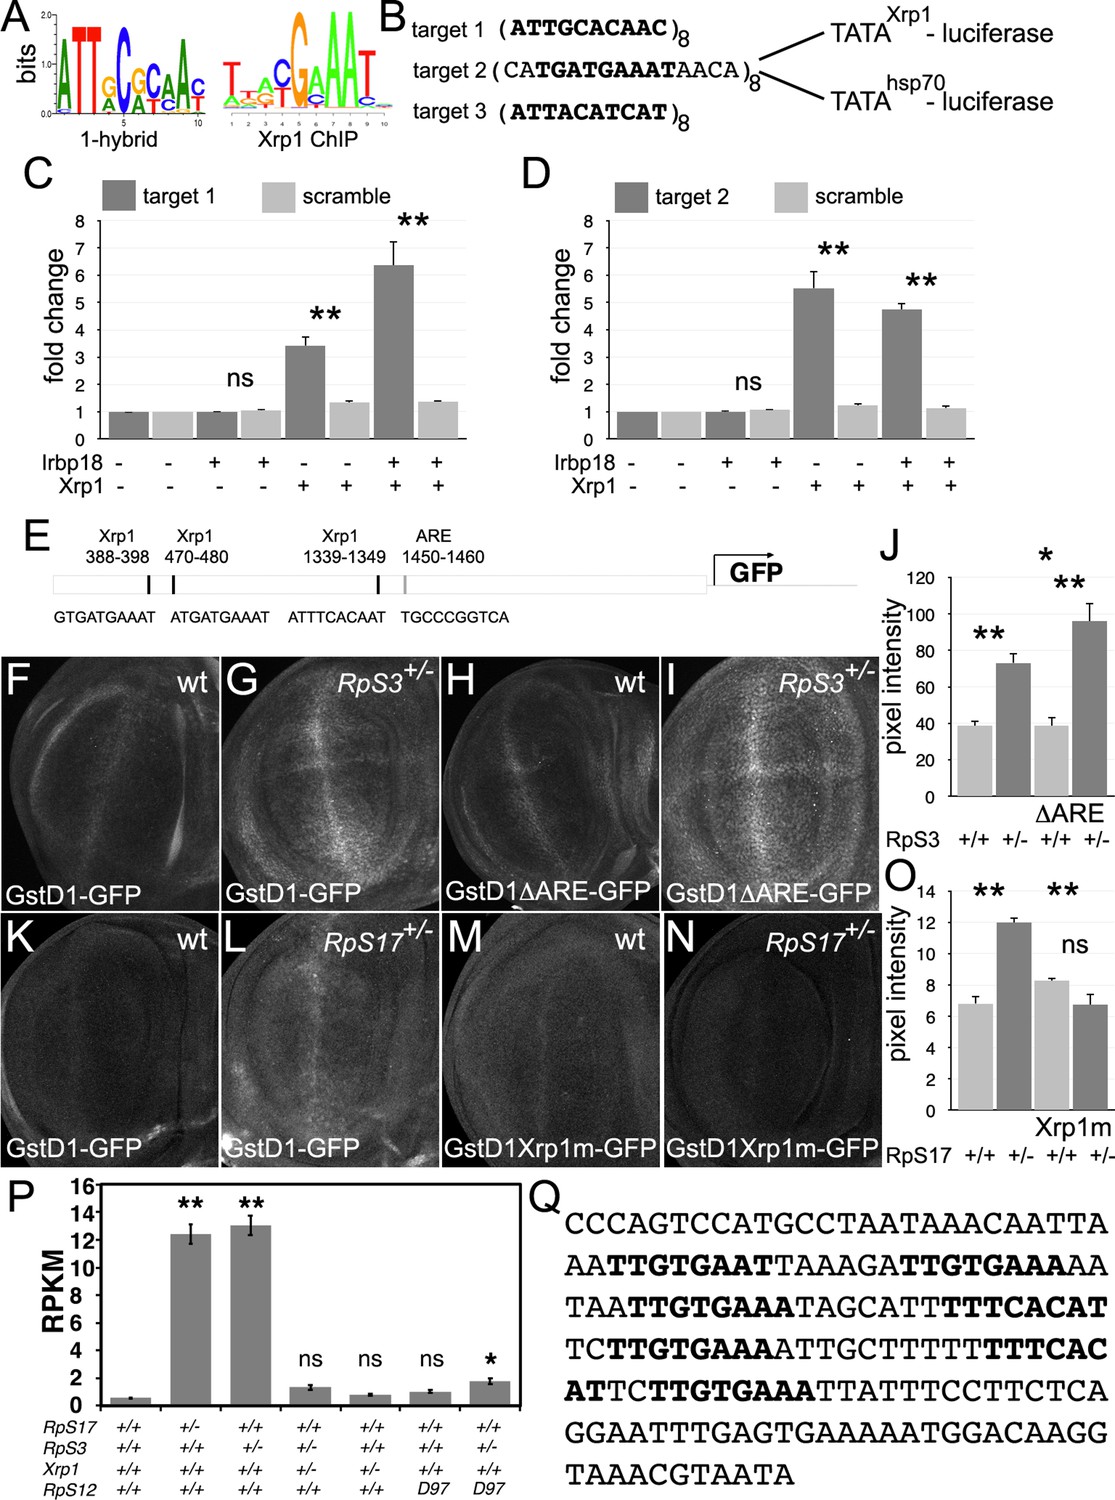
(A) Xrp1/Irbp18 binding consensus defined by bacterial 1-hybrid studies (Zhu et al., 2011) and by Xrp1 ChIP from Drosophila eye imaginal discs overexpressing an Xrp1-HA protein (Baillon et al., 2018). (B) Xrp1 binding motif sequences multimerized in luciferase reporter plasmids upstream of transcription start sites from the Xrp1 gene or from the hsp70 gene. Targets 1 and 3 were based on the 1-hybrid consensus, target 2 is the P element sequence footprinted by Xrp1-Irbp18 (Francis et al., 2016). The match to the consensus sites is shown in bold type. (C) Luciferase assays following transfection of reporters and protein expression plasmids into S2 cells. The target 1-TATAXrp1 reporter showed sequence-specific activation by transfected Xrp1. Transfected Irbp18 alone had no effect, but synergized with Xrp1. p-Values for comparisons between target one reporters and scrambled reporters were: Padj = 1, Padj = 0.00827, Padj = 3.47 × 10⁻⁷, respectively. (D) Luciferase assays following transfection of reporters and protein expression plasmids into S2 cells. The target 2-TATAXrp1 reporter showed sequence-specific activation by transfected Xrp1. Transfected Irbp18 alone had no effect. p-Values for comparisons between target two reporters and scrambled reporters were: Padj = 1, Padj = 2.00 × 10⁻⁸, Padj = 1.96 × 10⁻⁷ respectively. (E) Potential regulatory sequences in the 2.7 kb upstream intergenic fragment used in the GstD1-GFP reporter (Sykiotis and Bohmann, 2008; Brown et al., 2021).3 Xrp1-binding motifs and the antioxidant response element (ARE) are indicated. (F–I) and (K-N) show projections from the central disc-proper regions of wing discs expressing reporter transgenes in the indicated genetic backgrounds. (F) Baseline GstD1-GFP expression in the wild-type wing disc. (G) Elevated GstD1-GFP expression in the RpS3+/- wing disc. (H) Baseline GstD1ΔARE-GFP expression in the wild-type wing disc. (I) Elevated GstD1ΔARE-GFP expression in the RpS3+/- wing disc. (J) Quantification of these results. Average pixel intensity from wing pouch regions was measured. Mean± SEM from multiple samples is shown. N = 5 for each genotype. Exact p values were: for GstD1-GFP in RpS3+/- compared to RpS3+/+, Padj = 0.00257; for GstD1ΔARE-GFP in RpS3+/- compared to RpS3+/+, Padj = 2.55 × 10⁻⁵; for GstD1-GFP in RpS3+/+ compared to GstD1ΔARE-GFP in RpS3+/+, Padj = 0.993; for GstD1-GFP in RpS3+/- compared to GstD1ΔARE-GFP in RpS3+/-, Padj = 0.0313. (K) baseline GstD1-GFP expression in the wild type wing disc. (L) Elevated GstD1-GFP expression in the RpS17+/- wing disc. (M) baseline expression of GstD1-GFP with all 3 Xrp1-binding motifs mutated in the wild type wing disc. (N) Expression of GstD1-GFP with all 3 Xrp1-binding motifs mutated was similar in the RpS17+/- wing disc to the wild type control. (O) Quantification of these results. Average pixel intensity from wing pouch regions was measured. Mean± SEM from multiple samples is shown. N = 5,6,5,6 for respective samples. Exact p values were: for GstD1-GFP in RpS3+/- compared to RpS3+/+, Padj = 2.34 × 10⁻⁶; for GstD1mXrp1-GFP in RpS3+/- compared to RpS3+/+, Padj = 0.116; for GstD1-GFP in RpS3+/+ compared to GstD1mXrp1-GFP in RpS3+/+, Padj = 0.112; for GstD1-GFP in RpS3+/- compared to GstD1mXrp1-GFP in RpS3+/-, Padj = 1.19 × 10⁻⁶. (P) Pooled copia transcript levels for indicated genotypes determined from mRNA-seq data. Mean± standard deviation is shown. Values for individual copia insertions are shown in Figure 10—figure supplement 2. Asterisks indicate statistical significance of the difference from the wild type control: **, p < 0.01; *, p < 0.05; ns, p ≥ 0.05. Exact p values were: for RpS17+/- compared to wild type, p = 4 × 10–14; for RpS3+/- compared to wild type, p = 2.33 × 10⁻¹⁴; for RpS3+/- Xrp1+/- compared to wild type, p = 0.262; for RpS3+/- Xrp1+/- compared to wild type, p = 0.262;for Xrp1+/- compared to wild type, p = 0.494; for RpS3+/- Xrp1+/- compared to wild type, p = 0.262; for rpS12D97/D97 compared to wild type, p = 0.858; for RpS3+/- rpS12D97/D97 compared to wild type, p = 0.0201; for RpS3+/- rpS12D97/D97 compared to wild type, p = 0.0201; for RpS3+/- Xrp1+/- compared to RpS3+/-, p = 4.91 × 10⁻¹⁴; for RpS3+/- Xrp1+/- compared to Xrp1+/-, p = 0.635; for RpS3+/- rpS12D97/D97 compared to rpS12D97/D97, p = 0.251. Statistics:1-way ANOVA with Bonferroni-Holm correction for multiple testing was performed for the data shown in panels C,D,J,O,P. Data in panels C,D were based on triplicate measurements from each of three biological replicates for each transfection. Data in panel P were based on three biological replicates for each genotype. Genotypes: F: GstD1-GFP/+, G: GstD1-GFP/+; FRT82 RpS3 p{arm:LacZ}/+, H: GstD1ΔARE-GFP/+, I: GstD1ΔARE-GFP/+; FRT82 RpS3 p{arm:LacZ}/+, K: GstD1-GFP/+, L: GstD1-GFP; RpS17 p{arm:LacZ} FRT80B/+, M: GstD1 Xrp1m –GFP, N: GstD1Xrp1m-GFP; RpS17 p{arm:LacZ} FRT80B/+. Genotypes of P graph per column: 1st: w11-18; FRT82B/+, 2nd: w11-18; w p{hs:FLP}; RpS17 p{ubi:GFP} FRT80B/+,3rd: w11-18;w p{hs:FLP}; FRT82 RpS3 p{arm:LacZ/+, 4th: w11-18;w p{hs:FLP}; FRT82 RpS3 p{arm:LacZ/FRT82B FRT82B Xrp1M2–73, 5th: w11-18; FRT82B Xrp1M2–73 / +, 6th: w11-18; rpS12D97 FRT80B / rpS12D97 FRT80B, 7th: w11-18; rpS12D97 FRT80B / rpS12D97 FRT80B RpS3.
-
Figure 10—source data 1
Luciferase data relevant to panels C,D.
- https://cdn.elifesciences.org/articles/71705/elife-71705-fig10-data1-v3.xlsx
-
Figure 10—source data 2
GFP data relevant to panel J.
- https://cdn.elifesciences.org/articles/71705/elife-71705-fig10-data2-v3.xlsx
-
Figure 10—source data 3
GFP data relevant to panel O.
- https://cdn.elifesciences.org/articles/71705/elife-71705-fig10-data3-v3.xlsx
-
Figure 10—source data 4
mRNA-Seq data relevant to panel P, and also to Figure 10—figure supplement 3.
- https://cdn.elifesciences.org/articles/71705/elife-71705-fig10-data4-v3.xlsx
Figure 10—figure supplement 1
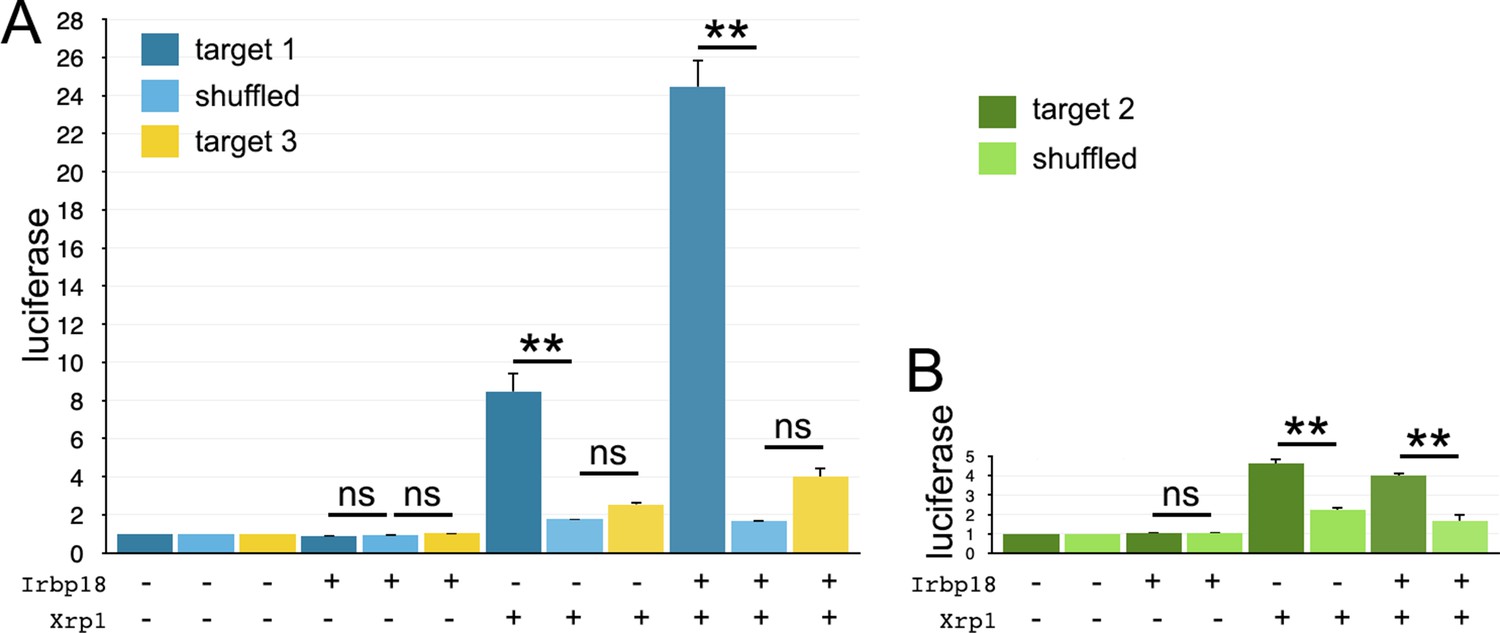
Luciferase assays with hsp70-based reporter plasmids.
Fold change in the luciferase/renilla signal is shown for the remaining reporter constructs shown in Figure 10B. (A) Target one conferred sequence-specific activation by transfected Xrp1 protein. Transfected Irbp18 alone had no effect, but synergized with Xrp1. Lesser activation by Target three was rendered not significant by correction for multiple testing, but the increase in both Xrp1 and Xrp1+ Irbp18 samples suggests that it may nevertheless be real. (B) Target two conferred sequence-specific activation by transfected Xrp1 protein. Transfected Irbp18 alone had no effect. It may be significant that Targets 1 and 3 are better matches to the in vivo-derived ChIP-Seq consensus than Target 2 (see Figure 10A). Statistics:1-way ANOVA with Bonferroni-Holm correction for multiple testing was performed for the data shown in each of panels A,B. ns, p > 0.05.**, p < 0.01. Data were based on triplicate measurements from each of three biological replicates for each transfection. Exact p-values for comparisons between target one reporters and scrambled reporters (panel A) were: Padj = 1, Padj = 1.80 × 10⁻⁶, Padj = 0 for Irbp18, Xrp1, and Irpb18+ Xrp1 transfected cells respectively. Exact p-values for comparisons between target two reporters and scrambled reporters (panel A) were: Padj = 1, Padj = 1, Padj = 0.225 for Irbp18, Xrp1, and Irpb18+ Xrp1 transfected cells respectively. Exact p-values for comparisons between target three reporters and scrambled reporters (panel B) were: Padj = 0.983, Padj = 6.70 × 10⁻⁶, Padj = 8.03 × 10⁻⁶,for Irbp18, Xrp1, and Irpb18+ Xrp1 transfected cells, respectively.
-
Figure 10—figure supplement 1—source data 1
Luciferase measurements relevant to Figure 10—figure supplement 1.
- https://cdn.elifesciences.org/articles/71705/elife-71705-fig10-figsupp1-data1-v3.xlsx
Figure 10—figure supplement 2
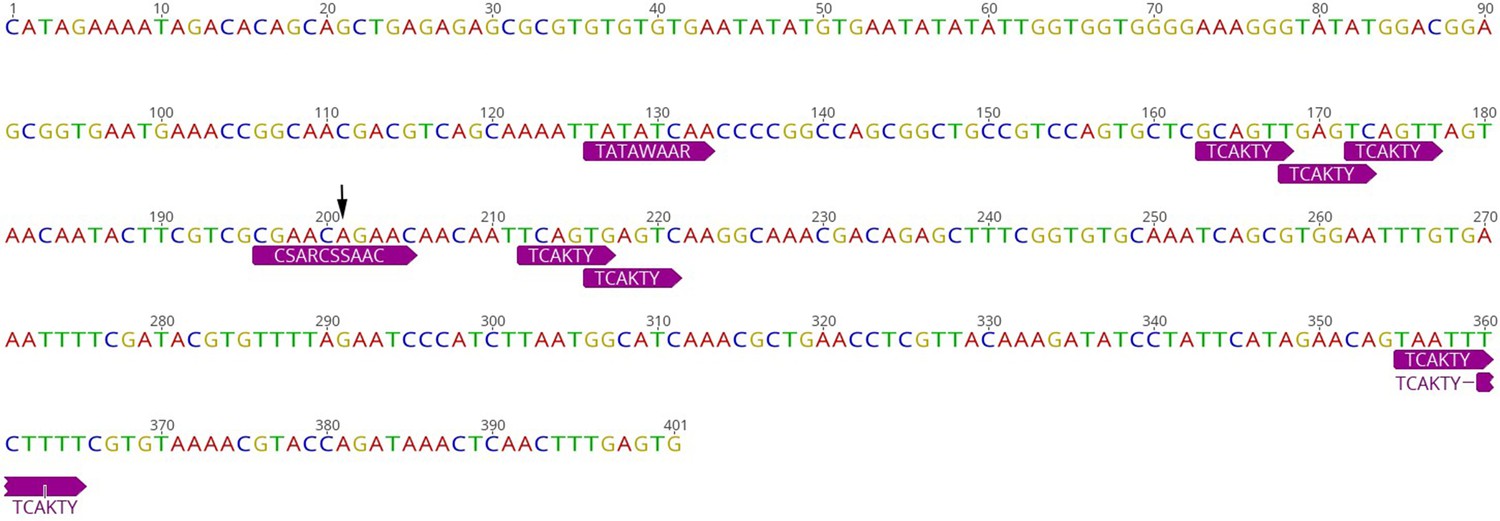
Xrp1 promoter proximal sequences.
The 400 bp Xrp1 core promoter sequence is shown. Transcription start site indicated by arrow. A variety of conserved promoter element sequences are indicated (Ohler et al., 2002; Juven-Gershon and Kadonaga, 2010).
Figure 10—figure supplement 3
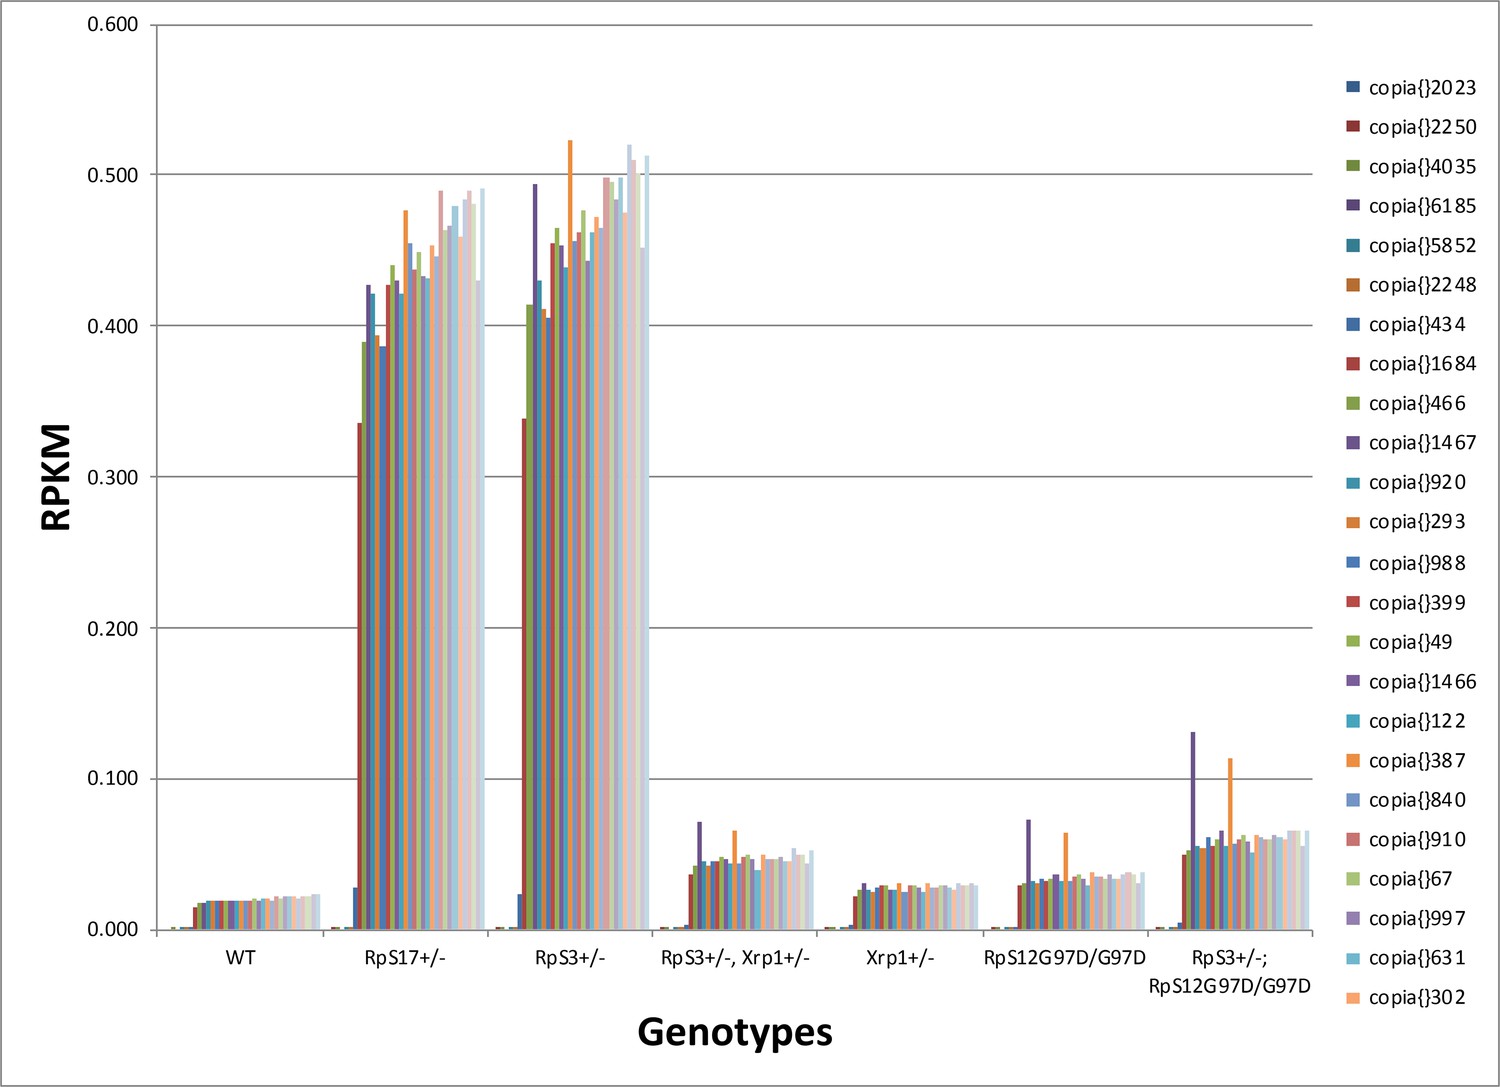
Transcription of individual Copia elements.
mRNA abundances for 24 distinct copia insertions reveal generally similar regulation by RpS12 and Xrp1 in RpS17+/- and RpS3+/- genotypes. Genotypes of graph per column: 1st: w11-18; FRT82B/+, 2nd: w11-18; w p{hs:FLP}; RpS17 p{ubi:GFP} FRT80B/+,3rd: w11-18;w p{hs:FLP}; FRT82 RpS3 p{arm:LacZ/+, 4th: w11-18;w p{hs:FLP}; FRT82 RpS3 p{arm:LacZ/FRT82B FRT82B Xrp1M2–73, 5th: w11-18; FRT82B Xrp1M2–73 / +, 6th: w11-18; rpS12D97 FRT80B / rpS12D97 FRT80B, 7th: w11-18; rpS12D97 FRT80B / rpS12D97 FRT80B Rp.
Figure 11
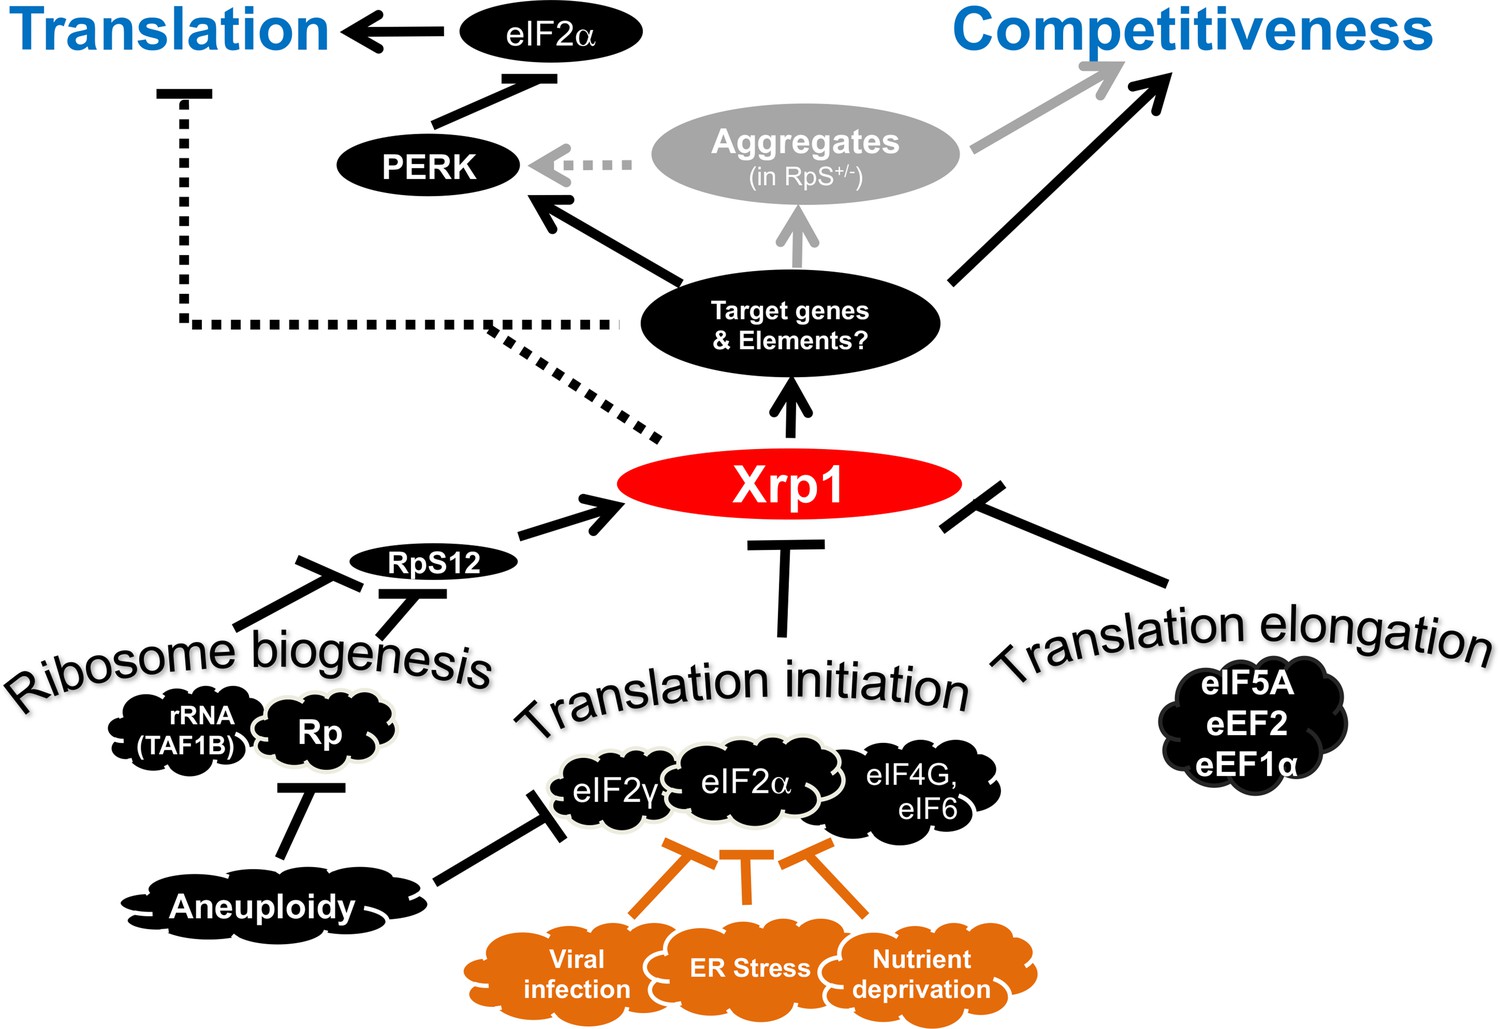
Transcriptional responses to Ribosome defects.
Multiple consequences of defects in ribosome biogenesis, translation initiation, and translation elongation, depend on the transcription factor Xrp1 in the epithelial imaginal disc cells. Xrp1 is responsible for, or contributes to, reduced translation in response to these defects, through the PERK-dependent phosphorylation of eIF2α, a global regulator of CAP-dependent translation initiation. There is also evidence for some PERK-independent regulation of translation in genotypes such as TAF1B knock-down. Translation inhibition independently of Xrp1, which occurs after depletion of some translation factors, is not shown for simplicity. Xrp1 protein expression marks imaginal disc cells for elimination in competition with wild type cells. Differences in translation rate, including those caused by eIF2α phosphorylation or eIF2γ haploinsufficiency, are not sufficient to trigger cell competition without Xrp1. We speculate that other cellular stresses that phosphorylate eIF2α, including ER stress, nutrient deprivation, or (in mammals) infection with certain viruses might mark cells for competition, or interfere with cell competition that recognizes aneuploid cells on the basis of Rp or eIF2γ gene haploinsufficiency. It is notable that defective Tor signaling, which also reduces global translation rate, does not cause cell competition, (Baumgartner et al., 2021). Several pathways have been shown to induce Xrp1, including RpS12-dependent induction in Rp+/- cells and TAF1B-depleted cells (Akdemir et al., 2007; Chapin et al., 2014; Lee et al., 2018; Ji et al., 2019).
Tables
Key resources table
| Reagent type (species) or resource | Designation | Source or reference | Identifiers | Additional information |
|---|---|---|---|---|
| Gene (Drosophila melanogaster) | Xrp1 | GenBank | FLYBASE:FBgn0261113 | |
| Gene (Drosophila melanogaster) | RpS12 | GenBank | FLYBASE: FBgn0286213 | |
| Gene (Drosophila melanogaster) | RpS18 | GenBank | FLYBASE:FBgn0010411 | |
| Gene (Drosophila melanogaster) | RpL27A | GenBank | FLYBASE:FBgn0285948 | |
| Gene (Drosophila melanogaster) | RpS3 | GenBank | FLYBASE:FBgn0002622 | |
| Gene (Drosophila melanogaster) | RpS17 | GenBank | FLYBASE:FBgn0005533 | |
| Gene (Drosophila melanogaster) | RpL14 | GenBank | FLYBASE:FBgn0017579 | |
| Gene (Drosophila melanogaster) | RpL19 | GenBank | FLYBASE:FBgn0285950 | |
| Gene (Drosophila melanogaster) | RpL36 | GenBank | FLYBASE:FBgn0002579 | |
| Gene (Drosophila melanogaster) | TAF1B | GenBank | FLYBASE:FBgn0037792 | |
| Gene (Drosophila melanogaster) | PPP1R15 | GenBank | FLYBASE:FBgn0034948 | |
| Gene (Drosophila melanogaster) | PERK | GenBank | FLYBASE:FBgn0037327 | |
| Gene (Drosophila melanogaster) | Gcn2 | GenBank | FLYBASE:FBgn0019990 | |
| Gene (Drosophila melanogaster) | Irbp18 | GenBank | FLYBASE:FBgn0036126 | |
| Gene (Drosophila melanogaster) | eIF4G | GenBank | FLYBASE:FBgn0023213 | |
| Gene (Drosophila melanogaster) | eEF2 | GenBank | FLYBASE:FBgn0000559 | |
| Gene (Drosophila melanogaster) | eIF6 | GenBank | FLYBASE:FBgn0034915 | |
| Gene (Drosophila melanogaster) | copia | GenBank | FLYBASE:FBgn0013437 | |
| Genetic reagent (D. melanogaster) | eEF1α1 | GenBank | FLYBASE:FBgn0284245 | |
| Genetic reagent (D. melanogaster) | eIF5A | GenBank | FLYBASE:FBgn0285952 | |
| Genetic reagent (D. melanogaster) | Xrp1HA | Blanco et al., 2020 | Strain maintained in Dr. Nicholas Baker’s lab. | |
| Genetic reagent (D. melanogaster) | Xrp1M2-73 allele | Lee et al., 2018 | FLYBASE:RRID:BDSC_81270 | Bloomington Drosophila Stock Center#81,270 |
| Genetic reagent (D. melanogaster) | RpS12 G97D allele | Tyler et al., 2007 | FLYBASE:FBal0193403 | Strain maintained in Dr. Nicholas Baker’s lab. |
| Genetic reagent (D. melanogaster) | UAS-dsRNAXrp1 | Perkins et al., 2015 | FLYBASE:RRID:BDSC_34521 | Bloomington Drosophila Stock Center#34,521 |
| Genetic reagent (D. melanogaster) | UAS-dsRNAXrp1 | Dietzl et al., 2007 | FLYBASE:FBti0118620 | Vienna Drosophila Resource Center#v 107,860 |
| Genetic reagent (D. melanogaster) | UAS-dsRNAirbp18 | Perkins et al., 2015 | FLYBASE:RRID:BDSC_33652 | Bloomington Drosophila Stock Center#33,652 |
| Genetic reagent (D. melanogaster) | UAS-dsRNAw | Perkins et al., 2015 | FLYBASE:RRID:BDSC_33623 | Bloomington Drosophila Stock Center#33,623 |
| Genetic reagent (D. melanogaster) | arm-LacZ | Vincent et al., 1994 | FLYBASE:FBal0040819 | |
| Genetic reagent (D. melanogaster) | Ubi-GFP | Davis et al., 1995 | FLYBASE:FBal0047085 | |
| Genetic reagent (D. melanogaster) | M(2)56 F(mutating RpS18) | Laboratory of Y. Hiromi | FLYBASE:FBal0011916 | |
| Genetic reagent (D. melanogaster) | Df(1)R194 (deleting RpL36) | Duffy et al., 1996 | FLYBASE:FBab0024817 | |
| Genetic reagent (D. melanogaster) | P{RpL36+} | Tyler et al., 2007 | FLYBASE:FBal0193398 | |
| Genetic reagent (D. melanogaster) | M{RpL19+} | Baillon et al., 2018 | ||
| Genetic reagent (D. melanogaster) | Df(2 R)M60E (deleting RpL19) | Baillon et al., 2018 | FLYBASE:FBab0001997 | |
| Genetic reagent (D. melanogaster) | hs-FLP | Struhl and Basler, 1993 | FLYBASE:FBtp0001101 | |
| Genetic reagent (D. melanogaster) | P{GAL4-Act5C(FRT.CD2).P}S | Pignoni and Zipursky, 1997 | FLYBASE:FBti0012408 | Bloomington Drosophila Stock Center#51,308 |
| Genetic reagent (D. melanogaster) | P{neoFRT}42D | Xu and Rubin, 1993 | FLYBASE:FBti0141188 | Bloomington Drosophila Stock Center#1,802 |
| Genetic reagent (D. melanogaster) | P{neoFRT}80B | Xu and Rubin, 1993 | FLYBASE:FBti0002073 | Bloomington Drosophila Stock Center#1988 |
| Genetic reagent (D. melanogaster) | P{neoFRT}82B | This study | FLYBASE:FBti0002074 | Viable line derived from Bloomington Drosophila Stock Center lines BL5188 and BL30555 |
| Genetic reagent (D. melanogaster) | UAS-dsRNATAF1B | Perkins et al., 2015 | RRID:BDSC_61957 | Bloomington Drosophila Stock Center#61,957 |
| Genetic reagent (D. melanogaster) | UAS-dsRNATAF1B | Dietzl et al., 2007 | FLYBASE:FBti0118760 | Vienna Drosophila Resource Center#v105873 |
| Genetic reagent (D. melanogaster) | UAS-dsRNAeIF6 | Dietzl et al., 2007 | FLYBASE:FBti0116845 | Vienna Drosophila Resource Center#v108094 |
| Genetic reagent (D. melanogaster) | UAS-dsRNAeIF4G | Dietzl et al., 2007 | FLYBASE:FBti0095456 | Vienna Drosophila Resource Center#v17002 |
| Genetic reagent (D. melanogaster) | UAS-dsRNAeIF5A | Dietzl et al., 2007 | FLYBASE:FBti0121478 | Vienna Drosophila Resource Center#v101513 |
| Genetic reagent (D. melanogaster) | UAS-dsRNAeEF2 | Dietzl et al., 2007 | FLYBASE:FBti0117284 | Vienna Drosophila Resource Center#v107268 |
| Genetic reagent (D. melanogaster) | UAS-dsRNAeEF1α1 | Dietzl et al., 2007 | FLYBASE:FBti0121842 | Vienna Drosophila Resource Center#v104502 |
| Genetic reagent (D. melanogaster) | UAS-dsRNAPERK | Dietzl et al., 2007 | FLYBASE:FBti0141304 | Vienna Drosophila Resource Center# v110278 |
| Genetic reagent (D. melanogaster) | UAS-dsRNAPERK | Dietzl et al., 2007 | FLYBASE:FBti0093363 | Vienna Drosophila Resource Center#v 16,427 |
| Genetic reagent (D. melanogaster) | UAS-dsRNAGcn2 | Dietzl et al., 2007 | FLYBASE:FBti0118018 | Vienna Drosophila Resource Center#v103976 |
| Genetic reagent (D. melanogaster) | RpS18 mutation M(2 R)56 f | Laboratory of Y. Hiromi | FLYBASE:FBal0284387 | |
| Genetic reagent (D. melanogaster) | RpS3 | Burke and Basler, 1996 | Flybase: FBgn0002622 | |
| Genetic reagent (D. melanogaster) | RpL27A Df(2 L)M24F11 | Marygold et al., 2007 | Flybase: FBab0001492 | |
| Genetic reagent (D. melanogaster) | RpS17 mutation M(3 L)67 C4 | Morata and Ripoll, 1975 | Flybase: FBal0011935 | |
| Genetic reagent (D. melanogaster) | en-Gal4 | Neufeld et al., 1998 | RRID:BDSC_6356 | |
| Genetic reagent (D. melanogaster) | UAS-S65T-GFP | FBrf0086268 | FBtp0001403 | |
| Genetic reagent (D. melanogaster) | P[GAL4-Act5C(FRT.CD2).P]S | FBrf0221941 | FBti0012408 | |
| Genetic reagent (D. melanogaster) | P[UAS-His-RFP]3 | FBrf0221941 | FBti0152909 | |
| Antibody | anti-active-Dcp1 (rabbit polyclonal) | Cell Signalling Technology | Cat #9,578RRID:AB_2721060 | (1:100) |
| Antibody | anti-XRP1(short)(rabbit polyclonal) | Francis et al., 2016 | (1:200) | |
| Antibody | antiphospho-RpS6(rabbit polyclonal) | Romero-Pozuelo et al., 2017 | (1:200) | |
| Antibody | anti-p62 (rabbit polyclonal) | Pircs et al., 2012 | (1:300) | |
| Antibody | anti-phospho-eIF2α (rabbit polyclonal) | Thermo Fisher Scientific | Cat #44–728 GRRID:AB_2533736 | (1:200) |
| Antibody | anti-phospho-eIF2α (D9G8)(rabbit monoclonal) | Cell Signaling Technology | Cat #D9G8#3398 RRID:AB_10829234 | (1:200) |
| Antibody | anti-HATag (mouse monoclonal) | Cell Signalling Technology | Cat #2,367RRID:AB_10691311 | (1:100) |
| Antibody | anti-beta galactosidase (mAb40-1a) (mouse monoclonal) | DSHB | RRID: AB_2314509 | (1:100) |
| Antibody | anti-Mouse IgG, Cy2(goat monoclonal) | Jackson Immunoreseach | Cat #115-225-166 RRID:AB_2338746 | (1:200) |
| Antibody | anti-Mouse IgG, Alexa Fluor 555(goat polyclonal) | Thermo Fischer Scientific | Cat #A28180 RRID:AB_2536164 | (1:200) |
| Antibody | anti-Mouse IgG, Alexa Fluor 647(Goat polyclonal) | Thermo Fischer Scientific | Cat #A-21235 RRID:AB_2535804 | (1:200) |
| Antibody | anti-Mouse IgG, Alexa Fluor 488(Goat polyclonal) | Thermo Fischer Scientific | Cat #A-11001RRID:AB_2534069 | (1:400) |
| Antibody | anti-Rabbit Cy3,(Goat polyclonal) | Thermo Fischer Scientific | Cat #A-21244 RRID:AB_2535812 | (1:200) |
| Antibody | anti-Rabbit IgG, Alexa Fluor 555(Goat polyclonal) | Thermo Fischer Scientific | Cat #A21429 RRID:AB_2535850 | (1:300) |
| Antibody | anti-Rabbit IgG, Alexa Fluor 647(Goat polyclonal) | Thermo Fischer Scientific | Cat #A-21244 RRID:AB_2535812 | (1:200) |
| Antibody | anti-Guinea Pig Cy5(Donkey polyclonal) | Jackson Immunoresearch | Cat #706-175-148RRID:AB_2340462 | (1:200) |
| Antibody | Anti-rRNA (mouse monoclonal Y10b) | Thermo Fisher ScientificLerner et al., 1981 | Cat #MA1-13017RRID:AB_10979967 | (1:100) |
| Antibody | anti-dRpS12 (guinea-pig polyclonal) | Kale et al., 2018 | (1:100) | |
| Antibody | rabbit anti-hRpL10Ab(rabbit polyclonal) | Sigma-Aldrich | Cat #SAB1101199; RRID: AB_10620774 | (1:200) |
| Antibody | anti-Rack1(rabbit monoclonal) | Cell Signalling Technology | Cat #D59D5RRID:AB_10705522 | (1:100) |
| Antibody | anti-RpS9(rabbit monoclonal) | Abcam | Cat #ab117861 RRID:AB_10933850 | (1:100) |
| Antibody | Anti-RpL9(rabbit monoclonal) | Abcam | Cat #ab50384RRID:AB_882391 | (1:100) |
| commercial assay, kit | Maxiscript T7 Transcription kit | Ambion | Cat #AM1312 | |
| other | ULTRAhyb-Oligo buffer | Ambion | Cat #AM8663 | |
| commercial assay, kit | Click-iT Plus OPP Alexa Fluor 594 or 488 Protein Synthesis Assay Kit | Thermo Fisher Scientific | Cat #C10457 | |
| Chemical compound, drug | Biotin-16-UTP | Roche | Cat #11388908910 | |
| Chemical compound, drug | RNA Sample Loading Buffer | Sigma-Aldrich | Cat #R4268-5VL | |
| Chemical compound, drug | Heat inactivated Fetal Bovine Serum | Gibco | Cat #10082139 | |
| Chemical compound, drug | Schneider’s Drosophila Medium | Gibco | Cat #21720024 | |
| Chemical compound, drug | Trizol | Ambion | Cat #15596–026 | |
| Chemical compound, drug | Odyssey Blocking buffer (PBS) | Li-COR | Cat #927–40003 | |
| sequence-based reagent | 18 S probe_Forward | Lee et al., 2018 | Invitrogen | GGTGCTGAAGCTTATGTAGC |
| sequence-based reagent | 18 S probe_Reverse | Lee et al., 2018 | Invitrogen | TAATACGACTCACTATAGGGAGACAAAGGGCA GGGACG |
| sequence-based reagent | 5.8 S probe_Forward | Lee et al., 2018 | Invitrogen | GCTTATATGAAACTAAGACATTTCG |
| sequence-based reagent | 5.8 S probe_Reverse | Lee et al., 2018 | Invitrogen | TAATACGACTCACTATAGGGTACATAAC AGCAT GGACTGC |
| sequence-based reagent | ITS2 probe_Forward | This study | Invitrogen | 5’- CTTTAATTAATTTTATAGTGCTGCTTGG-3’ |
| sequence-based reagent | ITS2 probe_reverse | This study | Invitrogen | 5’- TAATACGACTCACTATAGGGTTGT ATATAACTTTATCTTG-3’ |
| sequence-based reagent | 28 S probe_Forward | This study | Invitrogen | 5’-GCAGAGAGATATGGTAGATGGGC –3’ |
| sequence-based reagent | 28 S probe_reverse | This study | Invitrogen | 5’- TAATACGACTCACTATAGGGTTCCAC AATTGGCTACGTAACT-3’ |
| sequence-based reagent | ITS1 probe_Forward | This study | Invitrogen | 5’- GGAAGGATCATTATTGTATAATATC-3’ |
| sequence-based reagent | ITS1 probe_Reverse | This study | Invitrogen | 5’- TAATACGACTCACTATAGGGATG ATTACCACACATTCG-3’ |
| sequence-based reagent | 7SL probe_Forward | This study | Invitrogen | 5’- TCGACTGGAAGGTTGGCAGCTTCTG-3’ |
| sequence-based reagent | 7SL probe_Reverse | This study | Invitrogen | 5’- TAATACGACTCACTATAGGGATTGTGG TCCAACCATATCG-3’ |
| Other | VECTASHIELD antifade mounting medium | Vector Laboratories | Cat #H-1000 | |
| Other | Nuclear Mask reagent | Thermo Fisher Scientific | Cat #H10325 | |
| Cell line | S2-DGRC | Drosophila Genomics Resource Center (NIH Grant 2P40OD010949) | FLYBASE: FBtc0000006 RRID:CVCL_TZ72 | Stock #6(D. melanogaster embryonic cell line) |
| Other | Dual-Luciferase Reporter Assay System | Promega | Cat #E1910 | |
| Other | TransIT-2020 Transfection Reagent | Mirus Bio | Cat #MIR 5404 | |
| sequence-based reagent | Xrp target 1+ strand | This study | TCGAGATTGCACAACGCTCATTGCAC AACGTTCATTGCACAACGGCAATTGCACAACG | |
| sequence-based reagent | Xrp target 1 - strand | This study | TCGACGTTGTGCAATTGCCGTTGTGCAATG AACGTTGTGCAATGAGCGTTGTGCAATC | |
| sequence-based reagent | Xrp target 2+ strand | This study | TCGAGCATGATGAAATAACATGCTCCATGA TGAAATAACATGTTCCATGATGAAATAACA TGGCACATGATGAAATAACATG | |
| sequence-based reagent | Xrp target 2 - strand | This study | TCGACATGTTATTTCATCATGTGCCATGTTA TTTCATCATGGAACATGTTATTTCATCATG GAGCATGTTATTTCATCATGC | |
| sequence-based reagent | Xrp target 3+ strand | This study | TCGAGATTACATCATGCTCATTACATC ATGTTCATTACATCATGGCAATTACATCATG | |
| sequence-based reagent | Xrp target 3 - strand | This study | TCGACATGATGTAATTGCCATGATGTAATG AACATGATGTAATGAGCATGATGTAATC | |
| sequence-based reagent | Xrp trgt 1+ strand shuffled | This study | TCGAGTGACAACTCAGCTCTGACAACTCAGT TCTGACAACTCAGGCATGACAACTCAG | |
| sequence-based reagent | Xrp trgt 1 - strand shuffled | This study | TCGACTGAGTTGTCATGCCTGAGTTGTCAGAA CTGAGTTGTCAGAGCTGAGTTGTCAC | |
| sequence-based reagent | Xrp trgt 2+ strand shuffled | This study | TCGAGTTCAAATCAATAGGAAGCTCTTCAAATCA ATAGGAAGTTCTTCAAATCAATAGGAAGGCATTC AAATCAATAGGAAG | |
| sequence-based reagent | Xrp trgt 2 - strand shuffled | This study | TCGACTTCCTATTGATTTGAATGCCTTCCTATT GATTTGAAGAACTTCCTATTGATTTGAAGAGC TTCCTATTGATTTGAAC | |
| recombinant DNA reagent | pGL3-Promoter Vector | Promega | Cat #E1761 | |
| recombinant DNA reagent | pAct5.1/V5-His C vector | Thermo Fischer Scientific | Cat #V411020 | |
| recombinant DNA reagent | pIS1 plasmid | Addgene | Cat #12,179 | |
| recombinant DNA reagent | pUAST vector | Brand and Perrimon, 1993 | FLYBASE:FBmc0000383 | Drosophila Genomics Resource Center#1,000 |
| recombinant DNA reagent | pGL3-Rluc | This study | See Materials and Methods; Dr. Nicholas Baker’s lab | |
| recombinant DNA reagent | p-GL3-H-T1 | This study | See Materials and Methods; Dr. Nicholas Baker’s lab | |
| recombinant DNA reagent | p-GL3-H-T2 | This study | See Materials and Methods; Dr. Nicholas Baker’s lab | |
| recombinant DNA reagent | p-GL3-H-T3 | This study | See Materials and Methods; Dr. Nicholas Baker’s lab | |
| recombinant DNA reagent | p-GL3-H-T1S | This study | See Materials and Methods; Dr. Nicholas Baker’s lab | |
| recombinant DNA reagent | p-GL3-H-T2S | This study | See Materials and Methods; Dr. Nicholas Baker’s lab | |
| recombinant DNA reagent | pGL3-X-T1 | This study | See Materials and Methods; Dr. Nicholas Baker’s lab | |
| recombinant DNA reagent | pGL3-X-T2 | This study | See Materials and Methods; Dr. Nicholas Baker’s lab | |
| recombinant DNA reagent | pGL3-X-T3 | This study | See Materials and Methods; Dr. Nicholas Baker’s lab | |
| recombinant DNA reagent | pGL3-X-T1S | This study | See Materials and Methods; Dr. Nicholas Baker’s lab | |
| recombinant DNA reagent | pGL3-X-T2S | This study | See Materials and Methods; Dr. Nicholas Baker’s lab |
Additional files
-
Supplementary file 1
mRNA-seq data for transposable elements.
- https://cdn.elifesciences.org/articles/71705/elife-71705-supp1-v3.xlsx
-
Supplementary file 2
Genotypes, numbers, and heat-shock parameters for figures.
- https://cdn.elifesciences.org/articles/71705/elife-71705-supp2-v3.docx
-
Transparent reporting form
- https://cdn.elifesciences.org/articles/71705/elife-71705-transrepform1-v3.docx
Download links
A two-part list of links to download the article, or parts of the article, in various formats.
Downloads (link to download the article as PDF)
Open citations (links to open the citations from this article in various online reference manager services)
Cite this article (links to download the citations from this article in formats compatible with various reference manager tools)
The transcription factor Xrp1 orchestrates both reduced translation and cell competition upon defective ribosome assembly or function
eLife 11:e71705.
https://doi.org/10.7554/eLife.71705


