Prediction of type 2 diabetes mellitus onset using logistic regression-based scorecards

  1. Yochai Edlitz
  2. Eran Segal  Is a corresponding author
  1. Department of Computer Science and Applied Mathematics, Weizmann Institute of Science, Israel
  2. Department of Molecular Cell Biology, Weizmann Institute of Science, Israel

Abstract

Background:

Type 2 diabetes (T2D) accounts for ~90% of all cases of diabetes, resulting in an estimated 6.7 million deaths in 2021, according to the International Diabetes Federation. Early detection of patients with high risk of developing T2D can reduce the incidence of the disease through a change in lifestyle, diet, or medication. Since populations of lower socio-demographic status are more susceptible to T2D and might have limited resources or access to sophisticated computational resources, there is a need for accurate yet accessible prediction models.

Methods:

In this study, we analyzed data from 44,709 nondiabetic UK Biobank participants aged 40–69, predicting the risk of T2D onset within a selected time frame (mean of 7.3 years with an SD of 2.3 years). We started with 798 features that we identified as potential predictors for T2D onset. We first analyzed the data using gradient boosting decision trees, survival analysis, and logistic regression methods. We devised one nonlaboratory model accessible to the general population and one more precise yet simple model that utilizes laboratory tests. We simplified both models to an accessible scorecard form, tested the models on normoglycemic and prediabetes subcohorts, and compared the results to the results of the general cohort. We established the nonlaboratory model using the following covariates: sex, age, weight, height, waist size, hip circumference, waist-to-hip ratio, and body mass index. For the laboratory model, we used age and sex together with four common blood tests: high-density lipoprotein (HDL), gamma-glutamyl transferase, glycated hemoglobin, and triglycerides. As an external validation dataset, we used the electronic medical record database of Clalit Health Services.

Results:

The nonlaboratory scorecard model achieved an area under the receiver operating curve (auROC) of 0.81 (95% confidence interval [CI] 0.77–0.84) and an odds ratio (OR) between the upper and fifth prevalence deciles of 17.2 (95% CI 5–66). Using this model, we classified three risk groups, a group with 1% (0.8–1%), 5% (3–6%), and the third group with a 9% (7–12%) risk of developing T2D. We further analyzed the contribution of the laboratory-based model and devised a blood test model based on age, sex, and the four common blood tests noted above. In this scorecard model, we included age, sex, glycated hemoglobin (HbA1c%), gamma glutamyl-transferase, triglycerides, and HDL cholesterol. Using this model, we achieved an auROC of 0.87 (95% CI 0.85–0.90) and a deciles' OR of ×48 (95% CI 12–109). Using this model, we classified the cohort into four risk groups with the following risks: 0.5% (0.4–7%); 3% (2–4%); 10% (8–12%); and a high-risk group of 23% (10–37%) of developing T2D. When applying the blood tests model using the external validation cohort (Clalit), we achieved an auROC of 0.75 (95% CI 0.74–0.75). We analyzed several additional comprehensive models, which included genotyping data and other environmental factors. We found that these models did not provide cost-efficient benefits over the four blood test model. The commonly used German Diabetes Risk Score (GDRS) and Finnish Diabetes Risk Score (FINDRISC) models, trained using our data, achieved an auROC of 0.73 (0.69–0.76) and 0.66 (0.62–0.70), respectively, inferior to the results achieved by the four blood test model and by the anthropometry models.

Conclusions:

The four blood test and anthropometric models outperformed the commonly used nonlaboratory models, the FINDRISC and the GDRS. We suggest that our models be used as tools for decision-makers to assess populations at elevated T2D risk and thus improve medical strategies. These models might also provide a personal catalyst for changing lifestyle, diet, or medication modifications to lower the risk of T2D onset.

Funding:

The funders had no role in study design, data collection, interpretation, or the decision to submit the work for publication.

Editor's evaluation

The authors have used the UK Biobank with sophisticated statistical modeling to predict the risk of type 2 diabetes mellitus development. Prognosis and early detection of diabetes are key factors in clinical practice, and the current data suggest a new machine-learning-based algorithm that further advances our ability to prevent diabetes.

https://doi.org/10.7554/eLife.71862.sa0

Introduction

Diabetes mellitus is a group of diseases characterized by symptoms of chronic hyperglycemia and is becoming one of the world’s most challenging epidemics. The prevalence of type 2 diabetes (T2D) has increased from 4.7% in 1980 to 10% in 2021, and is considered the cause of an estimated 6.7 million deaths in 2021 (International Diabetes Federation - Type 2 diabetes, 2022). T2D is characterized by insulin resistance, resulting in hyperglycemia, and accounts for ~90% of all diabetes cases (Zimmet et al., 2016).

In recent years, the prevalence of diabetes has been rising more rapidly in low- and middle-income countries (LMICs) than in high-income countries (Diabetes programme, WHO, 2021). In 2019, Eberhard et al. estimated that every other person with diabetes in the world is undiagnosed (Standl et al., 2019). 83.8% of all cases of undiagnosed diabetes are in low-mid-income countries (Beagley et al., 2014), and according to the IDF Diabetes Atlas, over 75% of adults with diabetes live in low- to middle-income countries (IDF Diabetes Atlas, 2022), where laboratory diagnostic testing is limited (Wilson et al., 2018).

According to several studies, a healthy diet, regular physical activity, maintaining normal body weight, and avoiding tobacco use can prevent or delay T2D onset (Home, 2022; Diabetes programme, WHO, 2021; Knowler et al., 2002; Lindström et al., 2006; Diabetes Prevention Program Research Group, 2015). A screening tool that can identify individuals at risk will enable a lifestyle or medication intervention. Ideally, such a screening tool should be accurate, simple, and low-cost. It should also be easily available, making it accessible for populations having difficulties using the computer.

Several such tools are in use today (Noble et al., 2011; Collins et al., 2011; Kengne et al., 2014). The Finnish Diabetes Risk Score (FINDRISC), a commonly used, noninvasive T2D risk-score model, estimates the risk of patients between the ages of 35 and 64 of developing T2D within 10 years. The FINDRISC was created based on a prospective cohort of 4746 and 4615 individuals in Finland in 1987 and 1992, respectively. The FINDRISC model employs gender, age, body mass index (BMI), blood pressure medications, a history of high blood glucose, physical activity, daily consumption of fruits, berries, or vegetables, and family history of diabetes as the parameters for the model. The FINDRISC can be used as a scorecard model or a logistic regression (LR) model (Bernabe-Ortiz et al., 2018; Lindström and Tuomilehto, 2003; Meijnikman et al., 2018).

Another commonly used scorecard prediction model is the German Diabetes Risk Score (GDRS), which estimates the 5-year risk of developing T2D. The GDRS is based on 9729 men and 15,438 women between the ages of 35–65 from the European Prospective Investigation into Cancer and Nutrition (EPIC)-Potsdam study (EPIC Centres - GERMANY, 2022). The GDRS is a Cox regression model using age, height, waist circumference, the prevalence of hypertension (yes/no), smoking behavior, physical activity, moderate alcohol consumption, coffee consumption, intake of whole-grain bread, intake of red meat, and parent and sibling history of T2D (Schulze et al., 2007; Mühlenbruch et al., 2014).

Barbara Di Camillo et al. reported in 2019 the development of three survival analysis models using the following features: background and anthropometric information, routine laboratory tests, and results from an Oral Glucose Challenge Test (OGTT). The cohorts consisted of 8483 people from three large Finnish and Spanish datasets. They report achieving area under the receiver operating curve (auROC) scores equal to 0.83, 0.87, and 0.90, outperforming the FINDRISC and Framingham scores (Di Camillo et al., 2018). In 2021, Lara Lama et al. reported using a random forest classifier on 7949 participants from the greater Stockholm area to investigate the key features for predicting prediabetes and T2D onset. They found that BMI, waist–hip ratio (WHR), age, systolic and diastolic blood pressure, and a family history of diabetes were the most significant predictive features for T2D and prediabetes (Lama et al., 2021).

The goal of the present research is to develop easy-to-use, clinically usable models that are highly predictive of T2D onset. We developed two simple scorecard models and compared their predictive power to the established FINDRISC and GDRS models. We trained both models using a subset of data from the UK Biobank (UKB) observational study cohort and reported the results using holdout data from the same study. We based one of the models on easily accessible anthropometric measures and the other on four common blood tests. Since we trained and evaluated our models using the UKB database, the models are therefore most relevant for the UK population aged 40–65 or for populations with similar characteristics (as presented in Table 1). As an external test case for the four blood test model, we used the Israeli electronic medical record database of Clalit Health Services (Artzi et al., 2020).

Table 1
Cohort statistical data.

Characteristics of this study’s cohort population and the UK Biobank (UKB) population. A ‘±’ sign denotes the standard deviation. While type 2 diabetes (T2D) prevalence in the UKB participants is 4.8%, it is 1.79% in our cohort as we screened the cohort at baseline for HbA1c% levels <6.5%. The age range of the participants at the first visit was 40–69; thus, our models are not suitable for people who develop T2D at younger ages. The models predict the risk of developing T2D between the first visit to the UKB assessment center and the last visit. We refer to this feature as ‘the time between visits’.

UKB populationTrain, validation, and test setsTest setTrain setValidation set
Number of participants502,53644,7098,96025,02510,724
Age at first visit (years)56.5 ± 8.155.6 ± 7.655.5 ± 7.555.6 ± 7.655.6 ± 7.6
Age at last visit (years)-62.9 ± 7.562.9 ± 7.462.9 ± 7.562.9 ± 7.5
The time between visits (years)-7.3 ± 2.37.3 ± 2.37.3 ± 2.37.3 ± 2.3
Males in the population (%)45.547.847.947.947.5
Diabetic at first visit (%)4.80000
Diabetic at last visit (%)-1.791.761.751.91
Hba1c at first visit (%)5.5 ± 0.65.3 ± 0.35.3 ± 0.35.3 ± 0.35.3 ± 0.3
Hba1c at last return (%)-5.4 ± 0.45.4 ± 0.35.4 ± 0.45.4 ± 0.4
Weight at first visit (kg)78.1 ± 15.976.6 ± 14.776.4 ± 14.676.7 ± 14.776.8 ± 14.9
Weight at last visit (kg)-76.2 ± 15.276.0 ± 14.976.2 ± 15.276.5 ± 15.3
Body mass index at first visit (kg/m2)27.4 ± 4.826.6 ± 4.226.5 ± 4.126.6 ± 4.226.7 ± 4.3
Body mass index at last visit (kg/m2)-26.6 ± 4.426.5 ± 4.326.6 ± 4.426.7 ± 4.5
Hips circumference at first visit (cm)103.4 ± 9.2102.1 ± 8.2101.9 ± 8.0102.1 ± 8.2102.3 ± 8.3
Hips circumference at last visit (cm)-101.6 ± 8.8101.4 ± 8.7101.6 ± 8.8101.8 ± 9.0
Waist circumference at first visit (cm)90.3 ± 13.587.9 ± 12.587.7 ± 12.487.9 ± 12.488.2 ± 12.7
Waist circumference at last visit (cm)-88.7 ± 12.788.5 ± 12.588.7 ± 12.789.0 ± 12.9
Height at first visit (cm)168.4 ± 9.3169.5 ± 9.2169.5 ± 9.1169.5 ± 9.2169.4 ± 9.1
Height at last visit (cm)-169.0 ± 9.2169.0 ± 9.2169.0 ± 9.3168.9 ± 9.2

Methods

Data

We analyzed UKB’s observational data of 502,536 participants aged 40–69 recruited in the UK voluntarily from 2006 to 2010. During a baseline assessment visit to the UKB, the participants self-completed questionnaires, which included lifestyle and other potentially health-related questions. The participants also underwent physical and biological measurements. Out of this cohort, we used the data of 20,346 participants who revisited the UKB assessment center from 2012 to 2013 for an additional medical assessment. We also used the data of 48,705 participants who revisited for a second or third visit from 2014 onward for an imaging visit and underwent an additional, similar medical check. We screened the participants to keep only those not being treated for nor having in the past T2D. We also screened out participants whose average blood sugar level for the past 2–3 months (hemoglobin A1c [HbA1c%]) was below 4% or above 6.5%. We started with 798 features for each participant and removed all the features with more than 50% missing data points in our cohort. We later screened out all the participants who still had more than 25% missing data points from the cohort and imputed the remaining missing data. We further removed those study participants who self-reported as being healthy but had HbA1c% levels higher than the accepted healthy level. We also screened participants who had a record of a prior T2D diagnosis (data field 2976 at the UKB). As not all participants had HbA1c% measurements, we estimated the bias of participants reporting as healthy while having an HbA1c% level indicating diabetes. For this estimate, we used the data from a subpopulation of our patients and found that 0.5% of participants reported being healthy with a median HbA1c% value of 6.7%, while the cutoff for having T2D is 6.5% (Table 1).

Of the remaining 44,709 participants in our study cohort, 1.79% developed T2D during a follow-up period of 7.3 ± 2.3 years (Table 1, Figure 1A). As a predicted outcome, we used the data for whether a participant develops T2D between the first and last visit from a self-report using a touchscreen questionnaire. The participants were asked to mark either ‘Yes’/‘No’/‘Do not know’/‘Prefer not to answer’ for the validity of the sentence “Diabetes diagnosed by a doctor,” which was presented to them on a touch screen questionnaire (data field 2443 at the UKB).

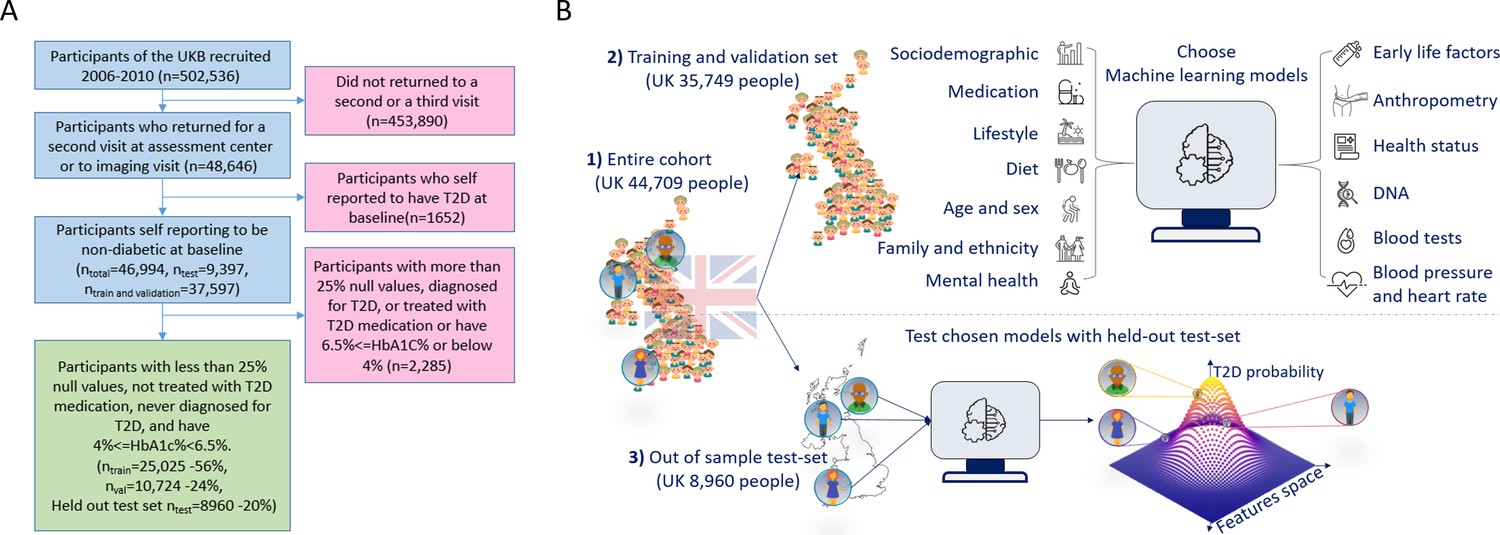
A flowchart of the cohort selection process and an illustrative figure of the model’s extraction.

(A) A flowchart of the selection process of participants in this study. We selected participants who came for a repeated second or third visit from the 502,536 participants of the UK Biobank (UKB). Next, we excluded 1652 participants who self-reported having type 2 diabetes (T2D). We then split the data into 80% for the training and validation sets and 20% for the holdout test set. We excluded an additional 2285 participants due to (1) having 25% or more missing values from the full feature list, (2) having HbA1c levels above or equal to 6.5%, or (3) being treated with metformin or insulin, (4) found to be diagnosed with T2D before the first UKB visit. The final training, validation, and test sets included 25,025 participants (56% of the cohort), 10,724 participants (24%), and 8960 participants (20%), respectively. (B) The process flow during the training and testing of the models. We first split the data and kept a holdout test set. We then explored several models using the training and validation datasets. We then compared the selected models using the holdout test set and reported the results. We calibrated the output of the models to predict the probability of a participant developing T2D.

Feature selection process

We started with 798 features that we hypothesized as potential predictors for T2D onset. We removed all the features with more than 50% missing data values, leaving 279 features for the research. Next, we imputed the missing data of the remaining records (see ‘Methods’). As a genetic input for several models, we used both polygenic risk scores (PRS) and single-nucleotide-polymorphisms (SNPs) from the UKB SNP array (see ‘Methods’). We used 41 PRSs with 129 ± 37.8 SNPs on average for each PRS. We also used the single SNPs of each PRS as some of the models’ features; after removing duplicate SNPs, we remained with 2267 SNPs (see ‘Genetic data’).

We aggregated the features into 13 separate groups: age and sex; genetics; early-life factors; socio-demographic; mental health; blood pressure and heart rate; family history and ethnicity; medication; diet; lifestyle and physical activity; physical health; anthropometry; and blood test results. We trained models for each group of features separately (Appendix 1—figure 1, Appendix 1—table 1). We then added the features groups according to their marginal predictability (Appendix 1—table 2).

After selecting the leading models from the training and validation datasets, we tested and reported the results of the selected models using the holdout test set samples (Appendix 1—table 1). To encourage clinical use of our models, we optimized the number of features the models require. To simplify our models, we iteratively removed the least contributing features of our models using the training dataset (see ‘Missing data’, Appendix 1—figure 1). We examined the normalized coefficient of each model feature to assess its importance in the model. For the four blood test model, we initially also had ‘reticulocytes’ as one of the model’s features. As we want to use common blood tests only, we dropped this feature from the list after confirming that the impact of removal of this feature on the model accuracy was negligible. Once the models were finalized, we developed corresponding scorecards that were both simple and interpretable (see ‘Scorecards creation’).

Outcome

Our models provide a prediction score for the participant’s risk of developing T2D during a specific time frame. The mean prediction time frame in our cohort is 7.3 ± 2.3 years. The results that we report correspond to a holdout test set comprising 20% of our cohort that we kept aside until the final report of the results. We also report the results of the four blood test model using an external electronic medical record database of the Israeli Clalit Health Services. We trained all the models using the same training set and then reported the test results of the holdout test set. We used the auROC and the average precision score (APS) as the main metrics of our models. Using these models, a physician can inform patients about their risk of developing T2D and their predicted risk of developing T2D within a selected time frame.

We calibrated the models to report the probability of developing T2D during a given time frame (see ‘Calibration in methods’). To quantify the risk groups in the scorecards model, we performed a bootstrapping process on our validation dataset like the one performed for the calibration. We selected boundaries that showed good separation between risk groups and reported the results using the holdout test set.

Missing data

After removing all features with more than 50% missing data and removing all the participants with more than 25% missing features, we imputed the remaining data. We analyzed the correlations between predictors with missing data and found correlations within anthropometry group features to other features in the same domain – analogous correlations were found in the blood test data. We used SKlearn’s iterative imputer with a maximum of 10 iterations for the imputation and tolerance of 0.1 (Abraham et al., 2014) We imputed the training and validation sets apart from the imputation of the holdout test set. We did not perform imputation on the categorical features but transformed them into ‘one hot encoding’ vectors with a bin for missing data using Pandas categorical tools.

Genetic data

We use PRS andSNPs as genetic input for some models. We calculated the PRS by summing the top correlated risk allele effect sizes derived from Genome-Wide Association Studies (GWAS) summary statistics. We first extracted from each summary statistics the top 1000 SNPs according to their p-value. We then used only the SNPs presented in the UKB SNP array. We used 41 PRSs with 129 ± 37.8 SNPs on average for each PRS. We also used the single SNPs of each PRS as features for some models. After the removal of duplicated SNPs, we kept 2267 SNPs as features. The full PRS summary statistics list can be found in Appendix 1, ‘References for PRS summary statistics articles.’ We calculated the PRS scores according to summary statistics publicly available from studies not derived from the KB to prevent data leakage.

Baseline models

As the reference models for our results, we used the well-established FINDRISC and GDRS models (Lindström and Tuomilehto, 2003; Schulze et al., 2007; Mühlenbruch et al., 2014), which we retrained and tested on the same data used for our models. These two models are based on Finnish and German populations with similar age ranges as our cohort. We derived a FINDRISC score for each participant using the data for age, sex, BMI, waist circumference, and blood pressure medication provided by the UKB. To calculate the score for duration of physical activity, as required by the FINDRISC model, we summed up the values of ‘duration of moderate activity’ and ‘duration of vigorous activity’ as provided by the UKB. As a measure of the consumption of vegetables and fruits, we summed up the categories ‘cooked vegetable intake,’ ‘salad/raw vegetable intake,’ and ‘fresh fruit intake’ categories from the UKB. As an answer to the question ‘Have any members of your patient’s immediate family or other relatives been diagnosed with diabetes (type 1 or type 2)? This question applies to blood relatives only,’ we used the fields for the illness of the mother, the father, and the siblings of each participant.

We lacked the data of participants’ grandparents, aunts, uncles, first cousins, and children. We also lacked the data about past blood pressure medication, although we do have the data for the current medication usage. Following the calculation of the FINDRISC score for each participant, we trained an LR model using the score for each participant as the model input and the probability of developing T2D as the output. We also examined an additional model, in which we added the time of the second visit as an input for the FINDRISC mode but found no major differences when this additional parameter was used. We report here the results for the FINDRISC model without the time of the second visit as a feature.

To derive the GDRS-based model, we built a Cox regression model using Python’s lifelines package (Davidson-Pilon et al., 2020). As for the features of the GDRS model, we incorporated the following features: years between visits; height; prevalent hypertension; physical activity (hr/week); smoking habits (former smoker <20 units per day or ≥20 units per day, current smoker ≥20 units per day or <20 units per day); whole bread intake; coffee intake; red meat consumption; one parent with diabetes; both parents with diabetes; and a sibling with diabetes. We performed a random hyperparameter search the same way we used for our models. The hyperparameters we used here are the penalize parameter in the range of 0–10 using a 0.1 resolution and a variance threshold of 0–1 with 0.01 resolution. This last hyperparameter is used to drop columns where the variance of the column was lower than the variance threshold.

Model building procedures

To test overfitting and biased models, we split the data into three groups: 20% for the holdout test set, used only for the final reporting of results. For the remaining data, we used 30% for the validation set and 70% for the training set. We use a two-stage process to evaluate the models’ performance: exploration and test phases (Figure 1, Appendix 1—figure 1). We selected the optimal features during the exploration stage using the training and validation datasets. We then performed 200 iterations of a random hyperparameters selection process for each group of features. We set the selection criterion as the auROC metric using fivefold cross-validation.

We used the validation dataset to rank the various models by their auROC scores. We trained each of the models using the full training set with the top-ranked hyper-parameters determined from the hyperparameters tuning stage and ranked the models by their score using the validation dataset.

During the test phase, we reported the results of our selected models. For this, we evaluated the selected models using the holdout test set. To do so, we reran the hyperparameters selection process using the integrated training and validation datasets. We evaluated the trained model based on the data from the holdout test set. The same datasets were used for all the models.

For the development of the Cox regression models, we used the lifelines survival analysis package (Davidson-Pilon et al., 2020), using the ‘age diabetes diagnosed’ category (data field 2976) as a label. We used SKlearn’s LogisticRegressionCV model for the LR model’s computation (Abraham et al., 2014). For the Gradient Boosting Decision Trees (GBDT) models, we used Microsoft’s LightGBM package (Ke et al., 2017). We developed our data pipeline to compute the scorecards. These last three models used the ‘diabetes diagnosed by a doctor’ category of the UKB as a label (data field 2443).

As part of the models’ calculation process, we used 200 iterative random hyperparameters searches for the training of the models. For the GBDT models, we used the following parameter values for the searches: number of leaves – [2, 4, 8, 16, 32, 64, 128], number of boosting iterations – [50, 100, 250, 500, 1000, 2000, 4,000], learning rate – [0.005, 0.01, 0.05], minimum child samples – [5, 10, 25, 50], subsample – [0.5, 0.7, 0.9, 1], features fraction – [0.01, 0.05, 0.1, 0.25, 0.5, 0.7, 1], lambda l1 – [0, 0.25, 0.5, 0.9, 0.99, 0.999], lambda l2 – [0, 0.25, 0.5, 0.9, 0.99, 0.999], bagging frequency – [0, 1, 5], and bagging fraction – [0.5, 0.75, 1] (Ke et al., 2017).

We used a penalize in the range 0–2 with 0.02 resolution for the l2 penalty during the hyperparameters searches for the LR models.

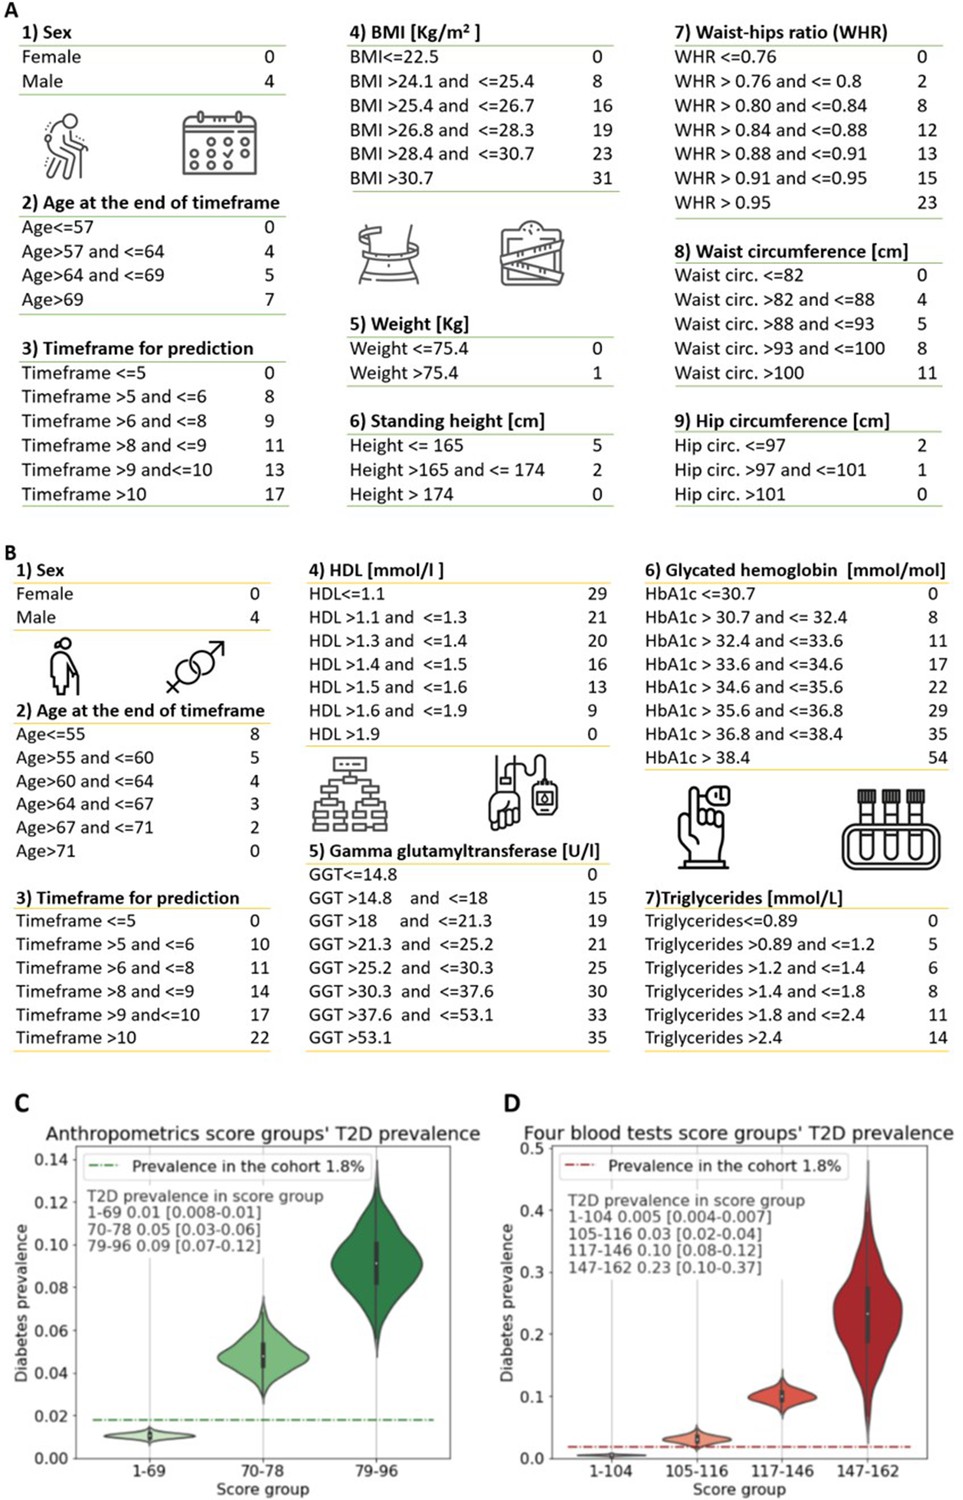
We composed an anthropometric-based scorecard model to provide an accessible, simple, nonlaboratory, and noninvasive T2D prediction model. In this model, a patient can easily mark the result in each of the scorecard questions, consisting of the following eight parameters: age, sex, weight, height, hip circumference, waist circumference, BMI, and the WHR (Figure 2A).

Anthropometrics and blood tests scorecards.

(A) Anthropometrics-based scorecard. Summing the scores of the various features provides a final score that we quantified into one of three risk groups (figure 2C). (B) “Four blood test” scorecard. Adding the scores of the various features provides a final score that we quantified into one of four risk groups (Figure 2D). (C) Anthropometrics scorecards risk groups - first group score range [1-69] 1% [0.8-1%] 95%CI of developing T2D which is below the cohorts 1.8% prevalence of T2D (green dashed line); Second group, score range 70-78 predicts a 5% [3-6%] 95%CI of developing T2D; Third group 79-96 9% [7-12%] 95%CI of developing T2D. (D) four blood tests scorecards risk groups - first group score range [1-104] <0.5% [0.04-0.7%] 95%CI of developing T2D which is below the cohorts 1.8% prevalence of T2D (red dashed line); Second group, score range 105-116 predicts a 3% [2-4%] 95%CI of developing T2D.; Third group range 117-146 with 10% [8-12%] 95%CI of developing T2D. Fourth group range 147-162 predicts 23% [10-37%] 95%CI of developing T2D, which is X13 fold prevalence enrichment compared to the cohort’s T2D prevalence.

In addition, we developed a more accurate tool for predicting T2D onset for those cases where laboratory testing will be available. We started with a feature selection process from a full-feature GBDT model, using only the training and validation datasets. We clustered the features of this model into 13 categories such as lifestyle, diet, and anthropometrics (Appendix 1—table 1, Appendix 1—table 2). We concluded that the blood tests have higher predictability than the other features aggregations. We thus trained a full blood test model using 59 blood tests available in the training dataset. Applying a recursive features’ elimination process to the top 10 predictive features, we established the features of our final model based on four blood tests.

The four blood tests that we used are the glycated hemoglobin test (HbA1c%), which measures the average blood sugar for the past 2–3 months and which is one of the means to diagnose diabetes; gamma-glutamyl transferase test (GGT); high-density lipoprotein (HDL) cholesterol test, and the triglycerides test. We also included the time to prediction (time between visits); gender, age at the repeated visit; and a bias term related to the population’s prevalence. We computed the values of these features’ associated coefficients with their 95% CI to reconstruct the models (Figure 3E).

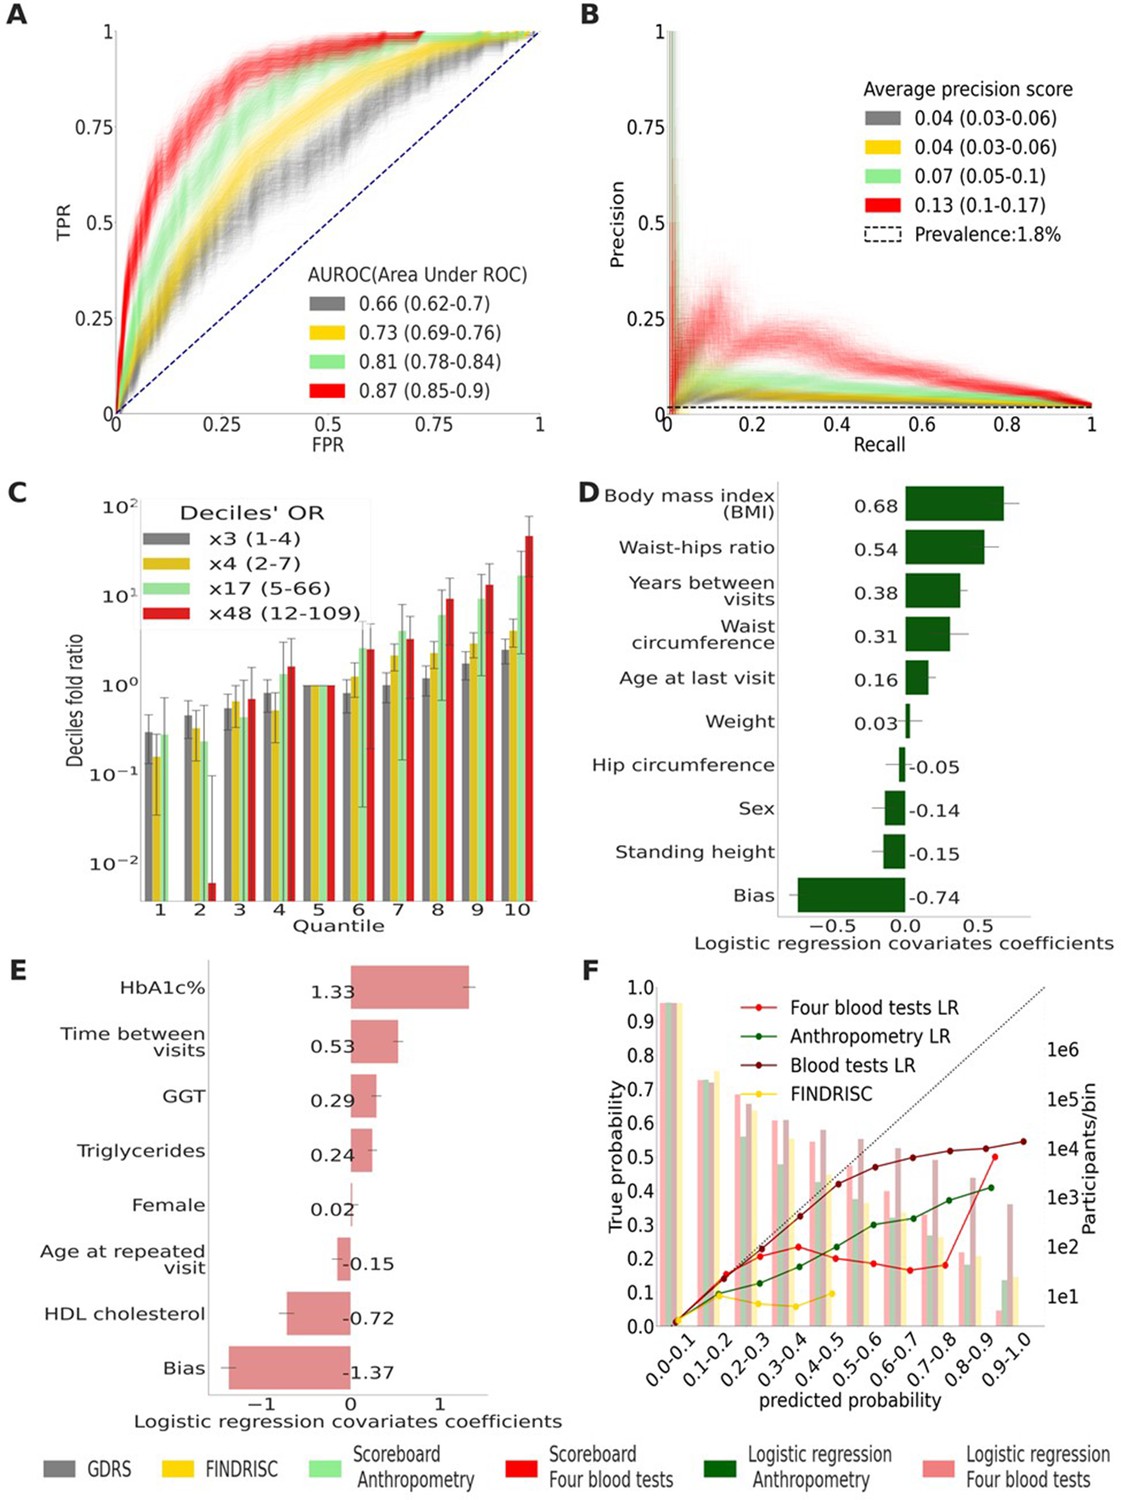
Main results calculated using 1000 bootstraps of the cohort population.

Each point in the graphs represents a bootstrap iteration result. The color legend is at the bottom of the figure. (A) Receiver operating characteristic (ROC) curves comparing the models developed in this research: a Gradient Boosting Decision Trees (GBDT) model of all features; logistic regression models of four blood tests; an anthropometry-based model compared to the well-established German Diabetes Risk Score (GDRS) and Finnish Diabetes Risk Score (FINDRISC). (B) Precision–recall (P-R) curves, showing the precision versus the recall for each model, with the prevalence of the population marked with the dashed line. (C) Deciles’ odds ratio graph, the prevalence ratio in each decile to the prevalence in the fifth decile. (D) A feature importance graph of the logistic regression anthropometry model for a model with normalized features values. The bars indicate the feature importance values’ standard deviation (SD). The top predictive features of this model are the body mass index (BMI) and waist-to-hip ratio (WHR). (E) Feature importance graph of logistic regression blood tests model with SD bars. While higher levels of HbA1c% positively contribute to type 2 diabetes (T2D) prediction, and high-density lipoprotein (HDL) cholesterol levels are negatively correlated with the predicted probability of T2D, the information provided by age and sex relevant for predicting T2D onset is screened by other features. (F) A calibration plot of the anthropometry, four blood tests, full blood test, and the FINDRISC models. Calibration of the models’ predictions allows reporting the probability of developing T2D (see ‘Methods’).

Figure 3—source data 1

Detailed results for the top to bottom quantiles OR calculation.

https://cdn.elifesciences.org/articles/71862/elife-71862-fig3-data1-v2.csv
Figure 3—source data 2

Detailed coefficients for the non-laboratory logistic regression model.

https://cdn.elifesciences.org/articles/71862/elife-71862-fig3-data2-v2.csv
Figure 3—source data 3

Detailed coefficients for the laboratory logistic regression model.

https://cdn.elifesciences.org/articles/71862/elife-71862-fig3-data3-v2.csv

We tested the models in mixed and stratified populations of 1006 prediabetes participants with a T2D prevalence of 9.4% and a separate 7948 normoglycemic participants with a T2D onset prevalence of 0.8% (see Table 4).

Shapley additive explanations (SHAP)

We used the SHAP method, which approximates Shapley values, for the feature importance analysis of the GBDT model. This method originated in game theory to explain the output of any machine-learning model. SHAP approximates the average marginal contributions of each model feature across all permutations of the other features in the same model (Lundberg and Lee, 2017).

Predictors

To estimate the contribution of each feature’s domain and for the initial screening of features, we built a GBDT model based on 279 features plus genetics data originating from the UKB SNPs array. We used T2D-related summary statistics from GWAS designed to find correlations between known genetic variants and a phenotype of interest. We used only GWASs from outside the UKB population to avoid data leakage (see supplementary material Appendix 1, ‘References for PRS summary statistics articles’).

We trained and tested the full-features model using the training and validation cohort to select the most predictive features for the anthropometry and the blood tests models. We then used this model’s feature importance to extract the most predictive features. We omitted data concerning family relatives with T2D from the model as we did not see any major improvement over the anthropometrics model. For the last step, we tested and reported the model predictions using data in the holdout section of the cohort.

For the extraction of the four blood test model, we performed a features selection process using the training and validation datasets. We executed models starting with 20 and down to 4 features of blood tests together with age and sex as features, each time removing the feature with the smallest importance score. We then selected the model with four blood tests (HbA1c%, GGT, triglycerides, HDL cholesterol) plus age and sex as the optimal balance between model simplicity (a small number of features) and model accuracy. We reported model results against data from the holdout test set.

We normalized all the continuous predictors using the standard ‘z-score.’ We normalized the train validation sets apart from the holdout test set to avoid data leakage.

Model calibration

Calibration refers to the concurrence between the real T2D onset occurrence in a subpopulation and the predicted T2D onset probability in this population. Since our data are highly imbalanced between healthy and T2D ill patients, with a prevalence of 1.79% T2D, we used 1000 bootstrapping iterations of each model to improve the calibration. To do this, we first split each model’s prediction into 10 deciles bins from 0 to 1 to calculate the calibration curves. Using Sklearn’s isotonic regression calibration, we scale the results with a fivefold cross-validation (Abraham et al., 2014). We do so for each of the bootstrapping iterations. Lastly, we concatenate all the calibrated results and calculate each probability decile’s overall mean predicted probability.

We split the probabilities range (0–1) into deciles (Figure 3F, Figure 4) and assigned each prediction sample to a decile bin according to the calibrated predicted probability of T2D onset.

Models calibration plots.

Anthropometric, four blood tests, Finnish Diabetes Risk Score (FINDRISC), and German Diabetes Risk Score (GDRS) scorecards calibration graphs.

Scorecards creation

We used the training and validation datasets for our scorecards building process. We reported the results on the holdout dataset. We calculated our data’s weight of evidence (WoE) by splitting each feature into bins. We binned greater importance features in a higher resolution while maintaining a monotonically increasing WoE (Yap et al., 2011). For quantizing the risk groups of the scorecards model, we performed 1000 iterations of a bootstrapping process on our validation dataset. We considered several potential risk score limits that separate T2D onset probability in each score group using the validation dataset. Once we set the final boundaries of the score, we reported the prevalence in each risk group on the test set. For the Cox regression-based scorecards, we used the parameters coefficient the same way we used the coefficient in the LR model for binning the model. When using a Cox regression-based scorecard, we compute the probability to develop based on a fix time frame for all participants (5 and 10 years’ time frames models; Table 3). To enable an easy way for choosing the desired time frame as part of scorecard usage, we chose to use the LR-based scorecards as our model of choice for an additional development and validation.

External validation cohort: EHR database of Clalit Health Services

As an external validation cohort for the four blood test scorecard model, we used the Clalit retrospective cohort’s electronic health records. Clalit is the largest Israeli healthcare organization, serving more than 4.4 million patients (about half the population of Israel). The Clalit database holds electronic health records of over 11  million patients, dating back to 2002. It is considered one of the world’s largest EHR databases (Artzi et al., 2020). We extracted data from patients who visited Clalit clinics from 2006 to 2011 and had a minimum of three HbA1C% tests, with the following inclusion criteria: the first sample below 6.5%, and two consecutive tests consistent with either HbA1c% ≥ 6.5 for each of the tests or both tests with HbA1C% < 6.5%. These were some of the criteria we used to indicate if the patient had developed T2D. We started with 179,000 patients that met the HbA1c% criteria noted above. We then included data from the following tests: GGT (80,000 patients), HDL (151,969 patients), and triglycerides (157,321 patients). In addition to the HbA1c% exclusion criteria, we added the following: patients who did not have all four blood tests; patients older than 70 or younger than 40; patients who were diagnosed with T2D before the first visit; patients who had a diabetes diagnosis without a clear indication that it was T2D; and patients who had taken diabetes-related drugs (ATC code A10) before the first visit or before being diagnosed with T2D either based on HbA1c% levels or by a physician.

As a criterion for T2D, we considered two consecutive tests with HbA1c ≥ 6.5% or a physician diagnosis of T2D. After excluding patients according to the above criteria, the remaining cohort included 17,132 patients with anthropometric characteristics similar to the UKB cohort (Table 2). The remaining cohort’s T2D onset prevalence is 4.1%, considerably greater than the 1.79% in the UKB cohort. We further tested the model on a stratified normoglycemic subcohort with 10,064 patients and a prevalence of 2% T2D and a prediabetes subcohort with 7059 patients with 7.1% T2D prevalence.

Table 2
External validation cohort (‘Clalit’) statistical data.
Males (%)HbA1c (%)GGTReticulocyte countHDLTriglyceridesAgeWeightHeightBMI
Number of samples17,13217,1328317,13217,13217,13217,05117,05117,051
Mean value455.5632.3156.3349.77141.3356.4079.001.6628.72
Standard deviation0.4149.2936.9713.3382.098.0649.900.0919.58
0.255.3017.0038.3540.0090.0050.1467.001.5924.80
0.505.6023.0058.0048.00123.0057.0277.001.6527.68
0.755.9033.0078.6057.00170.0062.8387.821.7231.25
  1. HbA1c, hemoglobin A1c; GGT, gamma-glutamyl transferase; HDL, high-density lipoprotein; BMI, body mass index.

We tested the four blood test model on the data from the above cohorts by calculating a raw score for each participant based on all relevant scorecard features apart from the time ‘years for prediction’ feature. We then randomly sampled out of a normal distribution resembling the UKB cohort (mean = 7.3 years, SD = 2.3 years) 1000 time periods for a returning visit for each participant. We limited the patients’ time of returning between 2 and 17 years to emulate the UKB data. The cutoff data for last visit was December 31, 2019, the last date reported in the Clalit database. We then estimated the mean and 95% CI of these cohort’s auROC and APS results.

We did not evaluate the FINDRISC, GDRS, and anthropometrics models using the Clalit database as these models required some features that do not appear in the Clalit database. The FINDRISC model requires data regarding physical activity, waist circumference, and consumption of vegetables, fruit, or berries. The GDRS requires the following missing data fields: physical activity, waist circumference, consumption of whole-grain bread/rolls and muesli, consumption of meat, and coffee consumption. The anthropometrics model requires data regarding waist and hips circumference.

Results

Anthropometric-based model

Using the anthropometrics scorecard model the patient’s final score relates to three risk groups (see ‘Model building procedures’). Participants within the score range between 1 and 69 have a 1% (95% CI 0.8–1%) probability of developing T2D. The second group, with a score range between 70 and 78, predicts a 5% (95% CI 3–6%) probability of developing T2D. The third group, with a score range of between 79 and 96, predicts a 9% (95% CI 7–12%) probability of developing T2D (Figure 2C).

We also provide models with the same features in their LR form and a Cox regression form for more accurate computer-aided results. Testing these models using the holdout test set achieved an auROC of 0.81 (0.78–0.84) and an APS of 0.09 (0.06–0.13) at 95% CI. Applying a survival analysis Cox regression model to the same features resulted in comparable results (Table 3). Using the model in its scorecard form, we achieved an auROC of 0.81 (0.77–0.84) and an APS of 0.07 (0.05–0.10). All these models outperformed the two models that we used as a reference: applying the FINDRISC model resulting in an auROC of 0.73 (0.69–0.76) and an APS of 0.04 (0.03–0.06), and applying the GDRS model resulting in an auROC of 0.66 (0.62–0.70) and an APS of 0.04 (0.03–0.06) (Figure 3A and B, Table 3, and ‘Methods’). With the cohort’s baseline prevalence of 1.79%, the Cox regression model achieved deciles’ odds ratio (OR) of ×10.65 (4.99–23.67), the L.R. Anthropometric model achieved deciles’ OR of ×16.9 (4.84–65.93), and its scorecard derivative achieved deciles OR of ×17.15 (5–65.97) compared to the FINDRISC model’s ×4.13 (2.29–7.37) and the ×2.53 (1.46–4.45) deciles’ OR achieved by the GDRS model (Figure 3C, Table 3, ‘Methods’). The WHR and BMI have the highest predictability in the anthropometric model (Figure 3D). These two body habitus measures are indicators associated with chronic illness (Eckel et al., 2005; Cheng et al., 2010; Jafari-Koshki et al., 2016; Qiao and Nyamdorj, 2010).

Table 3
Comparing models' main results.

The values in parentheses indicate a 95% confidence interval (CI). The deciles’ odds ratio (OR) measures the ratio between type 2 diabetes (T2D) prevalence in the top risk score decile bin and the prevalence in the fifth decile bin (see ‘Methods’).

Measure typeModel typeAPSauROCDecile’s prevalence OR
GDRSScore card cox regression for 5 years0.04 (0.03–0.06)0.66 (0.62–0.70)2.5 (1.46–4.45)
FINDRISCScore card logistic regression0.04 (0.03–0.06)0.73 (0.69–0.76)4.13 (2.29–7.37)
AnthropometryScore card cox regression for 5 years0.04 (0.03–0.07)0.79 (0.75–0.83)8.8 (3.6–36)
AnthropometryScore card cox regression for 10 years0.06 (0.04–0.09)0.79 (0.76–0.82)10 (4.6–32.9)
AnthropometryScore card logistic regression0.07 (0.05–0.10)0.81 (0.77–0.84)17.2 (5–66)
AnthropometryLogistic regression0.09 (0.06–0.13)0.81 (0.78–0.84)16.9 (4.8–66)
AnthropometryCox regression0.10 (0.07–0.13)0.82 (0.79–0.85)10.7 (5–24)
Four blood testsScore card cox regression for 10 years0.13 (0.10–0.16)0.87 (0.85–0.90)22.4 (9.8–54)
Four blood testsLR score card0.13 (0.10–0.17)0.87 (0.85–0.90)48 (11.9–109)
Four blood testsScore card cox regression for 5 years0.09 (0.06–0.12)0.89 (0.86–0.92)53.2 (18.9–84.2)
Four blood testsCox regression0.25 (0.18–0.32)0.88 (0.85–0.90)43 (13.6–109)
Four blood testsLogistic regression0.24 (0.17–0.31)0.88 (0.85–0.91)32.5 (10.89–110)
Blood testsLogistic regression0.26 (0.19–0.33)0.91 (0.89–0.93)75.4 (17.7–133)
All featuresBoosting decision trees0.27 (0.20–0.34)0.91 (0.89–0.93)72.6 (15.1–135)
  1. APS, average precision score; auROC, area under the receiver operating curve; GDRS, German Diabetes Risk Score; FINDRISC, Finnish Diabetes Risk Score; DT, Decision Trees.

Model based on four blood tests

Using the four blood tests scorecard (‘Methods,’ Figure 2B), we binned the resulting scores into four groups. Participants with a score within the score range of between 1 and 104 have a 0.5% (95% CI 0.4–0.7%) probability of developing T2D. The second group, with a score range of between 105 and 116, predicts a 3% (95% CI 2–4%) probability of developing T2D. The third group score, with a range of between 117 and 146, predicts a 10% (95% CI 8–12%) of developing T2D. The fourth group score range was between 147 and 162, and participants in this score range have a 23% (95% CI 10–37%) probability of developing T2D.

We used four common blood test scores as input to the survival analysis and the LR model. Applying the survival analysis Cox regression model for the test set, we achieved an ROC of 0.88 (0.85–0.90), an APS of 0.25 (0.18–0.32), and a deciles OR of ×42.9 (13.7–109.1). Using the four blood tests LR model, we achieved comparable results: an auROC of 0.88 (0.85–0.91), an APS of 0.24 (0.17–0.31), and a deciles’ OR of 32.5 (10.8–110.1). Applying the scorecard model, we achieve an auROC of 0.87 (0.85–0.9), an APS of 0.13 (0.10–0.17), and a deciles’ OR of 47.7 (79–115) (Figure 3A–C, Table 3). The four blood test model results are superior to those of the nonlaboratory anthropometric model and those of the commonly used FINDRISC and GDRS models (Figure 3A–C, Table 3).

As expected, the HbA1c% feature had the highest predictive power since it is one of the criteria for T2D diagnosis. The second-highest predictive feature was HDL cholesterol, which is known to be beneficial for health, especially in the context of cardiovascular diseases, with high levels being negatively correlated to T2D onset. (Meijnikman et al., 2018; Kontush and Chapman, 2008; Bitzur et al., 2009) . Interestingly, age and sex had a low OR value, meaning that they hardly contributed to the model, probably because of the T2D-relevant information of these features latent within the blood tests data.

We compared these results to those of 59 blood tests input features of the LR model and those of a GBDT model, including 13 features aggregations composed of 279 individual features and genetics data available in the dataset. These two models achieved an auROC of 0.91 (0.89–0.93) and 0.91 (0.9–0.93), an APS of 0.26 (0.19–0.33) and 0.27 (0.20–0.34), and a deciles’ OR of ×75.4 (17.74–133.45) and ×72.6 (15.09–134.9), respectively.

Prediction within an HbA1c% stratified population

To verify that our scorecard models can discriminate within a group of normoglycemic participants and within a group of prediabetic participants, we tested the models separately on each group. We separated the groups based on their HbA1c% levels during the first visit to the UKB assessment centers. We allocated participants with 4% ≤ HbA1c% < 5.7% to the normoglycemic group and participants with 5.7% = <HbA1c% < 6.5% levels to the prediabetic group (Cheng et al., 2010). As HbA1c% is one of the identifiers of T2D, this measure is a strong predictor of T2D. The prevalence of T2D onset within the normoglycemic group is only 0.8% versus a prevalence of 9.4% in the prediabetic group. The anthropometry model yielded an auROC of 0.81 (0.76–0.86) within the normoglycemic group with an APS of 0.04 (0.02–0.07). When testing the models within the prediabetic group, the anthropometry model achieved an auROC of 0.73 (0.68–0.77) and an APS of 0.2 (0.15–0.26). Both results outperform the FINDRISC and GDRS results. For the normoglycemic HbA1c% range, the four blood test model yielded an auROC of 0.81 (0.76–0.85) and an APS of 0.03 (0.02–0.05). These results are similar to those of the anthropometry model’s results. To explore the option of developing scorecard models dedicated to these stratified populations, we developed and tested two such models, which achieved results similar to the mixed-cohort model (Table 4).

Table 4
Comparing model results applied to an HbA1c% stratified population.

The values in parentheses indicate 95% confidence interval (CI). Results of the models applied to a stratified population. The mixed population-based model column provides the results of the scorecard models presented in Figure 2 applied to normoglycemic and prediabetes stratified population.

PopulationMixed population-based model: tested on a stratified populationModels built using a stratified training set
auROCAPSauROCAPS
Prediabetic
(N = 1006,
prevalence = 9.4%)
GDRS0.64 (0.57–0.70)0.17 (0.12–0.23)-
FINDRISC0.66 (0.61–0.72)0.20 (0.14–0.27)-
Anthropometry0.73 (0.68–0.77)0.20 (0.15–0.26)0.73 (0.68–0.78)0.21 (0.16–0.27)
Four blood tests0.73 (0.68–0.77)0.20 (0.15–0.26)0.72 (0.67–0.77)0.21 (0.15–0.26)
Normoglycemic
(N = 7948,
prevalence = 0.8%)
GDRS0.67 (0.61–0.74)0.02 (0.01–0.03)-
FINDRISC0.74 (0.69–0.79)0.04 (0.02–0.07)-
Anthropometry0.81 (0.76–0.86)0.04 (0.02–0.07)0.81 (0.76–0.85)0.03 (0.02–0.06)
Four blood tests0.81 (0.76–0.85)0.03 (0.02–0.05)0.82 (0.77–0.86)0.05 (0.03–0.09)
  1. auROC, area under the receiver operating curve; FINDRISC, Finnish Diabetes Risk Score; GDRS, German Diabetes Risk Score; APS, average precision score.

Validating the four blood test model on an external independent cohort

To validate our four blood test model, we utilized the Israeli electronic medical record database of Clalit Health Services as an external cohort. Applying our model to nondiabetic participants of the same age range population (see ‘Mmethods’), the four blood test model achieved an auROC of 0.75 (95% CI 0.74–0.75) and an APS of 0.11 (95% CI 0.10–0.11) on a population of 17,132 participants with a 4.1% T2D onset prevalence. We then tested the model on stratified normoglycemic and prediabetes subcohorts. In the normoglycemic population (N = 10,064 participants) with T2D onset prevalence of 2%, the model achieved an auROC of 0.69 (95% CI 0.66–0.69) and an APS of 0.04 (95% CI 0.04–0.05). Within the prediabetes population (N = 7059) with a T2D onset prevalence of 7.1%, the model achieved an auROC of 0.68 (95% CI 0.67–0.69) and an APS of 0.12 (95% CI 0.12–0.13) (Table 5). These results validate the general applicability of our models applied to an external cohort. As this database lacks data required for the anthropometry, GDRS, and FINDRISC scorecards, we could not apply these models to the Clalit database (see ‘External validation cohort’).

Table 5
Four blood tests scorecard results from the external validation cohort (‘Clalit’).
LabelCohort sizePrevalence (%)APSauROC
Full population (HbA1c% < 6.5%)17,1324.10.11 (0.10–0.11)0.75 (0.74–0.75)
Normoglycemic population
(HbA1c% < 5.7%)
10,06420.04 (0.04–0.05)0.69 (0.66–0.69)
Prediabetes population
(5.7% = <HbA1c% < 6.5%)
70597.10.12 (0.12–0.13)0.68 (0.67–0.69)
  1. APS, average precision score; auROC, area under the receiver operating curve.

Discussion and conclusions

In this study, we analyzed several models for predicting the onset of T2D, which we trained and tested on a UKB-based cohort aged 40–69. Due to their accessibility and high predictability, we suggest two simple scorecard models: the anthropometric and four blood test models. These models are suited for the UKB cohort or populations with similar characteristics (see Table 1).

To provide an accessible and simple yet predictive model, we based our first model on age, sex, and six nonlaboratory anthropometric measures. We then developed an additional, more accurate, straightforward model that can be used when laboratory blood test data are available. We based our second proposed model on four blood tests, in addition to age and sex of the participants. We reported results of both models according to their scoring on survival analysis Cox regression and LR models. As these models require computer-aided analysis, we developed an easy-to-use scorecard form. For all models, we obtained results that were superior to those of the current clinically validated nonlaboratory models, FINDRISC and GDRS. As a fair comparison, we trained these reference models and evaluated their predictions on the same datasets used with all our models.

Our models achieved a better auROC, APS, decile prevalence OR, and better-calibrated predictions than the FINDRISC and GDRS models. The anthropometrics and the four blood tests survival analysis models achieved deciles prevalence OR of ×10.7 and ×42.9, respectively, while the scorecard forms achieved OR of ×17.15 and ×47.7, respectively.

The anthropometry-based model retained its auROC performance of 0.81 (0.76–0.86) in the normoglycemic population but its performance worsened to 0.73 (0.68–0.77) in the prediabetes population. The four blood test model’s performance showed a similar trend in these two subcohorts (Table 4). Training a subcohort-specific model did not improve these results.

Analyzing our models' feature importance, we conclude that the most predictive features of the anthropometry model are the WHR and BMI, body metrics that characterize body type or shape data. These features are known in the literature as being related to T2D, such conditions known as part of the metabolic syndrome (Eckel et al., 2005). The most predictive feature of the four blood test model is the HbA1c%, which is a measure of the glycated hemoglobin carried by the red blood cells, often used to diagnose diabetes. Interestingly, age and sex had a very low feature importance value, implying that they hardly contributed to the model results. One potential explanation is that the T2D-related information of these features is already latent within the blood test data. For instance, the sex hormone-binding globulin (SHBG) feature contains a continuous measure regarding the sex hormone of each participant, thus making the sex feature redundant.

Applying the four blood test model to the Clalit external cohort, we achieved an auROC of 0.75 (0.74–0.75). While we obtained a sound prediction indication, the results are inferior to the scores when applied to the UKB population. This sound prediction indication and degradation in performance are seen both in the general population and in the HbA1C% stratified subcohorts. We expected degradation in results when transitioning from the UKB to the Clalit cohort as these two cohorts vary in many aspects. While the UKB is a UK population-based prospective study suffering from ‘healthy volunteer selection bias’ and from ‘attrition bias’ (Fry et al., 2017; Hernán et al., 2004), the Clalit cohort is a retrospective cohort based on an Israeli population and suffers from ascertainment bias and diagnostic suspicion biases, as people with higher risk for T2D are sent to perform the related blood tests. In both studies, there is a need to handle missing data. In the Clalit database, we had to drop patients with inconclusive diagnoses (e.g., diabetes diagnosis, without referring to the type of diabetes; see ‘External validation cohort section’). One of the most apparent differences is seen when comparing the T2D prevalence of the two cohorts: 1.79% for the UKB versus 4.1% for the Clalit database.

One main limitation of our study is that our cohorts’ T2D prevalence is biased away from the general UK populations’ T2D prevalence. Our cohort’s T2D prevalence was only 1.79%, while the general UK population’s T2D prevalence is 6.3%, and 8% among adults aged 45–54 in the general UK population (2019) (Diabetes UK). This bias is commonly reported as a ‘healthy volunteer’ selection bias (Fry et al., 2017; Hernán et al., 2004), which reduces the T2D prevalence from 6% in the general UK population to 4.8% in the UKB population. An additional screening bias is caused by including only healthy participants on their first visit. This contributed to the reduced prevalence of T2D in our cohort of 1.79% T2D onset. Applying our models to additional populations requires further research, and fine-tuning of the feature coefficients might be required.

As several studies have concluded (Knowler et al., 2002; Lindström et al., 2006; Diabetes Prevention Program Research Group, 2015), a healthy lifestyle and diet modifications are expected to reduce the probability of T2D onset; therefore, identifying people at risk for T2D is crucial. We assert that our models make a significant contribution to such identification in two ways: the laboratory four blood test model for clinical use is highly predictive of T2D onset, and the anthropometrics model, mainly in its scorecard form, is an easily accessible and accurate tool. Thus, these models have the potential to improve millions of people’s lives and reduce the economic burden on the medical system.

Appendix 1

Exploring the full features' space using GBDT

To select model features, we analyzed the importance of features that we sought to relate to T2D. We analyzed the power of a predictive model with a vast amount of information and compared it to our minimal features models.

We started by sorting out a list of 279 preliminary features from the first visit to the UKB assessment center. In addition to these features, we used the UKB SNPs genotyping data and its calculated PRS.

We inspected the impact of various features groups using the lightGBM (Ke et al., 2017) gradient decision trees model using SHAP (Lundberg et al., 2020; Lundberg and Lee, 2017; Appendix 1—figure 1, see ‘SHAP’). We aggregated the features into 13 separate groups: age and sex; genetics; early-life factors; socio-demographic; mental health; blood pressure and heart rate; family background and ethnicity; medication; diet; lifestyle and physical activity; physical health; anthropometry; and blood tests. All of these groups included age and sex features.

Appendix 1—figure 1
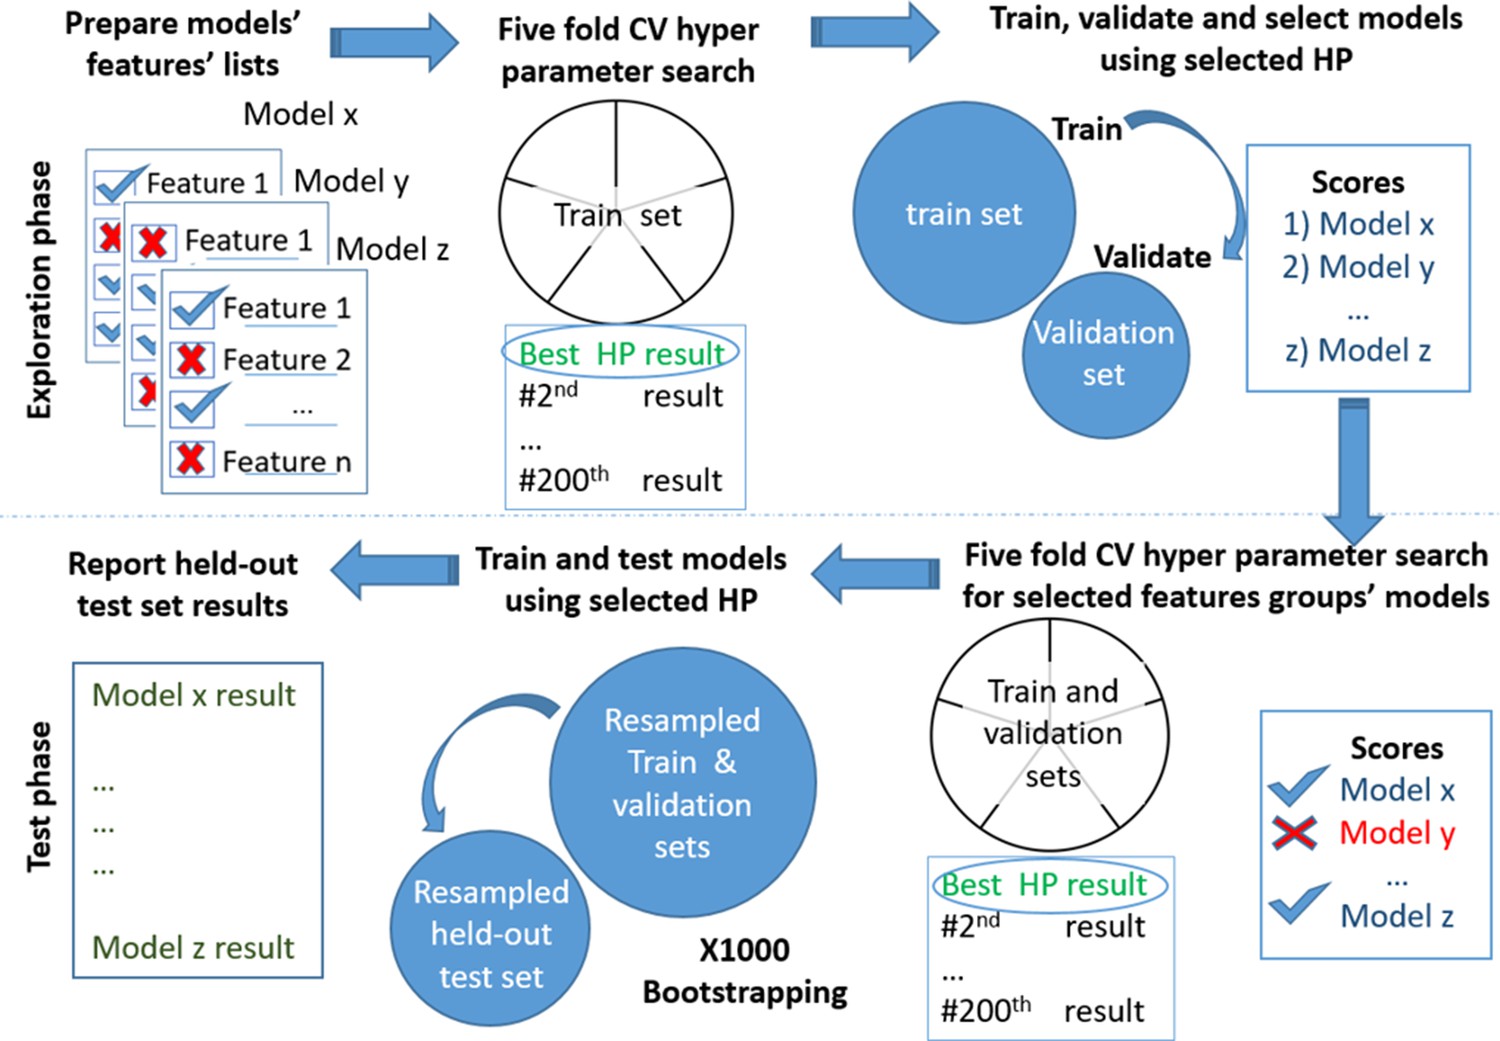
Models testing and training process.

Models’ development. Scheme of the models' exploration and evaluation process. For the models’ selection process, we used a fivefold cross-validation with 200 iterations of the random hyperparameters process for each group of features. We then selected the top-scored hyperparameters for each feature’s group. We trained a new model based on the training set and measured the area under the receiver operating curve (auROC) using the validation set. Out of the validated models, we chose the models that had a minimal number of features and provided high performance. The reported results are of the heldout test set.

We also tested the impact of HbA1c% with age and sex and genetics without age and sex. We list the top five predictive GBDT models, according to their auROC and APS, in descending order. ‘All features without genetic sequencing’ model – auROC of 0.92 (95% CI 0.89–0.94%) and APS of 0.28 (95% CI 0.20–0.36%). Adding genetics to this model degraded the results to an auROC of 0.91 (0.89–0.93) and an APS of 0.27 (0.2–0.34), probably due to overfitting. The ‘full blood tests’ model – auROC of 0.90 (0.88–0.93) and an APS of 0.28 (0.21–0.36). The ‘four blood tests’ model – auROC of 0.88 (0.85–0.90) and an APS of 0.20 (0.14–0.17). The HbA1c%-based model – auROC of 0.84 (0.80–0.87) and an APS of 0.17 (0.12–0.23). The anthropometry model – auROC of 0.79 (0.75–0.82) and an APS of 0.07 (0.05–0.11) (Appendix 1—table 1).

The lifestyle and physical activity model includes 98 features related to physical activity; addictions; alcohol, smoking, cannabis use, electronic device use; employment; sexual factors; sleeping; social support; and sun exposure. This model achieved an auROC of 0.73 (0.69–0.77), providing better prediction scores than the diet features group. The diet-based model includes 32 diet features from the UKB touchscreen questionnaire on the reported frequency of type and intake of common food and drink items. This model achieved an auROC of 0.66 (0.60–0.71).

Appendix 1—table 1
Predicting using feature domain groups.

Results of Gradient Boosting Decision Trees (GBDT) models for various feature domains.

LabelAPSauROC
All features without genetic sequencing0.28 (0.20–0.36)0.92 (0.89–0.94)
All features0.27 (0.20–0.34)0.91 (0.89–0.93)
All blood tests0.28 (0.21–0.36)0.90 (0.88–0.93)
Four blood tests0.20 (0.14–0.27)0.88 (0.85–0.90)
Blood tests without HbA1c%0.13 (0.09–0.18)0.84 (0.81–0.87)
HbA1c%0.17 (0.12–0.23)0.84 (0.80–0.87)
Blood tests without HbA1c% nor glucose0.10 (0.07–0.13)0.82 (0.79–0.86)
Anthropometry0.07 (0.05–0.11)0.79 (0.75–0.82)
Lifestyle and physical activity0.05 (0.04–0.07)0.73 (0.69–0.77)
Blood pressure and heart rate0.05 (0.03–0.07)0.69 (0.64–0.73)
Nondiabetes-related medication0.04 (0.03–0.06)0.67 (0.62–0.73)
Mental health0.04 (0.03–0.06)0.67 (0.62–0.71)
Family and ethnicity0.04 (0.03–0.05)0.66 (0.60–0.71)
Diet0.04 (0.03–0.06)0.66 (0.60–0.71)
Socio-demographics0.03 (0.02–0.05)0.65 (0.60–0.70)
Early-life factors0.03 (0.02–0.05)0.64 (0.59–0.69)
Age and sex0.03 (0.02–0.04)0.61 (0.56–0.67)
Only genetics0.03 (0.02–0.04)0.57 (0.51–0.63)
  1. APS, average precision score; auROC, area under the receiver operating curve.

We then examined the additive contribution of each predictive group up to the total predictive power of the ‘all features’ model (Appendix 1—table 2). We started with the baseline model of ‘age and sex’ and added feature groups, sorted by their predictive power as separate GBDT models. We concluded that using the four blood test model substantially increases the accuracy of the prediction results compared to a model based only on HbA1c% and age and sex. The auROC and APS increases from 0.84 (0.80–0.87), 0.17 (0.12–0.23) to 0.88 (0.85–0.90), 0.20 (0.14–0.27), respectively.

The full blood test model increased the auROC and APS to 0.90 (0.88–0.93) and 0.28 (0.21–0.36), respectively. We did not identify any major increase in accuracy of the predictions by adding any other specific group to this list, suggesting that most of the predictive power of our models are either captured by the blood test features or possess collinear information. Using all features together provided an increase in performance to auROC, APS, and the deciles' OR of 0.9 (0.88–0.92), 0.28 (0.22–0.35), and ×65(49-73), respectively (Appendix 1—table 2).

Appendix 1—table 2
Summary of Incremental feature’s model.

Comparison table of average precision score (APS) and area under the receiver operating curve (auROC) for the Gradient Boosting Decision Trees (GBDT) models, where each model includes the preceding model’s features plus an additional feature domain. The largest increase in prediction accuracy was the result of adding the HbA1C% feature, which is also a biomarker for type 2 diabetes (T2D) diagnosis. Adding the DNA sequencing data did not significantly contribute to the prediction power of the model.

LabelAPSauROC
Age and sex0.03 (0.02–0.04)0.61 (0.56–0.67)
HbA1c%0.17 (0.12–0.23)0.84 (0.80–0.87)
Four blood tests0.20 (0.14–0.27)0.88 (0.85–0.90)
All blood tests0.28 (0.21–0.36)0.90 (0.88–0.93)
Adding anthropometrics0.23 (0.17–0.30)0.90 (0.87–0.92)
Adding physical health DT0.28 (0.21–0.36)0.91 (0.89–0.93)
Adding lifestyle DT0.24 (0.18–0.32)0.91 (0.88–0.93)
Adding blood pressure and heart rate0.25 (0.19–0.33)0.91 (0.88–0.93)
Adding non-T2D-related medical diagnosis0.24 (0.18–0.32)0.91 (0.88–0.93)
Adding mental health0.28 (0.20–0.36)0.91 (0.89–0.93)
Adding medication0.28 (0.20–0.35)0.91 (0.89–0.93)
Adding diet0.24 (0.18–0.31)0.91 (0.89–0.93)
Adding family-related information0.28 (0.21–0.35)0.91 (0.89–0.94)
Adding early-life factors0.24 (0.17–0.31)0.91 (0.89–0.93)
Adding socio-demographic0.27 (0.20–0.36)0.92 (0.89–0.94)
Adding genetics0.27 (0.20–0.34)0.91 (0.89–0.93)

Deprivation index differences between sick and healthy populations in our UKB cohort

Here, we analyzed the Townsend deprivation index differences of participants diagnosed with T2D in one of their returning visits to the assessment center versus the healthy population. The Townsend deprivation index measures deprivation based on employment status, ownership of car and home, and overcrowded household. Higher index values represent lower socioeconomic status. According to our analysis, a higher deprivation index is correlated with a higher risk of developing T2D (Appendix 1—figure 2A). We analyzed the data using a Mann–Whitney U-test with a sample of 1000 participants from each group; we achieved a p-value of 2.37e–137. When we analyzed the full cohort, the p-value dropped below the computational threshold, indicating a significant correlation between a Townsend deprivation index and our cohort’s tendency to develop T2D.

Appendix 1—figure 2
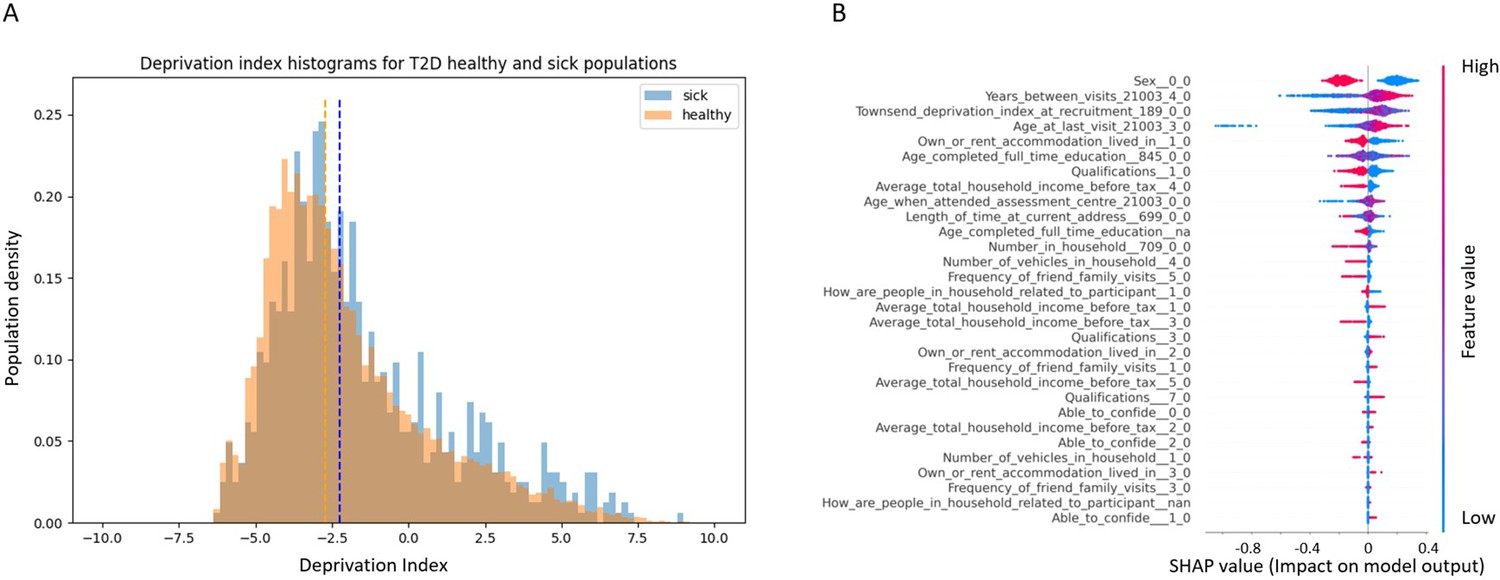
Socioeconomic impact on prediction of risk of developing type 2 diabetes (T2D).

(A) Deprivation index differences between T2D sick and healthy populations in our data: a density histogram showing the differences in deprivation index of participants who were diagnosed with T2D in one of their returning visits to the assessment center and for healthy participants. Executing a Mann–Whitney test on this data yields a p-value lower than 2.37 * 10–137, indicating a correlation between lower socio-demographic state with higher T2D prevalence. (B) Shapley Additive Explanations (SHAP) analysis of the socio-demographic features for a Gradient Boosting Decision Trees (GBDT) predictor of T2D: Each dot represents a participant’s value for each feature along the Y-axis. The colors indicate the values of the features: red indicates higher feature values, blue indicates lower feature values. The X-axis is the SHAP value, where higher SHAP values indicate a stronger positive impact on the positive prediction of the GBDT predictor, that is, higher risk for T2D onset. The analysis indicates that higher values of deprivation index and lower household income push the probability of T2D onset to higher values. The full meaning of the codes is provided at the UK Biobank data showcase.

We performed a SHAP analysis on the socio-demographic features of the patients, and features such as higher Townsend deprivation index or being in the lower-income groups (<40,000 GBP) push towards a prediction of developing T2D while being in the top two groups (52,000 GBP or more) is predictive of having less risk of developing T2D (Figure S3B). The full meaning of the codes is available at the UK Biobank data showcase.

References for PRS summary statistics articles

HbA1c Soranzo et al., 2010; Walford et al., 2016; Wheeler et al., 2017; cigarettes per day, ever smoked, age start smoking Tobacco and Genetics Consortium, 2010; HOMA-IR, HOMA-B, diabetes BMI unadjusted, diabetes BMI adjusted, fasting glucose Morris et al., 2013; fasting glucose, 2 hr glucose level, fasting insulin, fasting insulin adjusted BMI'- (MAGIC Scott) Scott et al., 2012; fasting glucose, fasting glucose adjusted for BMI, fasting insulin adjusted for BMI Manning et al., 2012; Two hours glucose level Saxena et al., 2010; Fasting insulin the DIAbetes Genetics Replication And Meta-analysis (DIAGRAM) Consortium, 2012; Fasting Proinsulin Strawbridge et al., 2011; Leptin adjusted for BMI Kilpeläinen et al., 2016; Leptin unadjusted for BMI; Triglycerides, Cholesterol, LDL, hdl Willer et al., 2013; BMI Locke et al., 2015; Obesity class1, obesity_class2, overweight Berndt et al., 2013; Anorexia Boraska et al., 2014; Height Wood et al., 2014; Waist circumference, hips circumference Shungin et al., 2015; Cardio Deloukas et al., 2013; Heart_Rate den Hoed et al., 2013; Alzheimer Lambert et al., 2013; Asthma Moffatt et al., 2010.

Data availability

All data that we used to develop the models in this research is available through the UK Biobank database. The external validation cohort is from "Clalit healthcare". The two databases can be accessed upon specific requests and approval as described below. UKBiobank - The UK Biobank data is Available from UK Biobank subject to standard procedures (https://www.ukbiobank.ac.uk/enable-your-research/apply-for-access). The UK Biobank resource is open to all bona fide researchers at bona fide research institutes to conduct health-related research in the public interest. UK Biobank welcomes applications from academia and commercial institutes. Clalit - The data that support the findings of the external Clalit cohort originate from Clalit Health Services (http://clalitresearch.org/about-us/our-data/). Due to restrictions, these data can be accessed only by request to the authors and/or Clalit Health Services. Requests for access to all or parts of the Clalit datasets should be addressed to Clalit Healthcare Services via the Clalit Research Institute (http://clalitresearch.org/contact/). The Clalit Data Access committee will consider requests given the Clalit data-sharing policy. Source code for analysis is available at https://github.com/yochaiedlitz/T2DM_UKB_predictions, (copy archived at swh:1:rev:1e6b22e3d51d515eb065d7d5f46408f86f33d0b8).

The following previously published data sets were used
    1. Bycroft C
    2. Freeman C
    3. Petkova D
    (2018) biobank
    ID 100314. The UK Biobank resource with deep phenotyping and genomic data.

References

    1. Berndt SI
    2. Gustafsson S
    3. Mägi R
    4. Ganna A
    5. Wheeler E
    6. Feitosa MF
    7. Justice AE
    8. Monda KL
    9. Croteau-Chonka DC
    10. Day FR
    11. Esko T
    12. Fall T
    13. Ferreira T
    14. Gentilini D
    15. Jackson AU
    16. Luan J
    17. Randall JC
    18. Vedantam S
    19. Willer CJ
    20. Winkler TW
    21. Wood AR
    22. Workalemahu T
    23. Hu Y-J
    24. Lee SH
    25. Liang L
    26. Lin D-Y
    27. Min JL
    28. Neale BM
    29. Thorleifsson G
    30. Yang J
    31. Albrecht E
    32. Amin N
    33. Bragg-Gresham JL
    34. Cadby G
    35. den Heijer M
    36. Eklund N
    37. Fischer K
    38. Goel A
    39. Hottenga J-J
    40. Huffman JE
    41. Jarick I
    42. Johansson Å
    43. Johnson T
    44. Kanoni S
    45. Kleber ME
    46. König IR
    47. Kristiansson K
    48. Kutalik Z
    49. Lamina C
    50. Lecoeur C
    51. Li G
    52. Mangino M
    53. McArdle WL
    54. Medina-Gomez C
    55. Müller-Nurasyid M
    56. Ngwa JS
    57. Nolte IM
    58. Paternoster L
    59. Pechlivanis S
    60. Perola M
    61. Peters MJ
    62. Preuss M
    63. Rose LM
    64. Shi J
    65. Shungin D
    66. Smith AV
    67. Strawbridge RJ
    68. Surakka I
    69. Teumer A
    70. Trip MD
    71. Tyrer J
    72. Van Vliet-Ostaptchouk JV
    73. Vandenput L
    74. Waite LL
    75. Zhao JH
    76. Absher D
    77. Asselbergs FW
    78. Atalay M
    79. Attwood AP
    80. Balmforth AJ
    81. Basart H
    82. Beilby J
    83. Bonnycastle LL
    84. Brambilla P
    85. Bruinenberg M
    86. Campbell H
    87. Chasman DI
    88. Chines PS
    89. Collins FS
    90. Connell JM
    91. Cookson WO
    92. de Faire U
    93. de Vegt F
    94. Dei M
    95. Dimitriou M
    96. Edkins S
    97. Estrada K
    98. Evans DM
    99. Farrall M
    100. Ferrario MM
    101. Ferrières J
    102. Franke L
    103. Frau F
    104. Gejman PV
    105. Grallert H
    106. Grönberg H
    107. Gudnason V
    108. Hall AS
    109. Hall P
    110. Hartikainen A-L
    111. Hayward C
    112. Heard-Costa NL
    113. Heath AC
    114. Hebebrand J
    115. Homuth G
    116. Hu FB
    117. Hunt SE
    118. Hyppönen E
    119. Iribarren C
    120. Jacobs KB
    121. Jansson J-O
    122. Jula A
    123. Kähönen M
    124. Kathiresan S
    125. Kee F
    126. Khaw K-T
    127. Kivimäki M
    128. Koenig W
    129. Kraja AT
    130. Kumari M
    131. Kuulasmaa K
    132. Kuusisto J
    133. Laitinen JH
    134. Lakka TA
    135. Langenberg C
    136. Launer LJ
    137. Lind L
    138. Lindström J
    139. Liu J
    140. Liuzzi A
    141. Lokki M-L
    142. Lorentzon M
    143. Madden PA
    144. Magnusson PK
    145. Manunta P
    146. Marek D
    147. März W
    148. Leach IM
    149. McKnight B
    150. Medland SE
    151. Mihailov E
    152. Milani L
    153. Montgomery GW
    154. Mooser V
    155. Mühleisen TW
    156. Munroe PB
    157. Musk AW
    158. Narisu N
    159. Navis G
    160. Nicholson G
    161. Nohr EA
    162. Ong KK
    163. Oostra BA
    164. Palmer CNA
    165. Palotie A
    166. Peden JF
    167. Pedersen N
    168. Peters A
    169. Polasek O
    170. Pouta A
    171. Pramstaller PP
    172. Prokopenko I
    173. Pütter C
    174. Radhakrishnan A
    175. Raitakari O
    176. Rendon A
    177. Rivadeneira F
    178. Rudan I
    179. Saaristo TE
    180. Sambrook JG
    181. Sanders AR
    182. Sanna S
    183. Saramies J
    184. Schipf S
    185. Schreiber S
    186. Schunkert H
    187. Shin S-Y
    188. Signorini S
    189. Sinisalo J
    190. Skrobek B
    191. Soranzo N
    192. Stančáková A
    193. Stark K
    194. Stephens JC
    195. Stirrups K
    196. Stolk RP
    197. Stumvoll M
    198. Swift AJ
    199. Theodoraki EV
    200. Thorand B
    201. Tregouet D-A
    202. Tremoli E
    203. Van der Klauw MM
    204. van Meurs JBJ
    205. Vermeulen SH
    206. Viikari J
    207. Virtamo J
    208. Vitart V
    209. Waeber G
    210. Wang Z
    211. Widén E
    212. Wild SH
    213. Willemsen G
    214. Winkelmann BR
    215. Witteman JCM
    216. Wolffenbuttel BHR
    217. Wong A
    218. Wright AF
    219. Zillikens MC
    220. Amouyel P
    221. Boehm BO
    222. Boerwinkle E
    223. Boomsma DI
    224. Caulfield MJ
    225. Chanock SJ
    226. Cupples LA
    227. Cusi D
    228. Dedoussis GV
    229. Erdmann J
    230. Eriksson JG
    231. Franks PW
    232. Froguel P
    233. Gieger C
    234. Gyllensten U
    235. Hamsten A
    236. Harris TB
    237. Hengstenberg C
    238. Hicks AA
    239. Hingorani A
    240. Hinney A
    241. Hofman A
    242. Hovingh KG
    243. Hveem K
    244. Illig T
    245. Jarvelin M-R
    246. Jöckel K-H
    247. Keinanen-Kiukaanniemi SM
    248. Kiemeney LA
    249. Kuh D
    250. Laakso M
    251. Lehtimäki T
    252. Levinson DF
    253. Martin NG
    254. Metspalu A
    255. Morris AD
    256. Nieminen MS
    257. Njølstad I
    258. Ohlsson C
    259. Oldehinkel AJ
    260. Ouwehand WH
    261. Palmer LJ
    262. Penninx B
    263. Power C
    264. Province MA
    265. Psaty BM
    266. Qi L
    267. Rauramaa R
    268. Ridker PM
    269. Ripatti S
    270. Salomaa V
    271. Samani NJ
    272. Snieder H
    273. Sørensen TIA
    274. Spector TD
    275. Stefansson K
    276. Tönjes A
    277. Tuomilehto J
    278. Uitterlinden AG
    279. Uusitupa M
    280. van der Harst P
    281. Vollenweider P
    282. Wallaschofski H
    283. Wareham NJ
    284. Watkins H
    285. Wichmann H-E
    286. Wilson JF
    287. Abecasis GR
    288. Assimes TL
    289. Barroso I
    290. Boehnke M
    291. Borecki IB
    292. Deloukas P
    293. Fox CS
    294. Frayling T
    295. Groop LC
    296. Haritunian T
    297. Heid IM
    298. Hunter D
    299. Kaplan RC
    300. Karpe F
    301. Moffatt MF
    302. Mohlke KL
    303. O’Connell JR
    304. Pawitan Y
    305. Schadt EE
    306. Schlessinger D
    307. Steinthorsdottir V
    308. Strachan DP
    309. Thorsteinsdottir U
    310. van Duijn CM
    311. Visscher PM
    312. Di Blasio AM
    313. Hirschhorn JN
    314. Lindgren CM
    315. Morris AP
    316. Meyre D
    317. Scherag A
    318. McCarthy MI
    319. Speliotes EK
    320. North KE
    321. Loos RJF
    322. Ingelsson E
    (2013) Genome-wide meta-analysis identifies 11 new loci for anthropometric traits and provides insights into genetic architecture
    Nature Genetics 45:501–512.
    https://doi.org/10.1038/ng.2606
    1. Boraska V
    2. Franklin CS
    3. Floyd JAB
    4. Thornton LM
    5. Huckins LM
    6. Southam L
    7. Rayner NW
    8. Tachmazidou I
    9. Klump KL
    10. Treasure J
    11. Lewis CM
    12. Schmidt U
    13. Tozzi F
    14. Kiezebrink K
    15. Hebebrand J
    16. Gorwood P
    17. Adan RAH
    18. Kas MJH
    19. Favaro A
    20. Santonastaso P
    21. Fernández-Aranda F
    22. Gratacos M
    23. Rybakowski F
    24. Dmitrzak-Weglarz M
    25. Kaprio J
    26. Keski-Rahkonen A
    27. Raevuori A
    28. Van Furth EF
    29. Slof-Op ’t Landt MCT
    30. Hudson JI
    31. Reichborn-Kjennerud T
    32. Knudsen GPS
    33. Monteleone P
    34. Kaplan AS
    35. Karwautz A
    36. Hakonarson H
    37. Berrettini WH
    38. Guo Y
    39. Li D
    40. Schork NJ
    41. Komaki G
    42. Ando T
    43. Inoko H
    44. Esko T
    45. Fischer K
    46. Männik K
    47. Metspalu A
    48. Baker JH
    49. Cone RD
    50. Dackor J
    51. DeSocio JE
    52. Hilliard CE
    53. O’Toole JK
    54. Pantel J
    55. Szatkiewicz JP
    56. Taico C
    57. Zerwas S
    58. Trace SE
    59. Davis OSP
    60. Helder S
    61. Bühren K
    62. Burghardt R
    63. de Zwaan M
    64. Egberts K
    65. Ehrlich S
    66. Herpertz-Dahlmann B
    67. Herzog W
    68. Imgart H
    69. Scherag A
    70. Scherag S
    71. Zipfel S
    72. Boni C
    73. Ramoz N
    74. Versini A
    75. Brandys MK
    76. Danner UN
    77. de Kovel C
    78. Hendriks J
    79. Koeleman BPC
    80. Ophoff RA
    81. Strengman E
    82. van Elburg AA
    83. Bruson A
    84. Clementi M
    85. Degortes D
    86. Forzan M
    87. Tenconi E
    88. Docampo E
    89. Escaramís G
    90. Jiménez-Murcia S
    91. Lissowska J
    92. Rajewski A
    93. Szeszenia-Dabrowska N
    94. Slopien A
    95. Hauser J
    96. Karhunen L
    97. Meulenbelt I
    98. Slagboom PE
    99. Tortorella A
    100. Maj M
    101. Dedoussis G
    102. Dikeos D
    103. Gonidakis F
    104. Tziouvas K
    105. Tsitsika A
    106. Papezova H
    107. Slachtova L
    108. Martaskova D
    109. Kennedy JL
    110. Levitan RD
    111. Yilmaz Z
    112. Huemer J
    113. Koubek D
    114. Merl E
    115. Wagner G
    116. Lichtenstein P
    117. Breen G
    118. Cohen-Woods S
    119. Farmer A
    120. McGuffin P
    121. Cichon S
    122. Giegling I
    123. Herms S
    124. Rujescu D
    125. Schreiber S
    126. Wichmann HE
    127. Dina C
    128. Sladek R
    129. Gambaro G
    130. Soranzo N
    131. Julia A
    132. Marsal S
    133. Rabionet R
    134. Gaborieau V
    135. Dick DM
    136. Palotie A
    137. Ripatti S
    138. Widén E
    139. Andreassen OA
    140. Espeseth T
    141. Lundervold A
    142. Reinvang I
    143. Steen VM
    144. Le Hellard S
    145. Mattingsdal M
    146. Ntalla I
    147. Bencko V
    148. Foretova L
    149. Janout V
    150. Navratilova M
    151. Gallinger S
    152. Pinto D
    153. Scherer SW
    154. Aschauer H
    155. Carlberg L
    156. Schosser A
    157. Alfredsson L
    158. Ding B
    159. Klareskog L
    160. Padyukov L
    161. Courtet P
    162. Guillaume S
    163. Jaussent I
    164. Finan C
    165. Kalsi G
    166. Roberts M
    167. Logan DW
    168. Peltonen L
    169. Ritchie GRS
    170. Barrett JC
    171. Wellcome Trust Case Control Consortium 3
    172. Estivill X
    173. Hinney A
    174. Sullivan PF
    175. Collier DA
    176. Zeggini E
    177. Bulik CM
    (2014) A genome-wide association study of anorexia nervosa
    Molecular Psychiatry 19:1085–1094.
    https://doi.org/10.1038/mp.2013.187
    1. Deloukas P
    2. Kanoni S
    3. Willenborg C
    4. Farrall M
    5. Assimes TL
    6. Thompson JR
    7. Ingelsson E
    8. Saleheen D
    9. Erdmann J
    10. Goldstein BA
    11. Stirrups K
    12. König IR
    13. Cazier J-B
    14. Johansson A
    15. Hall AS
    16. Lee J-Y
    17. Willer CJ
    18. Chambers JC
    19. Esko T
    20. Folkersen L
    21. Goel A
    22. Grundberg E
    23. Havulinna AS
    24. Ho WK
    25. Hopewell JC
    26. Eriksson N
    27. Kleber ME
    28. Kristiansson K
    29. Lundmark P
    30. Lyytikäinen L-P
    31. Rafelt S
    32. Shungin D
    33. Strawbridge RJ
    34. Thorleifsson G
    35. Tikkanen E
    36. Van Zuydam N
    37. Voight BF
    38. Waite LL
    39. Zhang W
    40. Ziegler A
    41. Absher D
    42. Altshuler D
    43. Balmforth AJ
    44. Barroso I
    45. Braund PS
    46. Burgdorf C
    47. Claudi-Boehm S
    48. Cox D
    49. Dimitriou M
    50. Do R
    51. Doney ASF
    52. El Mokhtari N
    53. Eriksson P
    54. Fischer K
    55. Fontanillas P
    56. Franco-Cereceda A
    57. Gigante B
    58. Groop L
    59. Gustafsson S
    60. Hager J
    61. Hallmans G
    62. Han B-G
    63. Hunt SE
    64. Kang HM
    65. Illig T
    66. Kessler T
    67. Knowles JW
    68. Kolovou G
    69. Kuusisto J
    70. Langenberg C
    71. Langford C
    72. Leander K
    73. Lokki M-L
    74. Lundmark A
    75. McCarthy MI
    76. Meisinger C
    77. Melander O
    78. Mihailov E
    79. Maouche S
    80. Morris AD
    81. Müller-Nurasyid M
    82. Nikus K
    83. Peden JF
    84. Rayner NW
    85. Rasheed A
    86. Rosinger S
    87. Rubin D
    88. Rumpf MP
    89. Schäfer A
    90. Sivananthan M
    91. Song C
    92. Stewart AFR
    93. Tan S-T
    94. Thorgeirsson G
    95. van der Schoot CE
    96. Wagner PJ
    97. Wells GA
    98. Wild PS
    99. Yang T-P
    100. Amouyel P
    101. Arveiler D
    102. Basart H
    103. Boehnke M
    104. Boerwinkle E
    105. Brambilla P
    106. Cambien F
    107. Cupples AL
    108. de Faire U
    109. Dehghan A
    110. Diemert P
    111. Epstein SE
    112. Evans A
    113. Ferrario MM
    114. Ferrières J
    115. Gauguier D
    116. Go AS
    117. Goodall AH
    118. Gudnason V
    119. Hazen SL
    120. Holm H
    121. Iribarren C
    122. Jang Y
    123. Kähönen M
    124. Kee F
    125. Kim H-S
    126. Klopp N
    127. Koenig W
    128. Kratzer W
    129. Kuulasmaa K
    130. Laakso M
    131. Laaksonen R
    132. Lee J-Y
    133. Lind L
    134. Ouwehand WH
    135. Parish S
    136. Park JE
    137. Pedersen NL
    138. Peters A
    139. Quertermous T
    140. Rader DJ
    141. Salomaa V
    142. Schadt E
    143. Shah SH
    144. Sinisalo J
    145. Stark K
    146. Stefansson K
    147. Trégouët D-A
    148. Virtamo J
    149. Wallentin L
    150. Wareham N
    151. Zimmermann ME
    152. Nieminen MS
    153. Hengstenberg C
    154. Sandhu MS
    155. Pastinen T
    156. Syvänen A-C
    157. Hovingh GK
    158. Dedoussis G
    159. Franks PW
    160. Lehtimäki T
    161. Metspalu A
    162. Zalloua PA
    163. Siegbahn A
    164. Schreiber S
    165. Ripatti S
    166. Blankenberg SS
    167. Perola M
    168. Clarke R
    169. Boehm BO
    170. O’Donnell C
    171. Reilly MP
    172. März W
    173. Collins R
    174. Kathiresan S
    175. Hamsten A
    176. Kooner JS
    177. Thorsteinsdottir U
    178. Danesh J
    179. Palmer CNA
    180. Roberts R
    181. Watkins H
    182. Schunkert H
    183. Samani NJ
    184. CARDIoGRAMplusC4D Consortium
    185. DIAGRAM Consortium
    186. CARDIOGENICS Consortium
    187. MuTHER Consortium
    188. Wellcome Trust Case Control Consortium
    (2013) Large-scale association analysis identifies new risk loci for coronary artery disease
    Nature Genetics 45:25–33.
    https://doi.org/10.1038/ng.2480
    1. den Hoed M
    2. Eijgelsheim M
    3. Esko T
    4. Brundel BJJM
    5. Peal DS
    6. Evans DM
    7. Nolte IM
    8. Segrè AV
    9. Holm H
    10. Handsaker RE
    11. Westra H-J
    12. Johnson T
    13. Isaacs A
    14. Yang J
    15. Lundby A
    16. Zhao JH
    17. Kim YJ
    18. Go MJ
    19. Almgren P
    20. Bochud M
    21. Boucher G
    22. Cornelis MC
    23. Gudbjartsson D
    24. Hadley D
    25. van der Harst P
    26. Hayward C
    27. den Heijer M
    28. Igl W
    29. Jackson AU
    30. Kutalik Z
    31. Luan J
    32. Kemp JP
    33. Kristiansson K
    34. Ladenvall C
    35. Lorentzon M
    36. Montasser ME
    37. Njajou OT
    38. O’Reilly PF
    39. Padmanabhan S
    40. St Pourcain B
    41. Rankinen T
    42. Salo P
    43. Tanaka T
    44. Timpson NJ
    45. Vitart V
    46. Waite L
    47. Wheeler W
    48. Zhang W
    49. Draisma HHM
    50. Feitosa MF
    51. Kerr KF
    52. Lind PA
    53. Mihailov E
    54. Onland-Moret NC
    55. Song C
    56. Weedon MN
    57. Xie W
    58. Yengo L
    59. Absher D
    60. Albert CM
    61. Alonso A
    62. Arking DE
    63. de Bakker PIW
    64. Balkau B
    65. Barlassina C
    66. Benaglio P
    67. Bis JC
    68. Bouatia-Naji N
    69. Brage S
    70. Chanock SJ
    71. Chines PS
    72. Chung M
    73. Darbar D
    74. Dina C
    75. Dörr M
    76. Elliott P
    77. Felix SB
    78. Fischer K
    79. Fuchsberger C
    80. de Geus EJC
    81. Goyette P
    82. Gudnason V
    83. Harris TB
    84. Hartikainen A-L
    85. Havulinna AS
    86. Heckbert SR
    87. Hicks AA
    88. Hofman A
    89. Holewijn S
    90. Hoogstra-Berends F
    91. Hottenga J-J
    92. Jensen MK
    93. Johansson A
    94. Junttila J
    95. Kääb S
    96. Kanon B
    97. Ketkar S
    98. Khaw K-T
    99. Knowles JW
    100. Kooner AS
    101. Kors JA
    102. Kumari M
    103. Milani L
    104. Laiho P
    105. Lakatta EG
    106. Langenberg C
    107. Leusink M
    108. Liu Y
    109. Luben RN
    110. Lunetta KL
    111. Lynch SN
    112. Markus MRP
    113. Marques-Vidal P
    114. Mateo Leach I
    115. McArdle WL
    116. McCarroll SA
    117. Medland SE
    118. Miller KA
    119. Montgomery GW
    120. Morrison AC
    121. Müller-Nurasyid M
    122. Navarro P
    123. Nelis M
    124. O’Connell JR
    125. O’Donnell CJ
    126. Ong KK
    127. Newman AB
    128. Peters A
    129. Polasek O
    130. Pouta A
    131. Pramstaller PP
    132. Psaty BM
    133. Rao DC
    134. Ring SM
    135. Rossin EJ
    136. Rudan D
    137. Sanna S
    138. Scott RA
    139. Sehmi JS
    140. Sharp S
    141. Shin JT
    142. Singleton AB
    143. Smith AV
    144. Soranzo N
    145. Spector TD
    146. Stewart C
    147. Stringham HM
    148. Tarasov KV
    149. Uitterlinden AG
    150. Vandenput L
    151. Hwang S-J
    152. Whitfield JB
    153. Wijmenga C
    154. Wild SH
    155. Willemsen G
    156. Wilson JF
    157. Witteman JCM
    158. Wong A
    159. Wong Q
    160. Jamshidi Y
    161. Zitting P
    162. Boer JMA
    163. Boomsma DI
    164. Borecki IB
    165. van Duijn CM
    166. Ekelund U
    167. Forouhi NG
    168. Froguel P
    169. Hingorani A
    170. Ingelsson E
    171. Kivimaki M
    172. Kronmal RA
    173. Kuh D
    174. Lind L
    175. Martin NG
    176. Oostra BA
    177. Pedersen NL
    178. Quertermous T
    179. Rotter JI
    180. van der Schouw YT
    181. Verschuren WMM
    182. Walker M
    183. Albanes D
    184. Arnar DO
    185. Assimes TL
    186. Bandinelli S
    187. Boehnke M
    188. de Boer RA
    189. Bouchard C
    190. Caulfield WLM
    191. Chambers JC
    192. Curhan G
    193. Cusi D
    194. Eriksson J
    195. Ferrucci L
    196. van Gilst WH
    197. Glorioso N
    198. de Graaf J
    199. Groop L
    200. Gyllensten U
    201. Hsueh W-C
    202. Hu FB
    203. Huikuri HV
    204. Hunter DJ
    205. Iribarren C
    206. Isomaa B
    207. Jarvelin M-R
    208. Jula A
    209. Kähönen M
    210. Kiemeney LA
    211. van der Klauw MM
    212. Kooner JS
    213. Kraft P
    214. Iacoviello L
    215. Lehtimäki T
    216. Lokki M-LL
    217. Mitchell BD
    218. Navis G
    219. Nieminen MS
    220. Ohlsson C
    221. Poulter NR
    222. Qi L
    223. Raitakari OT
    224. Rimm EB
    225. Rioux JD
    226. Rizzi F
    227. Rudan I
    228. Salomaa V
    229. Sever PS
    230. Shields DC
    231. Shuldiner AR
    232. Sinisalo J
    233. Stanton AV
    234. Stolk RP
    235. Strachan DP
    236. Tardif J-C
    237. Thorsteinsdottir U
    238. Tuomilehto J
    239. van Veldhuisen DJ
    240. Virtamo J
    241. Viikari J
    242. Vollenweider P
    243. Waeber G
    244. Widen E
    245. Cho YS
    246. Olsen JV
    247. Visscher PM
    248. Willer C
    249. Franke L
    250. Global BPgen Consortium
    251. CARDIoGRAM Consortium
    252. Erdmann J
    253. Thompson JR
    254. PR GWAS Consortium
    255. Pfeufer A
    256. QRS GWAS Consortium
    257. Sotoodehnia N
    258. QT-IGC Consortium
    259. Newton-Cheh C
    260. CHARGE-AF Consortium
    261. Ellinor PT
    262. Stricker BHC
    263. Metspalu A
    264. Perola M
    265. Beckmann JS
    266. Smith GD
    267. Stefansson K
    268. Wareham NJ
    269. Munroe PB
    270. Sibon OCM
    271. Milan DJ
    272. Snieder H
    273. Samani NJ
    274. Loos RJF
    (2013) Identification of heart rate-associated loci and their effects on cardiac conduction and rhythm disorders
    Nature Genetics 45:621–631.
    https://doi.org/10.1038/ng.2610
  1. Software
    1. Home
    (2022) ADA
    Diabetes.
  2. Website
    1. IDF Diabetes Atlas
    (2022) IDF Diabetes Atlas
    Accessed January 22, 2022.
  3. Book
    1. Ke G
    2. Meng Q
    3. Finley T
    4. Wang T
    5. Chen W
    6. Ma W
    7. Ye Q
    8. Liu TY
    (2017)
    A Highly Efficient Gradient Boosting Decision Tree
    LightGBM.
    1. Kilpeläinen TO
    2. Carli JFM
    3. Skowronski AA
    4. Sun Q
    5. Kriebel J
    6. Feitosa MF
    7. Hedman ÅK
    8. Drong AW
    9. Hayes JE
    10. Zhao J
    11. Pers TH
    12. Schick U
    13. Grarup N
    14. Kutalik Z
    15. Trompet S
    16. Mangino M
    17. Kristiansson K
    18. Beekman M
    19. Lyytikäinen L-P
    20. Eriksson J
    21. Henneman P
    22. Lahti J
    23. Tanaka T
    24. Luan J
    25. Greco M FD
    26. Pasko D
    27. Renström F
    28. Willems SM
    29. Mahajan A
    30. Rose LM
    31. Guo X
    32. Liu Y
    33. Kleber ME
    34. Pérusse L
    35. Gaunt T
    36. Ahluwalia TS
    37. Ju Sung Y
    38. Ramos YF
    39. Amin N
    40. Amuzu A
    41. Barroso I
    42. Bellis C
    43. Blangero J
    44. Buckley BM
    45. Böhringer S
    46. I Chen Y-D
    47. de Craen AJN
    48. Crosslin DR
    49. Dale CE
    50. Dastani Z
    51. Day FR
    52. Deelen J
    53. Delgado GE
    54. Demirkan A
    55. Finucane FM
    56. Ford I
    57. Garcia ME
    58. Gieger C
    59. Gustafsson S
    60. Hallmans G
    61. Hankinson SE
    62. Havulinna AS
    63. Herder C
    64. Hernandez D
    65. Hicks AA
    66. Hunter DJ
    67. Illig T
    68. Ingelsson E
    69. Ioan-Facsinay A
    70. Jansson J-O
    71. Jenny NS
    72. Jørgensen ME
    73. Jørgensen T
    74. Karlsson M
    75. Koenig W
    76. Kraft P
    77. Kwekkeboom J
    78. Laatikainen T
    79. Ladwig K-H
    80. LeDuc CA
    81. Lowe G
    82. Lu Y
    83. Marques-Vidal P
    84. Meisinger C
    85. Menni C
    86. Morris AP
    87. Myers RH
    88. Männistö S
    89. Nalls MA
    90. Paternoster L
    91. Peters A
    92. Pradhan AD
    93. Rankinen T
    94. Rasmussen-Torvik LJ
    95. Rathmann W
    96. Rice TK
    97. Brent Richards J
    98. Ridker PM
    99. Sattar N
    100. Savage DB
    101. Söderberg S
    102. Timpson NJ
    103. Vandenput L
    104. van Heemst D
    105. Uh H-W
    106. Vohl M-C
    107. Walker M
    108. Wichmann H-E
    109. Widén E
    110. Wood AR
    111. Yao J
    112. Zeller T
    113. Zhang Y
    114. Meulenbelt I
    115. Kloppenburg M
    116. Astrup A
    117. Sørensen TIA
    118. Sarzynski MA
    119. Rao DC
    120. Jousilahti P
    121. Vartiainen E
    122. Hofman A
    123. Rivadeneira F
    124. Uitterlinden AG
    125. Kajantie E
    126. Osmond C
    127. Palotie A
    128. Eriksson JG
    129. Heliövaara M
    130. Knekt PB
    131. Koskinen S
    132. Jula A
    133. Perola M
    134. Huupponen RK
    135. Viikari JS
    136. Kähönen M
    137. Lehtimäki T
    138. Raitakari OT
    139. Mellström D
    140. Lorentzon M
    141. Casas JP
    142. Bandinelli S
    143. März W
    144. Isaacs A
    145. van Dijk KW
    146. van Duijn CM
    147. Harris TB
    148. Bouchard C
    149. Allison MA
    150. Chasman DI
    151. Ohlsson C
    152. Lind L
    153. Scott RA
    154. Langenberg C
    155. Wareham NJ
    156. Ferrucci L
    157. Frayling TM
    158. Pramstaller PP
    159. Borecki IB
    160. Waterworth DM
    161. Bergmann S
    162. Waeber G
    163. Vollenweider P
    164. Vestergaard H
    165. Hansen T
    166. Pedersen O
    167. Hu FB
    168. Eline Slagboom P
    169. Grallert H
    170. Spector TD
    171. Jukema JW
    172. Klein RJ
    173. Schadt EE
    174. Franks PW
    175. Lindgren CM
    176. Leibel RL
    177. Loos RJF
    (2016) Genome-wide meta-analysis uncovers novel loci influencing circulating leptin levels
    Nature Communications 7:.
    https://doi.org/10.1038/ncomms10494
    1. Lambert JC
    2. Ibrahim-Verbaas CA
    3. Harold D
    4. Naj AC
    5. Sims R
    6. Bellenguez C
    7. DeStafano AL
    8. Bis JC
    9. Beecham GW
    10. Grenier-Boley B
    11. Russo G
    12. Thorton-Wells TA
    13. Jones N
    14. Smith AV
    15. Chouraki V
    16. Thomas C
    17. Ikram MA
    18. Zelenika D
    19. Vardarajan BN
    20. Kamatani Y
    21. Lin CF
    22. Gerrish A
    23. Schmidt H
    24. Kunkle B
    25. Dunstan ML
    26. Ruiz A
    27. Bihoreau MT
    28. Choi SH
    29. Reitz C
    30. Pasquier F
    31. Cruchaga C
    32. Craig D
    33. Amin N
    34. Berr C
    35. Lopez OL
    36. De Jager PL
    37. Deramecourt V
    38. Johnston JA
    39. Evans D
    40. Lovestone S
    41. Letenneur L
    42. Morón FJ
    43. Rubinsztein DC
    44. Eiriksdottir G
    45. Sleegers K
    46. Goate AM
    47. Fiévet N
    48. Huentelman MW
    49. Gill M
    50. Brown K
    51. Kamboh MI
    52. Keller L
    53. Barberger-Gateau P
    54. McGuiness B
    55. Larson EB
    56. Green R
    57. Myers AJ
    58. Dufouil C
    59. Todd S
    60. Wallon D
    61. Love S
    62. Rogaeva E
    63. Gallacher J
    64. St George-Hyslop P
    65. Clarimon J
    66. Lleo A
    67. Bayer A
    68. Tsuang DW
    69. Yu L
    70. Tsolaki M
    71. Bossù P
    72. Spalletta G
    73. Proitsi P
    74. Collinge J
    75. Sorbi S
    76. Sanchez-Garcia F
    77. Fox NC
    78. Hardy J
    79. Deniz Naranjo MC
    80. Bosco P
    81. Clarke R
    82. Brayne C
    83. Galimberti D
    84. Mancuso M
    85. Matthews F
    86. Cohorts for Heart and Aging Research in Genomic Epidemiology
    87. Moebus S
    88. Mecocci P
    89. Del Zompo M
    90. Maier W
    91. Hampel H
    92. Pilotto A
    93. Bullido M
    94. Panza F
    95. Caffarra P
    96. Nacmias B
    97. Gilbert JR
    98. Mayhaus M
    99. Lannefelt L
    100. Hakonarson H
    101. Pichler S
    102. Carrasquillo MM
    103. Ingelsson M
    104. Beekly D
    105. Alvarez V
    106. Zou F
    107. Valladares O
    108. Younkin SG
    109. Coto E
    110. Hamilton-Nelson KL
    111. Gu W
    112. Razquin C
    113. Pastor P
    114. Mateo I
    115. Owen MJ
    116. Faber KM
    117. Jonsson PV
    118. Combarros O
    119. O’Donovan MC
    120. Cantwell LB
    121. Soininen H
    122. Blacker D
    123. Mead S
    124. Mosley TH
    125. Bennett DA
    126. Harris TB
    127. Fratiglioni L
    128. Holmes C
    129. de Bruijn RF
    130. Passmore P
    131. Montine TJ
    132. Bettens K
    133. Rotter JI
    134. Brice A
    135. Morgan K
    136. Foroud TM
    137. Kukull WA
    138. Hannequin D
    139. Powell JF
    140. Nalls MA
    141. Ritchie K
    142. Lunetta KL
    143. Kauwe JS
    144. Boerwinkle E
    145. Riemenschneider M
    146. Boada M
    147. Hiltuenen M
    148. Martin ER
    149. Schmidt R
    150. Rujescu D
    151. Wang LS
    152. Dartigues JF
    153. Mayeux R
    154. Tzourio C
    155. Hofman A
    156. Nöthen MM
    157. Graff C
    158. Psaty BM
    159. Jones L
    160. Haines JL
    161. Holmans PA
    162. Lathrop M
    163. Pericak-Vance MA
    164. Launer LJ
    165. Farrer LA
    166. van Duijn CM
    167. Van Broeckhoven C
    168. Moskvina V
    169. Seshadri S
    170. Williams J
    171. Schellenberg GD
    172. Amouyel P
    (2013) Meta-analysis of 74,046 individuals identifies 11 new susceptibility loci for Alzheimer’s disease
    Nature Genetics 45:1452–1458.
    https://doi.org/10.1038/ng.2802
    1. Locke AE
    2. Kahali B
    3. Berndt SI
    4. Justice AE
    5. Pers TH
    6. Day FR
    7. Powell C
    8. Vedantam S
    9. Buchkovich ML
    10. Yang J
    11. Croteau-Chonka DC
    12. Esko T
    13. Fall T
    14. Ferreira T
    15. Gustafsson S
    16. Kutalik Z
    17. Luan J
    18. Mägi R
    19. Randall JC
    20. Winkler TW
    21. Wood AR
    22. Workalemahu T
    23. Faul JD
    24. Smith JA
    25. Zhao JH
    26. Zhao W
    27. Chen J
    28. Fehrmann R
    29. Hedman ÅK
    30. Karjalainen J
    31. Schmidt EM
    32. Absher D
    33. Amin N
    34. Anderson D
    35. Beekman M
    36. Bolton JL
    37. Bragg-Gresham JL
    38. Buyske S
    39. Demirkan A
    40. Deng G
    41. Ehret GB
    42. Feenstra B
    43. Feitosa MF
    44. Fischer K
    45. Goel A
    46. Gong J
    47. Jackson AU
    48. Kanoni S
    49. Kleber ME
    50. Kristiansson K
    51. Lim U
    52. Lotay V
    53. Mangino M
    54. Leach IM
    55. Medina-Gomez C
    56. Medland SE
    57. Nalls MA
    58. Palmer CD
    59. Pasko D
    60. Pechlivanis S
    61. Peters MJ
    62. Prokopenko I
    63. Shungin D
    64. Stančáková A
    65. Strawbridge RJ
    66. Sung YJ
    67. Tanaka T
    68. Teumer A
    69. Trompet S
    70. van der Laan SW
    71. van Setten J
    72. Van Vliet-Ostaptchouk JV
    73. Wang Z
    74. Yengo L
    75. Zhang W
    76. Isaacs A
    77. Albrecht E
    78. Ärnlöv J
    79. Arscott GM
    80. Attwood AP
    81. Bandinelli S
    82. Barrett A
    83. Bas IN
    84. Bellis C
    85. Bennett AJ
    86. Berne C
    87. Blagieva R
    88. Blüher M
    89. Böhringer S
    90. Bonnycastle LL
    91. Böttcher Y
    92. Boyd HA
    93. Bruinenberg M
    94. Caspersen IH
    95. Chen Y-DI
    96. Clarke R
    97. Daw EW
    98. de Craen AJM
    99. Delgado G
    100. Dimitriou M
    101. Doney ASF
    102. Eklund N
    103. Estrada K
    104. Eury E
    105. Folkersen L
    106. Fraser RM
    107. Garcia ME
    108. Geller F
    109. Giedraitis V
    110. Gigante B
    111. Go AS
    112. Golay A
    113. Goodall AH
    114. Gordon SD
    115. Gorski M
    116. Grabe H-J
    117. Grallert H
    118. Grammer TB
    119. Gräßler J
    120. Grönberg H
    121. Groves CJ
    122. Gusto G
    123. Haessler J
    124. Hall P
    125. Haller T
    126. Hallmans G
    127. Hartman CA
    128. Hassinen M
    129. Hayward C
    130. Heard-Costa NL
    131. Helmer Q
    132. Hengstenberg C
    133. Holmen O
    134. Hottenga J-J
    135. James AL
    136. Jeff JM
    137. Johansson Å
    138. Jolley J
    139. Juliusdottir T
    140. Kinnunen L
    141. Koenig W
    142. Koskenvuo M
    143. Kratzer W
    144. Laitinen J
    145. Lamina C
    146. Leander K
    147. Lee NR
    148. Lichtner P
    149. Lind L
    150. Lindström J
    151. Lo KS
    152. Lobbens S
    153. Lorbeer R
    154. Lu Y
    155. Mach F
    156. Magnusson PKE
    157. Mahajan A
    158. McArdle WL
    159. McLachlan S
    160. Menni C
    161. Merger S
    162. Mihailov E
    163. Milani L
    164. Moayyeri A
    165. Monda KL
    166. Morken MA
    167. Mulas A
    168. Müller G
    169. Müller-Nurasyid M
    170. Musk AW
    171. Nagaraja R
    172. Nöthen MM
    173. Nolte IM
    174. Pilz S
    175. Rayner NW
    176. Renstrom F
    177. Rettig R
    178. Ried JS
    179. Ripke S
    180. Robertson NR
    181. Rose LM
    182. Sanna S
    183. Scharnagl H
    184. Scholtens S
    185. Schumacher FR
    186. Scott WR
    187. Seufferlein T
    188. Shi J
    189. Smith AV
    190. Smolonska J
    191. Stanton AV
    192. Steinthorsdottir V
    193. Stirrups K
    194. Stringham HM
    195. Sundström J
    196. Swertz MA
    197. Swift AJ
    198. Syvänen A-C
    199. Tan S-T
    200. Tayo BO
    201. Thorand B
    202. Thorleifsson G
    203. Tyrer JP
    204. Uh H-W
    205. Vandenput L
    206. Verhulst FC
    207. Vermeulen SH
    208. Verweij N
    209. Vonk JM
    210. Waite LL
    211. Warren HR
    212. Waterworth D
    213. Weedon MN
    214. Wilkens LR
    215. Willenborg C
    216. Wilsgaard T
    217. Wojczynski MK
    218. Wong A
    219. Wright AF
    220. Zhang Q
    221. LifeLines Cohort Study
    222. Brennan EP
    223. Choi M
    224. Dastani Z
    225. Drong AW
    226. Eriksson P
    227. Franco-Cereceda A
    228. Gådin JR
    229. Gharavi AG
    230. Goddard ME
    231. Handsaker RE
    232. Huang J
    233. Karpe F
    234. Kathiresan S
    235. Keildson S
    236. Kiryluk K
    237. Kubo M
    238. Lee J-Y
    239. Liang L
    240. Lifton RP
    241. Ma B
    242. McCarroll SA
    243. McKnight AJ
    244. Min JL
    245. Moffatt MF
    246. Montgomery GW
    247. Murabito JM
    248. Nicholson G
    249. Nyholt DR
    250. Okada Y
    251. Perry JRB
    252. Dorajoo R
    253. Reinmaa E
    254. Salem RM
    255. Sandholm N
    256. Scott RA
    257. Stolk L
    258. Takahashi A
    259. Tanaka T
    260. van ’t Hooft FM
    261. Vinkhuyzen AAE
    262. Westra H-J
    263. Zheng W
    264. Zondervan KT
    265. ADIPOGen Consortium
    266. AGEN-BMI Working Group
    267. CARDIOGRAMplusC4D Consortium
    268. CKDGen Consortium
    269. GLGC
    270. ICBP
    271. MAGIC Investigators
    272. MuTHER Consortium
    273. MIGen Consortium
    274. PAGE Consortium
    275. ReproGen Consortium
    276. GENIE Consortium
    277. International Endogene Consortium
    278. Heath AC
    279. Arveiler D
    280. Bakker SJL
    281. Beilby J
    282. Bergman RN
    283. Blangero J
    284. Bovet P
    285. Campbell H
    286. Caulfield MJ
    287. Cesana G
    288. Chakravarti A
    289. Chasman DI
    290. Chines PS
    291. Collins FS
    292. Crawford DC
    293. Cupples LA
    294. Cusi D
    295. Danesh J
    296. de Faire U
    297. den Ruijter HM
    298. Dominiczak AF
    299. Erbel R
    300. Erdmann J
    301. Eriksson JG
    302. Farrall M
    303. Felix SB
    304. Ferrannini E
    305. Ferrières J
    306. Ford I
    307. Forouhi NG
    308. Forrester T
    309. Franco OH
    310. Gansevoort RT
    311. Gejman PV
    312. Gieger C
    313. Gottesman O
    314. Gudnason V
    315. Gyllensten U
    316. Hall AS
    317. Harris TB
    318. Hattersley AT
    319. Hicks AA
    320. Hindorff LA
    321. Hingorani AD
    322. Hofman A
    323. Homuth G
    324. Hovingh GK
    325. Humphries SE
    326. Hunt SC
    327. Hyppönen E
    328. Illig T
    329. Jacobs KB
    330. Jarvelin M-R
    331. Jöckel K-H
    332. Johansen B
    333. Jousilahti P
    334. Jukema JW
    335. Jula AM
    336. Kaprio J
    337. Kastelein JJP
    338. Keinanen-Kiukaanniemi SM
    339. Kiemeney LA
    340. Knekt P
    341. Kooner JS
    342. Kooperberg C
    343. Kovacs P
    344. Kraja AT
    345. Kumari M
    346. Kuusisto J
    347. Lakka TA
    348. Langenberg C
    349. Marchand LL
    350. Lehtimäki T
    351. Lyssenko V
    352. Männistö S
    353. Marette A
    354. Matise TC
    355. McKenzie CA
    356. McKnight B
    357. Moll FL
    358. Morris AD
    359. Morris AP
    360. Murray JC
    361. Nelis M
    362. Ohlsson C
    363. Oldehinkel AJ
    364. Ong KK
    365. Madden PAF
    366. Pasterkamp G
    367. Peden JF
    368. Peters A
    369. Postma DS
    370. Pramstaller PP
    371. Price JF
    372. Qi L
    373. Raitakari OT
    374. Rankinen T
    375. Rao DC
    376. Rice TK
    377. Ridker PM
    378. Rioux JD
    379. Ritchie MD
    380. Rudan I
    381. Salomaa V
    382. Samani NJ
    383. Saramies J
    384. Sarzynski MA
    385. Schunkert H
    386. Schwarz PEH
    387. Sever P
    388. Shuldiner AR
    389. Sinisalo J
    390. Stolk RP
    391. Strauch K
    392. Tönjes A
    393. Trégouët D-A
    394. Tremblay A
    395. Tremoli E
    396. Virtamo J
    397. Vohl M-C
    398. Völker U
    399. Waeber G
    400. Willemsen G
    401. Witteman JC
    402. Zillikens MC
    403. Adair LS
    404. Amouyel P
    405. Asselbergs FW
    406. Assimes TL
    407. Bochud M
    408. Boehm BO
    409. Boerwinkle E
    410. Bornstein SR
    411. Bottinger EP
    412. Bouchard C
    413. Cauchi S
    414. Chambers JC
    415. Chanock SJ
    416. Cooper RS
    417. de Bakker PIW
    418. Dedoussis G
    419. Ferrucci L
    420. Franks PW
    421. Froguel P
    422. Groop LC
    423. Haiman CA
    424. Hamsten A
    425. Hui J
    426. Hunter DJ
    427. Hveem K
    428. Kaplan RC
    429. Kivimaki M
    430. Kuh D
    431. Laakso M
    432. Liu Y
    433. Martin NG
    434. März W
    435. Melbye M
    436. Metspalu A
    437. Moebus S
    438. Munroe PB
    439. Njølstad I
    440. Oostra BA
    441. Palmer CNA
    442. Pedersen NL
    443. Perola M
    444. Pérusse L
    445. Peters U
    446. Power C
    447. Quertermous T
    448. Rauramaa R
    449. Rivadeneira F
    450. Saaristo TE
    451. Saleheen D
    452. Sattar N
    453. Schadt EE
    454. Schlessinger D
    455. Slagboom PE
    456. Snieder H
    457. Spector TD
    458. Thorsteinsdottir U
    459. Stumvoll M
    460. Tuomilehto J
    461. Uitterlinden AG
    462. Uusitupa M
    463. van der Harst P
    464. Walker M
    465. Wallaschofski H
    466. Wareham NJ
    467. Watkins H
    468. Weir DR
    469. Wichmann H-E
    470. Wilson JF
    471. Zanen P
    472. Borecki IB
    473. Deloukas P
    474. Fox CS
    475. Heid IM
    476. O’Connell JR
    477. Strachan DP
    478. Stefansson K
    479. van Duijn CM
    480. Abecasis GR
    481. Franke L
    482. Frayling TM
    483. McCarthy MI
    484. Visscher PM
    485. Scherag A
    486. Willer CJ
    487. Boehnke M
    488. Mohlke KL
    489. Lindgren CM
    490. Beckmann JS
    491. Barroso I
    492. North KE
    493. Ingelsson E
    494. Hirschhorn JN
    495. Loos RJF
    496. Speliotes EK
    (2015) Genetic studies of body mass index yield new insights for obesity biology
    Nature 518:197–206.
    https://doi.org/10.1038/nature14177
    1. Manning AK
    2. Hivert M-F
    3. Scott RA
    4. Grimsby JL
    5. Bouatia-Naji N
    6. Chen H
    7. Rybin D
    8. Liu C-T
    9. Bielak LF
    10. Prokopenko I
    11. Amin N
    12. Barnes D
    13. Cadby G
    14. Hottenga J-J
    15. Ingelsson E
    16. Jackson AU
    17. Johnson T
    18. Kanoni S
    19. Ladenvall C
    20. Lagou V
    21. Lahti J
    22. Lecoeur C
    23. Liu Y
    24. Martinez-Larrad MT
    25. Montasser ME
    26. Navarro P
    27. Perry JRB
    28. Rasmussen-Torvik LJ
    29. Salo P
    30. Sattar N
    31. Shungin D
    32. Strawbridge RJ
    33. Tanaka T
    34. van Duijn CM
    35. An P
    36. de Andrade M
    37. Andrews JS
    38. Aspelund T
    39. Atalay M
    40. Aulchenko Y
    41. Balkau B
    42. Bandinelli S
    43. Beckmann JS
    44. Beilby JP
    45. Bellis C
    46. Bergman RN
    47. Blangero J
    48. Boban M
    49. Boehnke M
    50. Boerwinkle E
    51. Bonnycastle LL
    52. Boomsma DI
    53. Borecki IB
    54. Böttcher Y
    55. Bouchard C
    56. Brunner E
    57. Budimir D
    58. Campbell H
    59. Carlson O
    60. Chines PS
    61. Clarke R
    62. Collins FS
    63. Corbatón-Anchuelo A
    64. Couper D
    65. de Faire U
    66. Dedoussis GV
    67. Deloukas P
    68. Dimitriou M
    69. Egan JM
    70. Eiriksdottir G
    71. Erdos MR
    72. Eriksson JG
    73. Eury E
    74. Ferrucci L
    75. Ford I
    76. Forouhi NG
    77. Fox CS
    78. Franzosi MG
    79. Franks PW
    80. Frayling TM
    81. Froguel P
    82. Galan P
    83. de Geus E
    84. Gigante B
    85. Glazer NL
    86. Goel A
    87. Groop L
    88. Gudnason V
    89. Hallmans G
    90. Hamsten A
    91. Hansson O
    92. Harris TB
    93. Hayward C
    94. Heath S
    95. Hercberg S
    96. Hicks AA
    97. Hingorani A
    98. Hofman A
    99. Hui J
    100. Hung J
    101. Jarvelin M-R
    102. Jhun MA
    103. Johnson PCD
    104. Jukema JW
    105. Jula A
    106. Kao WH
    107. Kaprio J
    108. Kardia SLR
    109. Keinanen-Kiukaanniemi S
    110. Kivimaki M
    111. Kolcic I
    112. Kovacs P
    113. Kumari M
    114. Kuusisto J
    115. Kyvik KO
    116. Laakso M
    117. Lakka T
    118. Lannfelt L
    119. Lathrop GM
    120. Launer LJ
    121. Leander K
    122. Li G
    123. Lind L
    124. Lindstrom J
    125. Lobbens S
    126. Loos RJF
    127. Luan J
    128. Lyssenko V
    129. Mägi R
    130. Magnusson PKE
    131. Marmot M
    132. Meneton P
    133. Mohlke KL
    134. Mooser V
    135. Morken MA
    136. Miljkovic I
    137. Narisu N
    138. O’Connell J
    139. Ong KK
    140. Oostra BA
    141. Palmer LJ
    142. Palotie A
    143. Pankow JS
    144. Peden JF
    145. Pedersen NL
    146. Pehlic M
    147. Peltonen L
    148. Penninx B
    149. Pericic M
    150. Perola M
    151. Perusse L
    152. Peyser PA
    153. Polasek O
    154. Pramstaller PP
    155. Province MA
    156. Räikkönen K
    157. Rauramaa R
    158. Rehnberg E
    159. Rice K
    160. Rotter JI
    161. Rudan I
    162. Ruokonen A
    163. Saaristo T
    164. Sabater-Lleal M
    165. Salomaa V
    166. Savage DB
    167. Saxena R
    168. Schwarz P
    169. Seedorf U
    170. Sennblad B
    171. Serrano-Rios M
    172. Shuldiner AR
    173. Sijbrands EJG
    174. Siscovick DS
    175. Smit JH
    176. Small KS
    177. Smith NL
    178. Smith AV
    179. Stančáková A
    180. Stirrups K
    181. Stumvoll M
    182. Sun YV
    183. Swift AJ
    184. Tönjes A
    185. Tuomilehto J
    186. Trompet S
    187. Uitterlinden AG
    188. Uusitupa M
    189. Vikström M
    190. Vitart V
    191. Vohl M-C
    192. Voight BF
    193. Vollenweider P
    194. Waeber G
    195. Waterworth DM
    196. Watkins H
    197. Wheeler E
    198. Widen E
    199. Wild SH
    200. Willems SM
    201. Willemsen G
    202. Wilson JF
    203. Witteman JCM
    204. Wright AF
    205. Yaghootkar H
    206. Zelenika D
    207. Zemunik T
    208. Zgaga L
    209. Wareham NJ
    210. McCarthy MI
    211. Barroso I
    212. Watanabe RM
    213. Florez JC
    214. Dupuis J
    215. Meigs JB
    216. Langenberg C
    217. DIAbetes Genetics Replication And Meta-analysis (DIAGRAM) Consortium
    218. Multiple Tissue Human Expression Resource (MUTHER) Consortium
    (2012) A genome-wide approach accounting for body mass index identifies genetic variants influencing fasting glycemic traits and insulin resistance
    Nature Genetics 44:659–669.
    https://doi.org/10.1038/ng.2274
    1. Saxena R
    2. Hivert M-F
    3. Langenberg C
    4. Tanaka T
    5. Pankow JS
    6. Vollenweider P
    7. Lyssenko V
    8. Bouatia-Naji N
    9. Dupuis J
    10. Jackson AU
    11. Kao WHL
    12. Li M
    13. Glazer NL
    14. Manning AK
    15. Luan J
    16. Stringham HM
    17. Prokopenko I
    18. Johnson T
    19. Grarup N
    20. Boesgaard TW
    21. Lecoeur C
    22. Shrader P
    23. O’Connell J
    24. Ingelsson E
    25. Couper DJ
    26. Rice K
    27. Song K
    28. Andreasen CH
    29. Dina C
    30. Köttgen A
    31. Le Bacquer O
    32. Pattou F
    33. Taneera J
    34. Steinthorsdottir V
    35. Rybin D
    36. Ardlie K
    37. Sampson M
    38. Qi L
    39. van Hoek M
    40. Weedon MN
    41. Aulchenko YS
    42. Voight BF
    43. Grallert H
    44. Balkau B
    45. Bergman RN
    46. Bielinski SJ
    47. Bonnefond A
    48. Bonnycastle LL
    49. Borch-Johnsen K
    50. Böttcher Y
    51. Brunner E
    52. Buchanan TA
    53. Bumpstead SJ
    54. Cavalcanti-Proença C
    55. Charpentier G
    56. Chen Y-DI
    57. Chines PS
    58. Collins FS
    59. Cornelis M
    60. J Crawford G
    61. Delplanque J
    62. Doney A
    63. Egan JM
    64. Erdos MR
    65. Firmann M
    66. Forouhi NG
    67. Fox CS
    68. Goodarzi MO
    69. Graessler J
    70. Hingorani A
    71. Isomaa B
    72. Jørgensen T
    73. Kivimaki M
    74. Kovacs P
    75. Krohn K
    76. Kumari M
    77. Lauritzen T
    78. Lévy-Marchal C
    79. Mayor V
    80. McAteer JB
    81. Meyre D
    82. Mitchell BD
    83. Mohlke KL
    84. Morken MA
    85. Narisu N
    86. Palmer CNA
    87. Pakyz R
    88. Pascoe L
    89. Payne F
    90. Pearson D
    91. Rathmann W
    92. Sandbaek A
    93. Sayer AA
    94. Scott LJ
    95. Sharp SJ
    96. Sijbrands E
    97. Singleton A
    98. Siscovick DS
    99. Smith NL
    100. Sparsø T
    101. Swift AJ
    102. Syddall H
    103. Thorleifsson G
    104. Tönjes A
    105. Tuomi T
    106. Tuomilehto J
    107. Valle TT
    108. Waeber G
    109. Walley A
    110. Waterworth DM
    111. Zeggini E
    112. Zhao JH
    113. Illig T
    114. Wichmann HE
    115. Wilson JF
    116. van Duijn C
    117. Hu FB
    118. Morris AD
    119. Frayling TM
    120. Hattersley AT
    121. Thorsteinsdottir U
    122. Stefansson K
    123. Nilsson P
    124. Syvänen A-C
    125. Shuldiner AR
    126. Walker M
    127. Bornstein SR
    128. Schwarz P
    129. Williams GH
    130. Nathan DM
    131. Kuusisto J
    132. Laakso M
    133. Cooper C
    134. Marmot M
    135. Ferrucci L
    136. Mooser V
    137. Stumvoll M
    138. Loos RJF
    139. Altshuler D
    140. Psaty BM
    141. Rotter JI
    142. Boerwinkle E
    143. Hansen T
    144. Pedersen O
    145. Florez JC
    146. McCarthy MI
    147. Boehnke M
    148. Barroso I
    149. Sladek R
    150. Froguel P
    151. Meigs JB
    152. Groop L
    153. Wareham NJ
    154. Watanabe RM
    155. GIANT consortium
    156. MAGIC investigators
    (2010) Genetic variation in GIPR influences the glucose and insulin responses to an oral glucose challenge
    Nature Genetics 42:142–148.
    https://doi.org/10.1038/ng.521
    1. Scott RA
    2. Lagou V
    3. Welch RP
    4. Wheeler E
    5. Montasser ME
    6. Luan J
    7. Mägi R
    8. Strawbridge RJ
    9. Rehnberg E
    10. Gustafsson S
    11. Kanoni S
    12. Rasmussen-Torvik LJ
    13. Yengo L
    14. Lecoeur C
    15. Shungin D
    16. Sanna S
    17. Sidore C
    18. Johnson PCD
    19. Jukema JW
    20. Johnson T
    21. Mahajan A
    22. Verweij N
    23. Thorleifsson G
    24. Hottenga J-J
    25. Shah S
    26. Smith AV
    27. Sennblad B
    28. Gieger C
    29. Salo P
    30. Perola M
    31. Timpson NJ
    32. Evans DM
    33. Pourcain BS
    34. Wu Y
    35. Andrews JS
    36. Hui J
    37. Bielak LF
    38. Zhao W
    39. Horikoshi M
    40. Navarro P
    41. Isaacs A
    42. O’Connell JR
    43. Stirrups K
    44. Vitart V
    45. Hayward C
    46. Esko T
    47. Mihailov E
    48. Fraser RM
    49. Fall T
    50. Voight BF
    51. Raychaudhuri S
    52. Chen H
    53. Lindgren CM
    54. Morris AP
    55. Rayner NW
    56. Robertson N
    57. Rybin D
    58. Liu C-T
    59. Beckmann JS
    60. Willems SM
    61. Chines PS
    62. Jackson AU
    63. Kang HM
    64. Stringham HM
    65. Song K
    66. Tanaka T
    67. Peden JF
    68. Goel A
    69. Hicks AA
    70. An P
    71. Müller-Nurasyid M
    72. Franco-Cereceda A
    73. Folkersen L
    74. Marullo L
    75. Jansen H
    76. Oldehinkel AJ
    77. Bruinenberg M
    78. Pankow JS
    79. North KE
    80. Forouhi NG
    81. Loos RJF
    82. Edkins S
    83. Varga TV
    84. Hallmans G
    85. Oksa H
    86. Antonella M
    87. Nagaraja R
    88. Trompet S
    89. Ford I
    90. Bakker SJL
    91. Kong A
    92. Kumari M
    93. Gigante B
    94. Herder C
    95. Munroe PB
    96. Caulfield M
    97. Antti J
    98. Mangino M
    99. Small K
    100. Miljkovic I
    101. Liu Y
    102. Atalay M
    103. Kiess W
    104. James AL
    105. Rivadeneira F
    106. Uitterlinden AG
    107. Palmer CNA
    108. Doney ASF
    109. Willemsen G
    110. Smit JH
    111. Campbell S
    112. Polasek O
    113. Bonnycastle LL
    114. Hercberg S
    115. Dimitriou M
    116. Bolton JL
    117. Fowkes GR
    118. Kovacs P
    119. Lindström J
    120. Zemunik T
    121. Bandinelli S
    122. Wild SH
    123. Basart HV
    124. Rathmann W
    125. Grallert H
    126. DIAbetes Genetics Replication and Meta-analysis (DIAGRAM) Consortium
    127. Maerz W
    128. Kleber ME
    129. Boehm BO
    130. Peters A
    131. Pramstaller PP
    132. Province MA
    133. Borecki IB
    134. Hastie ND
    135. Rudan I
    136. Campbell H
    137. Watkins H
    138. Farrall M
    139. Stumvoll M
    140. Ferrucci L
    141. Waterworth DM
    142. Bergman RN
    143. Collins FS
    144. Tuomilehto J
    145. Watanabe RM
    146. de Geus EJC
    147. Penninx BW
    148. Hofman A
    149. Oostra BA
    150. Psaty BM
    151. Vollenweider P
    152. Wilson JF
    153. Wright AF
    154. Hovingh GK
    155. Metspalu A
    156. Uusitupa M
    157. Magnusson PKE
    158. Kyvik KO
    159. Kaprio J
    160. Price JF
    161. Dedoussis GV
    162. Deloukas P
    163. Meneton P
    164. Lind L
    165. Boehnke M
    166. Shuldiner AR
    167. van Duijn CM
    168. Morris AD
    169. Toenjes A
    170. Peyser PA
    171. Beilby JP
    172. Körner A
    173. Kuusisto J
    174. Laakso M
    175. Bornstein SR
    176. Schwarz PEH
    177. Lakka TA
    178. Rauramaa R
    179. Adair LS
    180. Smith GD
    181. Spector TD
    182. Illig T
    183. de Faire U
    184. Hamsten A
    185. Gudnason V
    186. Kivimaki M
    187. Hingorani A
    188. Keinanen-Kiukaanniemi SM
    189. Saaristo TE
    190. Boomsma DI
    191. Stefansson K
    192. van der Harst P
    193. Dupuis J
    194. Pedersen NL
    195. Sattar N
    196. Harris TB
    197. Cucca F
    198. Ripatti S
    199. Salomaa V
    200. Mohlke KL
    201. Balkau B
    202. Froguel P
    203. Pouta A
    204. Jarvelin M-R
    205. Wareham NJ
    206. Bouatia-Naji N
    207. McCarthy MI
    208. Franks PW
    209. Meigs JB
    210. Teslovich TM
    211. Florez JC
    212. Langenberg C
    213. Ingelsson E
    214. Prokopenko I
    215. Barroso I
    (2012) Large-scale association analyses identify new loci influencing glycemic traits and provide insight into the underlying biological pathways
    Nature Genetics 44:991–1005.
    https://doi.org/10.1038/ng.2385
    1. Shungin D
    2. Winkler TW
    3. Croteau-Chonka DC
    4. Ferreira T
    5. Locke AE
    6. Mägi R
    7. Strawbridge RJ
    8. Pers TH
    9. Fischer K
    10. Justice AE
    11. Workalemahu T
    12. Wu JMW
    13. Buchkovich ML
    14. Heard-Costa NL
    15. Roman TS
    16. Drong AW
    17. Song C
    18. Gustafsson S
    19. Day FR
    20. Esko T
    21. Fall T
    22. Kutalik Z
    23. Luan J
    24. Randall JC
    25. Scherag A
    26. Vedantam S
    27. Wood AR
    28. Chen J
    29. Fehrmann R
    30. Karjalainen J
    31. Kahali B
    32. Liu C-T
    33. Schmidt EM
    34. Absher D
    35. Amin N
    36. Anderson D
    37. Beekman M
    38. Bragg-Gresham JL
    39. Buyske S
    40. Demirkan A
    41. Ehret GB
    42. Feitosa MF
    43. Goel A
    44. Jackson AU
    45. Johnson T
    46. Kleber ME
    47. Kristiansson K
    48. Mangino M
    49. Leach IM
    50. Medina-Gomez C
    51. Palmer CD
    52. Pasko D
    53. Pechlivanis S
    54. Peters MJ
    55. Prokopenko I
    56. Stančáková A
    57. Sung YJ
    58. Tanaka T
    59. Teumer A
    60. Van Vliet-Ostaptchouk JV
    61. Yengo L
    62. Zhang W
    63. Albrecht E
    64. Ärnlöv J
    65. Arscott GM
    66. Bandinelli S
    67. Barrett A
    68. Bellis C
    69. Bennett AJ
    70. Berne C
    71. Blüher M
    72. Böhringer S
    73. Bonnet F
    74. Böttcher Y
    75. Bruinenberg M
    76. Carba DB
    77. Caspersen IH
    78. Clarke R
    79. Daw EW
    80. Deelen J
    81. Deelman E
    82. Delgado G
    83. Doney AS
    84. Eklund N
    85. Erdos MR
    86. Estrada K
    87. Eury E
    88. Friedrich N
    89. Garcia ME
    90. Giedraitis V
    91. Gigante B
    92. Go AS
    93. Golay A
    94. Grallert H
    95. Grammer TB
    96. Gräßler J
    97. Grewal J
    98. Groves CJ
    99. Haller T
    100. Hallmans G
    101. Hartman CA
    102. Hassinen M
    103. Hayward C
    104. Heikkilä K
    105. Herzig K-H
    106. Helmer Q
    107. Hillege HL
    108. Holmen O
    109. Hunt SC
    110. Isaacs A
    111. Ittermann T
    112. James AL
    113. Johansson I
    114. Juliusdottir T
    115. Kalafati I-P
    116. Kinnunen L
    117. Koenig W
    118. Kooner IK
    119. Kratzer W
    120. Lamina C
    121. Leander K
    122. Lee NR
    123. Lichtner P
    124. Lind L
    125. Lindström J
    126. Lobbens S
    127. Lorentzon M
    128. Mach F
    129. Magnusson PK
    130. Mahajan A
    131. McArdle WL
    132. Menni C
    133. Merger S
    134. Mihailov E
    135. Milani L
    136. Mills R
    137. Moayyeri A
    138. Monda KL
    139. Mooijaart SP
    140. Mühleisen TW
    141. Mulas A
    142. Müller G
    143. Müller-Nurasyid M
    144. Nagaraja R
    145. Nalls MA
    146. Narisu N
    147. Glorioso N
    148. Nolte IM
    149. Olden M
    150. Rayner NW
    151. Renstrom F
    152. Ried JS
    153. Robertson NR
    154. Rose LM
    155. Sanna S
    156. Scharnagl H
    157. Scholtens S
    158. Sennblad B
    159. Seufferlein T
    160. Sitlani CM
    161. Smith AV
    162. Stirrups K
    163. Stringham HM
    164. Sundström J
    165. Swertz MA
    166. Swift AJ
    167. Syvänen A-C
    168. Tayo BO
    169. Thorand B
    170. Thorleifsson G
    171. Tomaschitz A
    172. Troffa C
    173. van Oort FV
    174. Verweij N
    175. Vonk JM
    176. Waite LL
    177. Wennauer R
    178. Wilsgaard T
    179. Wojczynski MK
    180. Wong A
    181. Zhang Q
    182. Zhao JH
    183. Brennan EP
    184. Choi M
    185. Eriksson P
    186. Folkersen L
    187. Franco-Cereceda A
    188. Gharavi AG
    189. Hedman ÅK
    190. Hivert M-F
    191. Huang J
    192. Kanoni S
    193. Karpe F
    194. Keildson S
    195. Kiryluk K
    196. Liang L
    197. Lifton RP
    198. Ma B
    199. McKnight AJ
    200. McPherson R
    201. Metspalu A
    202. Min JL
    203. Moffatt MF
    204. Montgomery GW
    205. Murabito JM
    206. Nicholson G
    207. Nyholt DR
    208. Olsson C
    209. Perry JR
    210. Reinmaa E
    211. Salem RM
    212. Sandholm N
    213. Schadt EE
    214. Scott RA
    215. Stolk L
    216. Vallejo EE
    217. Westra H-J
    218. Zondervan KT
    219. ADIPOGen Consortium
    220. CARDIOGRAMplusC4D Consortium
    221. CKDGen Consortium
    222. GEFOS Consortium
    223. GENIE Consortium
    224. GLGC
    225. ICBP
    226. International Endogene Consortium
    227. LifeLines Cohort Study
    228. MAGIC Investigators
    229. MuTHER Consortium
    230. PAGE Consortium
    231. ReproGen Consortium
    232. Amouyel P
    233. Arveiler D
    234. Bakker SJ
    235. Beilby J
    236. Bergman RN
    237. Blangero J
    238. Brown MJ
    239. Burnier M
    240. Campbell H
    241. Chakravarti A
    242. Chines PS
    243. Claudi-Boehm S
    244. Collins FS
    245. Crawford DC
    246. Danesh J
    247. de Faire U
    248. de Geus EJ
    249. Dörr M
    250. Erbel R
    251. Eriksson JG
    252. Farrall M
    253. Ferrannini E
    254. Ferrières J
    255. Forouhi NG
    256. Forrester T
    257. Franco OH
    258. Gansevoort RT
    259. Gieger C
    260. Gudnason V
    261. Haiman CA
    262. Harris TB
    263. Hattersley AT
    264. Heliövaara M
    265. Hicks AA
    266. Hingorani AD
    267. Hoffmann W
    268. Hofman A
    269. Homuth G
    270. Humphries SE
    271. Hyppönen E
    272. Illig T
    273. Jarvelin M-R
    274. Johansen B
    275. Jousilahti P
    276. Jula AM
    277. Kaprio J
    278. Kee F
    279. Keinanen-Kiukaanniemi SM
    280. Kooner JS
    281. Kooperberg C
    282. Kovacs P
    283. Kraja AT
    284. Kumari M
    285. Kuulasmaa K
    286. Kuusisto J
    287. Lakka TA
    288. Langenberg C
    289. Le Marchand L
    290. Lehtimäki T
    291. Lyssenko V
    292. Männistö S
    293. Marette A
    294. Matise TC
    295. McKenzie CA
    296. McKnight B
    297. Musk AW
    298. Möhlenkamp S
    299. Morris AD
    300. Nelis M
    301. Ohlsson C
    302. Oldehinkel AJ
    303. Ong KK
    304. Palmer LJ
    305. Penninx BW
    306. Peters A
    307. Pramstaller PP
    308. Raitakari OT
    309. Rankinen T
    310. Rao DC
    311. Rice TK
    312. Ridker PM
    313. Ritchie MD
    314. Rudan I
    315. Salomaa V
    316. Samani NJ
    317. Saramies J
    318. Sarzynski MA
    319. Schwarz PE
    320. Shuldiner AR
    321. Staessen JA
    322. Steinthorsdottir V
    323. Stolk RP
    324. Strauch K
    325. Tönjes A
    326. Tremblay A
    327. Tremoli E
    328. Vohl M-C
    329. Völker U
    330. Vollenweider P
    331. Wilson JF
    332. Witteman JC
    333. Adair LS
    334. Bochud M
    335. Boehm BO
    336. Bornstein SR
    337. Bouchard C
    338. Cauchi S
    339. Caulfield MJ
    340. Chambers JC
    341. Chasman DI
    342. Cooper RS
    343. Dedoussis G
    344. Ferrucci L
    345. Froguel P
    346. Grabe H-J
    347. Hamsten A
    348. Hui J
    349. Hveem K
    350. Jöckel K-H
    351. Kivimaki M
    352. Kuh D
    353. Laakso M
    354. Liu Y
    355. März W
    356. Munroe PB
    357. Njølstad I
    358. Oostra BA
    359. Palmer CN
    360. Pedersen NL
    361. Perola M
    362. Pérusse L
    363. Peters U
    364. Power C
    365. Quertermous T
    366. Rauramaa R
    367. Rivadeneira F
    368. Saaristo TE
    369. Saleheen D
    370. Sinisalo J
    371. Slagboom PE
    372. Snieder H
    373. Spector TD
    374. Stefansson K
    375. Stumvoll M
    376. Tuomilehto J
    377. Uitterlinden AG
    378. Uusitupa M
    379. van der Harst P
    380. Veronesi G
    381. Walker M
    382. Wareham NJ
    383. Watkins H
    384. Wichmann H-E
    385. Abecasis GR
    386. Assimes TL
    387. Berndt SI
    388. Boehnke M
    389. Borecki IB
    390. Deloukas P
    391. Franke L
    392. Frayling TM
    393. Groop LC
    394. Hunter DJ
    395. Kaplan RC
    396. O’Connell JR
    397. Qi L
    398. Schlessinger D
    399. Strachan DP
    400. Thorsteinsdottir U
    401. van Duijn CM
    402. Willer CJ
    403. Visscher PM
    404. Yang J
    405. Hirschhorn JN
    406. Zillikens MC
    407. McCarthy MI
    408. Speliotes EK
    409. North KE
    410. Fox CS
    411. Barroso I
    412. Franks PW
    413. Ingelsson E
    414. Heid IM
    415. Loos RJ
    416. Cupples LA
    417. Morris AP
    418. Lindgren CM
    419. Mohlke KL
    (2015) New genetic loci link adipose and insulin biology to body fat distribution
    Nature 518:187–196.
    https://doi.org/10.1038/nature14132
    1. Soranzo N
    2. Sanna S
    3. Wheeler E
    4. Gieger C
    5. Radke D
    6. Dupuis J
    7. Bouatia-Naji N
    8. Langenberg C
    9. Prokopenko I
    10. Stolerman E
    11. Sandhu MS
    12. Heeney MM
    13. Devaney JM
    14. Reilly MP
    15. Ricketts SL
    16. Stewart AFR
    17. Voight BF
    18. Willenborg C
    19. Wright B
    20. Altshuler D
    21. Arking D
    22. Balkau B
    23. Barnes D
    24. Boerwinkle E
    25. Böhm B
    26. Bonnefond A
    27. Bonnycastle LL
    28. Boomsma DI
    29. Bornstein SR
    30. Böttcher Y
    31. Bumpstead S
    32. Burnett-Miller MS
    33. Campbell H
    34. Cao A
    35. Chambers J
    36. Clark R
    37. Collins FS
    38. Coresh J
    39. de Geus EJC
    40. Dei M
    41. Deloukas P
    42. Döring A
    43. Egan JM
    44. Elosua R
    45. Ferrucci L
    46. Forouhi N
    47. Fox CS
    48. Franklin C
    49. Franzosi MG
    50. Gallina S
    51. Goel A
    52. Graessler J
    53. Grallert H
    54. Greinacher A
    55. Hadley D
    56. Hall A
    57. Hamsten A
    58. Hayward C
    59. Heath S
    60. Herder C
    61. Homuth G
    62. Hottenga J-J
    63. Hunter-Merrill R
    64. Illig T
    65. Jackson AU
    66. Jula A
    67. Kleber M
    68. Knouff CW
    69. Kong A
    70. Kooner J
    71. Köttgen A
    72. Kovacs P
    73. Krohn K
    74. Kühnel B
    75. Kuusisto J
    76. Laakso M
    77. Lathrop M
    78. Lecoeur C
    79. Li M
    80. Li M
    81. Loos RJF
    82. Luan J
    83. Lyssenko V
    84. Mägi R
    85. Magnusson PKE
    86. Mälarstig A
    87. Mangino M
    88. Martínez-Larrad MT
    89. März W
    90. McArdle WL
    91. McPherson R
    92. Meisinger C
    93. Meitinger T
    94. Melander O
    95. Mohlke KL
    96. Mooser VE
    97. Morken MA
    98. Narisu N
    99. Nathan DM
    100. Nauck M
    101. O’Donnell C
    102. Oexle K
    103. Olla N
    104. Pankow JS
    105. Payne F
    106. Peden JF
    107. Pedersen NL
    108. Peltonen L
    109. Perola M
    110. Polasek O
    111. Porcu E
    112. Rader DJ
    113. Rathmann W
    114. Ripatti S
    115. Rocheleau G
    116. Roden M
    117. Rudan I
    118. Salomaa V
    119. Saxena R
    120. Schlessinger D
    121. Schunkert H
    122. Schwarz P
    123. Seedorf U
    124. Selvin E
    125. Serrano-Ríos M
    126. Shrader P
    127. Silveira A
    128. Siscovick D
    129. Song K
    130. Spector TD
    131. Stefansson K
    132. Steinthorsdottir V
    133. Strachan DP
    134. Strawbridge R
    135. Stumvoll M
    136. Surakka I
    137. Swift AJ
    138. Tanaka T
    139. Teumer A
    140. Thorleifsson G
    141. Thorsteinsdottir U
    142. Tönjes A
    143. Usala G
    144. Vitart V
    145. Völzke H
    146. Wallaschofski H
    147. Waterworth DM
    148. Watkins H
    149. Wichmann H-E
    150. Wild SH
    151. Willemsen G
    152. Williams GH
    153. Wilson JF
    154. Winkelmann J
    155. Wright AF
    156. WTCCC
    157. Zabena C
    158. Zhao JH
    159. Epstein SE
    160. Erdmann J
    161. Hakonarson HH
    162. Kathiresan S
    163. Khaw K-T
    164. Roberts R
    165. Samani NJ
    166. Fleming MD
    167. Sladek R
    168. Abecasis G
    169. Boehnke M
    170. Froguel P
    171. Groop L
    172. McCarthy MI
    173. Kao WHL
    174. Florez JC
    175. Uda M
    176. Wareham NJ
    177. Barroso I
    178. Meigs JB
    (2010) Common variants at 10 genomic loci influence hemoglobin A₁(C) levels via glycemic and nonglycemic pathways
    Diabetes 59:3229–3239.
    https://doi.org/10.2337/db10-0502
    1. Wheeler E
    2. Leong A
    3. Liu CT
    4. Hivert MF
    5. Strawbridge RJ
    6. Podmore C
    7. Li M
    8. Yao J
    9. Sim X
    10. Hong J
    11. Chu AY
    12. Zhang W
    13. Wang X
    14. Chen P
    15. Maruthur NM
    16. Porneala BC
    17. Sharp SJ
    18. Jia Y
    19. Kabagambe EK
    20. Chang LC
    21. Chen WM
    22. Elks CE
    23. Evans DS
    24. Fan Q
    25. Giulianini F
    26. Go MJ
    27. Hottenga JJ
    28. Hu Y
    29. Jackson AU
    30. Kanoni S
    31. Kim YJ
    32. Kleber ME
    33. Ladenvall C
    34. Lecoeur C
    35. Lim SH
    36. Lu Y
    37. Mahajan A
    38. Marzi C
    39. Nalls MA
    40. Navarro P
    41. Nolte IM
    42. Rose LM
    43. Rybin DV
    44. Sanna S
    45. Shi Y
    46. Stram DO
    47. Takeuchi F
    48. Tan SP
    49. van der Most PJ
    50. Van Vliet-Ostaptchouk JV
    51. Wong A
    52. Yengo L
    53. Zhao W
    54. Goel A
    55. Martinez Larrad MT
    56. Radke D
    57. Salo P
    58. Tanaka T
    59. van Iperen EPA
    60. Abecasis G
    61. Afaq S
    62. Alizadeh BZ
    63. Bertoni AG
    64. Bonnefond A
    65. Böttcher Y
    66. Bottinger EP
    67. Campbell H
    68. Carlson OD
    69. Chen CH
    70. Cho YS
    71. Garvey WT
    72. Gieger C
    73. Goodarzi MO
    74. Grallert H
    75. Hamsten A
    76. Hartman CA
    77. Herder C
    78. Hsiung CA
    79. Huang J
    80. Igase M
    81. Isono M
    82. Katsuya T
    83. Khor CC
    84. Kiess W
    85. Kohara K
    86. Kovacs P
    87. Lee J
    88. Lee WJ
    89. Lehne B
    90. Li H
    91. Liu J
    92. Lobbens S
    93. Luan J
    94. Lyssenko V
    95. Meitinger T
    96. Miki T
    97. Miljkovic I
    98. Moon S
    99. Mulas A
    100. Müller G
    101. Müller-Nurasyid M
    102. Nagaraja R
    103. Nauck M
    104. Pankow JS
    105. Polasek O
    106. Prokopenko I
    107. Ramos PS
    108. Rasmussen-Torvik L
    109. Rathmann W
    110. Rich SS
    111. Robertson NR
    112. Roden M
    113. Roussel R
    114. Rudan I
    115. Scott RA
    116. Scott WR
    117. Sennblad B
    118. Siscovick DS
    119. Strauch K
    120. Sun L
    121. Swertz M
    122. Tajuddin SM
    123. Taylor KD
    124. Teo YY
    125. Tham YC
    126. Tönjes A
    127. Wareham NJ
    128. Willemsen G
    129. Wilsgaard T
    130. Hingorani AD
    131. Egan J
    132. Ferrucci L
    133. Hovingh GK
    134. Jula A
    135. Kivimaki M
    136. Kumari M
    137. Njølstad I
    138. Palmer CNA
    139. Serrano Ríos M
    140. Stumvoll M
    141. Watkins H
    142. Aung T
    143. Blüher M
    144. Boehnke M
    145. Boomsma DI
    146. Bornstein SR
    147. Chambers JC
    148. Chasman DI
    149. Chen YDI
    150. Chen YT
    151. Cheng CY
    152. Cucca F
    153. de Geus EJC
    154. Deloukas P
    155. Evans MK
    156. Fornage M
    157. Friedlander Y
    158. Froguel P
    159. Groop L
    160. Gross MD
    161. Harris TB
    162. Hayward C
    163. Heng CK
    164. Ingelsson E
    165. Kato N
    166. Kim BJ
    167. Koh WP
    168. Kooner JS
    169. Körner A
    170. Kuh D
    171. Kuusisto J
    172. Laakso M
    173. Lin X
    174. Liu Y
    175. Loos RJF
    176. Magnusson PKE
    177. März W
    178. McCarthy MI
    179. Oldehinkel AJ
    180. Ong KK
    181. Pedersen NL
    182. Pereira MA
    183. Peters A
    184. Ridker PM
    185. Sabanayagam C
    186. Sale M
    187. Saleheen D
    188. Saltevo J
    189. Schwarz PE
    190. Sheu WHH
    191. Snieder H
    192. Spector TD
    193. Tabara Y
    194. Tuomilehto J
    195. van Dam RM
    196. Wilson JG
    197. Wilson JF
    198. Wolffenbuttel BHR
    199. Wong TY
    200. Wu JY
    201. Yuan JM
    202. Zonderman AB
    203. Soranzo N
    204. Guo X
    205. Roberts DJ
    206. Florez JC
    207. Sladek R
    208. Dupuis J
    209. Morris AP
    210. Tai ES
    211. Selvin E
    212. Rotter JI
    213. Langenberg C
    214. Barroso I
    215. Meigs JB
    216. EPIC-CVD Consortium
    217. EPIC-InterAct Consortium
    218. Lifelines Cohort Study
    (2017) Impact of common genetic determinants of Hemoglobin A1c on type 2 diabetes risk and diagnosis in ancestrally diverse populations: A transethnic genome-wide meta-analysis
    PLOS Medicine 14:e1002383.
    https://doi.org/10.1371/journal.pmed.1002383
    1. Willer CJ
    2. Schmidt EM
    3. Sengupta S
    4. Peloso GM
    5. Gustafsson S
    6. Kanoni S
    7. Ganna A
    8. Chen J
    9. Buchkovich ML
    10. Mora S
    11. Beckmann JS
    12. Bragg-Gresham JL
    13. Chang H-Y
    14. Demirkan A
    15. Den Hertog HM
    16. Do R
    17. Donnelly LA
    18. Ehret GB
    19. Esko T
    20. Feitosa MF
    21. Ferreira T
    22. Fischer K
    23. Fontanillas P
    24. Fraser RM
    25. Freitag DF
    26. Gurdasani D
    27. Heikkilä K
    28. Hyppönen E
    29. Isaacs A
    30. Jackson AU
    31. Johansson Å
    32. Johnson T
    33. Kaakinen M
    34. Kettunen J
    35. Kleber ME
    36. Li X
    37. Luan J
    38. Lyytikäinen L-P
    39. Magnusson PKE
    40. Mangino M
    41. Mihailov E
    42. Montasser ME
    43. Müller-Nurasyid M
    44. Nolte IM
    45. O’Connell JR
    46. Palmer CD
    47. Perola M
    48. Petersen A-K
    49. Sanna S
    50. Saxena R
    51. Service SK
    52. Shah S
    53. Shungin D
    54. Sidore C
    55. Song C
    56. Strawbridge RJ
    57. Surakka I
    58. Tanaka T
    59. Teslovich TM
    60. Thorleifsson G
    61. Van den Herik EG
    62. Voight BF
    63. Volcik KA
    64. Waite LL
    65. Wong A
    66. Wu Y
    67. Zhang W
    68. Absher D
    69. Asiki G
    70. Barroso I
    71. Been LF
    72. Bolton JL
    73. Bonnycastle LL
    74. Brambilla P
    75. Burnett MS
    76. Cesana G
    77. Dimitriou M
    78. Doney ASF
    79. Döring A
    80. Elliott P
    81. Epstein SE
    82. Ingi Eyjolfsson G
    83. Gigante B
    84. Goodarzi MO
    85. Grallert H
    86. Gravito ML
    87. Groves CJ
    88. Hallmans G
    89. Hartikainen A-L
    90. Hayward C
    91. Hernandez D
    92. Hicks AA
    93. Holm H
    94. Hung Y-J
    95. Illig T
    96. Jones MR
    97. Kaleebu P
    98. Kastelein JJP
    99. Khaw K-T
    100. Kim E
    101. Klopp N
    102. Komulainen P
    103. Kumari M
    104. Langenberg C
    105. Lehtimäki T
    106. Lin S-Y
    107. Lindström J
    108. Loos RJF
    109. Mach F
    110. McArdle WL
    111. Meisinger C
    112. Mitchell BD
    113. Müller G
    114. Nagaraja R
    115. Narisu N
    116. Nieminen TVM
    117. Nsubuga RN
    118. Olafsson I
    119. Ong KK
    120. Palotie A
    121. Papamarkou T
    122. Pomilla C
    123. Pouta A
    124. Rader DJ
    125. Reilly MP
    126. Ridker PM
    127. Rivadeneira F
    128. Rudan I
    129. Ruokonen A
    130. Samani N
    131. Scharnagl H
    132. Seeley J
    133. Silander K
    134. Stančáková A
    135. Stirrups K
    136. Swift AJ
    137. Tiret L
    138. Uitterlinden AG
    139. van Pelt LJ
    140. Vedantam S
    141. Wainwright N
    142. Wijmenga C
    143. Wild SH
    144. Willemsen G
    145. Wilsgaard T
    146. Wilson JF
    147. Young EH
    148. Zhao JH
    149. Adair LS
    150. Arveiler D
    151. Assimes TL
    152. Bandinelli S
    153. Bennett F
    154. Bochud M
    155. Boehm BO
    156. Boomsma DI
    157. Borecki IB
    158. Bornstein SR
    159. Bovet P
    160. Burnier M
    161. Campbell H
    162. Chakravarti A
    163. Chambers JC
    164. Chen Y-DI
    165. Collins FS
    166. Cooper RS
    167. Danesh J
    168. Dedoussis G
    169. de Faire U
    170. Feranil AB
    171. Ferrières J
    172. Ferrucci L
    173. Freimer NB
    174. Gieger C
    175. Groop LC
    176. Gudnason V
    177. Gyllensten U
    178. Hamsten A
    179. Harris TB
    180. Hingorani A
    181. Hirschhorn JN
    182. Hofman A
    183. Hovingh GK
    184. Hsiung CA
    185. Humphries SE
    186. Hunt SC
    187. Hveem K
    188. Iribarren C
    189. Järvelin M-R
    190. Jula A
    191. Kähönen M
    192. Kaprio J
    193. Kesäniemi A
    194. Kivimaki M
    195. Kooner JS
    196. Koudstaal PJ
    197. Krauss RM
    198. Kuh D
    199. Kuusisto J
    200. Kyvik KO
    201. Laakso M
    202. Lakka TA
    203. Lind L
    204. Lindgren CM
    205. Martin NG
    206. März W
    207. McCarthy MI
    208. McKenzie CA
    209. Meneton P
    210. Metspalu A
    211. Moilanen L
    212. Morris AD
    213. Munroe PB
    214. Njølstad I
    215. Pedersen NL
    216. Power C
    217. Pramstaller PP
    218. Price JF
    219. Psaty BM
    220. Quertermous T
    221. Rauramaa R
    222. Saleheen D
    223. Salomaa V
    224. Sanghera DK
    225. Saramies J
    226. Schwarz PEH
    227. Sheu WH-H
    228. Shuldiner AR
    229. Siegbahn A
    230. Spector TD
    231. Stefansson K
    232. Strachan DP
    233. Tayo BO
    234. Tremoli E
    235. Tuomilehto J
    236. Uusitupa M
    237. van Duijn CM
    238. Vollenweider P
    239. Wallentin L
    240. Wareham NJ
    241. Whitfield JB
    242. Wolffenbuttel BHR
    243. Ordovas JM
    244. Boerwinkle E
    245. Palmer CNA
    246. Thorsteinsdottir U
    247. Chasman DI
    248. Rotter JI
    249. Franks PW
    250. Ripatti S
    251. Cupples LA
    252. Sandhu MS
    253. Rich SS
    254. Boehnke M
    255. Deloukas P
    256. Kathiresan S
    257. Mohlke KL
    258. Ingelsson E
    259. Abecasis GR
    260. Global Lipids Genetics Consortium
    (2013) Discovery and refinement of loci associated with lipid levels
    Nature Genetics 45:1274–1283.
    https://doi.org/10.1038/ng.2797
    1. Wood AR
    2. Esko T
    3. Yang J
    4. Vedantam S
    5. Pers TH
    6. Gustafsson S
    7. Chu AY
    8. Estrada K
    9. Luan J
    10. Kutalik Z
    11. Amin N
    12. Buchkovich ML
    13. Croteau-Chonka DC
    14. Day FR
    15. Duan Y
    16. Fall T
    17. Fehrmann R
    18. Ferreira T
    19. Jackson AU
    20. Karjalainen J
    21. Lo KS
    22. Locke AE
    23. Mägi R
    24. Mihailov E
    25. Porcu E
    26. Randall JC
    27. Scherag A
    28. Vinkhuyzen AAE
    29. Westra H-J
    30. Winkler TW
    31. Workalemahu T
    32. Zhao JH
    33. Absher D
    34. Albrecht E
    35. Anderson D
    36. Baron J
    37. Beekman M
    38. Demirkan A
    39. Ehret GB
    40. Feenstra B
    41. Feitosa MF
    42. Fischer K
    43. Fraser RM
    44. Goel A
    45. Gong J
    46. Justice AE
    47. Kanoni S
    48. Kleber ME
    49. Kristiansson K
    50. Lim U
    51. Lotay V
    52. Lui JC
    53. Mangino M
    54. Mateo Leach I
    55. Medina-Gomez C
    56. Nalls MA
    57. Nyholt DR
    58. Palmer CD
    59. Pasko D
    60. Pechlivanis S
    61. Prokopenko I
    62. Ried JS
    63. Ripke S
    64. Shungin D
    65. Stancáková A
    66. Strawbridge RJ
    67. Sung YJ
    68. Tanaka T
    69. Teumer A
    70. Trompet S
    71. van der Laan SW
    72. van Setten J
    73. Van Vliet-Ostaptchouk JV
    74. Wang Z
    75. Yengo L
    76. Zhang W
    77. Afzal U
    78. Arnlöv J
    79. Arscott GM
    80. Bandinelli S
    81. Barrett A
    82. Bellis C
    83. Bennett AJ
    84. Berne C
    85. Blüher M
    86. Bolton JL
    87. Böttcher Y
    88. Boyd HA
    89. Bruinenberg M
    90. Buckley BM
    91. Buyske S
    92. Caspersen IH
    93. Chines PS
    94. Clarke R
    95. Claudi-Boehm S
    96. Cooper M
    97. Daw EW
    98. De Jong PA
    99. Deelen J
    100. Delgado G
    101. Denny JC
    102. Dhonukshe-Rutten R
    103. Dimitriou M
    104. Doney ASF
    105. Dörr M
    106. Eklund N
    107. Eury E
    108. Folkersen L
    109. Garcia ME
    110. Geller F
    111. Giedraitis V
    112. Go AS
    113. Grallert H
    114. Grammer TB
    115. Gräßler J
    116. Grönberg H
    117. de Groot LCPGM
    118. Groves CJ
    119. Haessler J
    120. Hall P
    121. Haller T
    122. Hallmans G
    123. Hannemann A
    124. Hartman CA
    125. Hassinen M
    126. Hayward C
    127. Heard-Costa NL
    128. Helmer Q
    129. Hemani G
    130. Henders AK
    131. Hillege HL
    132. Hlatky MA
    133. Hoffmann W
    134. Hoffmann P
    135. Holmen O
    136. Houwing-Duistermaat JJ
    137. Illig T
    138. Isaacs A
    139. James AL
    140. Jeff J
    141. Johansen B
    142. Johansson Å
    143. Jolley J
    144. Juliusdottir T
    145. Junttila J
    146. Kho AN
    147. Kinnunen L
    148. Klopp N
    149. Kocher T
    150. Kratzer W
    151. Lichtner P
    152. Lind L
    153. Lindström J
    154. Lobbens S
    155. Lorentzon M
    156. Lu Y
    157. Lyssenko V
    158. Magnusson PKE
    159. Mahajan A
    160. Maillard M
    161. McArdle WL
    162. McKenzie CA
    163. McLachlan S
    164. McLaren PJ
    165. Menni C
    166. Merger S
    167. Milani L
    168. Moayyeri A
    169. Monda KL
    170. Morken MA
    171. Müller G
    172. Müller-Nurasyid M
    173. Musk AW
    174. Narisu N
    175. Nauck M
    176. Nolte IM
    177. Nöthen MM
    178. Oozageer L
    179. Pilz S
    180. Rayner NW
    181. Renstrom F
    182. Robertson NR
    183. Rose LM
    184. Roussel R
    185. Sanna S
    186. Scharnagl H
    187. Scholtens S
    188. Schumacher FR
    189. Schunkert H
    190. Scott RA
    191. Sehmi J
    192. Seufferlein T
    193. Shi J
    194. Silventoinen K
    195. Smit JH
    196. Smith AV
    197. Smolonska J
    198. Stanton AV
    199. Stirrups K
    200. Stott DJ
    201. Stringham HM
    202. Sundström J
    203. Swertz MA
    204. Syvänen A-C
    205. Tayo BO
    206. Thorleifsson G
    207. Tyrer JP
    208. van Dijk S
    209. van Schoor NM
    210. van der Velde N
    211. van Heemst D
    212. van Oort FVA
    213. Vermeulen SH
    214. Verweij N
    215. Vonk JM
    216. Waite LL
    217. Waldenberger M
    218. Wennauer R
    219. Wilkens LR
    220. Willenborg C
    221. Wilsgaard T
    222. Wojczynski MK
    223. Wong A
    224. Wright AF
    225. Zhang Q
    226. Arveiler D
    227. Bakker SJL
    228. Beilby J
    229. Bergman RN
    230. Bergmann S
    231. Biffar R
    232. Blangero J
    233. Boomsma DI
    234. Bornstein SR
    235. Bovet P
    236. Brambilla P
    237. Brown MJ
    238. Campbell H
    239. Caulfield MJ
    240. Chakravarti A
    241. Collins R
    242. Collins FS
    243. Crawford DC
    244. Cupples LA
    245. Danesh J
    246. de Faire U
    247. den Ruijter HM
    248. Erbel R
    249. Erdmann J
    250. Eriksson JG
    251. Farrall M
    252. Ferrannini E
    253. Ferrières J
    254. Ford I
    255. Forouhi NG
    256. Forrester T
    257. Gansevoort RT
    258. Gejman PV
    259. Gieger C
    260. Golay A
    261. Gottesman O
    262. Gudnason V
    263. Gyllensten U
    264. Haas DW
    265. Hall AS
    266. Harris TB
    267. Hattersley AT
    268. Heath AC
    269. Hengstenberg C
    270. Hicks AA
    271. Hindorff LA
    272. Hingorani AD
    273. Hofman A
    274. Hovingh GK
    275. Humphries SE
    276. Hunt SC
    277. Hypponen E
    278. Jacobs KB
    279. Jarvelin M-R
    280. Jousilahti P
    281. Jula AM
    282. Kaprio J
    283. Kastelein JJP
    284. Kayser M
    285. Kee F
    286. Keinanen-Kiukaanniemi SM
    287. Kiemeney LA
    288. Kooner JS
    289. Kooperberg C
    290. Koskinen S
    291. Kovacs P
    292. Kraja AT
    293. Kumari M
    294. Kuusisto J
    295. Lakka TA
    296. Langenberg C
    297. Le Marchand L
    298. Lehtimäki T
    299. Lupoli S
    300. Madden PAF
    301. Männistö S
    302. Manunta P
    303. Marette A
    304. Matise TC
    305. McKnight B
    306. Meitinger T
    307. Moll FL
    308. Montgomery GW
    309. Morris AD
    310. Morris AP
    311. Murray JC
    312. Nelis M
    313. Ohlsson C
    314. Oldehinkel AJ
    315. Ong KK
    316. Ouwehand WH
    317. Pasterkamp G
    318. Peters A
    319. Pramstaller PP
    320. Price JF
    321. Qi L
    322. Raitakari OT
    323. Rankinen T
    324. Rao DC
    325. Rice TK
    326. Ritchie M
    327. Rudan I
    328. Salomaa V
    329. Samani NJ
    330. Saramies J
    331. Sarzynski MA
    332. Schwarz PEH
    333. Sebert S
    334. Sever P
    335. Shuldiner AR
    336. Sinisalo J
    337. Steinthorsdottir V
    338. Stolk RP
    339. Tardif J-C
    340. Tönjes A
    341. Tremblay A
    342. Tremoli E
    343. Virtamo J
    344. Vohl M-C
    345. Electronic Medical Records and Genomics (eMEMERGEGE) Consortium
    346. MIGen Consortium
    347. PAGEGE Consortium
    348. LifeLines Cohort Study
    349. Amouyel P
    350. Asselbergs FW
    351. Assimes TL
    352. Bochud M
    353. Boehm BO
    354. Boerwinkle E
    355. Bottinger EP
    356. Bouchard C
    357. Cauchi S
    358. Chambers JC
    359. Chanock SJ
    360. Cooper RS
    361. de Bakker PIW
    362. Dedoussis G
    363. Ferrucci L
    364. Franks PW
    365. Froguel P
    366. Groop LC
    367. Haiman CA
    368. Hamsten A
    369. Hayes MG
    370. Hui J
    371. Hunter DJ
    372. Hveem K
    373. Jukema JW
    374. Kaplan RC
    375. Kivimaki M
    376. Kuh D
    377. Laakso M
    378. Liu Y
    379. Martin NG
    380. März W
    381. Melbye M
    382. Moebus S
    383. Munroe PB
    384. Njølstad I
    385. Oostra BA
    386. Palmer CNA
    387. Pedersen NL
    388. Perola M
    389. Pérusse L
    390. Peters U
    391. Powell JE
    392. Power C
    393. Quertermous T
    394. Rauramaa R
    395. Reinmaa E
    396. Ridker PM
    397. Rivadeneira F
    398. Rotter JI
    399. Saaristo TE
    400. Saleheen D
    401. Schlessinger D
    402. Slagboom PE
    403. Snieder H
    404. Spector TD
    405. Strauch K
    406. Stumvoll M
    407. Tuomilehto J
    408. Uusitupa M
    409. van der Harst P
    410. Völzke H
    411. Walker M
    412. Wareham NJ
    413. Watkins H
    414. Wichmann H-E
    415. Wilson JF
    416. Zanen P
    417. Deloukas P
    418. Heid IM
    419. Lindgren CM
    420. Mohlke KL
    421. Speliotes EK
    422. Thorsteinsdottir U
    423. Barroso I
    424. Fox CS
    425. North KE
    426. Strachan DP
    427. Beckmann JS
    428. Berndt SI
    429. Boehnke M
    430. Borecki IB
    431. McCarthy MI
    432. Metspalu A
    433. Stefansson K
    434. Uitterlinden AG
    435. van Duijn CM
    436. Franke L
    437. Willer CJ
    438. Price AL
    439. Lettre G
    440. Loos RJF
    441. Weedon MN
    442. Ingelsson E
    443. O’Connell JR
    444. Abecasis GR
    445. Chasman DI
    446. Goddard ME
    447. Visscher PM
    448. Hirschhorn JN
    449. Frayling TM
    (2014) Defining the role of common variation in the genomic and biological architecture of adult human height
    Nature Genetics 46:1173–1186.
    https://doi.org/10.1038/ng.3097

Article and author information

Author details

  1. Yochai Edlitz

    1. Department of Computer Science and Applied Mathematics, Weizmann Institute of Science, Rehovot, Israel
    2. Department of Molecular Cell Biology, Weizmann Institute of Science, Rehovot, Israel
    Contribution
    Conceptualization, Formal analysis, Investigation, Methodology, Software, Visualization, Writing - original draft
    Competing interests
    No competing interests declared
    ORCID icon "This ORCID iD identifies the author of this article:" 0000-0001-7733-3995
  2. Eran Segal

    1. Department of Computer Science and Applied Mathematics, Weizmann Institute of Science, Rehovot, Israel
    2. Department of Molecular Cell Biology, Weizmann Institute of Science, Rehovot, Israel
    Contribution
    Conceptualization, Methodology, Project administration, Supervision, Validation, Writing - review and editing
    For correspondence
    eran.segal@weizmann.ac.il
    Competing interests
    No competing interests declared
    ORCID icon "This ORCID iD identifies the author of this article:" 0000-0002-6859-1164

Funding

Feinberg Graduate School, Weizmann Institute of Science

  • Eran Segal

The funders had no role in study design, data collection and interpretation, or the decision to submit the work for publication.

Acknowledgements

This research has been conducted by using the UK Biobank Resource under Application Number 28784. We thank I Kalka, N Bar, MD, Yotam Reisner, MD, PhD, Smadar Shilo, PhD, E Barkan, and members of the Segal group for discussions.

Version history

  1. Preprint posted: August 4, 2020 (view preprint)
  2. Received: July 1, 2021
  3. Accepted: May 26, 2022
  4. Accepted Manuscript published: June 22, 2022 (version 1)
  5. Version of Record published: July 5, 2022 (version 2)
  6. Version of Record updated: July 7, 2022 (version 3)

Copyright

© 2022, Edlitz and Segal

This article is distributed under the terms of the Creative Commons Attribution License, which permits unrestricted use and redistribution provided that the original author and source are credited.

Metrics

  • 2,820
    Page views
  • 396
    Downloads
  • 6
    Citations

Article citation count generated by polling the highest count across the following sources: Crossref, PubMed Central, Scopus.

Download links

A two-part list of links to download the article, or parts of the article, in various formats.

Downloads (link to download the article as PDF)

Open citations (links to open the citations from this article in various online reference manager services)

Cite this article (links to download the citations from this article in formats compatible with various reference manager tools)

  1. Yochai Edlitz
  2. Eran Segal
(2022)
Prediction of type 2 diabetes mellitus onset using logistic regression-based scorecards
eLife 11:e71862.
https://doi.org/10.7554/eLife.71862

Share this article

https://doi.org/10.7554/eLife.71862

Further reading

    1. Epidemiology and Global Health
    Olivera Djuric, Elisabetta Larosa ... The Reggio Emilia Covid-19 Working Group
    Research Article

    Background:

    The aim of our study was to test the hypothesis that the community contact tracing strategy of testing contacts in households immediately instead of at the end of quarantine had an impact on the transmission of SARS-CoV-2 in schools in Reggio Emilia Province.

    Methods:

    We analysed surveillance data on notification of COVID-19 cases in schools between 1 September 2020 and 4 April 2021. We have applied a mediation analysis that allows for interaction between the intervention (before/after period) and the mediator.

    Results:

    Median tracing delay decreased from 7 to 3.1 days and the percentage of the known infection source increased from 34–54.8% (incident rate ratio-IRR 1.61 1.40–1.86). Implementation of prompt contact tracing was associated with a 10% decrease in the number of secondary cases (excess relative risk –0.1 95% CI –0.35–0.15). Knowing the source of infection of the index case led to a decrease in secondary transmission (IRR 0.75 95% CI 0.63–0.91) while the decrease in tracing delay was associated with decreased risk of secondary cases (1/IRR 0.97 95% CI 0.94–1.01 per one day of delay). The direct effect of the intervention accounted for the 29% decrease in the number of secondary cases (excess relative risk –0.29 95%–0.61 to 0.03).

    Conclusions:

    Prompt contact testing in the community reduces the time of contact tracing and increases the ability to identify the source of infection in school outbreaks. Although there are strong reasons for thinking it is a causal link, observed differences can be also due to differences in the force of infection and to other control measures put in place.

    Funding:

    This project was carried out with the technical and financial support of the Italian Ministry of Health – CCM 2020 and Ricerca Corrente Annual Program 2023.

    1. Epidemiology and Global Health
    David Robert Grimes
    Research Advance Updated

    In biomedical science, it is a reality that many published results do not withstand deeper investigation, and there is growing concern over a replicability crisis in science. Recently, Ellipse of Insignificance (EOI) analysis was introduced as a tool to allow researchers to gauge the robustness of reported results in dichotomous outcome design trials, giving precise deterministic values for the degree of miscoding between events and non-events tolerable simultaneously in both control and experimental arms (Grimes, 2022). While this is useful for situations where potential miscoding might transpire, it does not account for situations where apparently significant findings might result from accidental or deliberate data redaction in either the control or experimental arms of an experiment, or from missing data or systematic redaction. To address these scenarios, we introduce Region of Attainable Redaction (ROAR), a tool that extends EOI analysis to account for situations of potential data redaction. This produces a bounded cubic curve rather than an ellipse, and we outline how this can be used to identify potential redaction through an approach analogous to EOI. Applications are illustrated, and source code, including a web-based implementation that performs EOI and ROAR analysis in tandem for dichotomous outcome trials is provided.