External validation of a mobile clinical decision support system for diarrhea etiology prediction in children: A multicenter study in Bangladesh and Mali
- Department of Emergency Medicine, Alpert Medical School, Brown University, United States
- Department of Pediatrics, and Environmental and Global Health, Emerging Pathogens Institute, University of Florida, United States
- International Centre for Diarrhoeal Disease Research, Bangladesh
- Centre for Vaccine Development, Mali
- Division of Epidemiology, University of Utah, United States
- Rhode Island Hospital, United States
- Center for Vaccine Development and Global Health, University of Maryland School of Medicine, United States
- Department of Pediatrics, University of Kentucky Medical School, United States
- Division of Infectious Diseases and International Health, University of Virginia, United States
- Department of Pediatrics, University of Maryland, United States
- Division of Infectious Diseases, University of Utah School of Medicine, United States
Figures
Figure 1
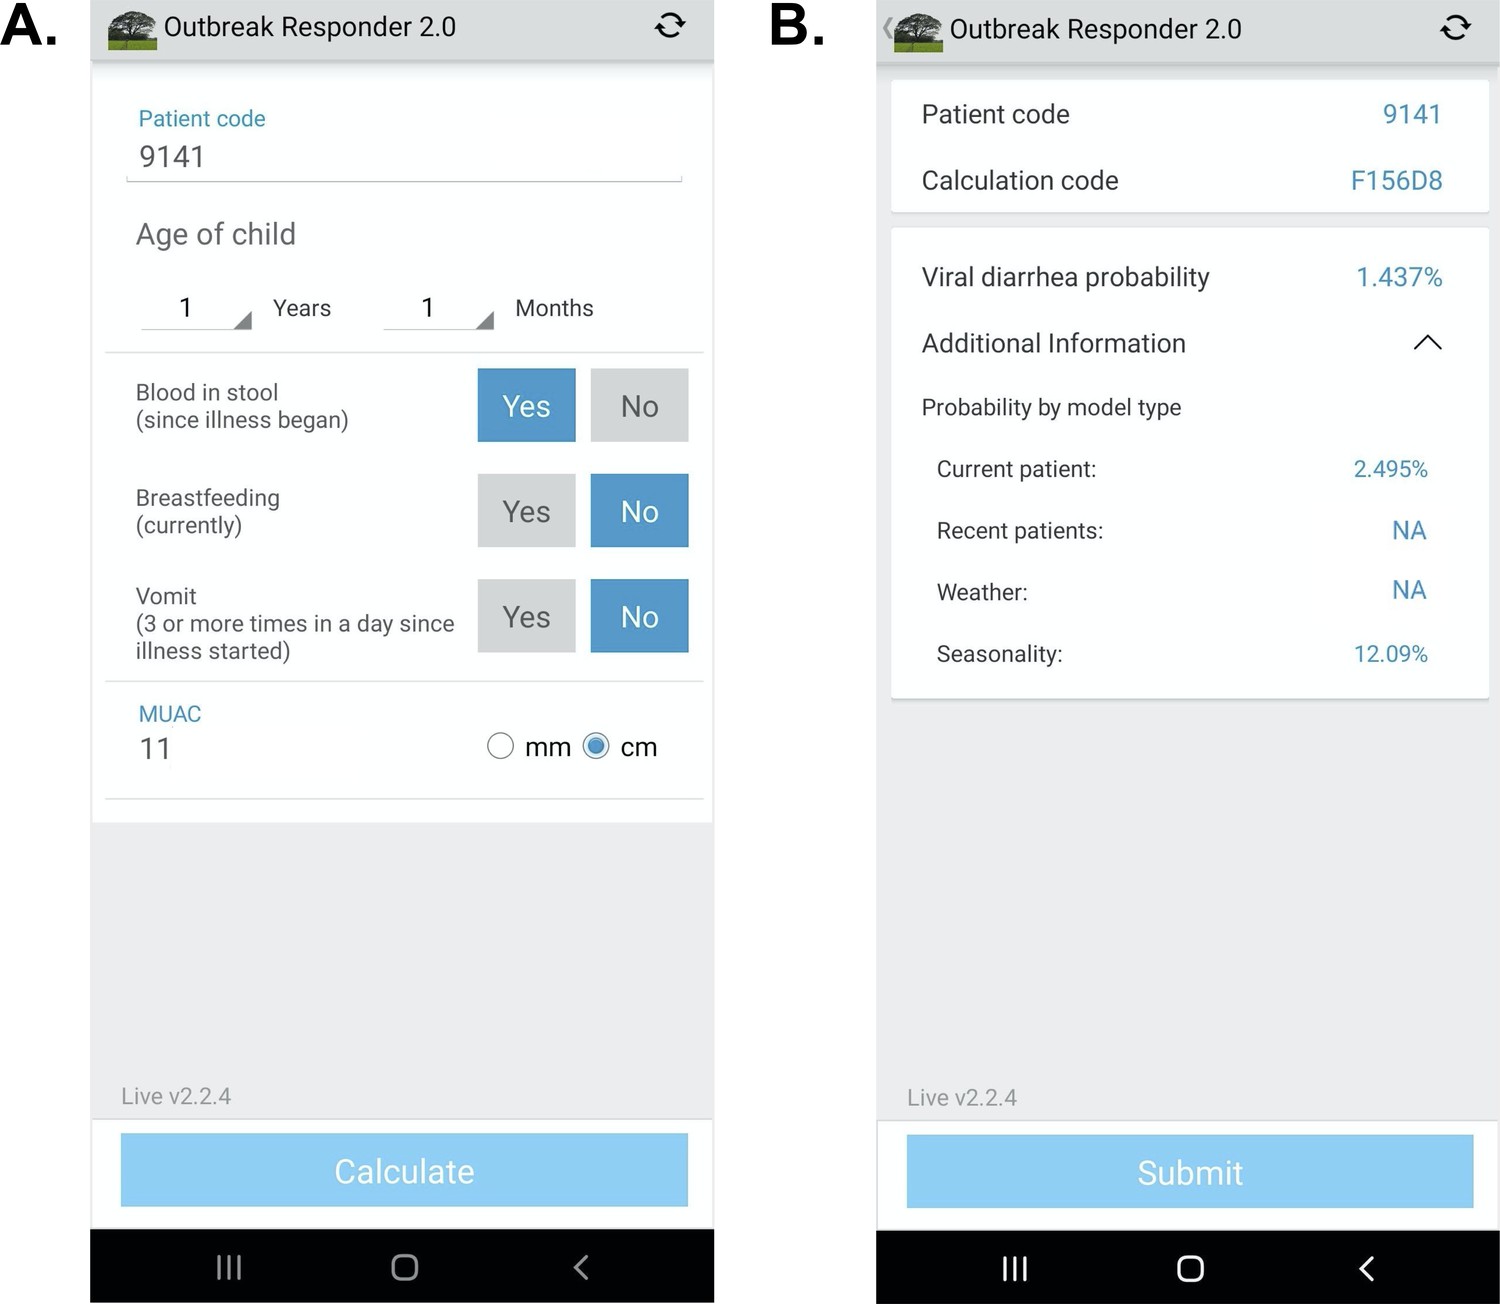
App user interface.
(A) Input page after application launch.( B) Output page with an example showing calculated probability of viral-only diarrhea. The ‘^’ symbol represents an open accordion menu with the component probabilities. ‘Current patient’ refers to the present patient model. ‘Weather’ (climate) and ‘recent patients’ (pre-test odds) were not active in this configuration.
Figure 2
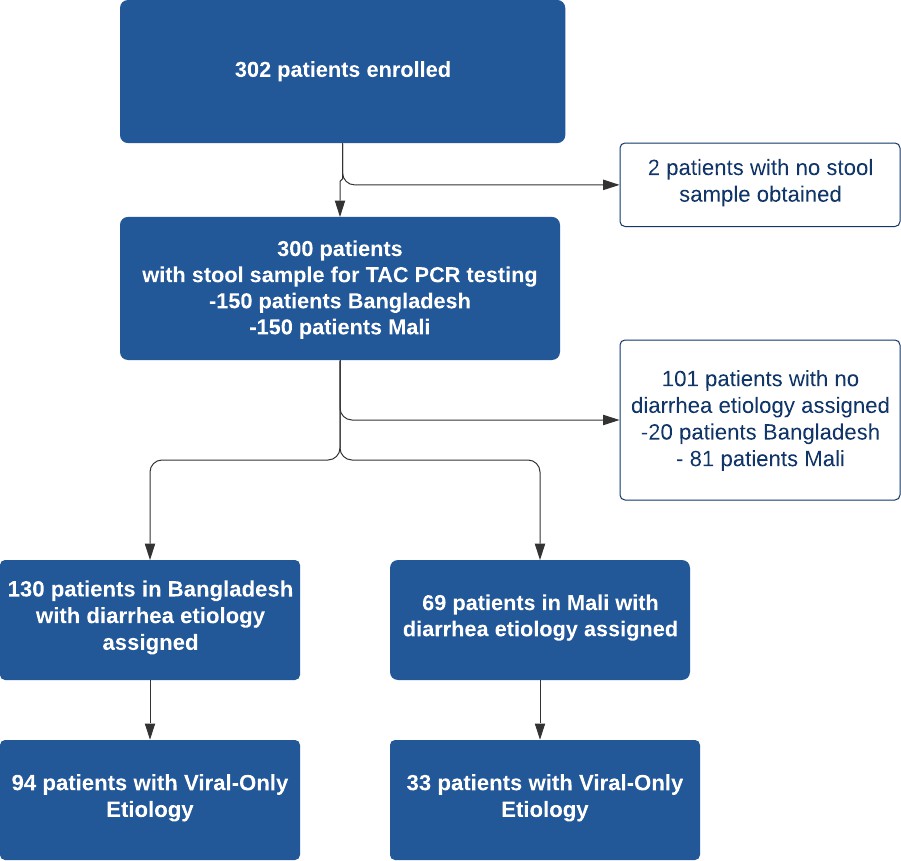
Study Flow Diagram.
Figure 3
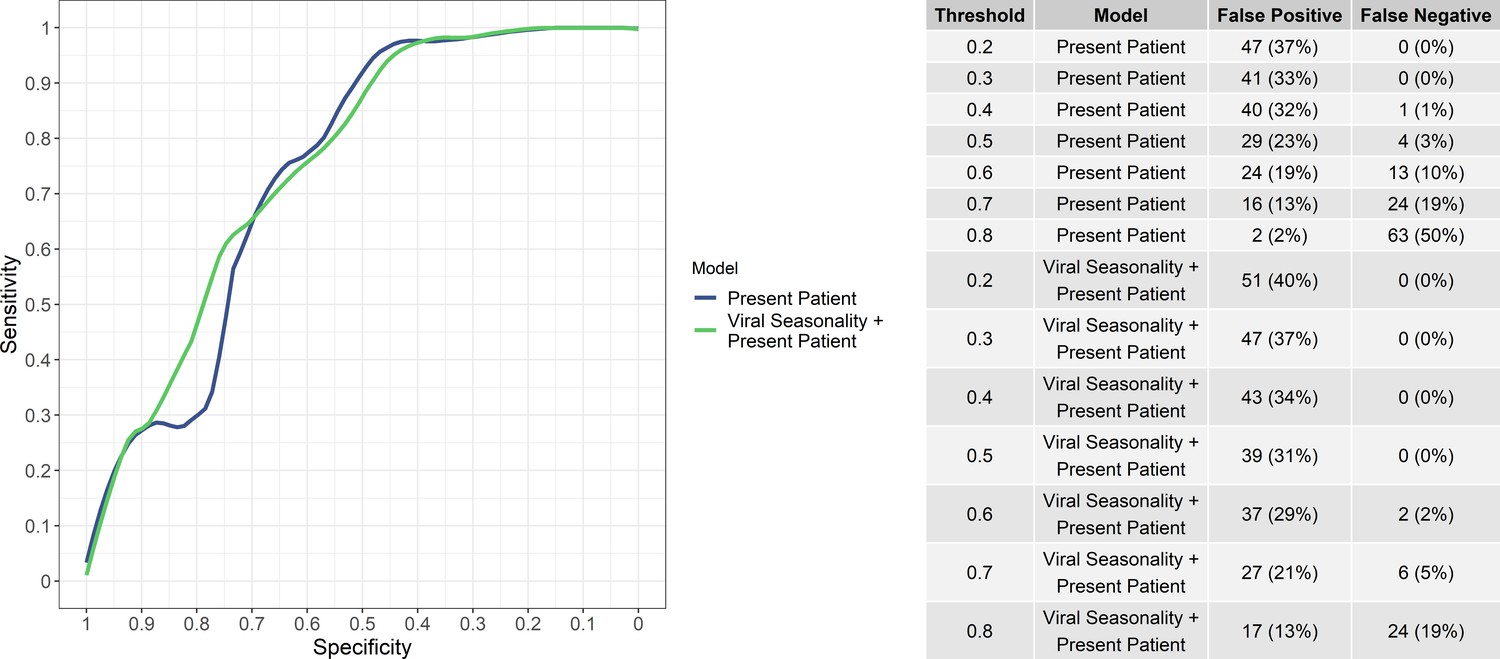
Sensitivity and specificity of the ‘present patient’ and ‘present patient+ viral seasonality’ models (left) and numbers of false positives and false negatives (i.e, bacteria/protozoal etiologies misidentified as viral and vice versa) at various viral probability thresholds (right).
Figure 4 with 1 supplement
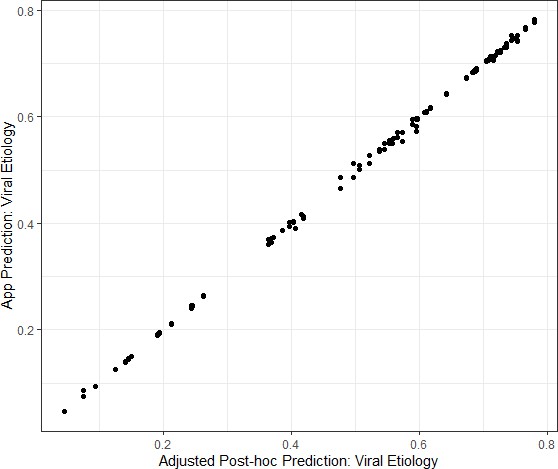
Congruence between the Application prediction of a patient’s viral etiology with the post-hoc prediction after adjusting for changing model development.
Data shown are from the Mali study period alone because the software was updated between the Bangladesh and Mali study periods in response to engineering limitations.
Figure 4—figure supplement 1
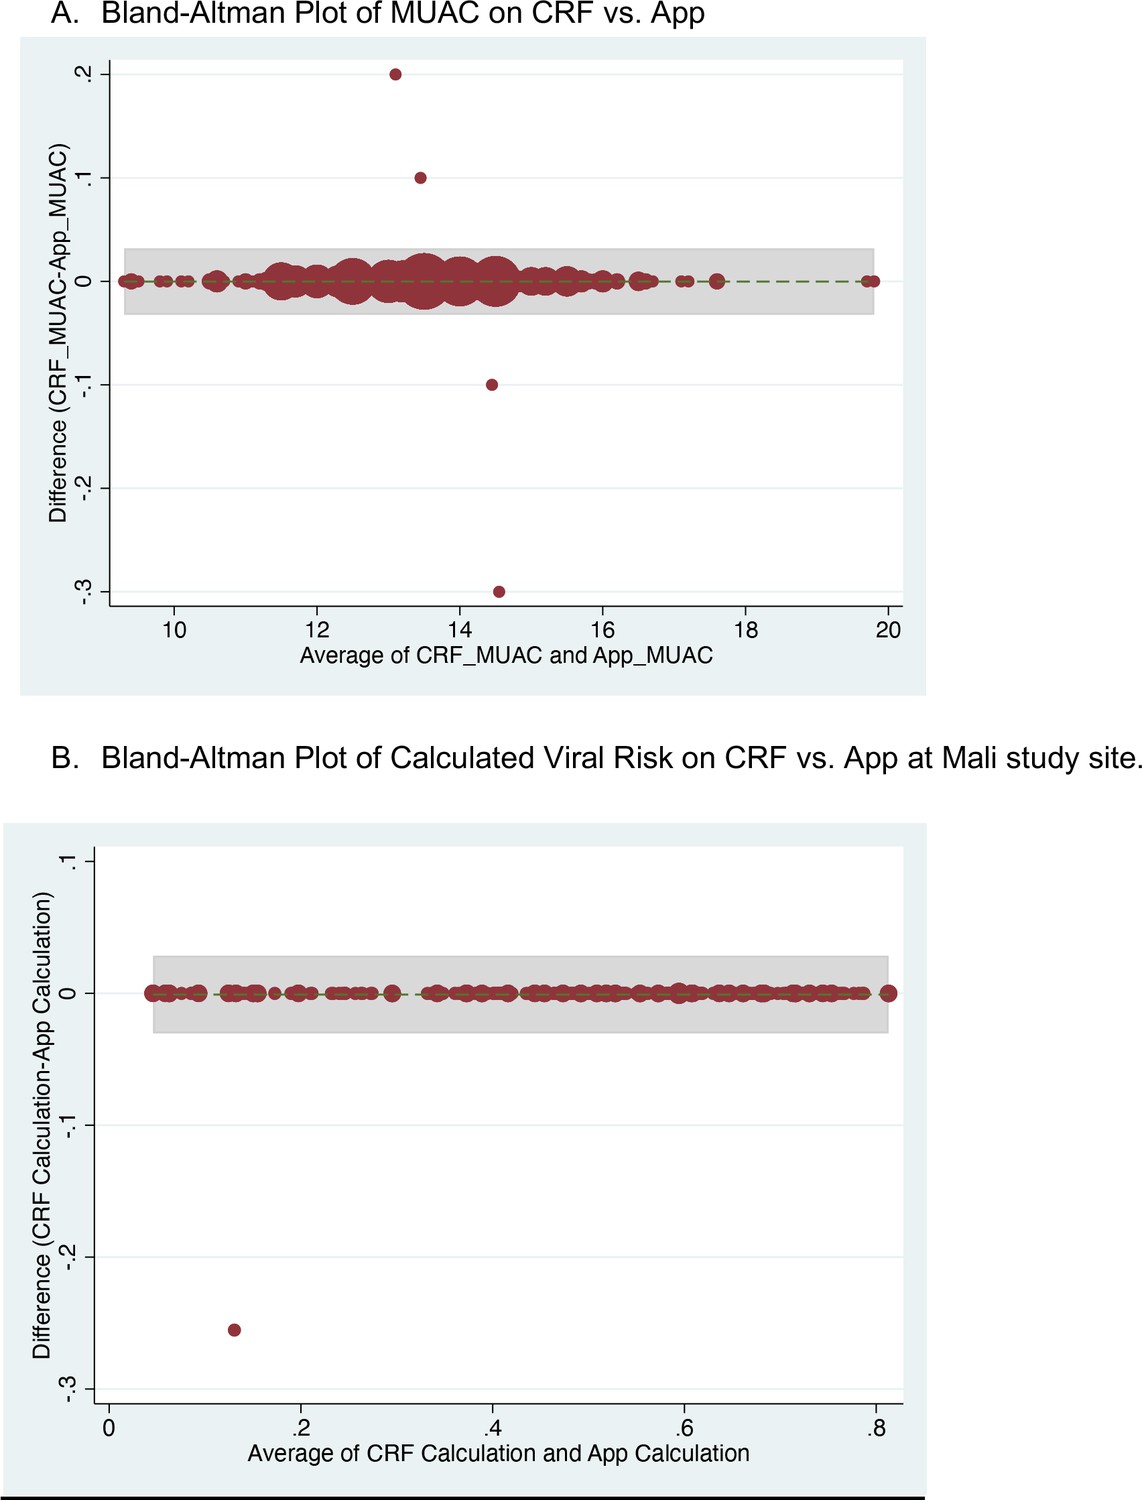
Bland-Altman plots showing agreement between data entered on case report form versus App for mid-upper arm circumference and calculated predicted viral-only etiology risk.
Tables
Table 1
Model terminology definitions and descriptions.
| Model name | Description and features included |
|---|---|
| Present patient | Random forest variable importance screening was used to screen variables for fitting a logistic regression model from the GEMS data including only five clinical variables (selected from candidate variables which would be accessible to clinicians at the point-of-care) Brintz et al., 2021. The five variables include: age, blood in stool (yes/no), vomiting (yes/no), breastfeeding status (yes/no), and mid-upper arm circumference (MUAC; as measured in cm) |
| Viral seasonality | This model included the standardized seasonal sine and cosine curves modeling the country-specific seasonal patterns of viral diarrhea |
| Climate | This model included rain and temperature averages using a two-week aggregation of the five nearest National Oceanic and Atmospheric Administration (NOAA)-affiliated weather stations to the hospital sites. |
| Historical patient (Pre-test odds) | Pre-test odds were generated using historical rates of viral diarrhea by site and date using data from the GEMS study. |
| Recent patient (Pre-test odds) | Pre-test odds were generated using data from patients in the prior four weeks. |
Table 2
Clinical characteristics of study population.
| Diarrhea etiology assigned | No diarrhea etiology assigned | |||||
|---|---|---|---|---|---|---|
| Overall n(%)N = 199 | Bangladesh n(%)N = 130 | Mali n(%)N = 69 | Overall n(%)N = 101 | Bangladesh n(%)N = 20 | Mali n(%)N = 81 | |
| Age (median, IQR), months | 12 (8) | 12 (9) | 11 (8) | 8 (7) | 11.5 (7) | 8 (7) |
| Sex | ||||||
| Male | 123 (61.8) | 77 (59.2) | 46 (66.7) | 63 (62.4) | 11 (55) | 52 (64.2) |
| Female | 76 (38.2) | 53 (40.8) | 23 (33.3) | 38 (37.6) | 9 (45) | 29 (35.8) |
| Diarrhea Duration (median, IQR), days | 2 (2) | 3 (1) | 0.6 (0.3) | 1.5 (2.3) | 3 (1.3) | 0.7 (0.1) |
| # Episodes of Diarrhea Past 24 hours (median, IQR) | 12 (9.5) | 15 (8) | 5 (3) | 6 (4) | 15 (3.5) | 5 (3) |
| Bloody Stool Reported | ||||||
| Yes | 7 (3.5) | 2 (1.5) | 5 (7.2) | 3 (3) | 0 (0) | 3 (3.7) |
| No | 192 (96.5) | 128 (98.5) | 64 (92.8) | 98 (97) | 20 (100) | 78 (96.3) |
| Fever Reported | ||||||
| Yes | 163 (81.9) | 119 (91.5) | 44 (63.8) | 66 (65.3) | 18 (90) | 48 (59.3) |
| No | 36 (18.1) | 11 (8.5) | 25 (36.2) | 35 (34.7) | 2 (10) | 33 (40.7) |
| Vomiting Reported** | ||||||
| Yes (original question format) | 73 (36.7) | 73 (56.2) | 12 (11.9) | 12 (60) | ||
| Yes (revised question format) | 81 (40.7) | 45 (34.6) | 36 (52.2) | 21 (20.8) | 5 (25) | 16 (19.8) |
| No | 45 (22.6) | 12 (9.2) | 33 (47.8) | 68 (67.3) | 3 (15) | 65 (80.2) |
| Breastfeeding | ||||||
| Yes (Partial or Exclusive) | 155 (77.9) | 99 (76.2) | 56 (81.2) | 89 (88.1) | 19 (95) | 70 (86.4) |
| No | 44 (22.1) | 31 (23.8) | 13 (18.8) | 12 (11.9) | 1 (5) | 11 (13.6) |
| MUAC (median, IQR), cm | 13.55 (1.4) | 13.45 (1.3) | 13.8 (1.5) | 13.35 (1.8) | 13.375 (2.2) | 13.35 (1.9) |
| Prior Medications Taken | ||||||
| Yes | 124 (62.3) | 109 (83.8) | 15 (21.7) | 34 (33.7) | 17 (85) | 17 (21) |
| No | 75 (37.7) | 21 (16.2) | 54 (78.3) | 67 (66.3) | 3 (15) | 64 (79) |
| Years of Mother’s Education | 8 (6) | 8 (5) | 4 (9) | 6 (10) | 8 (4.75) | 5 (10) |
| Years of Father’s Education | 8 (6) | 8 (5) | 6 (9) | 6 (10) | 10 (4.8) | 4 (10) |
| People living at home (median, IQR) | 6 (4) | 5 (2) | 9 (12) | 9 (10) | 6 (6) | 10 (9) |
| Abbreviations: IQR, interquartile range; cm, centimeter; MUAC, mid-upper arm circumference** Vomiting question was asked in two different formats at the Bangladesh site | ||||||
Table 3
Pathogens detected with TaqMan array card by study site.
| BangladeshN = 150 | MaliN = 150 | ||
|---|---|---|---|
| Pathogen | n (%) | Pathogen | n (%) |
| No Etiology Assigned | 20 (13) | No Etiology Assigned | 81 (54) |
| Viral-Only Pathogens | 94 (63) | Viral-Only Pathogens | 33 (22) |
| Rotavirus | 90 (60) | Rotavirus | 24 (16) |
| Adenovirus 40/41 | 1 (0.6) | Norovirus GII | 5 (3.3) |
| Astrovirus | 2 (1.3) | Astrovirus | 2 (1.3) |
| Adenovirus & Astrovirus | 1 (0.6) | Astrovirus & Rotavirus | 2 (1.3) |
| Bacterial-Only Pathogens | 9 (6) | Bacterial-Only Pathogens | 24 (16) |
| Vibrio cholerae | 3 (2) | Shigella / EIEC | 13 (8.7) |
| Shigella / Enteroinvasive E. coli (EIEC) | 1 (0.6) | Shiga-toxin Enterotoxigenic E. coli | 4 (2.7) |
| Campylobacter jejuni / coli | 1 (0.6) | Campylobacter jejuni / coli | 2 (1.3) |
| Multiple Bacterial Pathogens | 4 (2.7) | Salmonella | 2 (1.3) |
| Multiple Bacterial Pathogens | 3 (2) | ||
| Parasitic Pathogens | 1 (0.6) | Parasitic Pathogens | 5 (3.3) |
| Cryptosporidium | 1 (0.6) | Cryptosporidium | 4 (2.7) |
| Entamoeba histolytica | 1 (0.6) | ||
| Mixed Pathogens | 26 (17) | Mixed Pathogens | 7 (4.7) |
| Viral+ Bacteria | 24 (16) | Viral+ Bacteria | 7 (4.7) |
| Viral+ Bacterial + Parasitic | 2 (1.3) | ||
Table 4
Model performance using AUC (95% confidence interval), calibration-in-the-large (α), calibration slope (β) for each model considered at both sites.
Each row after ‘Present patient’ includes the Present patient component.
| Auc (95% CI) | α | β | |
|---|---|---|---|
| Present patient | 0.744 (0.651–0.836) | –0.212 (−0.264–-0.16) | 1.250 (1.171–1.329) |
| Viral seasonality | 0.754 (0.665–0.843) | –0.393 (−0.455–-0.331) | 1.287 (1.207–1.367) |
| Climate | 0.680 (0.583–0.778) | –0.115 (−0.191–-0.038) | 0.940 (0.840–1.039) |
| Historical patient | 0.702 (0.603–0.800) | 0.036 (−0.031–0.102) | 1.063 (0.943–1.184) |
| Recent patient | 0.737 (0.671–0.793) | –0.253 (−0.287–-0.22) | 1.165 (1.12–1.21) |
Table 5
AUC (95% confidence interval) for each model by site.
Each row after ‘Present patient’ includes the Present patient component. The last column includes Bangladesh data in which the vomiting question was asked incorrectly.
| Mali | Bangladesh | Bangladesh (no date restriction) | |
|---|---|---|---|
| Present patient | 0.763 (0.681–0.844) | 0.692 (0.572–0.812) | 0.607 (0.521–0.693) |
| Viral seasonality | 0.742 (0.659–0.825) | 0.71 (0.595–0.825) | 0.61 (0.523–0.697) |
| Climate | 0.701 (0.577–0.825) | 0.607 (0.427–0.788) | 0.621 (0.510–0.732) |
| Historical patient | 0.741 (0.658–0.824) | 0.646 (0.516–0.775) | 0.592 (0.505–0.86) |
| Recent patient | 0.783 (0.705–0.86) | 0.625 (0.5–0.75) | 0.61 (0.526–0.694) |
Additional files
-
Supplementary file 1
Descriptive data – demographics, predictors and viral-only outcome data from development dataset from GEMS.
- https://cdn.elifesciences.org/articles/72294/elife-72294-supp1-v2.docx
-
Supplementary file 2
List of Pathogen Targets for Taqman Array Card Testing.
- https://cdn.elifesciences.org/articles/72294/elife-72294-supp2-v2.docx
-
Supplementary file 3
Assessment of reliability and agreement between study nurses’ independent assessments of categorical predictor variables on case report forms.
- https://cdn.elifesciences.org/articles/72294/elife-72294-supp3-v2.docx
-
Supplementary file 4
Agreement between study nurse recording on paper case record and input into App of categorical predictor variables.
- https://cdn.elifesciences.org/articles/72294/elife-72294-supp4-v2.docx
-
Supplementary file 5
De-identified Dataset.
- https://cdn.elifesciences.org/articles/72294/elife-72294-supp5-v2.csv
-
Transparent reporting form
- https://cdn.elifesciences.org/articles/72294/elife-72294-transrepform1-v2.docx
Download links
A two-part list of links to download the article, or parts of the article, in various formats.
Downloads (link to download the article as PDF)
Open citations (links to open the citations from this article in various online reference manager services)
Cite this article (links to download the citations from this article in formats compatible with various reference manager tools)
External validation of a mobile clinical decision support system for diarrhea etiology prediction in children: A multicenter study in Bangladesh and Mali
eLife 11:e72294.
https://doi.org/10.7554/eLife.72294


