Allosteric cooperation in β-lactam binding to a non-classical transpeptidase
- Department of Biochemistry, School of Chemical and Life Sciences, Jamia Hamdard University, India
- Department of Infectious Diseases, Centre for Tuberculosis Research, Johns Hopkins University, United States
- Translational Health Science and Technology Institute, NCR Biotech Science Cluster, India
- 4Jerzy Haber Institute of Catalysis and Surface Chemistry, Polish Academy of Sciences, Poland
Figures
Figure 1 with 1 supplement
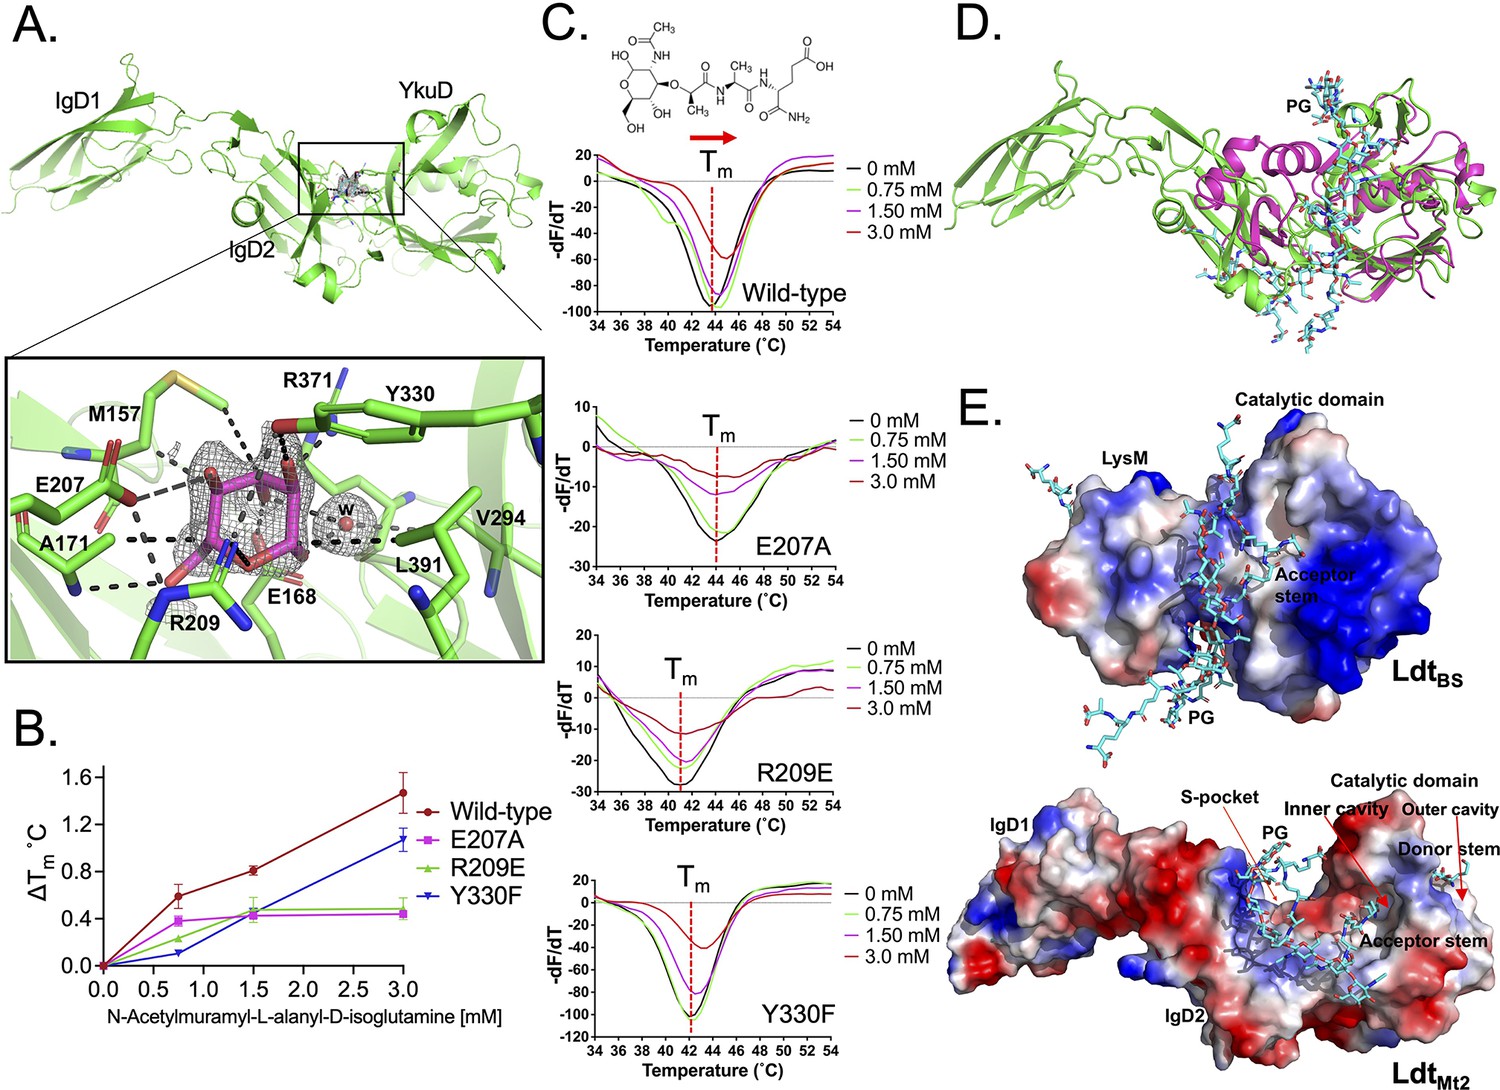
Binding studies of peptidoglycan (PG) with LdtMt2.
(A) Crystal structure of LdtMt2 in complex with one glucose molecule. The inset shows the 2Fo-Fc omit map (contoured at 1.0σ) of glucose (cyan colour) modelled into the S-pocket of LdtMt2 in the crystal structure. (B) ThermoFluor assay for binding studies with the PG-precursor N-acetylmuramyl-L-alanyl-D-isoglutamine hydrate with wild-type LdtMt2, R209E, E207A, and Y330F mutants. A change in melting temperature (∆Tm) at y-axis was plotted against the ligand concentrations at x-axis in GraphPad Prism software. (C) Differential fluorescence (−dF/dT) graphs of ThermoFluor assay for LdtMt2 and mutants. The dotted line indicates the Tm, and a red arrow indicates the direction of thermal shift. A chemical structure above the ThermoFluor assay graph is N-acetylmuramyl-L-alanyl-D-isoglutamine hydrate. (D) Superposition of LdtMt2 (green) with PG-bound LdtBs, the Bacillus subtilis L,D-transpeptidase (PDB ID: 2MTZ) (pink). YkuD domain of LdtMt2 was superposed with catalytic domain of ldtBS with an RMSD of 1.46 Å. PG chain is shown in cyan colour. (E) Modelling of PG (cyan colour) into the LdtMt2 (green). Electrostatic potential (negative in red, positive in blue) highlights the acidic and positively charge surface and binding of PG chain in L,D-transpeptidases LdtBS and LdtMt2.
-
Figure 1—source data 1
Raw data on ThermoFluor study of peptidoglycan (PG) substrate binding with wild-type and mutants.
- https://cdn.elifesciences.org/articles/73055/elife-73055-fig1-data1-v3.xlsx
Figure 1—figure supplement 1
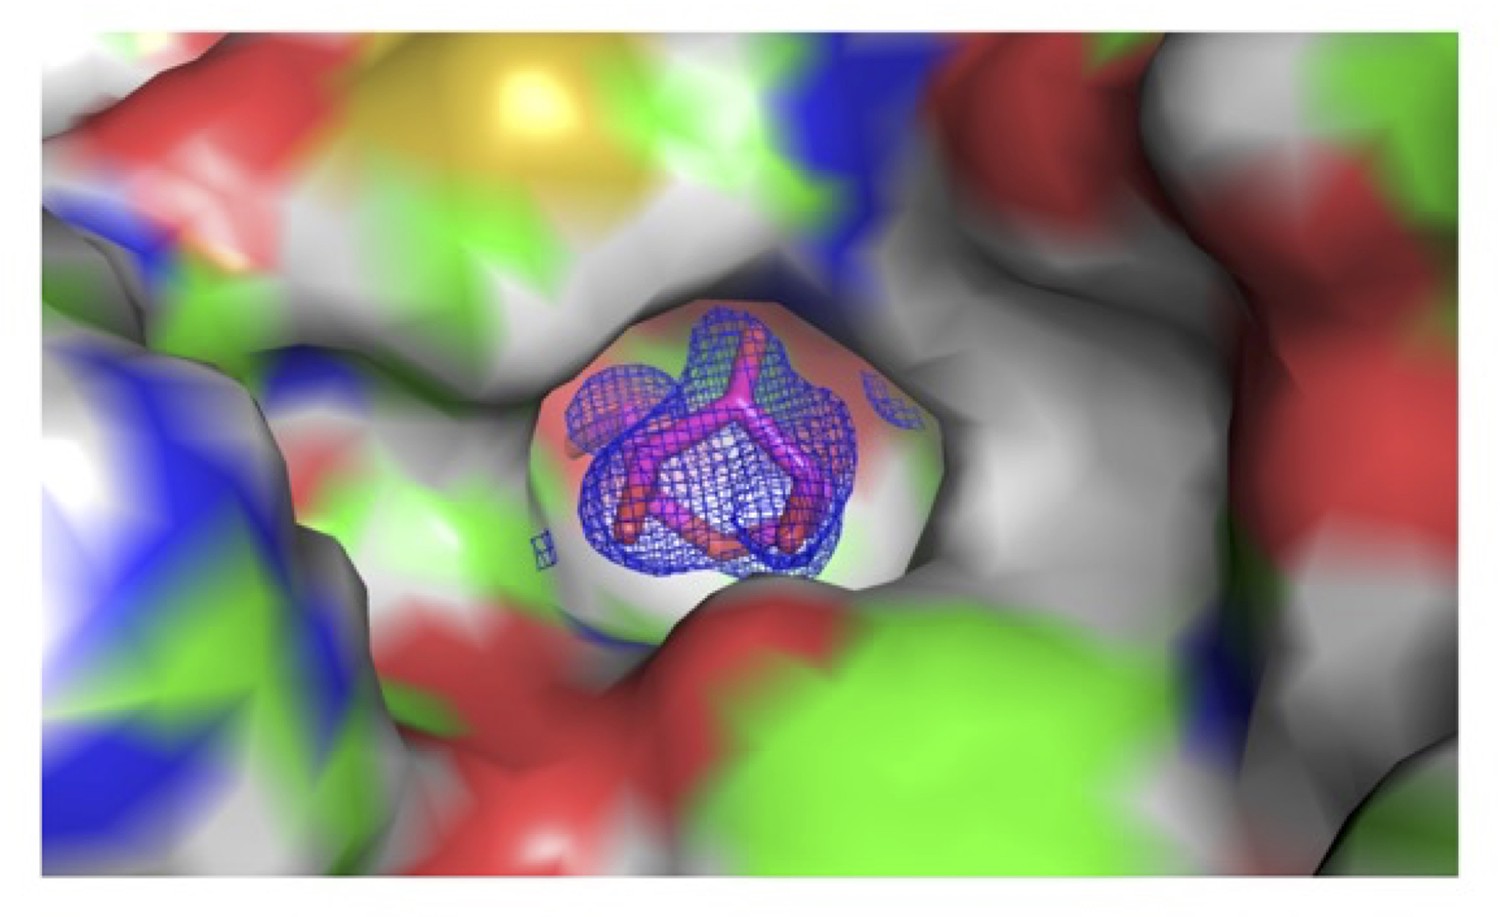
2Fo-Fc map of sugar bound into the S-pocket of LdtMt2 in the crystal structure.
S-pocket is represented in surface. Sugar is shown in stick model in pink colour. 2Fo-Fc map is shown in blue colour and contoured at 1.0σ.
Figure 2 with 1 supplement
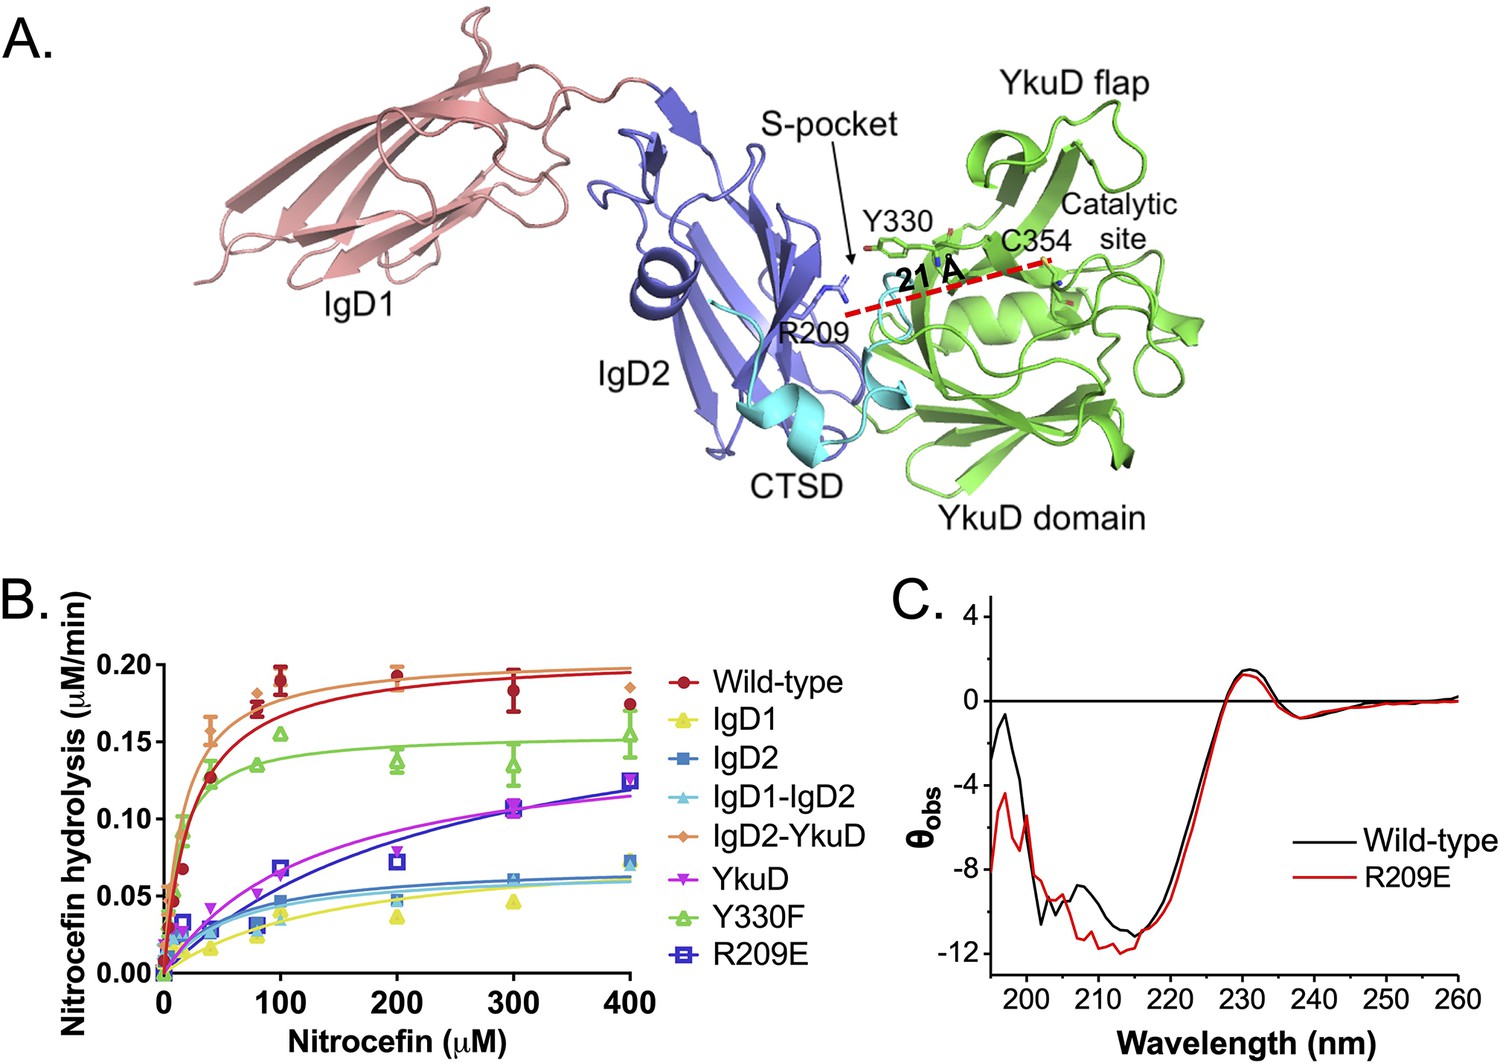
Role of the S-pocket in β-lactam hydrolysis.
(A) The structure of LdtMt2 with each domain highlighted: IgD1 (orange), IgD2 (blue), YkuD domain (green), and C-terminal subdomain (CTSD) (cyan). A red dotted line demarcates the 21 Å distance between the S-pocket and the catalytic site. (B) Chromogenic nitrocefin hydrolysis activity of truncated LdtMt2 fragments corresponding to the IgD1, IgD2, IgD1–IgD2, YkuD, IgD2-YkuD domains, R209E, and Y330F mutants. (C) Circular dichroism (CD) spectra of wild-type and R209E mutant.
-
Figure 2—source data 1
Raw data on nitrocefin hydrolysis assay.
- https://cdn.elifesciences.org/articles/73055/elife-73055-fig2-data1-v3.xlsx
Figure 2—figure supplement 1
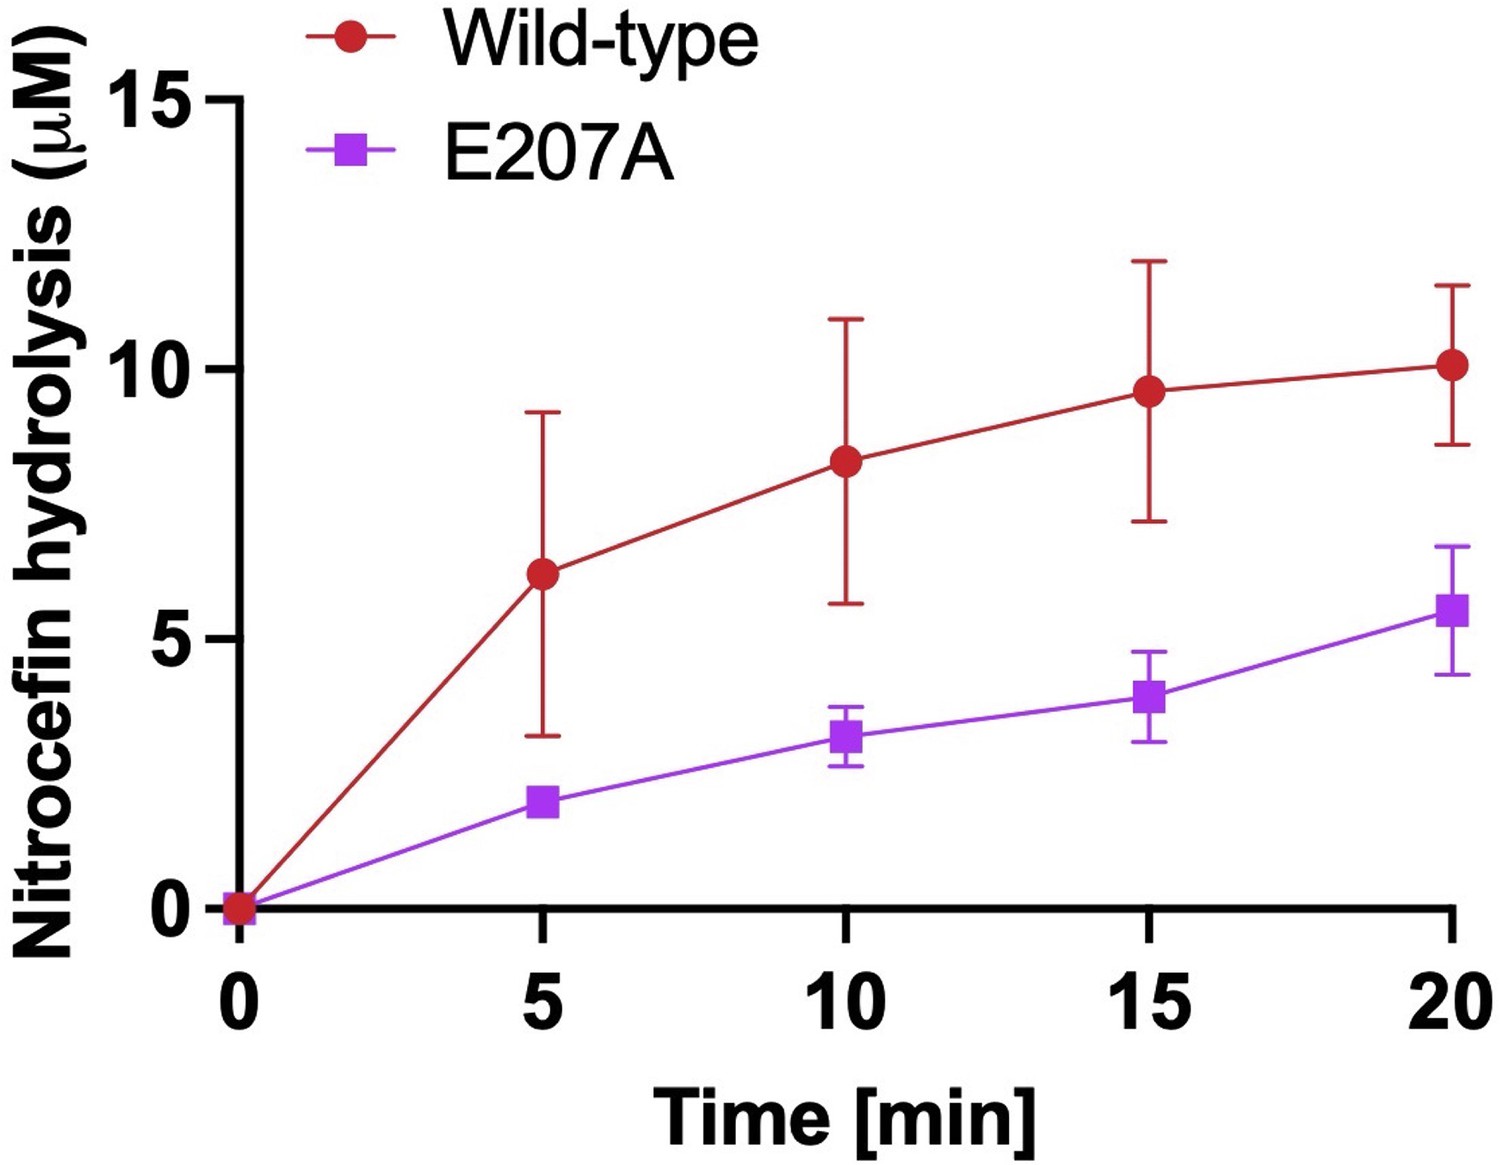
Chromogenic nitrocefin hydrolysis activity of wild-type LdtMt2 and E207A mutant.
Figure 3 with 3 supplements
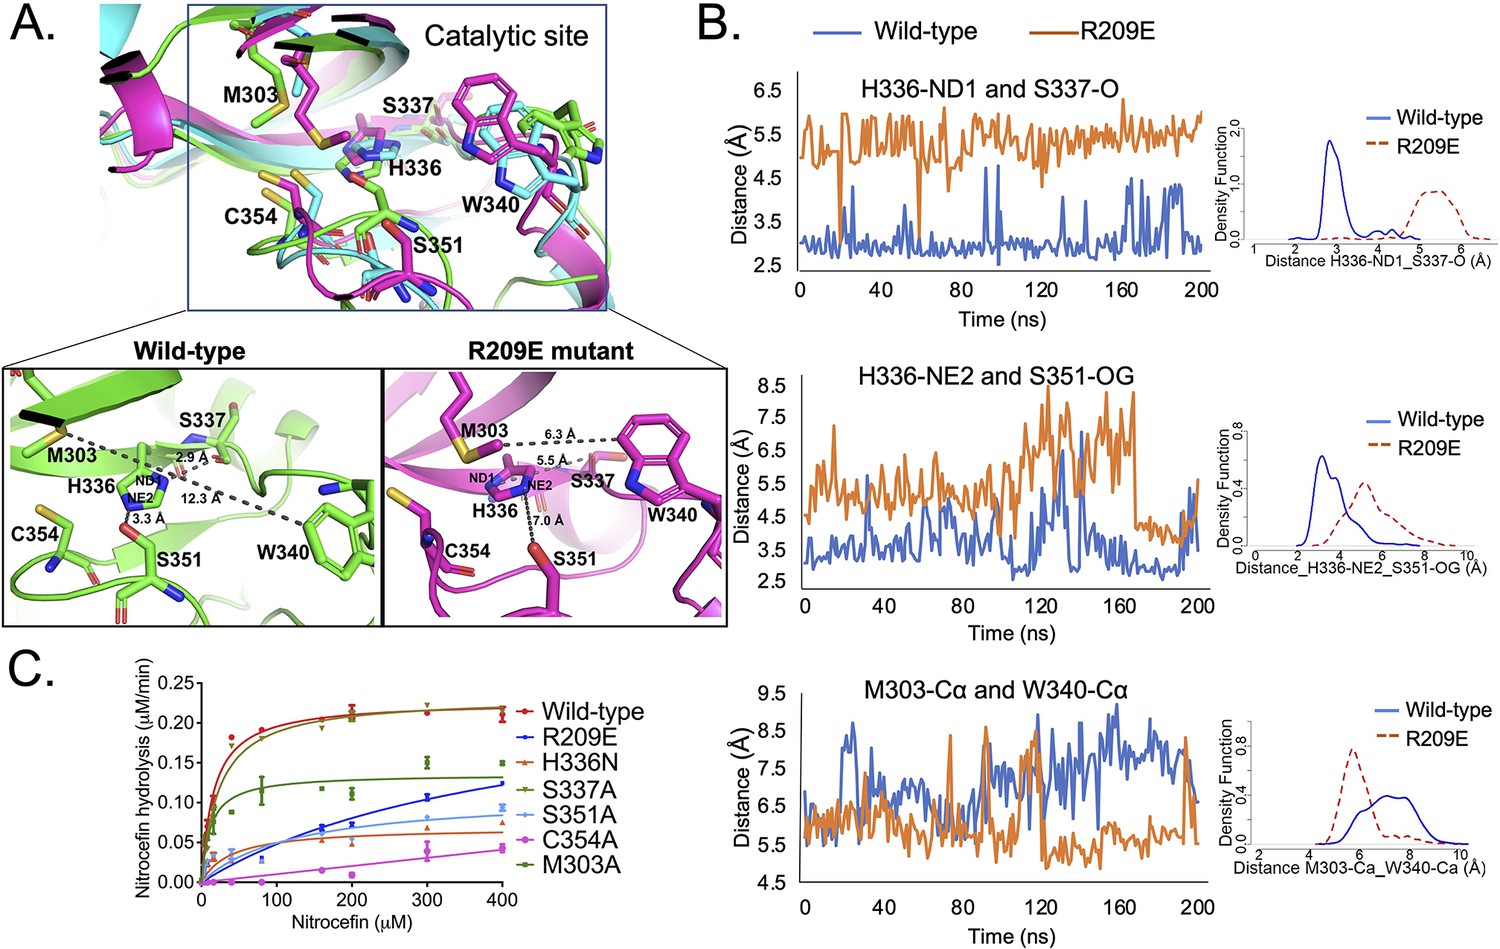
S-pocket crosstalk with the catalytic site of LdtMt2.
(A) Superposition of molecular dynamic (MD) simulated structures of catalytic site of wild-type LdtMt2 (146–408 residues, green) and the R209E mutant (146–408 residues, pink) at 150 ns trajectory along with a trajectory (cyan) at 0 ns. The inset shows a detailed view of the catalytic site of the wild-type protein and R209E mutant at 150 ns trajectory. (B) Dynamic distance analysis of key residue pairs vs. simulation time calculated from 200 ns of MD simulation run. A density function graph is also plotted. (C) Chromogenic nitrocefin hydrolysis activity of wild-type LdtMt2 and different mutants with alterations in both the S-pocket and catalytic site.
-
Figure 3—source data 1
Raw data on dynamic distance network analysis.
- https://cdn.elifesciences.org/articles/73055/elife-73055-fig3-data1-v3.xlsx
-
Figure 3—source data 2
Raw data on nitrocefin hydrolysis assay.
- https://cdn.elifesciences.org/articles/73055/elife-73055-fig3-data2-v3.xlsx
-
Figure 3—source data 3
Raw data on network analysis of wild-type LdtMt2 and R209E mutant.
- https://cdn.elifesciences.org/articles/73055/elife-73055-fig3-data3-v3.xlsx
Figure 3—figure supplement 1
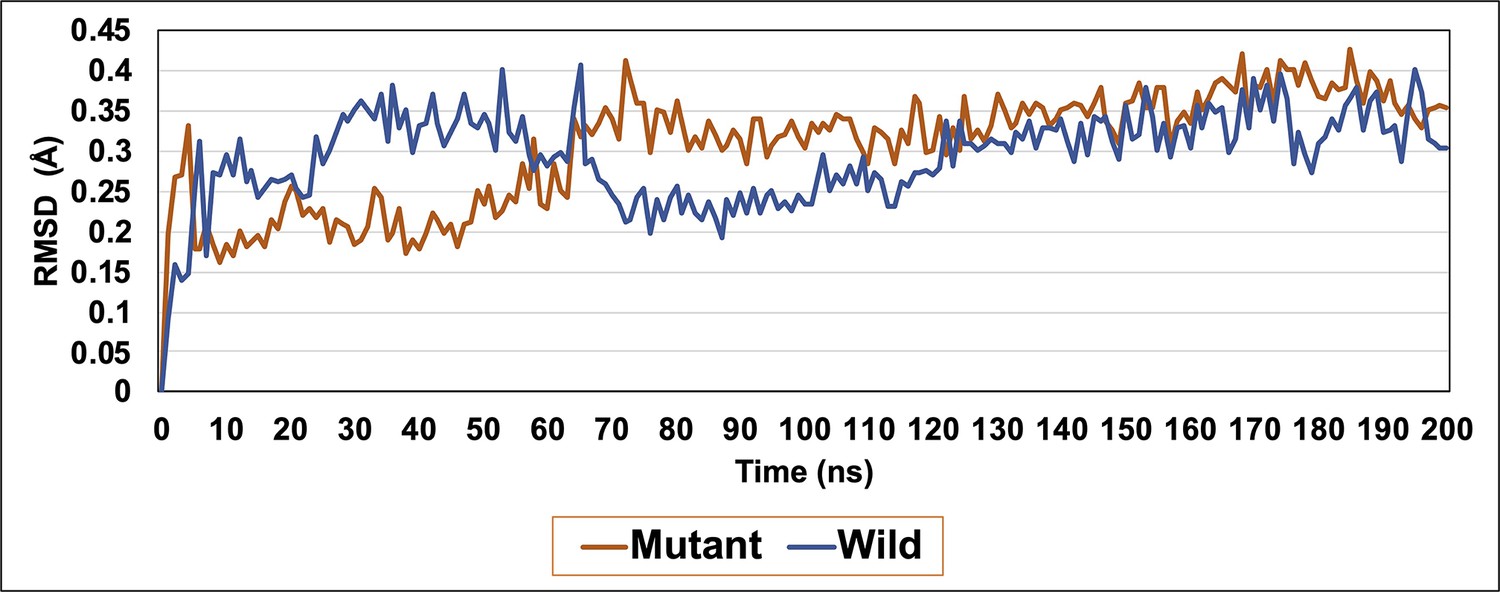
RMSD graph of wild-type LdtMt2 (blue) and R209 mutant (orange) over the duration of 200 ns of molecular dynamic (MD) simulations.
Figure 3—figure supplement 2
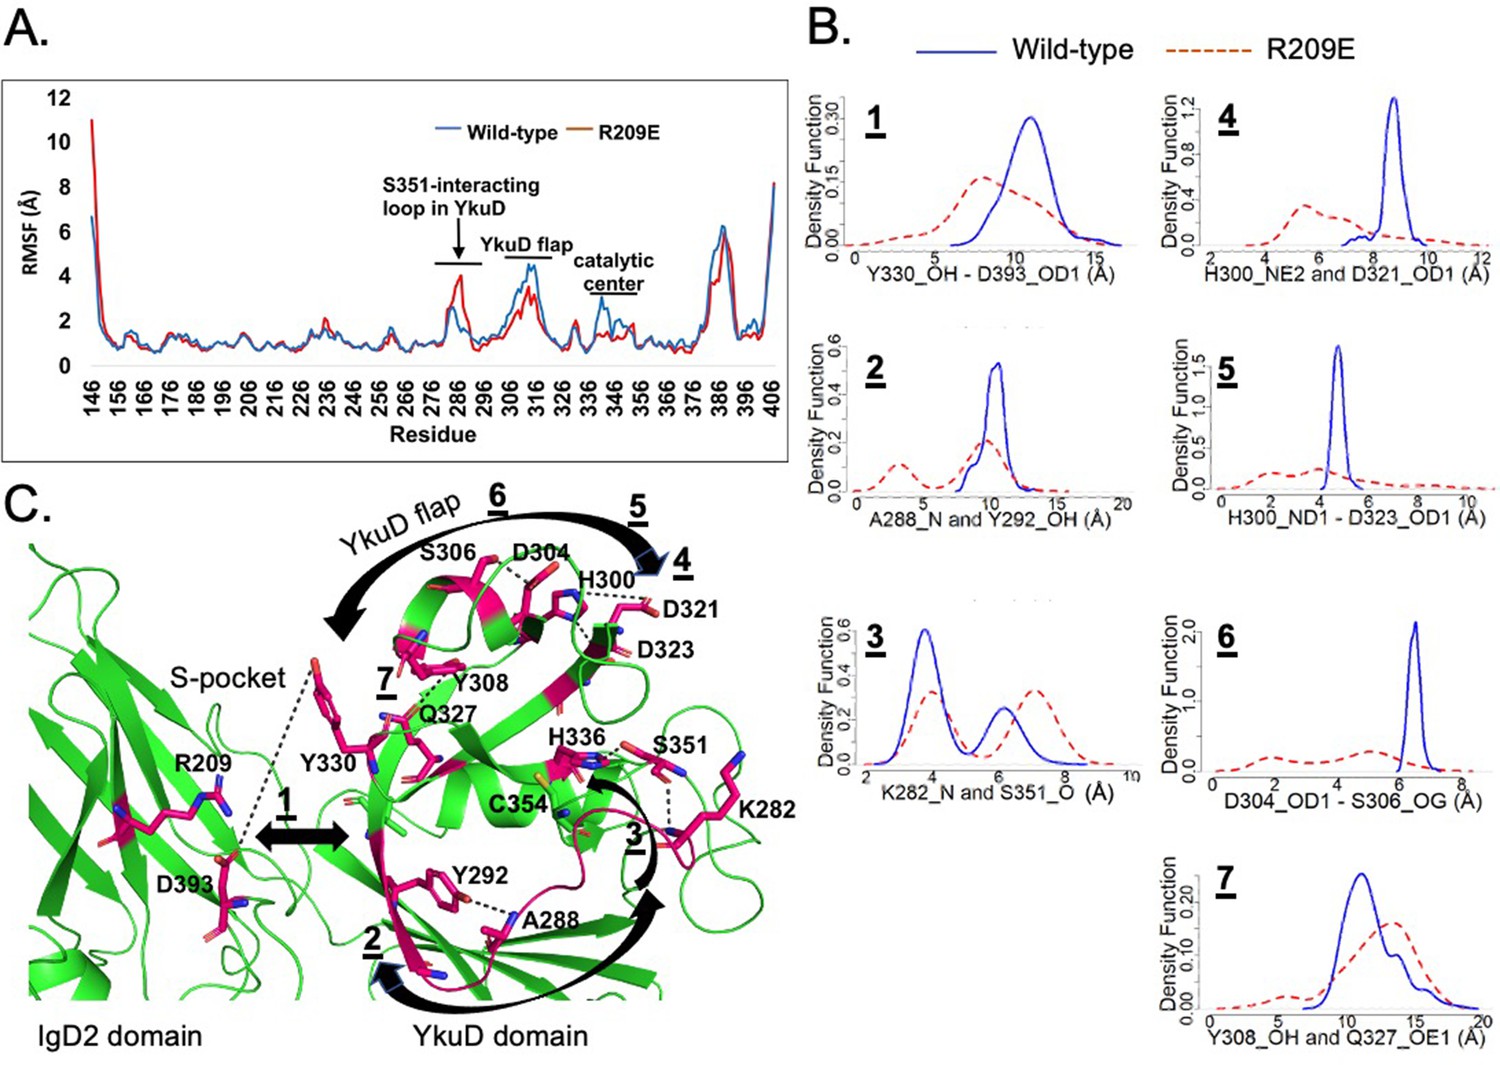
An analysis of dynamics in-between the S-pocket and catalytic site in LdtMt2.
(A) Root mean square fluctuation (RMSF) graph of wild-type LdtMt2 (blue) and R209 mutant (orange) over the duration of 200 ns of molecular dynamic (MD) simulations. (B) A density function graph of network analysis of dynamic distance between selected pair of amino acid residues in LdtMt2. (C) Structure of LdtMt2 (green colour) with highlighted residue pairs (shown in stick model and pink colour) that undergo alterations in the dynamics subsequent upon mutation in R209 residue.
Figure 3—figure supplement 3
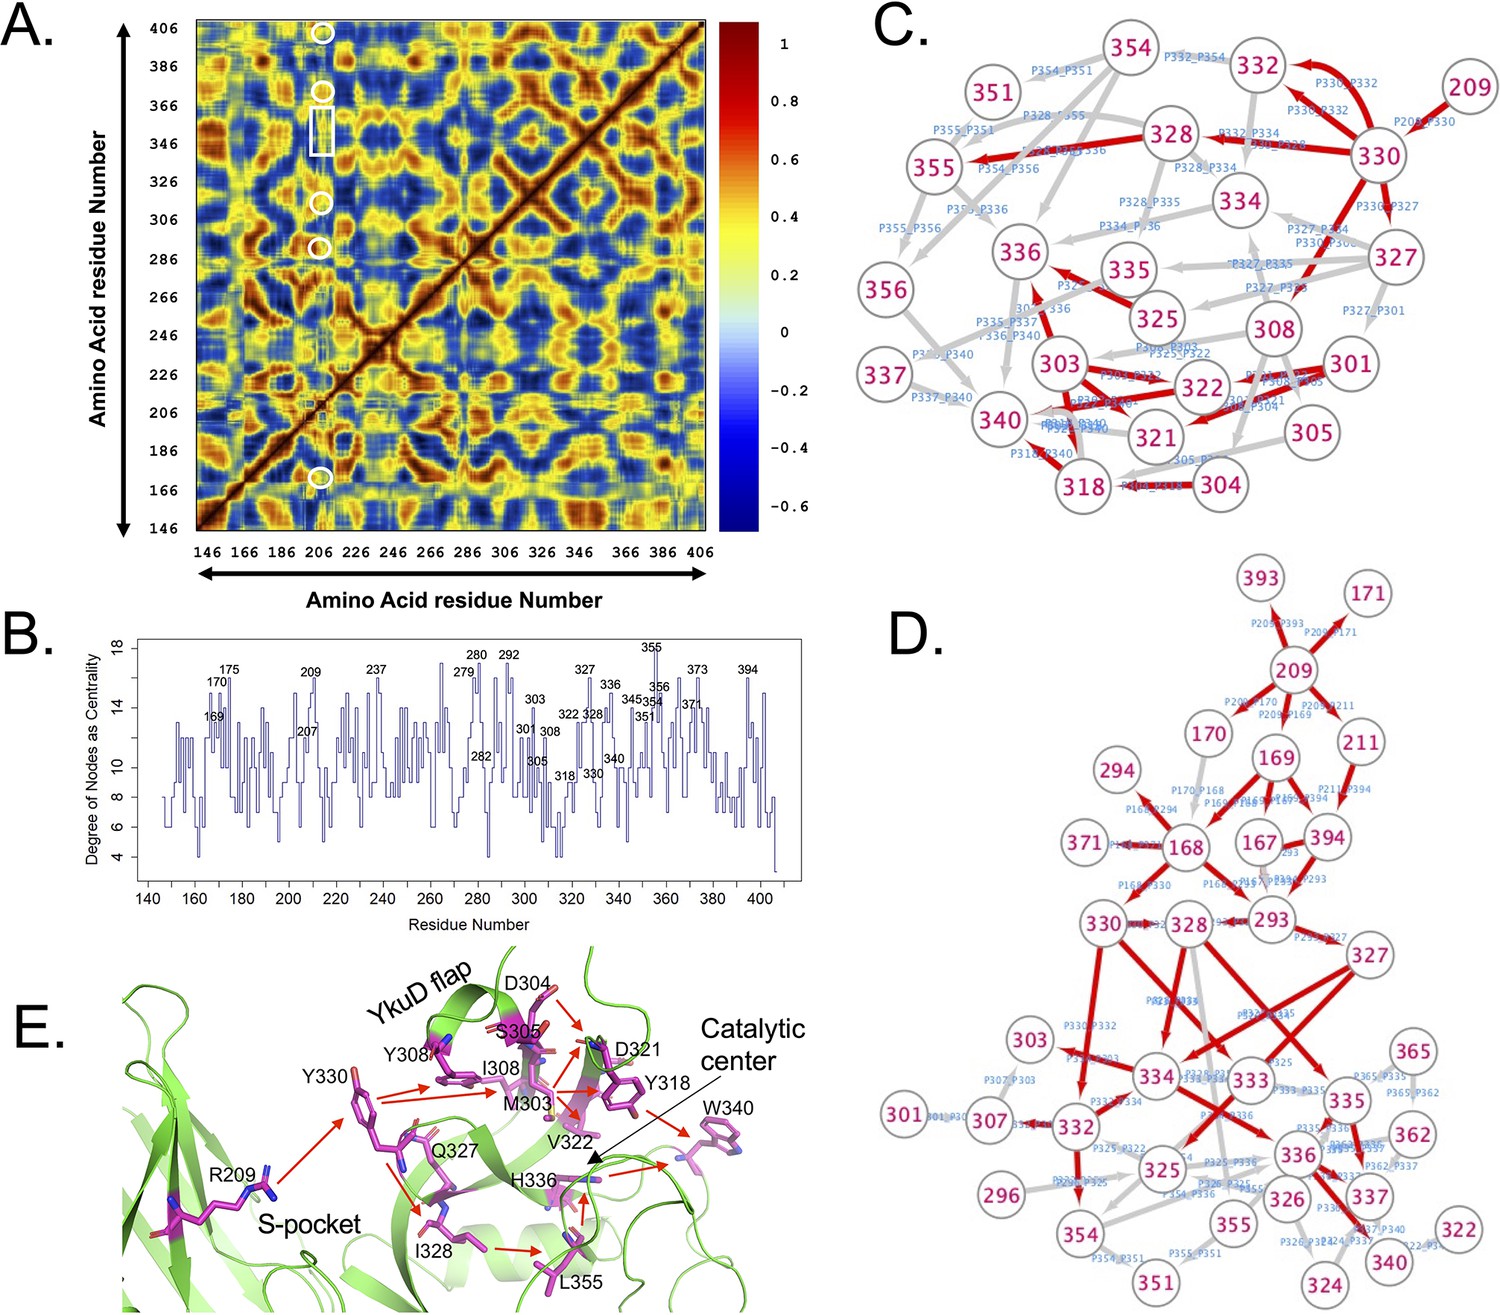
Network analysis of LdtMt2 dynamics.
(A) Plotted correlation map showing a coupling of dynamic motions between residues. Highlighted white boxes show positive correlation (>0 value) of R209 residue with other residues from the S-pocket and catalytic site. (B) Graph of centrality measure vs. each amino acid residue. The higher the centrality values, the more likely is the residue (node) important for the three-dimensional fold of the protein and network of interactions. (C, D) Network paths computed in cytoscape from the simulation of wild-type and R209E mutant protein from 209 residue towards catalytic site residues. Red arrows indicate edges with >6 threshold of betweenness. (E) Structure of LdtMt2 representing the flow of network of allosteric communications from the S-pocket to catalytic site.
Figure 4 with 3 supplements
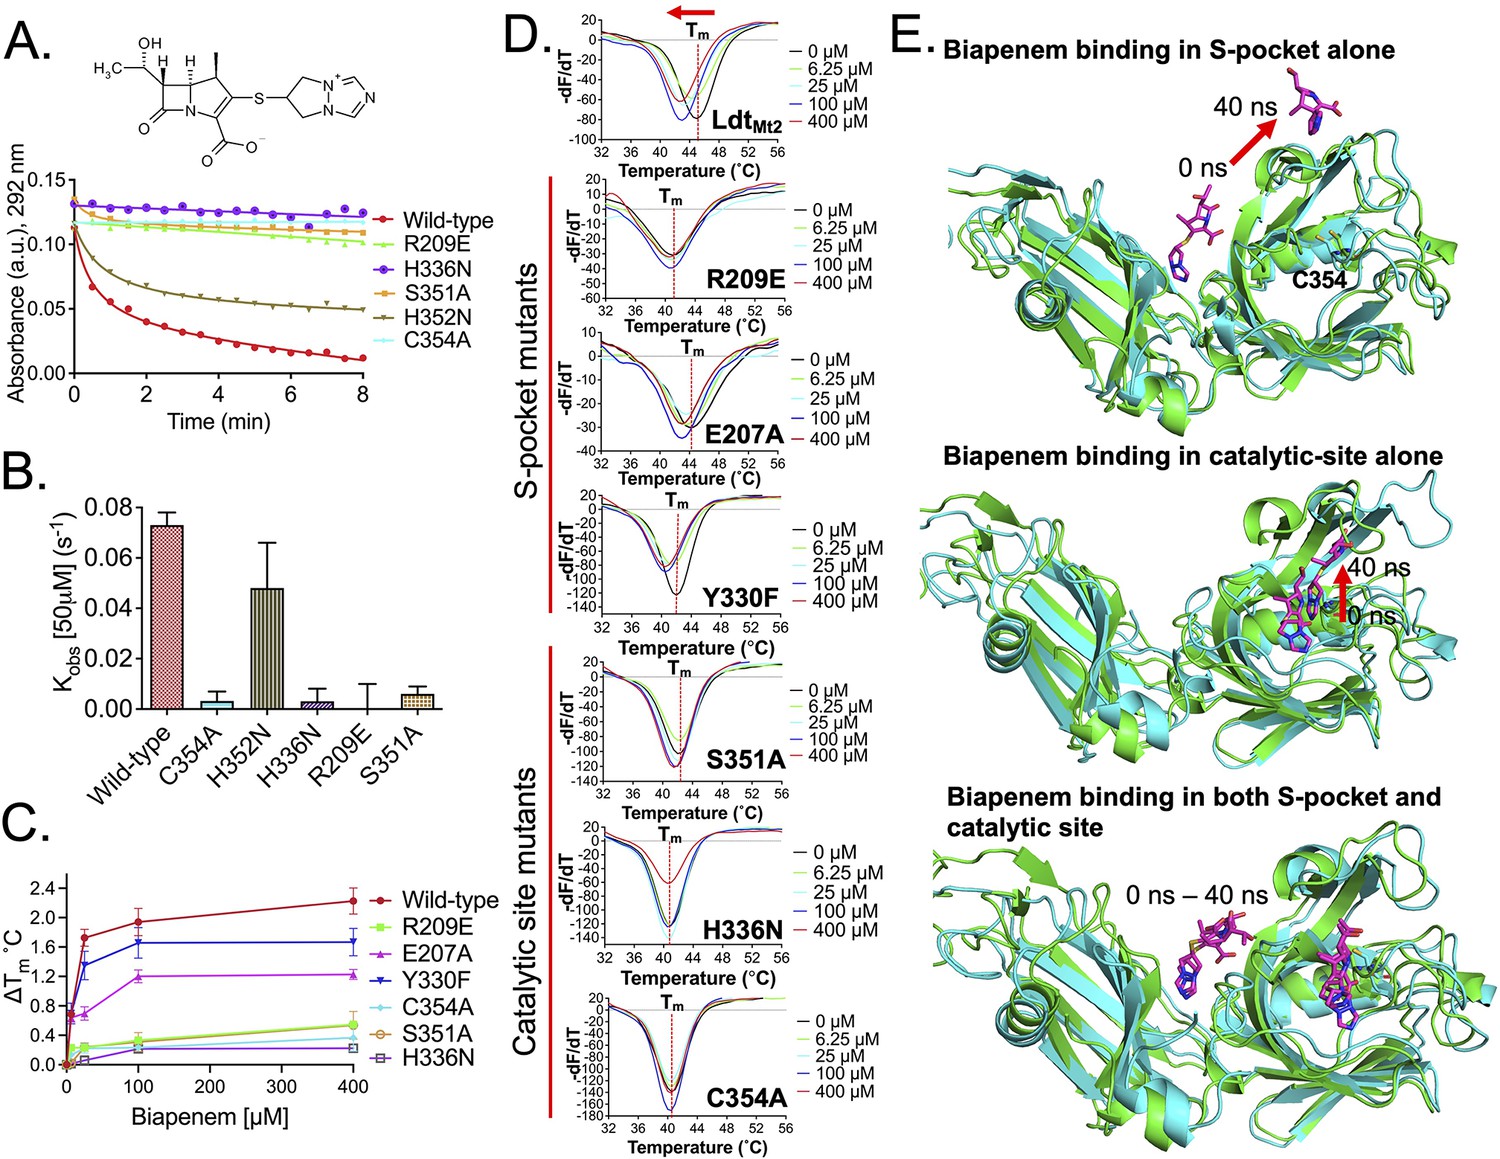
Role of the S-pocket and catalytic site in recognizing biapenem.
(A) Acylation activity of biapenem with LdtMt2 and mutants R209E, H336N, S351A, H352N, and C354A was monitored at 292 nm wavelength using UV–visible spectrophotometry. Maximum absorbance spectra of biapenem were found at 292 nm that was used to monitor decrease in biapenem concentration upon acylation with the LdtMt2. The chemical structure of biapenem is shown above the biapenem acylation graph. (B) Rate of acylation of 50 µM biapenem per second with LdtMt2 and mutants. (C) ThermoFluor assays for binding of biapenem with LdtMt2 and mutants R209E, E207A, Y330F, S351A, H336N, and C354A mutants. A change in melting temperature (∆Tm) was plotted at y-axis verses the ligand concentrations at x-axis in GraphPad Prism software. (D) Differential fluorescence (−dF/dT) graphs of ThetrmoFluor assay for LdtMt2 and mutants. The dotted line indicates the Tm, and a red arrow indicates the direction of thermal shift. (E) Molecular dynamic (MD) simulations of LdtMt2 in complex with biapenem. LdtMt2 is represented in cartoon with green colour at 0 ns and cyan colour after running the MD simulations at 40 ns, and biapenem is represented in stick model with pink colour. The red arrow indicates the movement of biapenem to a second position revealed by the MD simulations after 40 ns trajectory.
-
Figure 4—source data 1
Raw data for biapenem acylation assay.
- https://cdn.elifesciences.org/articles/73055/elife-73055-fig4-data1-v3.xlsx
-
Figure 4—source data 2
Raw data from ThermoFluor assay for biapenem binding with wild-type and mutants.
- https://cdn.elifesciences.org/articles/73055/elife-73055-fig4-data2-v3.xlsx
Figure 4—figure supplement 1
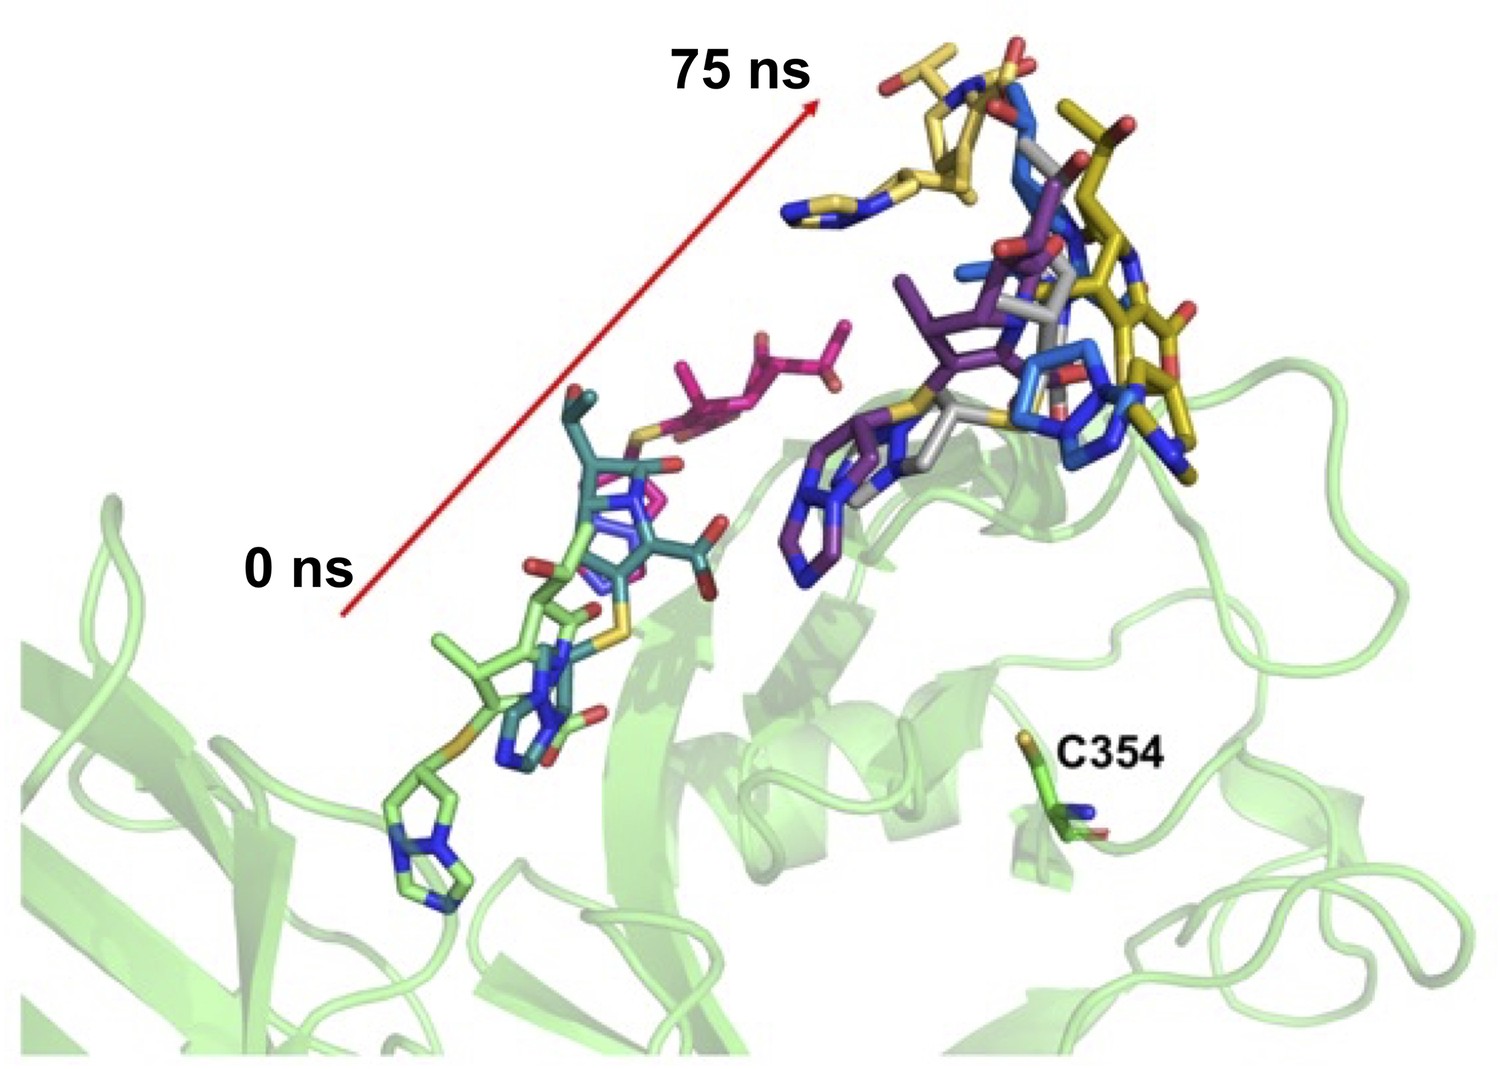
Molecular dynamic (MD) trajectory of biapenem bound in S-pocket alone in LdtMt2–BiaS structure.
A red arrow indicates the direction of movement of biapenem during an overall 75 ns of MD simulation. LdtMt2 is represented in cartoon in green colour and biapenem in various trajectories is represented in stick model.
Figure 4—figure supplement 2
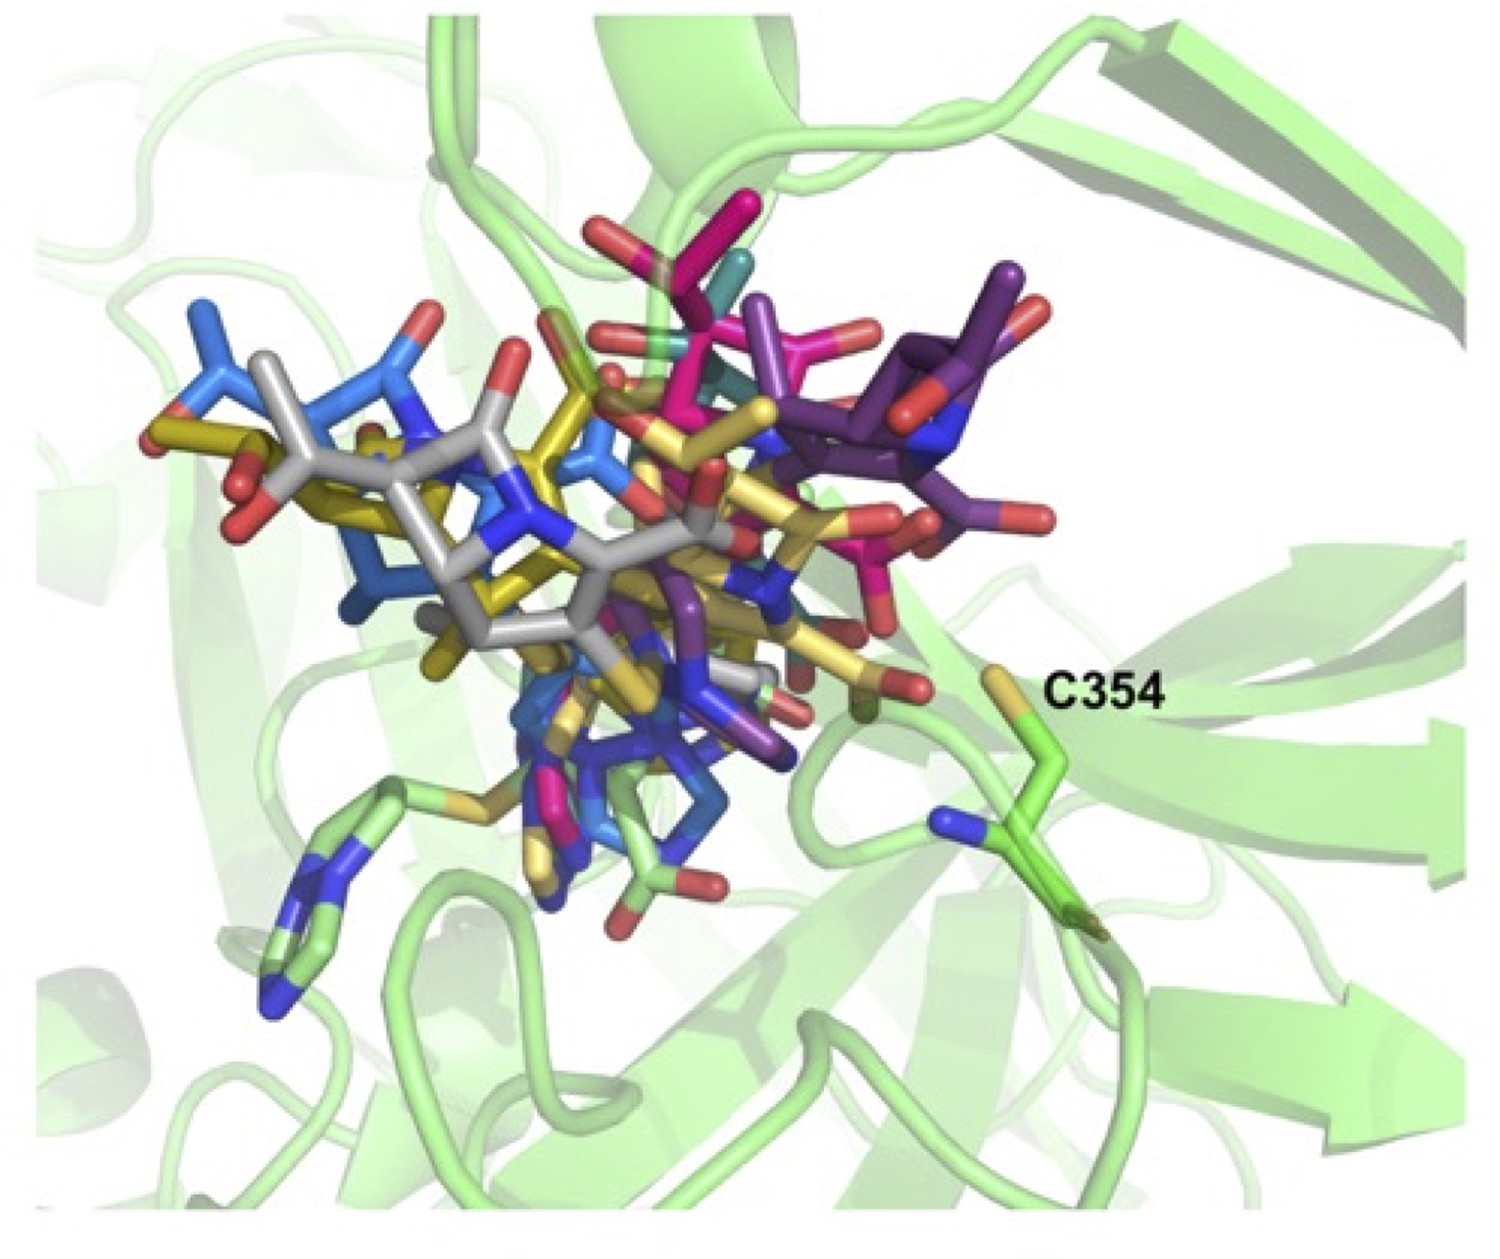
Molecular dynamic trajectory of biapenem bound in catalytic site alone in LdtMt2–BiaC structure.
LdtMt2 is represented in cartoon in green colour and biapenem in various trajectories is represented in stick model.
Figure 4—figure supplement 3
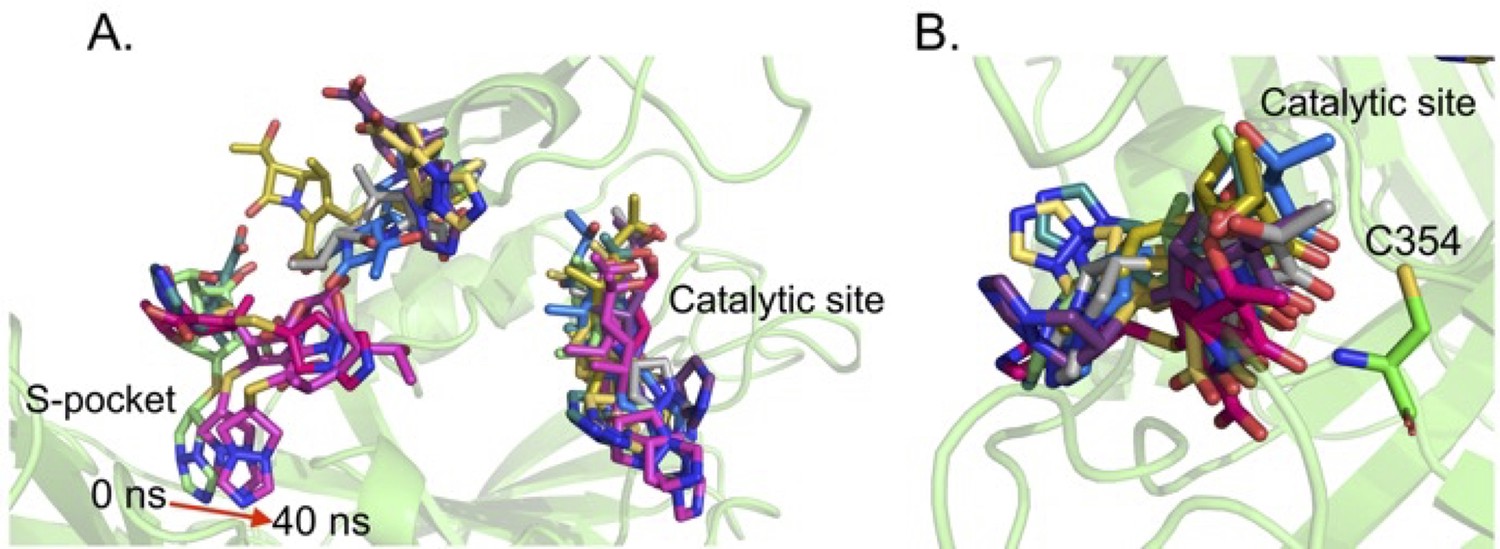
Molecular dynamic trajectory of dual biapenem bound in both S-pocket and catalytic site in LdtMt2–BiaS-C structure.
(A) Snapshots of biapenem from both S-pocket and catalytic site. (B) Snapshots of biapenem from catalytic site. LdtMt2 is represented in cartoon in green colour and biapenem in various trajectories is represented in stick model.
Figure 5 with 1 supplement
Binding of various subclasses of β-lactams to the S-pocket.
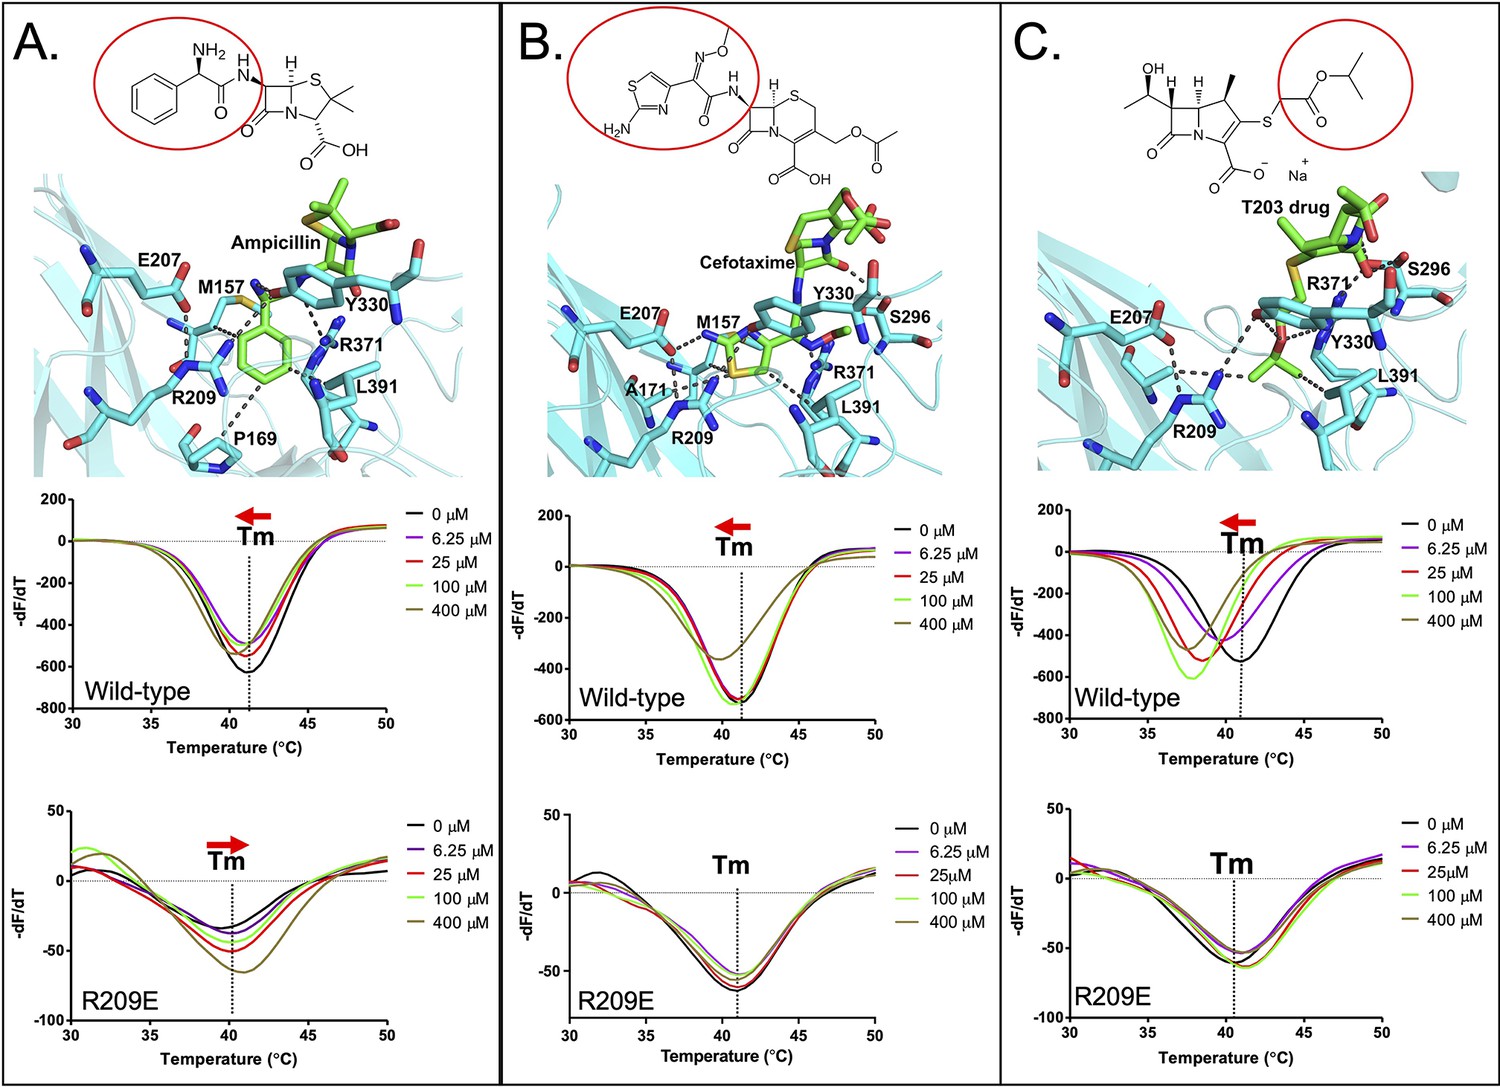
(A) Top: ampicillin (stick model in green) bound to the S-pocket (cyan) of LdtMt2 through its R1 group side chain, 2-amino-2-phenylacetyl (red oval). Bottom: ThermoFluor assays for binding studies of ampicillin with wild-type LdtMt2 and the R209E mutant. (B) Top: cefotaxime (stick model in green) bound to the S-pocket (cyan) of LdtMt2 through its R1 group side chain, thiozol-4yl (red oval). Bottom: ThermoFluor assays for binding studies of cefotaxime with wild-type LdtMt2 and the R209E mutant. (C) Top: the experimental carbapenem drug T203 (stick model in green) bound to the S-pocket (cyan) of LdtMt2 through its R3 group side chain, 2-isopropoxy-2-oxoethyl (red circle). Bottom: ThermoFluor assays for binding studies of T203 drug with wild-type LdtMt2 and the R209E mutant.
-
Figure 5—source data 1
Raw data from ThermoFluor assay for β-lactam binding with wild-type and mutants.
- https://cdn.elifesciences.org/articles/73055/elife-73055-fig5-data1-v3.xlsx
Figure 5—figure supplement 1
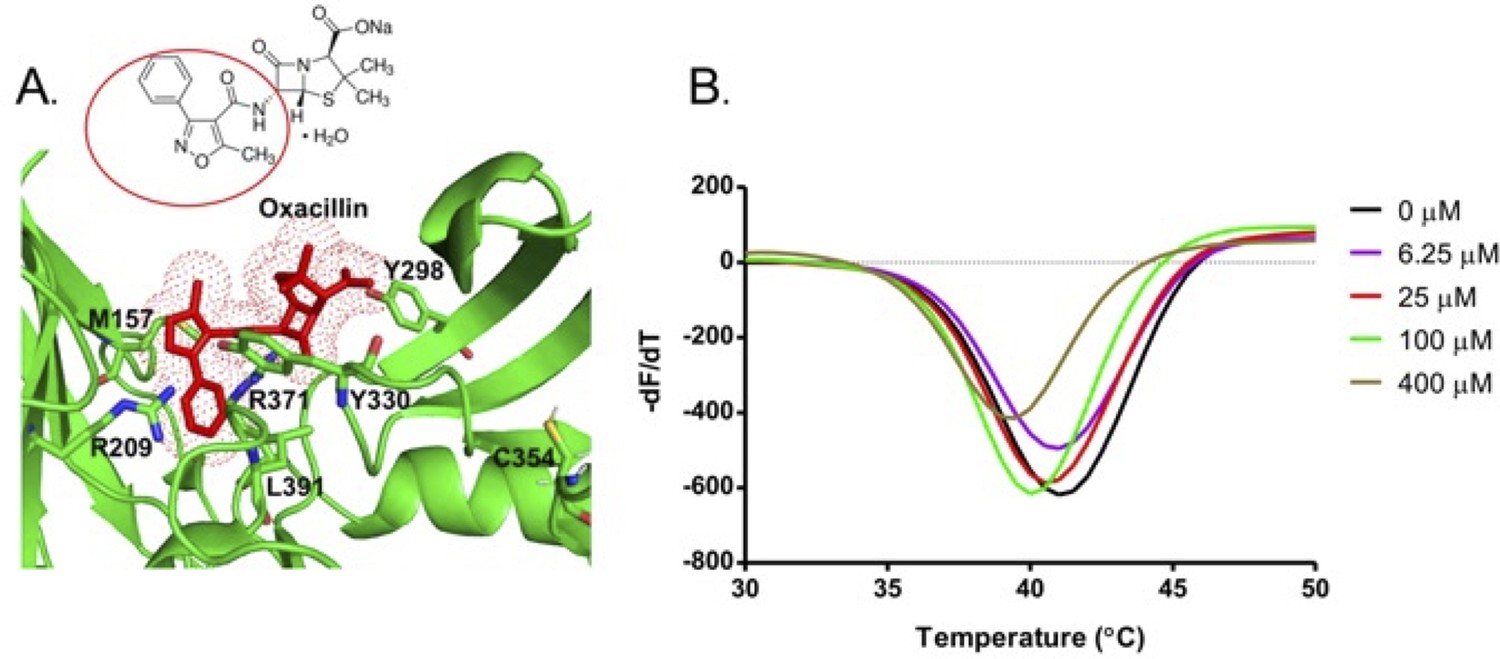
Binding of oxacillin drug to the S-pocket.
(A) Oxacillin (stick model, red colour) bound into the S-pocket (green colour) of LdtMt2 through R1 group side chain 5-methyl-3-phenyl-1,2-oxazole-4-carbonyl. 5-Methyl-3-phenyl-1,2-oxazole-4-carbonyl group is highlighted with red circle in the chemical structure of oxacillin. (B) ThermoFluor assay for binding studies of oxacillin with wild-type LdtMt2.
Figure 6 with 2 supplements
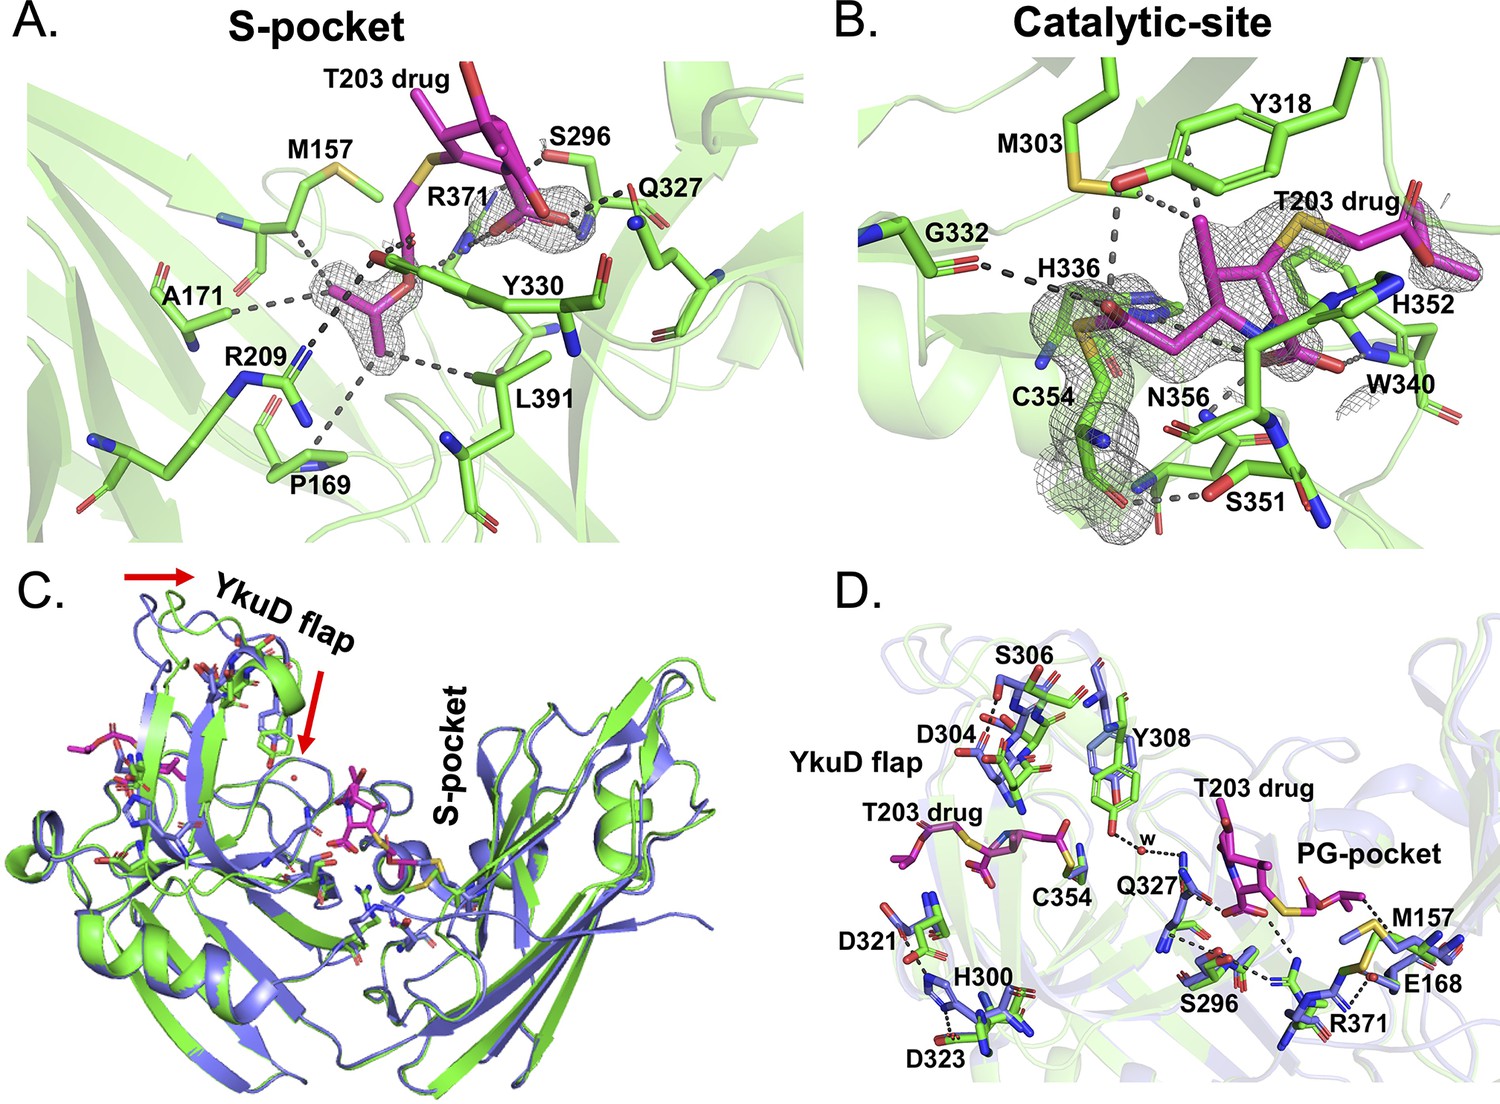
Structural studies of LdtMt2 with the experimental T203 carbapenem drug and allosteric conformation analyses.
(A) The 2Fo-Fc map (contoured at 1.0σ) of the T203-R3 group side chain, 2-isopropoxy-2-oxoethyl (pink), modelled in the S-pocket of LdtMt2 in the crystal structure. (B) The 2Fo-Fc omit map (contoured at 1.0σ) of the full T203 structure (pink) modelled in the catalytic-site of LdtMt2 where it acylates the C354 residue of LdtMt2. (C) Superposition of the LdtMt2–T203 complex (green) with C354A catalytic mutant structure (PDB ID: 3TX4, blue). The red arrows indicate movements in YkuD flap upon T203 drug binding. (D) Residues that have undergone allosteric alterations upon T203 drug binding are shown with stick models. LdtMt2–T203 complex residues are represented in green and the C354A catalytic mutant in blue.
Figure 6—figure supplement 1
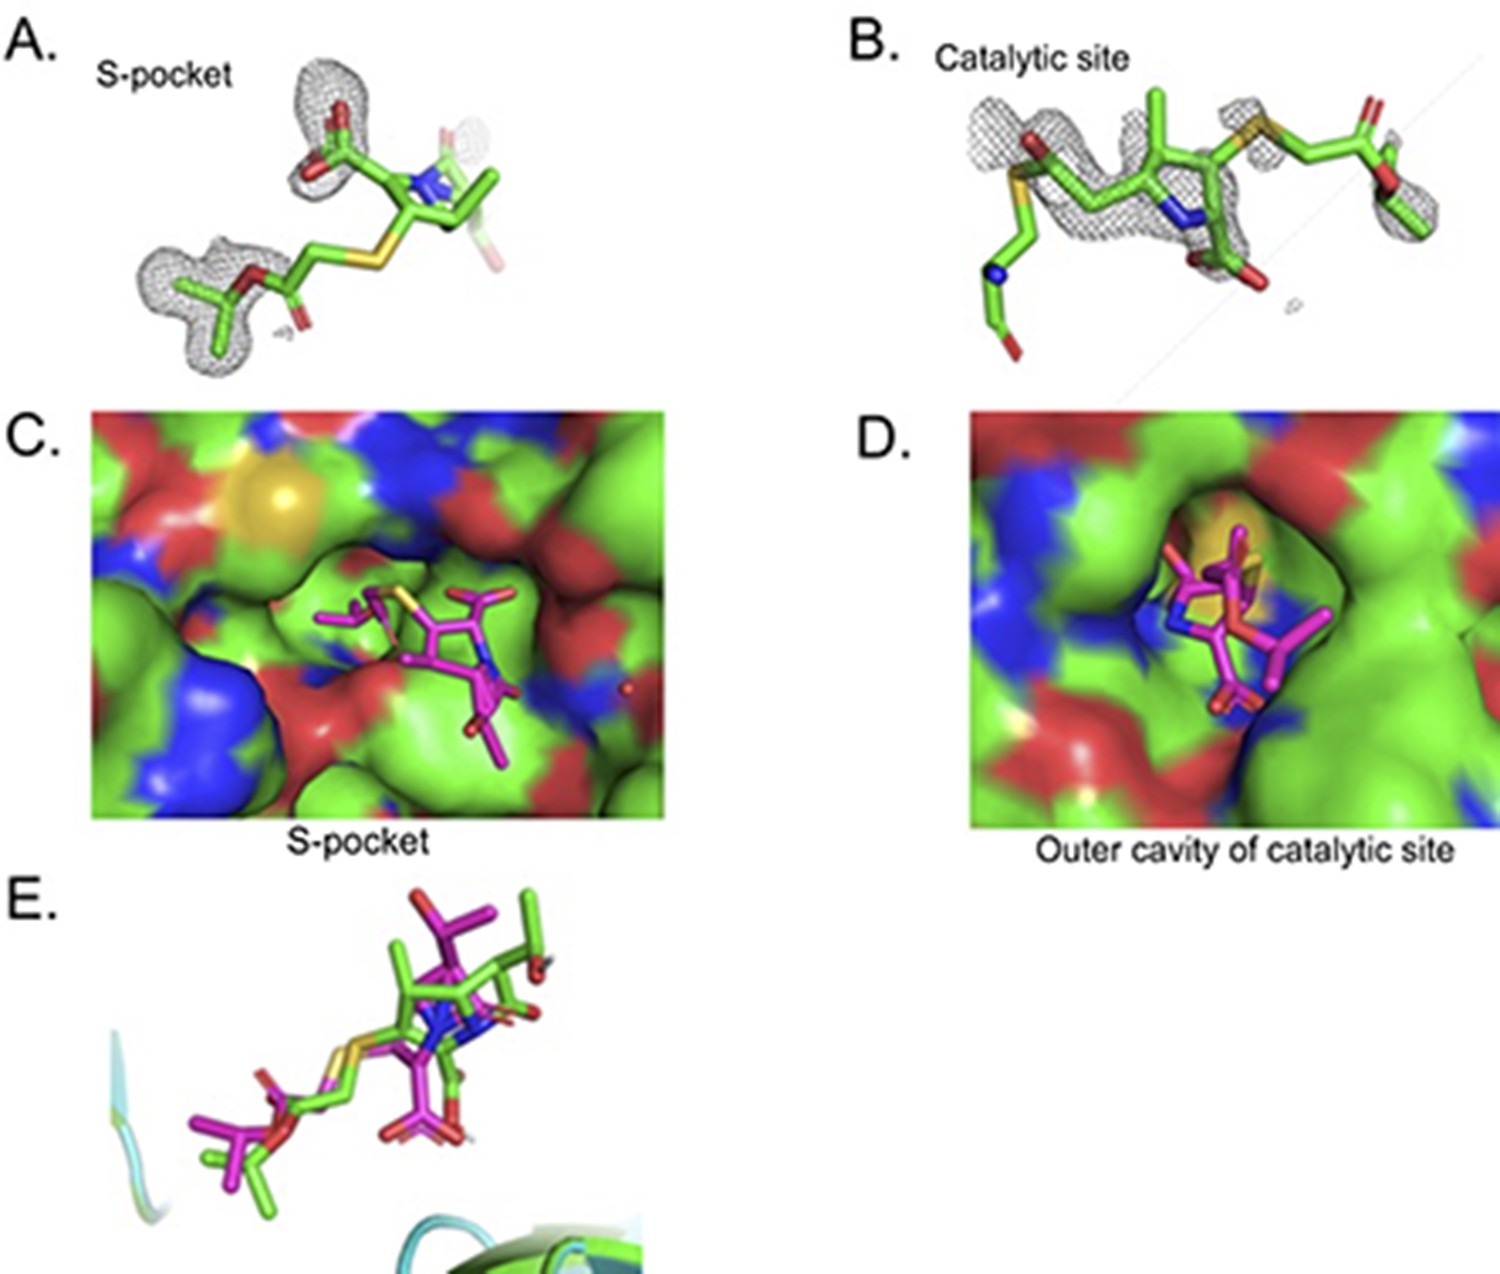
Crystal structure studies of binding of T203 drug in the S-pocket and catalytic site in LdtMt2.
(A) Fo-Fc omit map calculated in the S-pocket contoured at 3σ. (B) Fo-Fc omit map calculated in the catalytic site and contoured at 3.0σ. (C) T203 drug modelled into the S-pocket of LdtMt2 in the crystal structure. T203 drug is represented in stick model with green colour. (D) T203 drug modelled into the outer cavity of catalytic site of LdtMt2 in the crystal structure. LdtMt2 is represented in surface and T203 drug is represented in stick model with pink colour. (E) Superposition of T203 drug from docking result (green colour) with T203 drug from crystal structure (pink colour).
Figure 6—figure supplement 2
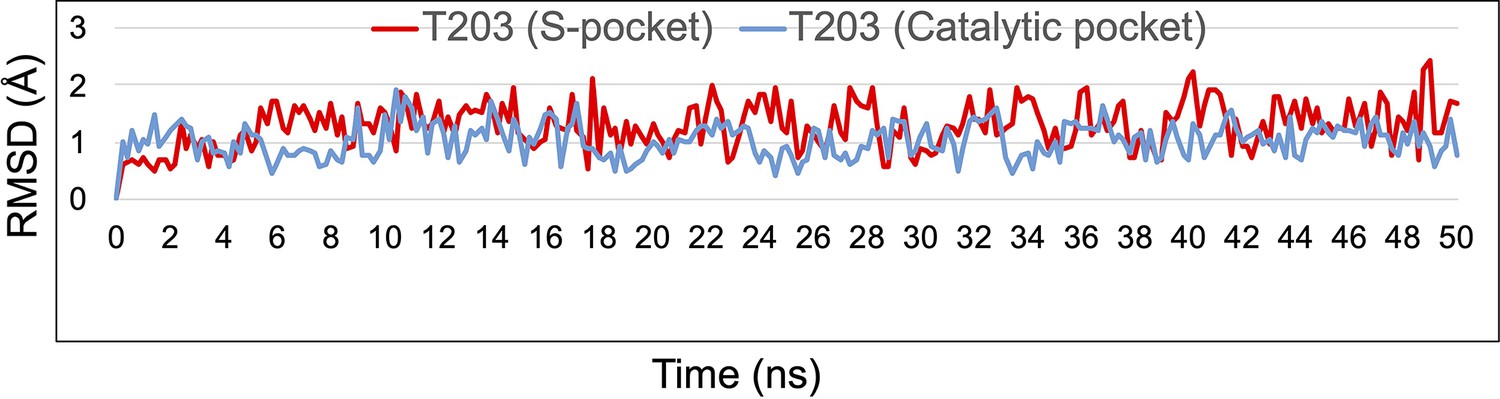
RMSD graph of T203 (S-pocket) (red) and T203 (catalytic-pocket) (blue) over the duration of 50 ns of molecular dynamic (MD) simulations in LdtMt2–T203S-C.
Figure 7 with 1 supplement
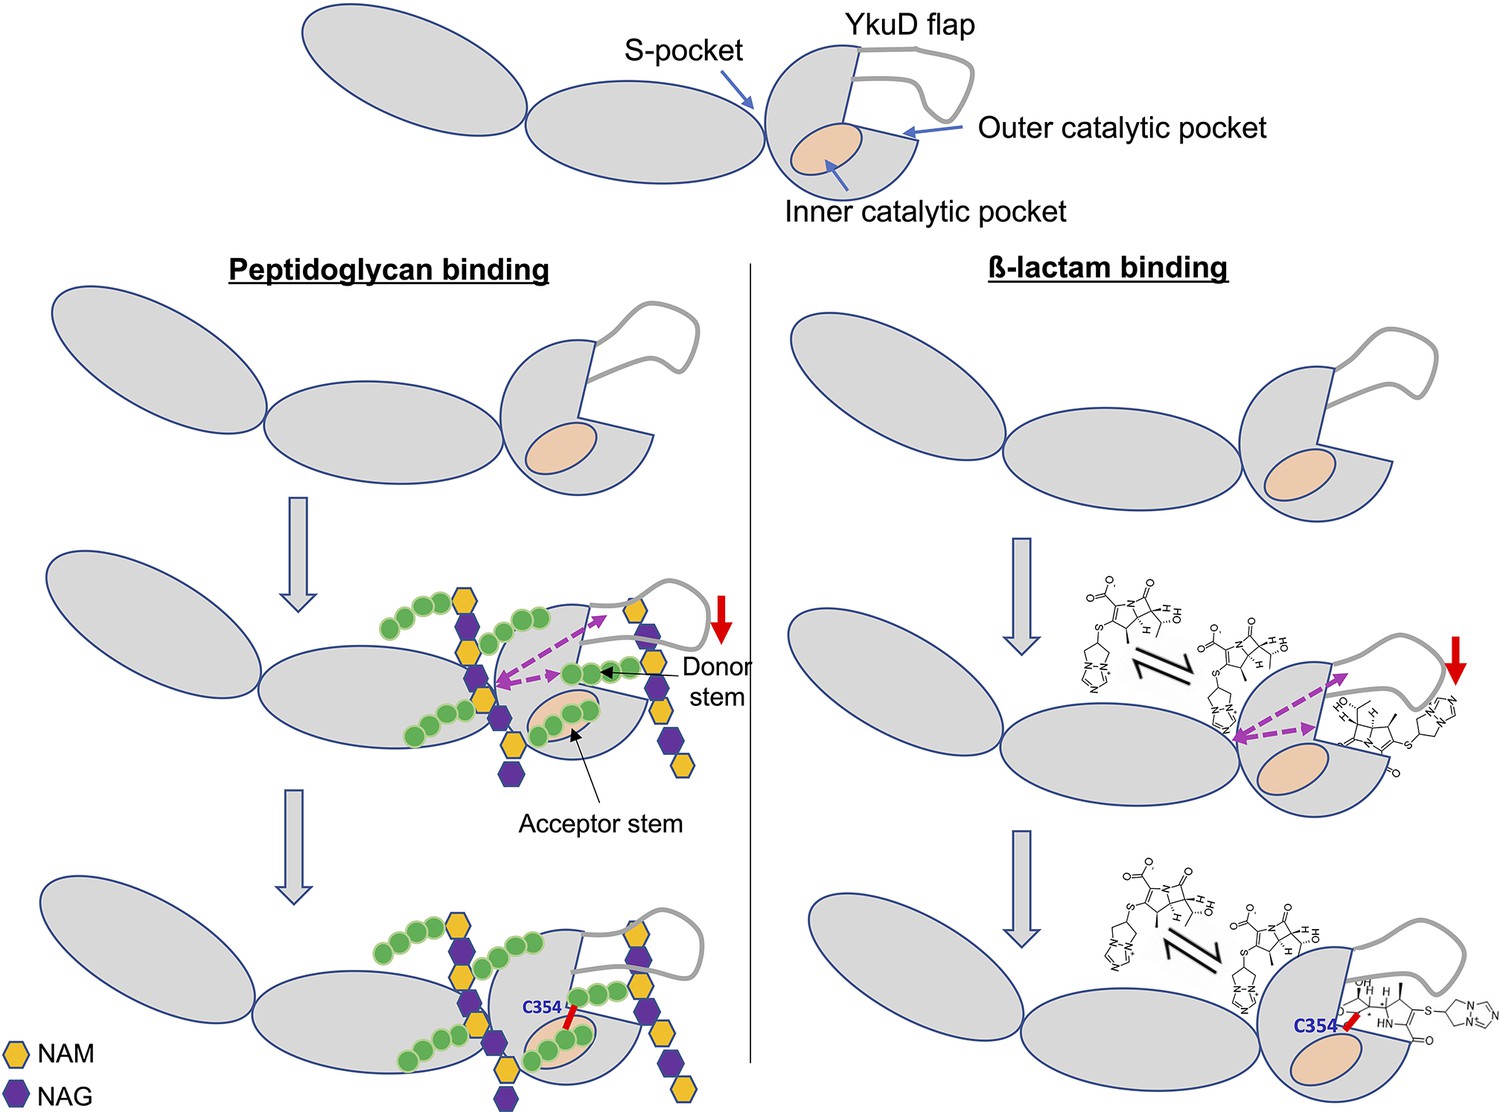
Model of dual β-lactam and/or dual peptidoglycan (PG) substrate binding in S-pocket and the catalytic site of LdtMt2 enzyme that is allosteric cooperative.
Purple dotted arrows indicate pathways of allosteric communication and red arrow indicates movement of YkuD flap during β-lactam and/or PG binding. A small red line in the figure indicates a covalent bond between donor and acceptor stem peptides of PG chain or covalent bond between catalytic residue C354 and β-lactam. β-Lactam molecule indicated in the model is biapenem.
Figure 7—figure supplement 1
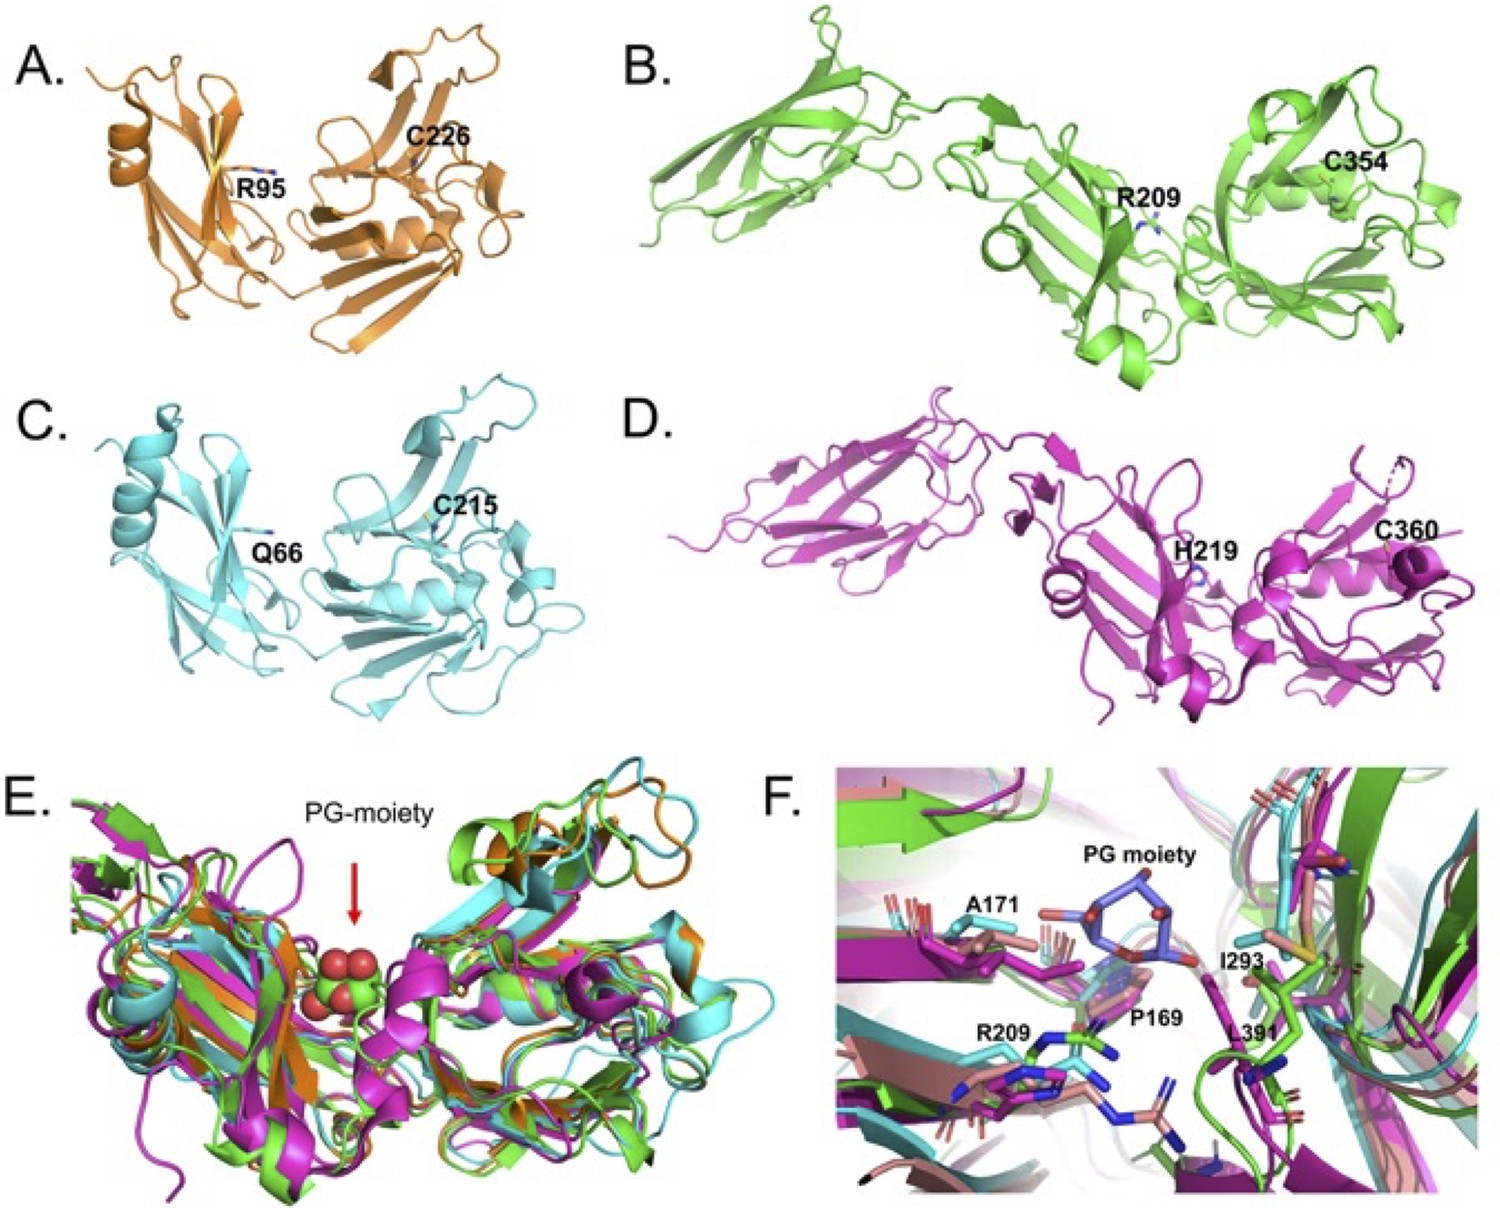
S-pocket in different L,D-transpeptidases from Mycobacterium tuberculosis.
(A–D) Crystal structures of various LDTs, LdtMt1 (PDB ID: 4JMN; orange colour), LdtMt2 (PDB ID: 7F71; green colour), LdtMt3 (PDB ID: 6D4K; cyan colour), and LdtMt5 (PDB ID: 6D5A; pink colour). Highlighted residues in the crystal structures belong to S-pocket and catalytic site. (E) Superposition of various LDTs. Peptidoglycan (PG) sugar moiety bound across the S-pocket is shown in sphere model. (F) Superposition of the conserved residues in the S-pocket. PG sugar moiety is shown in stick model with blue colour.
Videos
Video 1
Visualization of LdtMt2–T203S crystal structure in complex with T203 drug at S-pocket alone over the course of 1000 ps equilibration.
Residues in and around the catalytic and S-pocket residues are shown as solvent and transparent for proper visualization of the mechanism of the drug. Protein is shown in surface representation as diffused and grey. Cysteine is shown as stick model in yellow.
Video 2
Visualization of LdtMt2-T203S-C crystal structure in complex with dual T203 molecules bound non-covalently at S-pocket and covalently at catalytic site over 50 ns molecular dynamic (MD) simulation run.
Protein and ligands are shown in similar representation as in Video 1.
Tables
Table 1
Data collection and refinement statistics.
| LdtMt2–sugar | LdtMt2–T203 | |
|---|---|---|
| Data collection | ||
| Wavelength (Å) | 1.0 | 1.0 |
| Resolution (Å) | 29.73–1.58 (1.64–1.58) | 30.0–1.7 (1.73–1.70) |
| Space group | P 1 21 1 | P 1 21 1 |
| Unit cell (Å) | 60.906, 93.981, 75.539, 90, 92.975, 90 | 60.799 94.278 75.707 90.00 93.14 90.00 |
| Unique reflectionsa | 111,390 | 90,418 |
| Multiplicitya | 4.3 (4.1) | 5 (5) |
| Completenessa | 96.0 (98.6) | 97.4 (95.9) |
| Rmergea, b | 0.048 (0.55) | 0.073 (0.74) |
| Overall I/σ(I)a | 20.37 (1.8) | 23.7 (3.3) |
| Refinement | ||
| Rwork (%)c | 0.1662 | 0.1666 |
| Rfree (%)d | 0.1980 | 0.1853 |
| r.m.s.d. | ||
| Bonds (Å) | 0.009 | 0.009 |
| Angles (°) | 1.03 | 1.033 |
| Average B-factor (Å2) | ||
| Protein | 14.9 | 14.2 |
| Active-site ligand | 19.28 | L01 = 25.71, T20 = 34.1 |
| Ramachandaran | ||
| Favoured | 98.28% | 97.99% |
| Additional allowed | 1.72% | 2.01% |
| PDB ID | 7F71 | 7F8P |
-
Values in parenthesis are for the highest resolution shell.
Table 2
Kinetic parameters of β-lactam hydrolysis by LdtMt2 and mutant proteins.
| Enzyme | Vmax (µM/min) | Km (µM) | Kcat (s−1) | Kcat/Km (M−1 s−1) |
|---|---|---|---|---|
| LdtMt2 (∆N55) | 0.23 ± 0.01 | 16.32 ± 1.78 | 7.7E−4 | 47.18 |
| IgD1 | Ambiguous | – | – | – |
| IgD2 | Ambiguous | – | – | – |
| IgD1–IgD2 | Ambiguous | – | – | – |
| IgD2-YkuD | 0.21 ± 0.01 | 16.18 ± 2.24 | 7.0E−4 | 43.26 |
| YkuD | 0.15 ± 0.02 | 129.5 ± 41.80 | 5.0E−4 | 3.86 |
| R209E | 0.25 ± 0.07 | 428.40 ± 195.9 | 8.3E−4 | 1.90 |
| Y330F | 0.15 ± 0.01 | 11.12 ± 3.15 | 5.0E−4 | 44.96 |
| S351A | 0.11 ± 0.02 | 123.1 ± 56.7 | 3.7E−4 | 3.01 |
| C354A | Ambiguous | – | – | – |
| H352A | 0.10 ± 0.01 | 21.14 ± 6.11 | 3.3E−4 | 15.61 |
| H336N | 0.07 ± 0.01 | 39.13 ± 17.92 | 2.3E−4 | 5.88 |
| M303A | 0.14 ± 0.01 | 11.71 ± 2.90 | 4.7E−4 | 40.14 |
| S337A | 0.23 ± 0.01 | 23.30 ± 2.51 | 7.6E−4 | 32.62 |
| K282A | 0.16 ± 0.01 | 12.06 ± 3.23 | 5.3E−4 | 43.94 |
Table 3
Docking score of LdtMt2 with β-lactam compounds in kcal mol−1 calculated by Autodock.
| Drug | Binding energy (kcal/mol) |
|---|---|
| Ampicillin | −7.1 |
| Oxacillin | −8.3 |
| Cefotaxime | −7.8 |
| Biapenem | −6.3 |
| T203 | −6.9 |
Key resources table
| Reagent type (species) or resource | Designation | Source or reference | Identifiers | Additional information |
|---|---|---|---|---|
| Gene (Mycobacterium tuberculosis) | ldtB/LdtMt2 | Uniprot | I6Y9J2 | |
| Strain, strain background (Escherichia coli) | BL21 (DE3) | NEB | Catalog # C2526H | |
| Strain, strain background (Escherichia coli) | NEB 5-alpha competent | NEB | Catalog # C2987H | |
| Sequence-based reagent | IgD1-F | This paper | PCR primer | ATTGCCATATGAAGGCACGCCGTTCGCCGAC |
| Sequence-based reagent | IgD1-R | This paper | PCR primer | CAATACTCGAGTTAGGTCTGGAAGGTCAGCTGGCG |
| Sequence-based reagent | IgD2-F | This paper | PCR primer | ATTGCCATATGACCTGACCATGCCCTACGTAT |
| Sequence-based reagent | IgD2-R | This paper | PCR primer | CAATACTCGAGTTAGCCGATGGTGAAGTGCGTCTG |
| Sequence-based reagent | IgD1-IgD2-F | This paper | PCR primer | ATTGCCATATGAAGGCACGCCGTTCGCCGATC |
| Sequence-based reagent | IgD1-IgD2-R | This paper | PCR primer | CAATACTCGAGTTAGCCGATGGTGAAGTGCGTCTG |
| Sequence-based reagent | YkuD-F | This paper | PCR primer | ATTGCCATATGGGCGACGAGGTGATCGCGACC |
| Sequence-based reagent | YkuD- R | This paper | PCR primer | CAATACTCGAGTTACGCCTTGGCGTTACCGGC |
| Sequence-based reagent | LdtMt2-E207A- F | This paper | PCR primer | CTGAATAACCGTGCAGTGCGTTGGCGCCCA |
| Sequence-based reagent | LdtMt2-E207A- R | This paper | PCR primer | TGGGCGCCAACGCACTGCACGGTTATTCAG |
| Sequence-based reagent | LdtMt2-R209A- F | This paper | PCR primer | TGAATAACCGTGAAGTGGAATGGCGCCCAGAGCATT |
| Sequence-based reagent | LdtMt2-R209E- R | This paper | PCR primer | AATGCTCTGGGCGCCATTCCACTTCACGGTTATTCA |
| Sequence-based reagent | LdtMt2-S337A- F | This paper | PCR primer | GTGTCTTCGTGCACGCAGCGCCGTGGTCGG |
| Sequence-based reagent | LdtMt2-S37A- R | This paper | PCR primer | CCGACCACGGCGCTGCGTGCACGAAGACAC |
| Sequence-based reagent | LdtMt2-S351A- F | This paper | PCR primer | GGCCACACCAACACCGCCCATGGCTGCCTGAAC |
| Sequence-based reagent | LdtMt2-S351A-R | This paper | PCR primer | GTTCAGGCAGCCATGGGCGGTGTTGGTGTGGCC |
| Sequence-based reagent | LdtMt2-Y330F- F | This paper | PCR primer | CCACCCAGATCTCCTTTAGCGGTGTCTTCGTGC |
| Sequence-based reagent | LdtMt2-Y330F- R | This paper | PCR primer | GCACGAAGACACCGCTAAAGGAGATCTGGGTGG |
| Sequence-based reagent | LdtMt2-H336N- F | This paper | PCR primer | CAGCGGTGTCTTCGTGAACTCAGCGCCGTGGTC |
| Sequence-based reagent | LdtMt2-H336N- R | This paper | PCR primer | GACCACGGCGCTGAGTTCACGAAGACACCGCTG |
| Sequence-based reagent | LdtMt2-C354A- F | This paper | PCR primer | CAACACCAGCCATGGCGCGCTGAACGTCAGCCCGAG |
| Sequence-based reagent | LdtMt2-C354A- R | This paper | PCR primer | CTCGGGCTGACGTTCAGCGCGCCATGGCTGGTGTTG |
| Sequence-based reagent | LdtMt2-M303A- F | This paper | PCR primer | GGTACAAGCACATCATCGCGGACTCGTCCACCTACG |
| Sequence-based reagent | LdtMt2-M303A- R | This paper | PCR primer | CGTAGGTGGACGAGTCCGCGATGATGTGCTTGTACC |
| Commercial assay or kit | Q5 High-Fidelity DNA Polymerases | NEB | Catalog # M0491L | |
| Chemical compound, drug | SYPRO Orange | Thermo Fisher Scientific | Catalog # S6650 | |
| Chemical compound, drug | Nitrocefin | Millipore-Sigma | Catalog # 484400-5MG |
Additional files
Download links
A two-part list of links to download the article, or parts of the article, in various formats.
Downloads (link to download the article as PDF)
Open citations (links to open the citations from this article in various online reference manager services)
Cite this article (links to download the citations from this article in formats compatible with various reference manager tools)
Allosteric cooperation in β-lactam binding to a non-classical transpeptidase
eLife 11:e73055.
https://doi.org/10.7554/eLife.73055


