TIGAR deficiency enhances skeletal muscle thermogenesis by increasing neuromuscular junction cholinergic signaling
- Departments of Medicine, Albert Einstein College of Medicine, United States
- East Carolina Diabetes and Obesity Institute and the Department of Physiology, Brody School of Medicine East Carolina University, United States
- Departments of Neuroscience, Albert Einstein College of Medicine, United States
- The Fleischer Institute of Diabetes and Metabolism, Albert Einstein College of Medicine, United States
- Departments of Molecular Pharmacology, Albert Einstein College of Medicine, United States
Figures
Figure 1 with 2 supplements
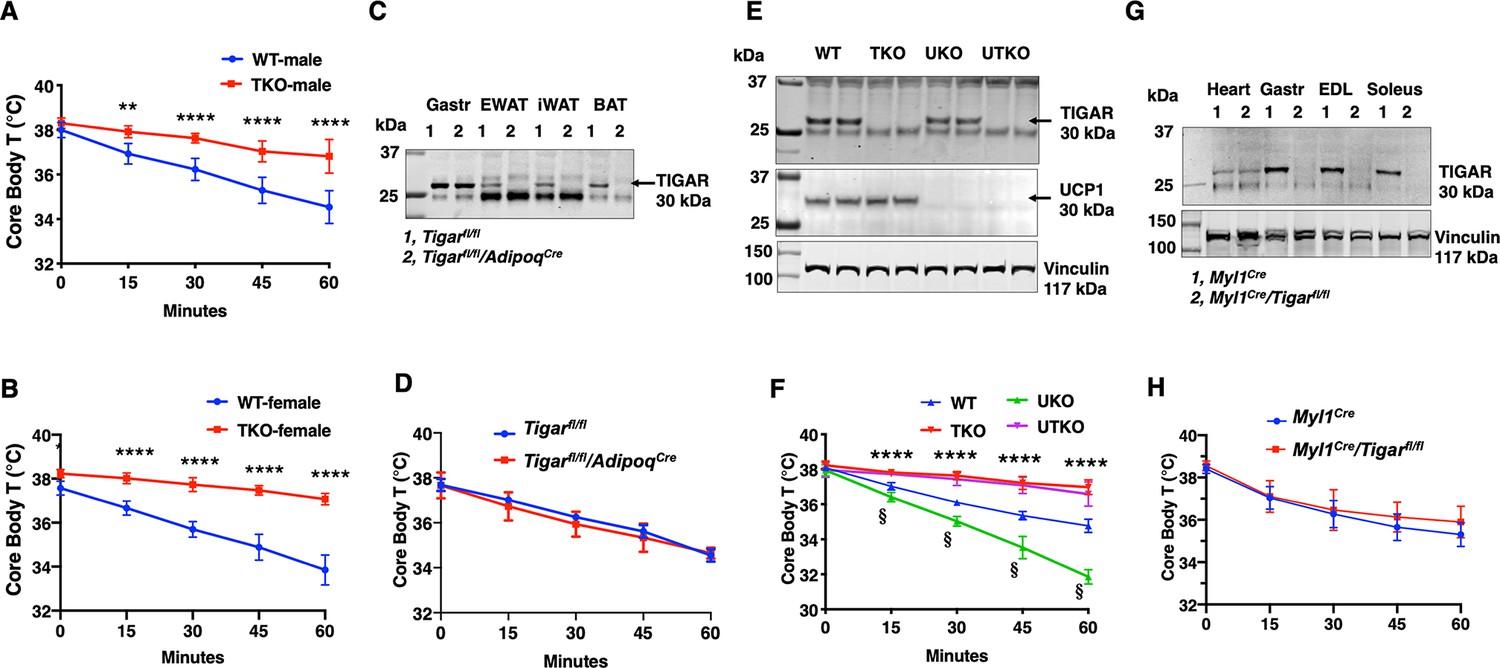
TIGAR deficiency mice are resistant to hypothermia induced by an acute cold challenge.
(A) Male mice (wild type [WT] n = 10, whole-body Tigar knockout [TKO] n = 6) and (B) female mice (WT n = 6, TKO n = 7) core body temperatures were measured every 15 min starting at ambient laboratory temperature (0 min) and following placement at 4°C. (C) Representative TIGAR immunoblot of gastrocnemius muscle (Gastroc), epididymal white adipose tissue (EWAT), subcutaneous inguinal white adipose tissue (iWAT), and interscapular brown adipose tissue (iBAT) from the control Tigarfl/fl and adipocyte-specific knockout Tigarfl/fl/AdipoqCre mice. (D) Tigarfl/fl and Tigarfl/fl/AdipoqCre male mice (n = 6) core body temperatures were measured every 15 min starting at ambient laboratory temperature (0 min) and following placement at 4°C. (E) Representative UCP1 and TIGAR immunoblots of brown adipose tissue from WT, TKO, Ucp1 knockout (UKO), and Ucp1 and Tigar double knockout (UTKO) mice from two independent genotypes each. (F) WT (n = 6), TKO (n = 6), UKO (n = 7), and UTKO (n = 8) mice core body temperatures were measured every 15 min starting at ambient laboratory temperature (0 min) and following placement at 4°C. (G) Representative TIGAR immunoblot of heart, gastrocnemius muscle (Gastroc), extensor digitorum digitorum longus (EDL), and soleus muscle from the control (Myl1Cre) and skeletal muscle-specific TKO (Myl1Cre/Tigarfl/fl) mice. (H) Myl1Cre and Myl1Cr>/Tigarfl/fl male mice (n = 6) core body temperatures were measured every 15 min starting at ambient laboratory temperature (0 min) and following placement at 4°C. Statistical analyses are described in ‘Methods details,’ and the data are presented as the mean ± SD. *p<0.05, **p<0.01, ***p<0.001, ****p<0.0001, §p<0.001.
-
Figure 1—source data 1
Fresh gastrocnemius muscle (Gastr), epididymal adipose tissue (EWAT), inguinal white adipose tissue, and interscapular brown adipose tissue from Tigarfl/fl and Tigarfl/fl>/AdipoqCre mice were collected, and 30 μg of the tissue lysate were used for TIGAR (30 kDa) immunoblotting analysis as described in the ‘Immunoblotting’ section.
The raw image was used for Figure 1C. A detailed description of the raw images is shown in Source data 1.
- https://cdn.elifesciences.org/articles/73360/elife-73360-fig1-data1-v2.zip
-
Figure 1—source data 2
Interscapular brown adipose tissues were collected from wild type (WT), whole-body Tigar knockout (TKO), Ucp1 knockout (UKO), and Ucp1 and Tigar double knockout (UTKO) mice, and 30 μg of the tissue lysate were used for TIGAR (30 kDa) immunoblotting analysis as described in the ‘Immunoblotting’ section.
The raw image was used for Figure 1E. A detailed description of the raw images is shown in Source data 1.
- https://cdn.elifesciences.org/articles/73360/elife-73360-fig1-data2-v2.zip
-
Figure 1—source data 3
Interscapular brown adipose tissues were collected from wild type (WT), whole-body Tigar knockout (TKO), Ucp1 knockout (UKO), and Ucp1 and Tigar double knockout (UTKO) mice, and 30 μg of the tissue lysate were used for UCP1 (33 kDa) immunoblotting analysis as described in the ‘Immunoblotting’ section.
The raw image was used for Figure 1E. A detailed description of the raw images is shown in Source data 1.
- https://cdn.elifesciences.org/articles/73360/elife-73360-fig1-data3-v2.zip
-
Figure 1—source data 4
Interscapular brown adipose tissues were collected from wild type (WT), whole-body Tigar knockout (TKO), Ucp1 knockout (UKO), and Ucp1 and Tigar double knockout (UTKO) mice, and 30 μg of the tissue lysate were used for vinculin (117 kDa) immunoblotting analysis as described in the ‘Immunoblotting’ section.
The raw image was used for Figure 1E. A detailed description of the raw images is shown in Source data 1.
- https://cdn.elifesciences.org/articles/73360/elife-73360-fig1-data4-v2.zip
-
Figure 1—source data 5
Fresh heart, gastrocnemius muscle (Gastr), extensor digitorum longus (EDL muscle), and soleus muscle were collected from Myl1Cre and Myl1Cre/Tigarfl/fl mice, and 30 μg of the tissue lysate were used for TIGAR (30 kDa) immunoblotting analysis as described in the ‘Immunoblotting’ section.
The raw image was used for Figure 1G. A detailed description of the raw images is shown in Source data 1.
- https://cdn.elifesciences.org/articles/73360/elife-73360-fig1-data5-v2.zip
-
Figure 1—source data 6
Fresh heart, gastrocnemius muscle (Gastr), extensor digitorum longus (EDL muscle), and soleus muscle were collected from Myl1Cre and Myl1Cre/Tigarfl/fl mice, and 30 μg of the tissue lysate were used for vinculin (117 kDa) immunoblotting analysis as described in the ‘Immunoblotting’ section.
The raw image was used for Figure 1G. A detailed description of the raw images is shown in Source data 1.
- https://cdn.elifesciences.org/articles/73360/elife-73360-fig1-data6-v2.zip
Figure 1—figure supplement 1
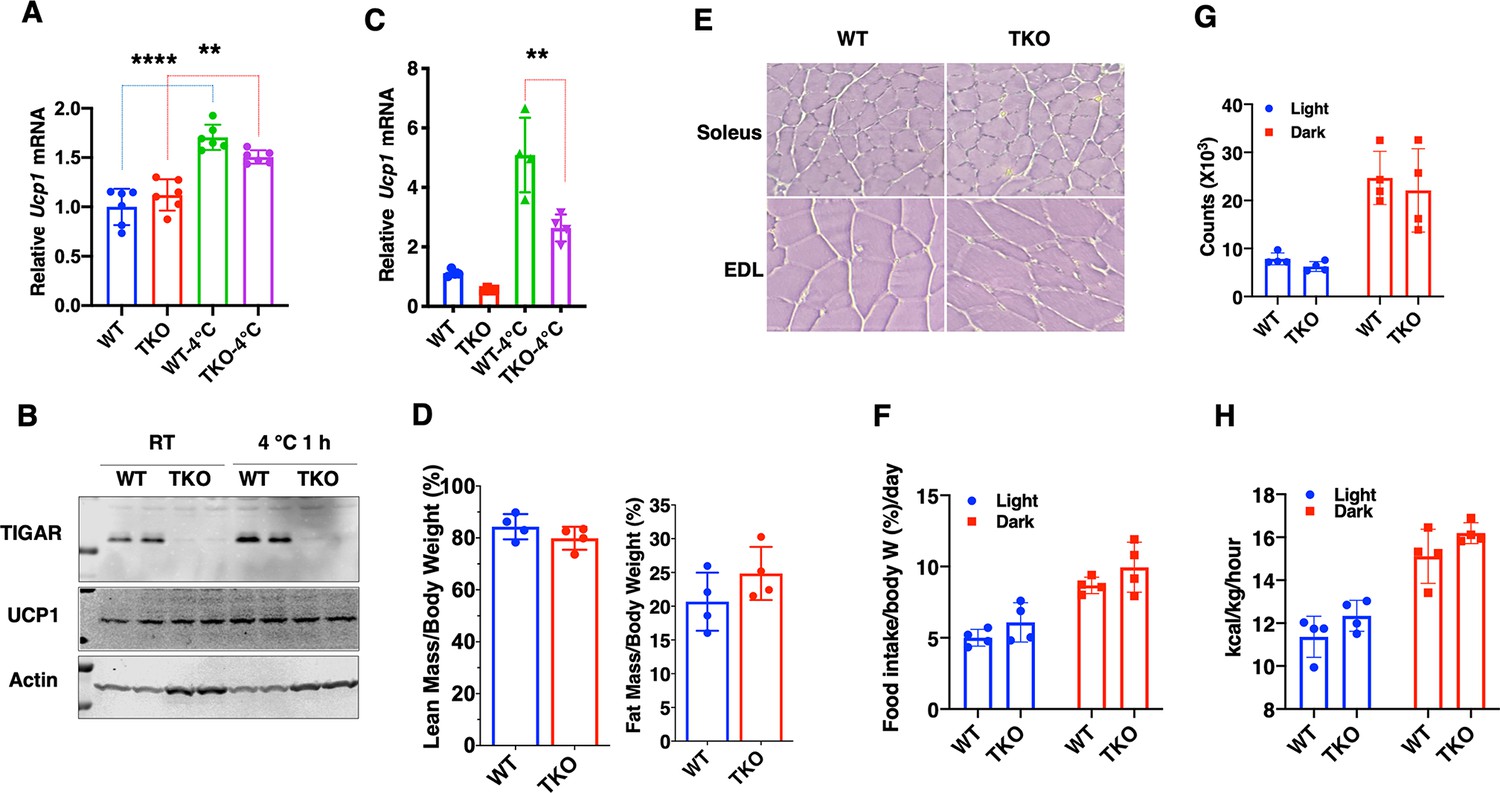
The whole-body Tigar knockout (TKO) protection against hypothermia is independent of UCP1 expression with no change in basal metabolic rate.
(A) Relative Ucp1 mRNA levels in interscapular brown adipose tissue from wild type (WT) and TKO male (n = 6) mice maintained at ambient temperature and after 1 hr 4°C exposure. (B) Representative TIGAR, UCP1, and actin protein immunoblot of interscapular brown adipose tissue from two independent WT and TKO male mice maintained at ambient temperature or after 1 hr 4°C exposure. (C) Relative Ucp1 mRNA levels in inguinal adipose tissue from the WT and TKO male mice (n = 4–10) at ambient temperature or after 2 hr 4°C exposure. Please note that the Ct values for brown adipose tissue were approximately 18, whereas the Ct values for the inguinal white adipose tissue were in the range of 33. (D) The ratio of lean mass/body weight and fat mass/body weight was determined by EchoMRI at 5 months of age for male WT and TKO mice. (E) Representative images of hematoxylin and eosin staining of soleus and extensor digitorium longus (EDL) skeletal muscle from the WT and TKO mice. (F) Quantification of daily food intake/body weight in the light and dark cycles of WT and TKO male mice. (G) Indirect calorimetry determination of spontaneous locomotor activity in the AMB + Z dimensions from the WT and TKO mice in the light and dark cycles. (H) Indirect calorimetry determination of energy expenditure in the light and dark cycles of the WT and TKO mice. Statistical analyses are described in ‘Method details’ and the data are presented as the mean ± SD. **p<0.01, ****p<0.0001.
-
Figure 1—figure supplement 1—source data 1
Interscapular brown adipose tissues were collected from both ambient temperature housed and 4°C 1 hrexposed wild type (WT) and whole-body Tigar knockout (TKO), mice and 30 μg of the tissue lysate were used for TIGAR (30 kDa) immunoblotting analysis as described in the ‘Immunoblotting section.
The raw image was used for Figure 1—figure supplement 1B. A detailed description of the raw images is shown in Source data 1.
- https://cdn.elifesciences.org/articles/73360/elife-73360-fig1-figsupp1-data1-v2.zip
-
Figure 1—figure supplement 1—source data 2
Interscapular brown adipose tissues were collected from both ambient temperature housed and 4°C 1 hr exposed wild type (WT) and whole-body Tigar knockout (TKO) mice, and 30 μg of the tissue lysate were used for UCP1 (33 kDa) immunoblotting analysis as described in the ‘Immunoblotting’ section.
The raw image was used for Figure 1—figure supplement 1B. A detailed description of the raw images is shown in Source data 1.
- https://cdn.elifesciences.org/articles/73360/elife-73360-fig1-figsupp1-data2-v2.zip
-
Figure 1—figure supplement 1—source data 3
Interscapular brown adipose tissues were collected from both ambient temperature housed and 4°C 1 hr exposed wild type (WT) and whole-body Tigar knockout (TKO) mice, and 30 μg of the tissue lysate were used for actin β immunoblotting analysis as described in the ‘Immunoblotting’ section.
The raw image was used for Figure 1—figure supplement 1B. A detailed description of the raw images is shown in Source data 1.
- https://cdn.elifesciences.org/articles/73360/elife-73360-fig1-figsupp1-data3-v2.zip
Figure 1—figure supplement 2
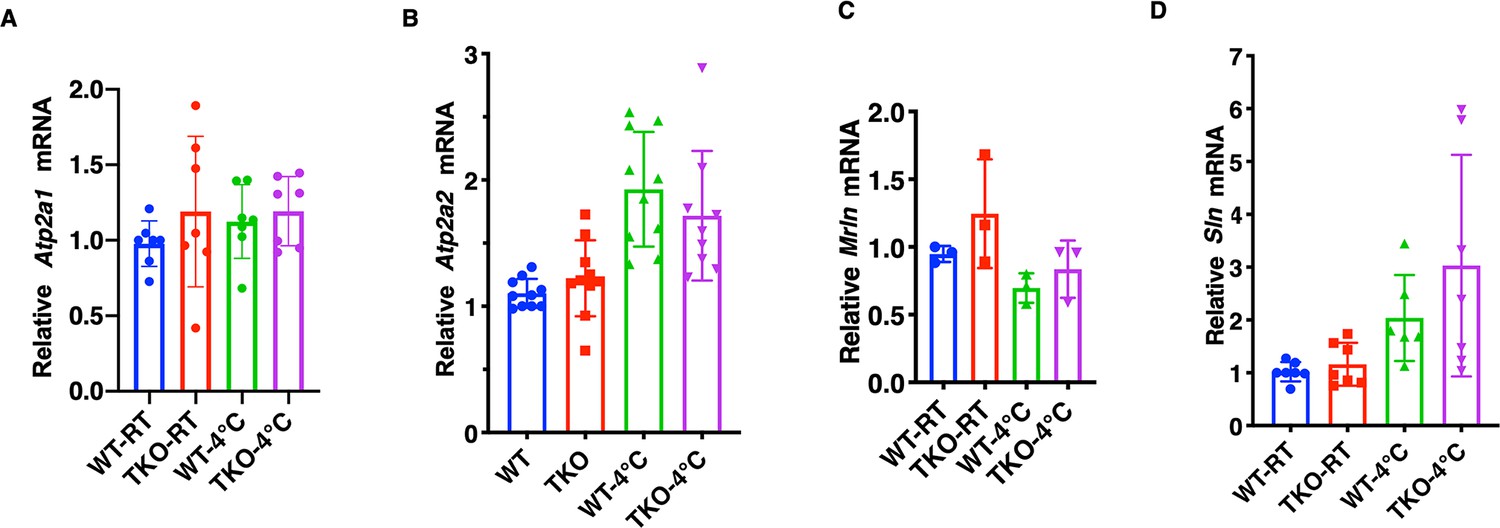
Changes in the expression of skeletal muscle SERCA, myoregulin, and sarcolipin do not account for the differential sensitivity to tubocurare.
Relative mRNA levels of (A) Atp2a1, (B) Atp2a2, (C) myoregulin (Mrln), and (D) sarcolipin (Sln) in the gastrocnemius muscle from male (n = 3–10) wild type (WT) and whole-body Tigar knockout (TKO) mice at ambient temperature or after 1 hr 4°C exposure. Statistical analyses are described in ‘Method details,,’ and the data are presented as the mean ± SD.
Figure 2 with 2 supplements
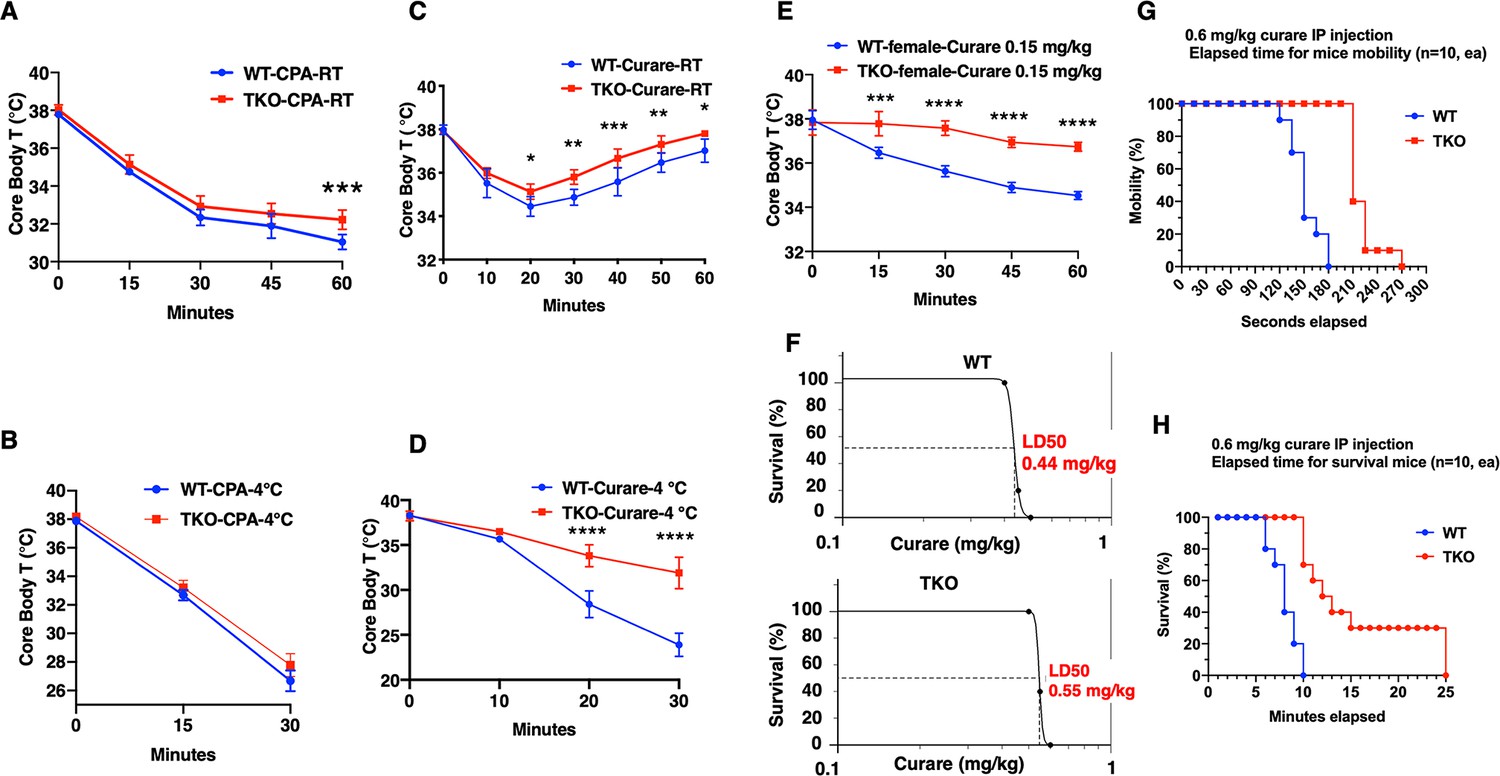
TIGAR knockout mice are resistant to tubocurare but not cyclopiazonic acid (CPA).
(A) Wild type (WT) and whole-body Tigar knockout (TKO) male mice (n = 6) were intraperitoneally injected with CPA (10 mg/kg body weight), and then core body temperature was measured every 15 min at room temperature. (B) WT and TKO male mice (n = 6) were intraperitoneally injected with CPA (10 mg/kg body weight) at room temperature, and then shifted to 4°C for 30 min, with core body temperature measured every 15 min. (C) WT and TKO male mice (n = 6) were intraperitoneally injected with tubocurare (0.4 mg/kg body weight), and then core body temperature was measured every 10 minutes at room temperature. (D) WT and TKO male mice (n = 6) were intraperitoneally injected with tubocurare (0.4 mg/kg body weight) at room temperature, and then 10 min later shifted to 4°C for 30 min, with core body temperature measured every 10 min. (E) WT and TKO female mice (n = 6) were intraperitoneally injected with tubocurare (0.15 mg/kg body weight), and then core body temperature was measured every 15 min at room temperature. (F) WT and TKO male mice (n = 10) were intraperitoneally injected with different tubocurare doses, and the LD50 of curare was calculated using an online software LD50 Calculator (AAT Bioquest, Inc, Sunnyvale, CA). (G) WT and TKO male mice (n = 10) were intraperitoneally injected with a lethal tubocurare dose (0.6 mg/kg body weight), and the number of mice undergoing complete paralysis was plotted as a function of time in seconds. (H) The time to death (absence of respiration) of the same mice was plotted as a function of time in minutes. Statistical analyses are described in ‘Method details,’ and the data are presented as the mean ± SD. *p<0.05, **p<0.01, ***p<0.001, ****p<0.0001.
Figure 2—figure supplement 1
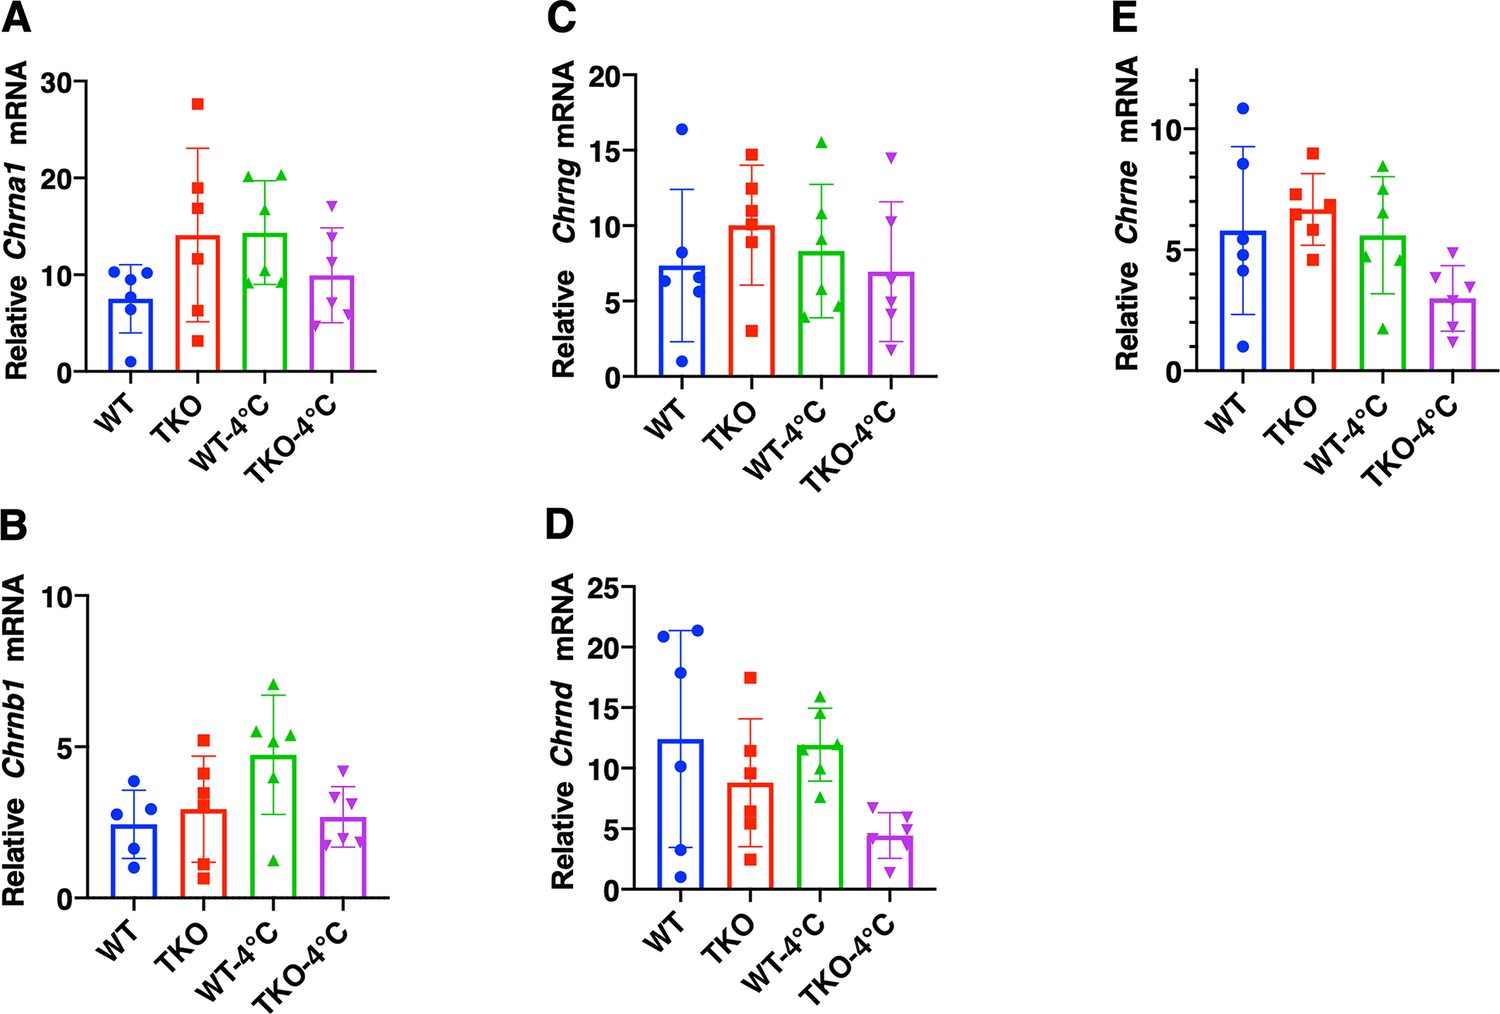
Changes in the expression of skeletal muscle nicotinic acetylcholine receptor subunits do not account for the differential sensitivity to tubocurare.
Relative mRNA levels of the nicotinic acetylcholine receptor subunits (A) α1 (Chrna1), (B) β1 (Chrnb1), (C) γ (Chrng), (D) δ (Chrnd), and (E) ε (Chrne) in the gastrocnemius muscle from male (n = 3–10) wild type (WT) and whole-body Tigar knockout (TKO) mice at ambient temperature or after 1 hr 4°C exposure. Statistical analyses are described in ‘Method details,’ and the data are presented as the mean ± SD.
Figure 2—video 1
Whole-body Tigar knockout (TKO) mice are resistant to the paralytic effects of tubocurare.
Representative video clip of wild type (WT) and TKO male mice behavior under ambient temperature and at 4°C following intraperitoneal (IP) injection of tubocurare (0.4 mg/kg body weight). Rectal temperature recording of WT and TKO mice with curare injection was performed on February 12, 2019. The date of birth of both WT and TKO mice was October 15, 2018. The body weights of WT and TKO were 25.3 g and 27.6 g, respectively. The volume of curare saline solution (0.1 mg/ml in saline) for IP injection was 101.2 µl for the WT mouse and 110.4 µl for the TKO mouse. The mice were IP injected with curare, then caged at ambient temperature (21–23°C) for 10 min, and subsequently transferred into a pre-chilled cage in a cold chamber at 4°C for 20 min. The mice were taken back to the cages at ambient temperature (see the sketch below). Rectal temperature was recorded at the time of curare injection and every 10 min thereafter (see the table in text). The mouse in the left cage is WT, and the mouse in the right cage is TKO.
Figure 3 with 2 supplements
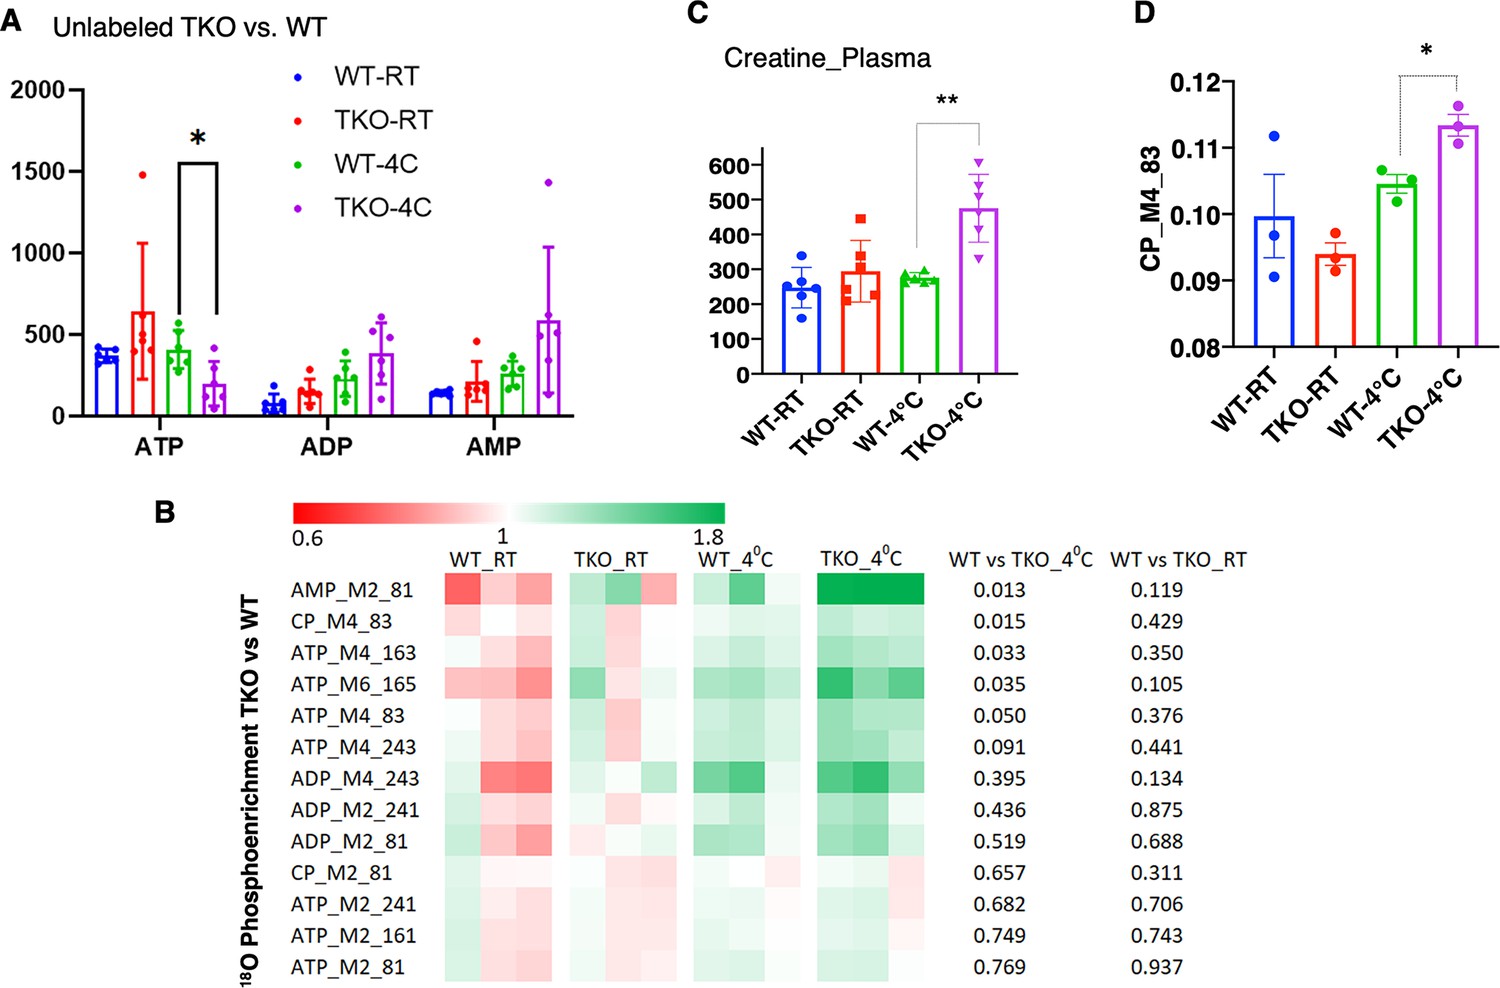
TIGAR-deficient mice display increased ATP turnover in skeletal muscle.
(A) Wild type (WT) and whole-body Tigar knockout (TKO) male mice (n = 6) were maintained at room temperature (RT) or shifted to 4°C for 1 hr. Quadricep white skeletal muscles were isolated, and extracts assayed for ATP, ADP, and AMP levels as described in ‘Method details.’ (B) WT and TKO male mice (n = 3–4 per condition) were kept at RT or shifted to 4°C for 1 hr and then given an oral gavage of 0.3 ml pure H2O18 for 10 min at 4°C and an intraperitoneal (IP) injection of 1 ml pure H2O18 for another 10 min at 4°C. The quadricep muscles were freeze-clamped with liquid N2 and extracts prepared for mass spectroscopic analyses. The heatmap shows the O18 enrichment fraction of ATP, ADP, AMP, and creatine-phosphate. (C) WT and TKO male mice (n = 6) were maintained at RT or shifted to 4°C for 1 hr, and plasma creatine levels were determined by metabolomics analyses. (D) The CP_M4_83 data was generated from the same experimental setting as (B), indicating the increase in phosphocreatine turnover in TKO compared to that in WT at 4°C. Statistical analyses are described in ‘Method details,’ and the data are presented as the mean ± SD. *p<0.05, ***p<0.01.
-
Figure 3—source data 1
Raw 18O enrichment data of stable isotope metabolic flux assessment with H218O was collected in quadricep white muscle of both ambient temperature housed and 4°C 1 hr exposed wild type (WT) and whole-body Tigar knockout (TKO) mice, as described in ‘Method details’.
The data was used in Figure 3.
- https://cdn.elifesciences.org/articles/73360/elife-73360-fig3-data1-v2.xlsx
Figure 3—figure supplement 1
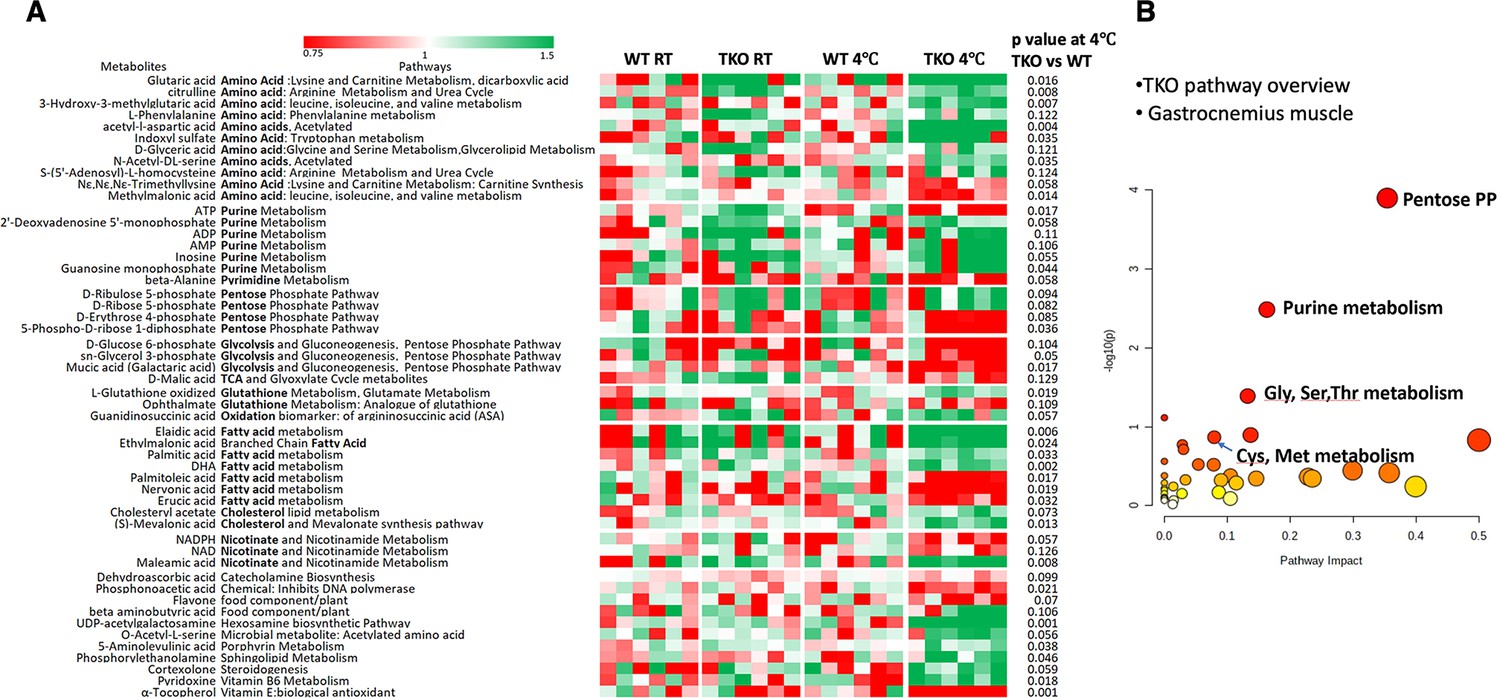
Skeletal muscles of whole-body Tigar knockout (TKO) mice at 4°C display increased pentose phosphate pathway, purine nucleotide cycle, and amino acid utilization pathways.
Wild type (WT) and TKO male mice (n = 6) were maintained at room temperature (RT) or shifted to 4°C for 1 hr. (A) Quadricep white skeletal muscles were isolated, and extracts were subjected to widely targeted (multiple reaction monitoring [MRM]) small metabolite profiling using an ABSciex 6500 + QTRAP with ACE PFP and Merck ZIC-pHILIC columns as described in ‘Materials and methods.’ The heatmap shows the metabolites/pathways differentially identified with the corresponding p-values. (B) Matched pathways, determined from MetaboAnalyst 5.0, which integrates enrichment analysis (metabolite over-representation more than expected by chance) and pathway impact (reflecting the centrality of the metabolite in a topological network).
-
Figure 3—figure supplement 1—source data 1
Raw metabolites data were collected in the gastrocnemius muscle of both ambient temperature housed and 4°C 1 hr exposed wild type (WT) and whole-body Tigar knockout (TKO) mice as described in ‘Method details’.
The data was used in Figure 3—figure supplement 1.
- https://cdn.elifesciences.org/articles/73360/elife-73360-fig3-figsupp1-data1-v2.xlsx
Figure 3—figure supplement 2
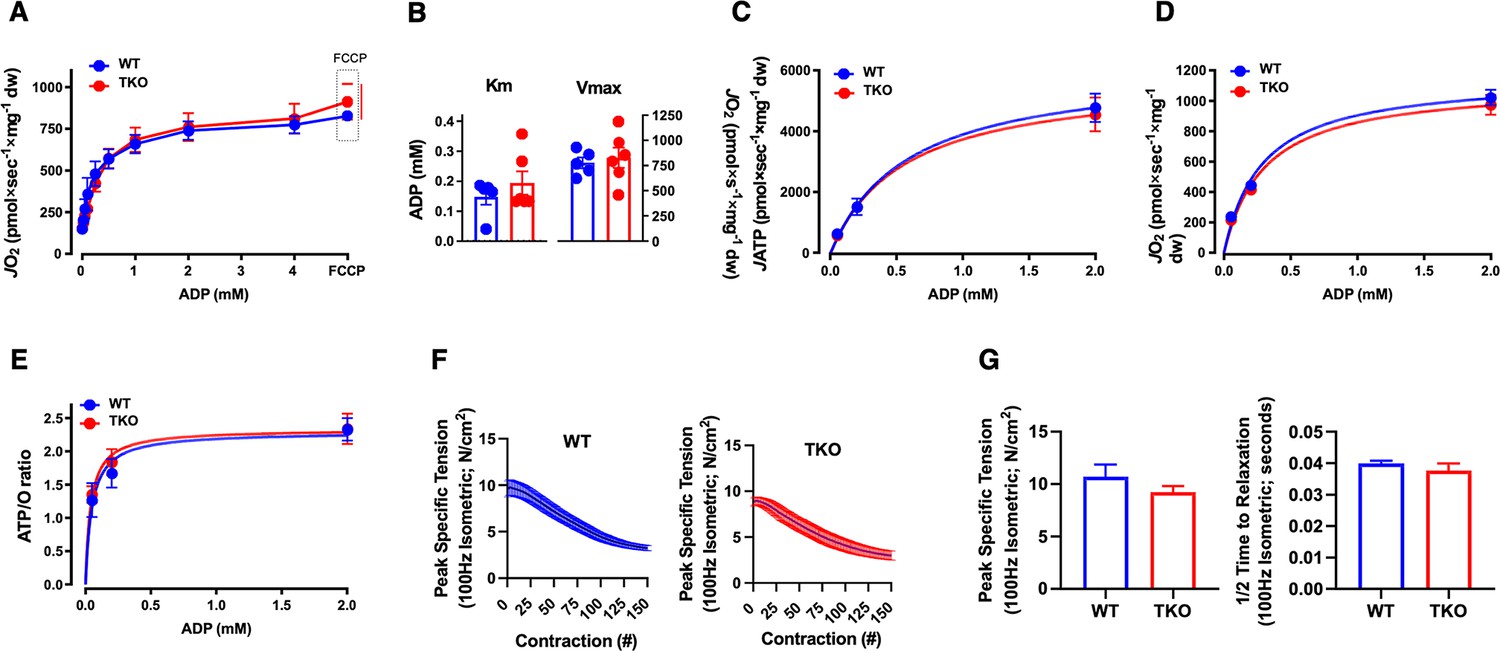
TIGAR deficiency has no significant effect on intrinsic skeletal muscle mitochondrial oxidative phosphorylation activity or ATP production.
Permeabilized skeletal muscle fiber bundles were prepared from red portions of the gastrocnemius muscle from wild type (WT) and whole-body Tigar knockout (TKO) mice immediately after 1 hr cold exposure. (A) Oxygen consumption rate (JO2) as a function of ADP concentration. (B) The Km and Vmax for ADP-stimulatory respiratory kinetics. (C) Rates of ATP production (JATP) and (D) oxygen consumption (JO2) measured simultaneously under clamped submaximal and maximal ADP-demand states. (E) ATP/O efficiency ratios. (F) Force-frequency of the extensor digitorum longus muscle isolated from the WT and TKO mice. (G) Peak-specific tension and time to one-half relaxation of the extensor digitorum longus muscle from the WT and TKO mice.
Figure 4 with 2 supplements
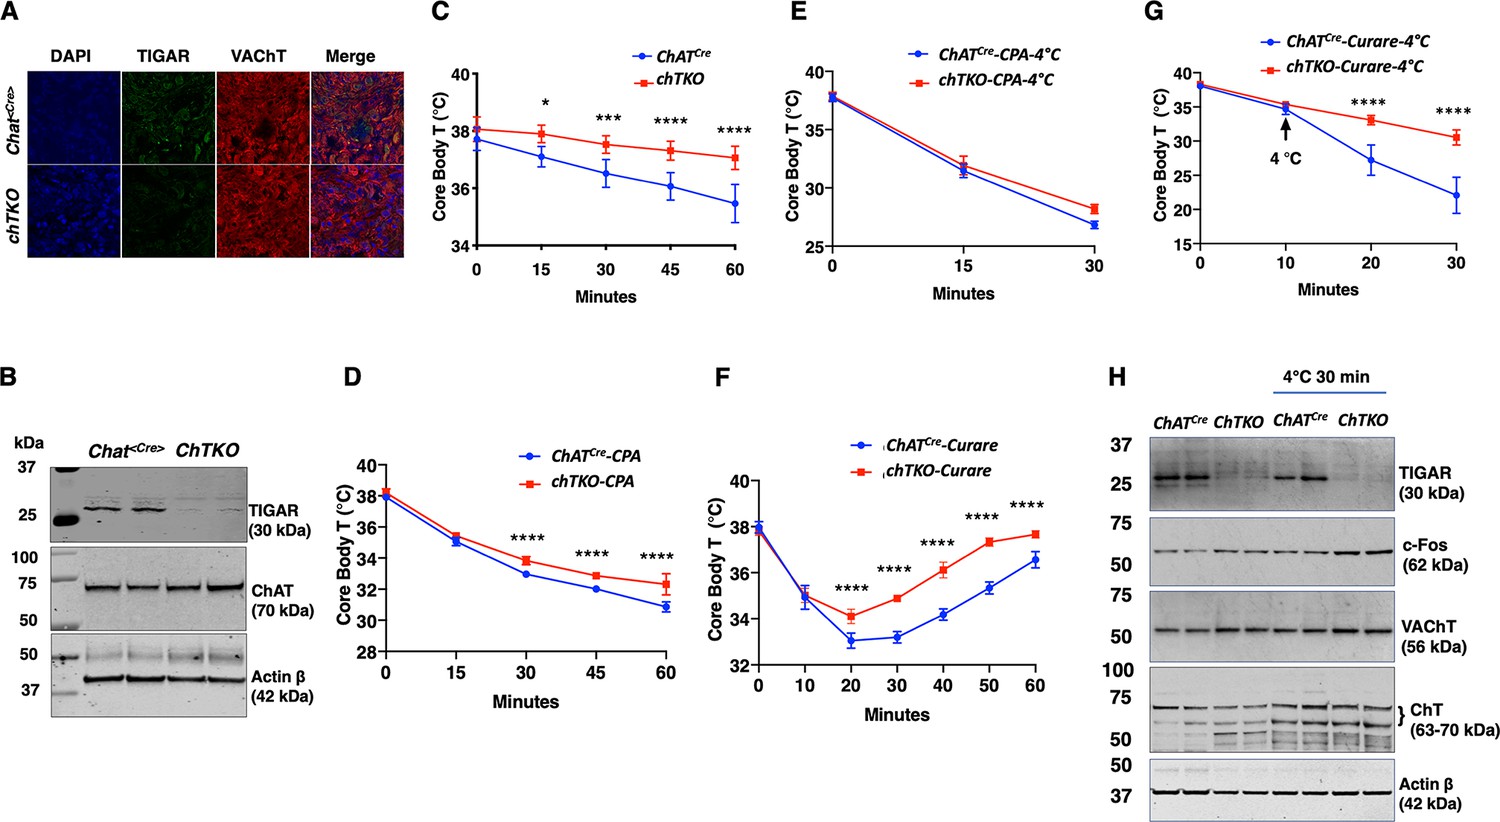
Cholinergic neuron-specific TIGAR knockout mice recapitulate the protection against hypothermia of the whole-body TIGAR-deficient mice.
(A) Representative immunofluorescent images showing TIGAR, vesicular acetylcholine transporter (VAChT), and nuclei (DAPI) in the superior cervical ganglions (SCGs) from the control ChatCre and cholinergic neuron-specific Tigar knockout (chTKO) male mice. (B) Representative TIGAR, choline acetyltransferase (ChAT), and actin protein immunoblots of the SCG from two independent control ChatCre and chTKO male mice. (C) Male ChatCre and chTKO mice (n = 6) core body temperatures were measured every 15 min starting at ambient laboratory temperature (0 min) and following placement at 4°C. (D) Male ChatCre and chTKO mice (n = 6) were intraperitoneally injected with cyclopiazonic acid (CPA,10 mg/kg body weight) at room temperature and core body temperature measured every 15 min. (E) ChatCre and chTKO male mice (n = 6) were intraperitoneally injected with CPA (10 mg/kg body weight) at room temperature, shifted to 4°C, and core body temperature measured every 15 min. (F) Male ChatCre and chTKO mice (n = 6) were intraperitoneally injected with tubocurare (0.4 mg/kg body weight), and then core body temperature was measured every 15 min at room temperature. (G) ChatCre and chTKO mice (n = 6) were intraperitoneally injected with tubocurare (0.4 mg/kg body weight) at room temperature and 10 min later shifted to 4°C for 30 min. Core body temperature was measured every 10 minutes. (H) Representative TIGAR, c-Fos, VAChT, ChT, and actin protein immunoblots of the SCG from two independent control ChatCre and chTKO male mice at room temperature or shifted to 4°C for 30 min. Statistical analyses are described in ‘Method details,’ and the data are presented as the mean ± SD. *p<0.05, **p<0.01, ***p<0.001, ****p<0.0001.
-
Figure 4—source data 1
The superior cervical ganglion (SCG) tissues were collected and snap-frozen in liquid nitrogen from the ChatCre and cholinergic neuron-specific Tigar knockout (chTKO) mice, as shown in Figure 4—figure supplement 1 for SCG dissection.
The SCGs from the three mice of the same strain were pooled and processed by beads homogenization to acquire tissue lysates. 15 μg of the tissue lysate were used for TIGAR (30 kDa) immunoblotting analysis as described in the ‘Immunoblotting’ section. The left four lanes of the raw image (lysate from the mice at ambient temperature) were used for Figure 4B to confirm the efficiency of TIGAR protein loss in SCG of the chTKO mice. A detailed description of the raw images is shown in Source data 1.
- https://cdn.elifesciences.org/articles/73360/elife-73360-fig4-data1-v2.zip
-
Figure 4—source data 2
The superior cervical ganglion (SCG) tissues were collected and snap-frozen in liquid nitrogen from the ChatCre and cholinergic neuron-specific Tigar knockout (chTKO) mice, as shown in Figure 4—figure supplement 1 for SCG dissection.
The SCGs from the three mice of the same strain were pooled and processed by beads homogenization to acquire tissue lysates. 15 μg of the tissue lysate were used for choline acetyltransferase (ChAT, 70 kDa) immunoblotting analysis as described in the ‘Immunoblotting’ section. The left four lanes of the raw image (lysate from the mice at ambient temperature) were used for Figure 4B. A detailed description of the raw images is shown in Source data 1.
- https://cdn.elifesciences.org/articles/73360/elife-73360-fig4-data2-v2.zip
-
Figure 4—source data 3
The superior cervical ganglion (SCG) tissues were collected and snap-frozen in liquid nitrogen from the ChatCre and cholinergic neuron-specific Tigar knockout (chTKO) mice, as shown in Figure 4—figure supplement 1 for SCG dissection.
The SCGs from the three mice of the same strain were pooled and processed by beads homogenization to acquire tissue lysates. 15 μg of the tissue lysate were used for actin β (42 kDa) immunoblotting analysis as described in the ‘Immunoblotting’ section. The left four lanes of the raw image (lysate from the mice at ambient temperature) were used for Figure 4B. A detailed description of the raw images is shown in Source data 1.
- https://cdn.elifesciences.org/articles/73360/elife-73360-fig4-data3-v2.zip
-
Figure 4—source data 4
The superior cervical ganglion (SCG) tissues were collected and snap-frozen in liquid nitrogen from both ambient temperature housed and 4°C 30 min exposed ChatCre and cholinergic neuron-specific Tigar knockout (chTKO) mice, as shown in Figure 4—figure supplement 1 for SCG dissection.
The SCGs from the three mice of the same strain were pooled and processed by beads homogenization to acquire tissue lysates. 15 μg of the tissue lysate were used for TIGAR (30 kDa) immunoblotting analysis as described in the ‘Immunoblotting’ section. The right eight lanes of the raw image (lysate from SCG tissues) was used for Figure 4H to confirm the efficiency of TIGAR protein loss in SCG of the chTKO mice. The left two lanes of the raw immunoblotting image represent the lysates of soluble fraction (RIPA lysis buffer extracted) of whole-brain tissues from the ChatCre and chTKO mice, respectively. A detailed description of the raw images is shown in Source data 1.
- https://cdn.elifesciences.org/articles/73360/elife-73360-fig4-data4-v2.zip
-
Figure 4—source data 5
The superior cervical ganglion (SCG) tissues were collected and snap-frozen in liquid nitrogen from both ambient temperature housed and 4°C 30 min exposed ChatCre and cholinergic neuron-specific Tigar knockout (chTKO) mice, as shown in Figure 4—figure supplement 1 for SCG dissection.
The SCGs from the three mice of the same strain were pooled and processed by beads homogenization to acquire tissue lysates. 15 μg of the tissue lysate were used for c-Fos (62 kDa) immunoblotting analysis as described in the ‘Immunoblotting’ section. The right eight lanes of the raw image (lysate from SCG tissues) were used for Figure 4H to show the increase in c-Fos protein in SCG of the chTKO mice under cold exposed. The left two lanes of the raw immunoblotting image represent the lysates of soluble fraction (RIPA lysis buffer extracted) of whole-brain tissues from the ChatCre and chTKO mice, respectively. A detailed description of the raw images is shown in Source data 1.
- https://cdn.elifesciences.org/articles/73360/elife-73360-fig4-data5-v2.zip
-
Figure 4—source data 6
The superior cervical ganglion (SCG) tissues were collected and snap-frozen in liquid nitrogen from both ambient temperature housed and 4°C 30 min exposed ChatCre and cholinergic neuron-specific Tigar knockout (chTKO) mice, as shown in Figure 4—figure supplement 1 for SCG dissection.
The SCGs from the three mice of the same strain were pooled and processed by beads homogenization to acquire tissue lysates. 15 μg of the tissue lysate were used for vesicular acetylcholine transporter (VAChT, 55 kDa) immunoblotting analysis as described in the ‘Immunoblotting’ section. The right eight lanes of the raw image (lysate from SCG tissues) were used for Figure 4H to show VAChT protein in the SCGs. The left two lanes of the raw immunoblotting image represent the lysates of soluble fraction (RIPA lysis buffer extracted) of whole-brain tissues from the ChatCre and chTKO mice, respectively. A detailed description of the raw images is shown in Source data 1.
- https://cdn.elifesciences.org/articles/73360/elife-73360-fig4-data6-v2.zip
-
Figure 4—source data 7
The superior cervical ganglion (SCG) tissues were collected and snap-frozen in liquid nitrogen from both ambient temperature housed and 4°C 30 min exposed ChatCre and cholinergic neuron-specific Tigar knockout (chTKO) mice, as shown in Figure 4—figure supplement 1 for SCG dissection.
The SCGs from the three mice of the same strain were pooled and processed by beads homogenization to acquire tissue lysates. 15 μg of the tissue lysate were used for choline transporter (ChT, 55 kDa) immunoblotting analysis as described in the ‘Immunoblotting’ section. The right eight lanes of the raw image (lysate from SCG tissues) were used for Figure 4H to show ChT protein in that 63 and 70 kDa bands were observed in the SCGs. The left two lanes of the raw immunoblotting image represent the lysates of soluble fraction (RIPA lysis buffer extracted) of whole-brain tissues from the ChatCre and chTKO mice, respectively. A detailed description of the raw images is shown in Source data 1.
- https://cdn.elifesciences.org/articles/73360/elife-73360-fig4-data7-v2.zip
-
Figure 4—source data 8
The superior cervical ganglion (SCG) tissues were collected and snap-frozen in liquid nitrogen from both ambient temperature housed and 4°C 30 min exposed ChatCre and cholinergic neuron-specific Tigar knockout (chTKO) mice, as shown in Figure 4—figure supplement 1 for SCG dissection.
The SCGs from the three mice of the same strain were pooled and processed by beads homogenization to acquire tissue lysates. 15 μg of the tissue lysate were used for actin β (42 kDa) immunoblotting analysis as described in the ‘Immunoblotting’ section. The right eight lanes of the raw image (lysate from SCG tissues) were used for Figure 4H to show actin β protein in the SCGs. The left two lanes of the raw immunoblotting image represent the lysates of soluble fraction (RIPA lysis buffer extracted) of whole-brain tissues from the ChatCre and chTKO mice, respectively. A detailed description of the raw images is shown in Source data 1.
- https://cdn.elifesciences.org/articles/73360/elife-73360-fig4-data8-v2.zip
Figure 4—figure supplement 1

Mouse superior cervical ganglion (SCG) dissection.
(A) The mouse ventral midline of the neck up to the mandible was incised and the salivary glands were exposed. (B) The sternocephalicus and posterior belly digastric muscles were retracted after the removal of salivary glands. (C) The carotid bifurcation and carotid sheath were identified. (D) The SCG behind the carotid sheath was isolated, and the fresh SCGs in two sides were subjected to immunofluorescence imaging and Western blotting experiments for Figure 4. (E) A representative image of SCG from ChAT<Cre> and chTKO, respectively, is shown.
Figure 4—video 1
Cholinergic neuron-specific Tigar knockout (chTKO) mice are resistant to the paralytic effects of tubocurare.
Representative video clip of the control ChatCre and chTKO male mice behavior under ambient temperature and at 4°C following intraperitoneal injection of tubocurare (0.4 mg/kg body weight). Rectal temperature recording of ChatCre and chTKO mice with curare injection was performed on February 7, 2019. The date of birth of both ChatCre and chTKO mice was October 6, 2018. The body weights of ChatCre and chTKO were 25.4 g and 27.7 g, respectively. The volume of curare saline solution (0.1 mg/ml in saline) for intraperitoneal (IP) injection was 101.6 µl for the ChatCre mouse and 110.8 µl for the chTKO mouse. The mice were IP injected with curare, then caged at ambient temperature (21–23°C) for 10 min, and subsequently transferred into a pre-chilled cage in a cold chamber at 4°C for 20 min. The mice were taken back to the cages at ambient temperature (see the sketch below). Rectal temperature was recorded at the time of curare injection and every 10 min thereafter (see the table in the text). The mouse in the left cage is ChatCre, and the mouse in the right cage is chTKO.
Figure 5

Skeletal muscles of the cholinergic neuron-specific Tigar knockout (chTKO) mice at 4°C display increased pentose phosphate pathway, purine nucleotide cycle, and amino acid utilization pathways.
The control ChatCre and chTKO male mice (n = 4–6) were maintained at room temperature (RT) or shifted to 4°C for 1 hr. Quadricep white skeletal muscles were isolated and extracts were subjected to widely targeted (multiple reaction monitoring [MRM]) small metabolite profiling using an ABSciex 6500 + QTRAP with ACE PFP and Merck ZIC-pHILIC columns as described in ‘Materials and methods.’ The heatmap shows the metabolites/pathways differentially identified with the corresponding p-values.
-
Figure 5—source data 1
Raw metabolites data were collected in the gastrocnemius muscle of both ambient temperature housed and 4°C 1 hr exposed ChatCre and cholinergic neuron-specific Tigar knockout (chTKO) mice as described in ‘Method details’.
The data was used in Figure 5.
- https://cdn.elifesciences.org/articles/73360/elife-73360-fig5-data1-v2.xlsx
Figure 6 with 1 supplement

TIGAR deficiency increases acetylcholine biosynthesis and acetylcholine receptor clustering at the neuromuscular junction.
(A) Representative images of α-bungarotoxin immunofluorescent labeling of nicotinic acetylcholine receptor clusters in the extensor digitorium longus (EDL) muscle from wild type (WT) and whole-body Tigar knockout (TKO) mice. (B) Quantification of the number of nicotinic acetylcholine receptor clusters following 15 min exposure at 4°C (WT n = 17, TKO n = 13). These data represent the average of over six mice in each group of mean ± SD (unpaired t-test, two-tailed, **p=0.0035). (C) Acetylcholine levels in the gastrocnemius muscle of WT and TKO male (n = 7) mice at room temperature or following 1 hr at 4°C. (D) Acetylcholine levels in the gastrocnemius muscle of ChatCre and chTKO male (n = 6) mice at room temperature or following 1 hr at 4°C. (E) Representative immunoblots of TIGAR and actin proteins from two scrambled sgRNA and two Tigar sgRNA knockout Sh-SY5Y cell lines. (F) Acetylcholine concentrations in the medium of scrambled and TKO SH-SH5Y neuroblastoma cells. (G) m2 acetylcholine enrichments in cells labeled with d-glucose-1,2-13C2. (H) m2 acetylcholine enrichments in cells labeled with U-13C6 d-glucose. (I) m1 glutamate (m/z 128, C2-C4 fragment) enrichment in the medium of scrambled and TKO SH-SY5Y human neuroblastoma cells labeled with d-glucose-[1,2]-13 C2. Statistical analyses are described in ‘Method details,’ and the data are presented as the mean ± SD. *p<0.05, ***p<0.001, ****p<0.0001.
-
Figure 6—source data 1
The culture SH-SY5Y cells were collected from both scrambled and whole-body Tigar knockout (TKO) cells, and 30 μg of the cell lysates were used for TIGAR (30 kDa) immunoblotting analysis as described in the ‘Immunoblotting’ section.
The left four lanes of the raw image (lysate from neuroblastoma cells) were used for Figure 6E to confirm the efficiency of TIGAR protein loss in the SH-SY5Y neuroblastoma TKO cells. The right four lanes of the raw image represent the TIGAR immunoblotting of the cell lysates from 7-day differentiated neuroblastoma cells. A detailed description of the raw images is shown in Source data 1.
- https://cdn.elifesciences.org/articles/73360/elife-73360-fig6-data1-v2.zip
-
Figure 6—source data 2
The culture SH-SY5Y cells were collected from both scrambled and whole-body Tigar knockout (TKO) cells, and 30 μg of the cell lysates were used for actin β (42 kDa) immunoblotting analysis as described in the ‘Immunoblotting’ section.
The left four lanes of the raw image (lysate from neuroblastoma cells) were used for Figure 6E to show actin β protein in the SH-SY5Y neuroblastoma cells. The right four lanes of the raw image represent the actin β immunoblotting of the cell lysates from 7-day differentiated neuroblastoma cells. A detailed description of the raw images is shown in Source data 1.
- https://cdn.elifesciences.org/articles/73360/elife-73360-fig6-data2-v2.zip
Figure 6—figure supplement 1
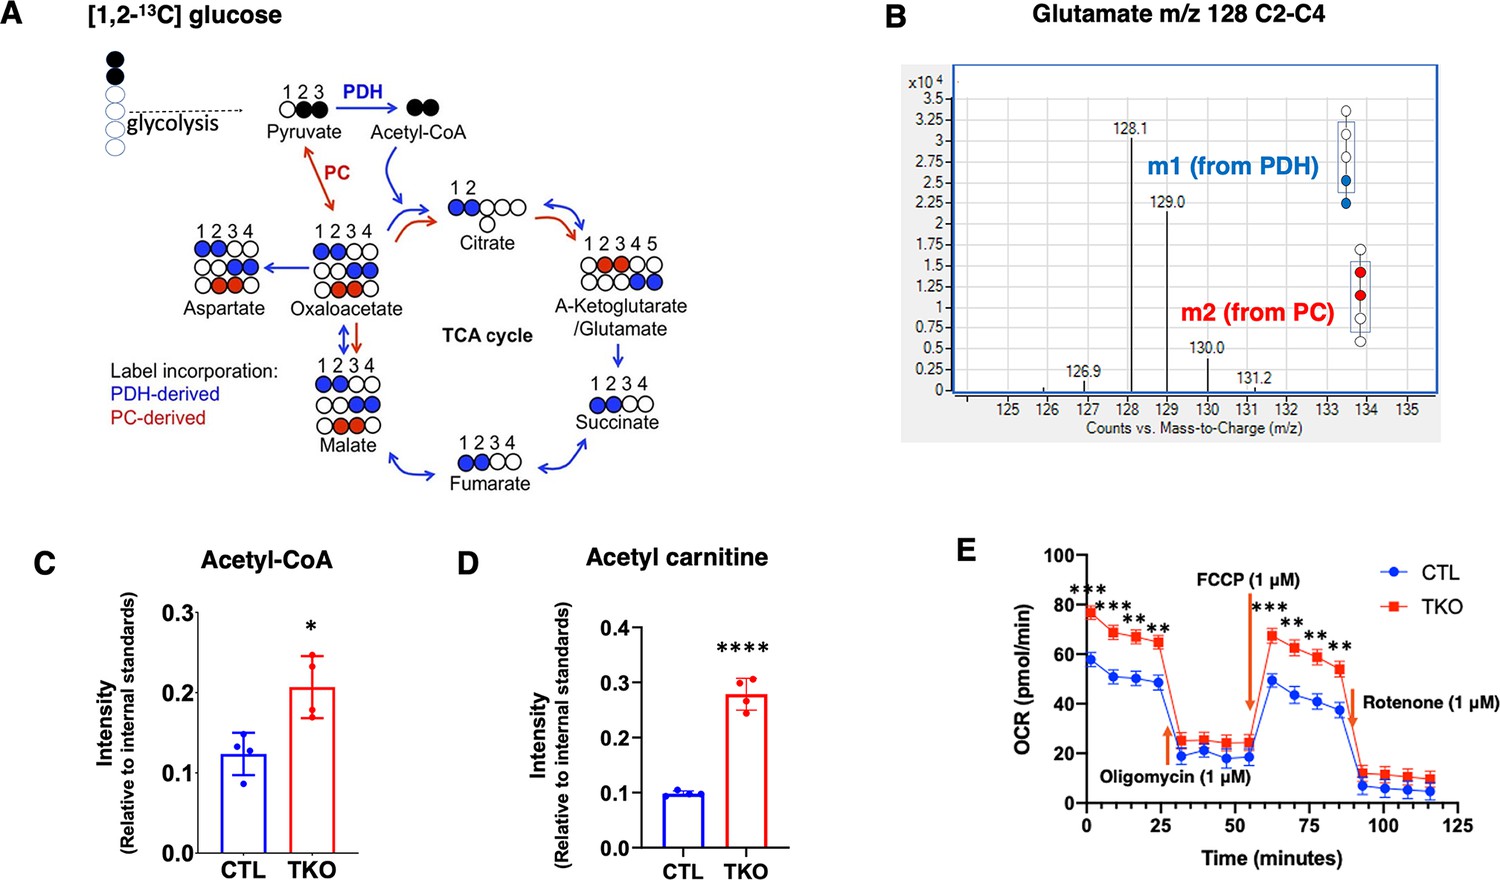
Summation of flux results through glycolysis and the TCA cycle using [1,2]–13C-glucose by assessing glutamate isotopomers.
(A) [13]-13C-glucose becomes [2,3]-13C pyruvate if it is directly metabolized through the glycolytic pathway. [2,3]-13C-pyruvate can enter the TCA cycle through pyruvate dehydrogenase (PDH) or pyruvate carboxylase (PC). Blue dots indicate 13C carbons from glucose entering TCA cycle via PDH. Red dots indicate 13C carbons from glucose entering TCA cycle via PC. (B) Representative spectra of the glutamate C2-C4 fragments from TIGAR knockout SH-SY5Y cells labeled with d-glucose-[1,2]-13 C2. M0 of the C2-C4 glutamate fragment is m/z 128, m1 of glutamate is m/z 129 (blue) that indicates the presence of 13C at the fourth carbon position, and m2 glutamate indicates the presence of 13C at the second and third carbon positions (red). (C) The cellular acetyl-CoA and (D) acetyl-carnitine levels in SH-SY5Y cell pellets were measured as described in ‘Method details,’ and the data are presented as the mean ± SD. (E) Seahorse flux analyses of oxygen consumption rate (OCR) were performed as described in ‘Method details,’ and the data are presented as the mean ± SEM. Statistical analyses are described in ‘Method details.’ *p<0.05, **p<0.01, ***p<0.001, ****p<0.0001.
-
Figure 6—figure supplement 1—source data 1
Raw metabolites data including cellular acetyl-CoA and acetyl-carnitine were collected from SH-SY5Y control and whole-body Tigar knockout (TKO) cell pellet as described in ‘Method details’.
The data was used in Figure 6—figure supplement 1.
- https://cdn.elifesciences.org/articles/73360/elife-73360-fig6-figsupp1-data1-v2.xlsx
Figure 7
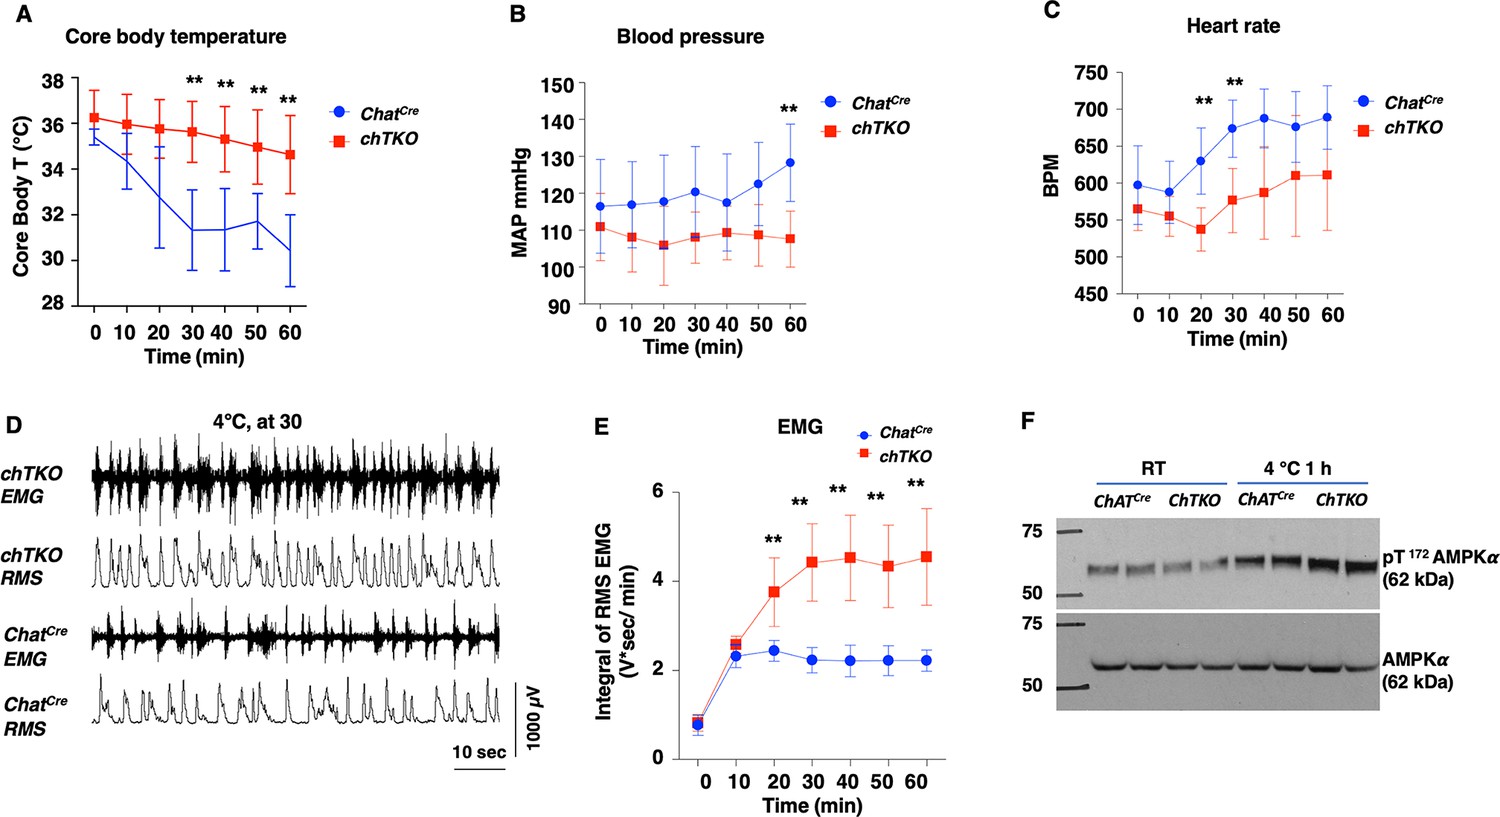
The cholinergic neuron-specific Tigar knockout (chTKO) mice display enhanced cold-stimulated skeletal muscle shivering activity and increased cholinergic tone.
(A) Male mice core body temperatures (ChatCre n = 7, TKO n = 10), (B) blood pressure (mmHg) (ChatCre n = 7, chTKO n = 10), (C) heart rate (beats per minute, BPM) (ChatCre n = 7, chTKO n = 6), (D) representative electromyography (EMG) traces and root mean squares (RMS) for ChatCre and chTKO male mice when shifted to 4°C for 30 min, and (E) neck EMG (ChatCre n = 5, chTKO n = 6) were measured continuously starting at ambient laboratory temperature (0 min) and for 60 min following placement at 4°C. (F) Extensor digitorium longus (EDL) muscles from two independent control ChatCre and chTKO male mice at room temperature (RT) or shifted to 4°C for 1 hr were isolated, and tissue extracts were immunoblotted with an antibody for the phospho-threonine 172 AMPKα subunit (pT172-AMPKα) or total α subunit (AMPKα). Statistical analyses are described in ‘Method details,’ and the data are presented as the mean ± SD. **p<0.01.
-
Figure 7—source data 1
The extensor digitorum longus (EDL) muscles were collected from both ambient temperature housed and 4°C 1 hr exposed ChatCre and cholinergic neuron-specific Tigar knockout (chTKO) mice, and 30 μg of the tissue lysate were used for AMPKα (62 kDa) immunoblotting analysis as described in the ‘Immunoblotting’ section.
The raw image was used for Figure 7F. A detailed description of the raw images is shown in Source data 1.
- https://cdn.elifesciences.org/articles/73360/elife-73360-fig7-data1-v2.zip
-
Figure 7—source data 2
The extensor digitorum longus (EDL) muscles were collected from both ambient temperature housed and 4°C 1 hr exposed ChatCre and cholinergic neuron-specific Tigar knockout (chTKO) mice, and 30 μg of the tissue lysate were used for phospho-Thr172AMPKα (62 kDa) immunoblotting analysis as described in the ‘Immunoblotting’ section.
The raw image was used for Figure 7F. A detailed description of the raw images is shown in Source data 1.
- https://cdn.elifesciences.org/articles/73360/elife-73360-fig7-data2-v2.zip
Tables
Key resources table
| Reagent type (species) or resource | Designation | Source or reference | Identifiers | Additional information |
|---|---|---|---|---|
| Strain, strain background (Escherichia coli) | Mix & Go Competent Cells-Strain HB10 | Zymo Research | T3013 | |
| Genetic reagent (Mus musculus) | Tigar-/- (TKO) (C57BL/6J) | PMCID:PMC5961042 | MMRRC, Cat# 063577-UCD | |
| Genetic reagent (M. musculus) | C57BL/6N-Tigartm1b(EUCOMM)Wtsi/Wtsi | Welcome Trust Sanger Institute (Hinxton Cambridge, UK) | IMSR Cat# EM:09836;RRID:IMSR_ EM:09836 | |
| Genetic reagent (M. musculus) | Myl1Cre:Myl1tm1(cre)Sjb/J | The Jackson Laboratory | RRID:IMSR_JAX:024713 | |
| Genetic reagent (M. musculus) | ChatCre: B6J.129S6-Chattm2(cre)Lowl/MwarJ | The Jackson Laboratory | RRID:IMSR_ JAX:028861 | |
| Genetic reagent (M. musculus) | Tigarfl/fl(C57BL/6J) | This study | N/A | Described in ‘Mice models’ |
| Genetic reagent (M. musculus) | Tigarfl/flAdipoqCre (C57BL/6J) | This study | N/A | Described in ‘Mice models’ |
| Genetic reagent (M. musculus) | Tigarfl/flMyl1Cre (C57BL/6J) | This study | N/A | Described in ‘Mice models’ |
| Genetic reagent (M. musculus) | Tigarfl/fl/ChatCre (C57BL/6J) | This study | N/A | Described in ‘Mice models’ |
| Genetic reagent (M. musculus) | Ucp1-/- (UKO)(C57BL/6J) | Laboratory of Victor L. Schuster | Albert Einstein College of Medicine | Described in ‘Mice models’ |
| Genetic reagent (M. musculus) | Tigar-/-/Ucp1-/- (UTKO) (C57BL/6J) | This study | N/A | Described in ‘Mice models’ |
| Cell line (Homo sapiens) | SH-SY5Y neuroblastoma | ATCC | ATCC CRL-2266 | |
| Cell line (Homo sapiens) | SH-SY5YControl neuroblastoma | This study | N/A | Materials and methods |
| Cell line (Homo sapiens) | SH-SY5YTIGAR knockout neuroblastoma | This study | N/A | Materials and methods |
| Antibody | Anti-c-Fos (9F6) (rabbit monoclonal) | Cell Signaling Technology | Cat# 2250S; RRID:AB_2247211 | (1:1000) |
| Antibody | Rabbit anti-AMPKα | Cell Signaling Technology | Cat# 2532S; RRID:AB_330331 | (1:1000) |
| Antibody | Rabbit anti-AMPKα phospho (Thr172) | Cell Signaling Technology | Cat# 2535S; RRID:AB_331250 | (1:1000) |
| Antibody | Anti-UCP1 (EPR20381) (rabbit monoclonal) | Abcam | Cat# ab209483; RRID:AB_2722676 | (1:2000) |
| Antibody | Anti-TIGAR (rabbit polyclonal) | Millipore/Sigma | Cat# AB10545; RRID:AB_10807181 | (1:1000) |
| Antibody | Anti-VChAT (IF) (goat polyclonal) | ImmunoStar | Cat# 24286; RRID:AB_572269 | (1:100) |
| Antibody | Anti-VChAT (rabbit polyclonal) | Thermo Fisher Scientific | Cat# PA5-95404; RRID:AB_2807207 | (1:1000) |
| Antibody | Anti-ChAT (rabbit monoclonal) | MilliporeSigma | Cat# AB144P; RRID:AB_2079751 | (1:1000) |
| Antibody | Rabbit anti-choline transporter | Thermo Fisher Scientific | Cat# PA5-77385; RRID:AB_2736619 | (1:1000) |
| Antibody | Anti-TIGAR (E-2) (mouse monoclonal) | Santa Cruz Biotechnology | Cat# sc-166290; RRID:AB_2066582 | (1:250) |
| Antibody | Anti-TIGAR (E-2) Alexa Fluor 488 (IF) (mouse monoclonal) | Santa Cruz Biotechnology | Cat# sc-166290 AF488 | (1:100) |
| Antibody | Alexa Fluor 594 donkey anti-goat IgG (H+L) | Thermo Fisher Scientific | Cat# A-11058; RRID:AB_2534105 | (1:1000) |
| Antibody | Anti-β-actin (C4) (mouse monoclonal) | Santa Cruz Biotechnology | Cat# sc-47778; RRID:AB_626632 | (1:300) |
| Antibody | Anti-vinculin (7F9) (mouse monoclonal) | Santa Cruz Biotechnology | Cat# sc-73614; RRID:AB 1131294 | (1:300) |
| Antibody | Goat anti-mouse IgG-HRP | Santa Cruz Biotechnology | Cat# sc-2005 | (1:5000) |
| Antibody | Goat anti-rabbit IgG (H+L), HRP | Fisher Scientific | Cat# PI32460 | (1:5000) |
| Antibody | Goat anti-rabbit 800CW | LI-COR | Cat#926-32211 | (1:6000) |
| Antibody | Goat anti-mouse 800CW | LI-COR | Cat#926-32210 | (1:6000) |
| Antibody | Donkey anti-goat 800CW | LI-COR | Cat#926-32214 | (1:6000) |
| Recombinant DNA reagent | 3xsgRNA/Cas9 all-in-one expression clone targeting TIGAR (NM_020375.2) | GeneCopoeia | Cat#HCP-215394-CG04-3 | |
| Recombinant DNA reagent | 3xsgRNA/Cas9 all-in-one expression clone scrambled sgRNA (control) | GeneCopoeia | Cat# CCPCTR01-CG04-B | |
| Sequence-based reagent | Tigar<fl/fl> genotyping forward | This study | IMSR Cat# HAR:7395; RRID:IMSR_HAR:7395(9514-9534) | 5’-AGGGGGTTG CACCTCTATCTC |
| Sequence-based reagent | Tigar<fl/fl> genotyping reverse | This study | IMSR Cat# HAR:7395; RRID:IMSR_HAR:7395(16933-16954) | 5’-CACACAAG AAGGAAGCTGTTGG |
| Commercial assay or kit | Direct-zol RNA MiniPrep with 200 ml TRI Reagent | Zymo Research | Cat# R2053 | |
| Commercial assay or kit | QuickDetect acetylcholine (ACh) (mouse) ELISA Kit | BioVision Inc | Cat# E4453-100 | |
| Commercial assay or kit | PowerPrep HP Plasmid Maxiprep Kits with Prefilters | Origene | NP100025 | |
| Commercial assay or kit | Ceria Stabilized Zirconium Oxide Beads | MidSci | Cat# GB01 | |
| Commercial assay or kit | ProLong Gold Antifade Reagent with DAPI | Cell Signaling Technology | Cat# 8961 | |
| Commercial assay or kit | SuperScript IV VILO Master Mix | Thermo Fisher Scientific Invitrogen | Cat# 11756050 | |
| Commercial assay or kit | TaqMan Universal Master Mix II, no UNG | Thermo Fisher Scientific Invitrogen | Cat# 4440049 | |
| Chemical compound, drug | Tubocurarine hydrochloride pentahydrate | Millipore/Sigma | Cat# T2379; CAS: 6989-98-6 | |
| Chemical compound, drug | Cyclopiazonic acid from Penicillium cyclopium | Millipore/Sigma | Cat# C1530; CAS: 18172-33-3 | |
| Chemical compound, drug | d-Glucose-1,2-13C2 | Millipore/Sigma | Cat# 453188; CAS: 138079-87-5 | |
| Chemical compound, drug | d-Glucose-13C6 | Millipore/Sigma | Cat# 389374; CAS: 110187-42-3 | |
| Chemical compound, drug | MG-132 | Millipore/Sigma | Cat# 474787; CAS: 133407-82-6 | |
| Chemical compound, drug | ALLN | Millipore/Sigma | Cat# 208719-25MG; CAS:110044-82-1 | |
| Chemical compound, drug | RIPA lysis buffer | Santa Cruz Biotechnology | Cat# sc-24948 | |
| Chemical compound, drug | Halt Protease and Phosphatase Inhibitor Cocktail | Thermo Fisher Scientific | Cat# 78442 | |
| Chemical compound, drug | Pierce Protein-Free T20 (TBS) Blocking Buffer | Thermo Fisher Scientific | Cat# 37571 | |
| Chemical compound, drug | SuperSignal West Pico Chemiluminescent Substrate | Thermo Fisher Scientific | Cat# 34080 | |
| Chemical compound, drug | SuperSignal West Femto Maximum Sensitivity Substrate | Thermo Fisher Scientific | Cat# 34096 | |
| Chemical compound, drug | 4% paraformaldehyde solution | Electron Microscopy Sciences | Cat#RT157-4 | |
| Chemical compound, drug | Vectashield Antifade Mounting Medium with DAPI | Vector Laboratories, Inc | Cat# H1200 | |
| Chemical compound, drug | DMEM medium without glucose, glutamine, and sodium pyruvate | Biological Industries USA | Cat#01-0571-1A | |
| Chemical compound, drug | DMEM medium no glucose, glutamine, and sodium pyruvate | Biological Industries USA | Cat#01-0571-1A | |
| Software, algorithm | Odyssey Application Software 2.0 | LI-COR | N/A | |
| Software, algorithm | GraphPad Prism 8 | GraphPad Software | http://www.graphpad.com/scientific-software/prism/ | |
| Software, algorithm | RQ Manager 1.2.1. | Thermo Fisher Scientific Applied Biosystems | N/A | |
| Software, algorithm | LD50 Calculator | AAT Bioquest | https://www.aatbio.com/tools/ld50-calculator | |
| Software, algorithm | Velocity software | Velocity Software, Inc | https://www.velocitysoftware.com/ | |
| Software, algorithm | MassHunter | Agilent Technologies | Version: B08.00 | |
| Software, algorithm | MultiQuant | ABSciex | Version: 3.0.2 | |
| Software, algorithm | LabChart 8.1 for Macintosh | ADInstruments | https://www.adinstruments.com/products/labchart | |
| Other | Thermalert Model TH-8 Temperature Monitor | Physitemp Instruments LLC. | Thermalert Model TH-8 | |
| Other | HD-X11 telemetric transponder probe | DSI, Harvard Bioscience, Inc | https://www.datasci.com/products/implantable-telemetry/small-animal-telemetry | |
| Other | DSI Implantable Telemetry | DSI, Harvard Bioscience, Inc | https://www.datasci.com/products/implantable-telemetry/small-animal-telemetry | |
| Other | GC-MS instrument | Agilent Technologies | Model: 5975C | |
| Other | DB-5MS column | Agilent Technologies | Cat#122-5532G | |
| Other | LC-MS/MS instrument | ABSciex | Model: 6500+ | |
| Other | ZIC-pHILIC column | Merck | Cat# 1.50460.0001 |
Additional files
-
Transparent reporting form
- https://cdn.elifesciences.org/articles/73360/elife-73360-transrepform1-v2.docx
-
Source data 1
Figure source data and legends.
- https://cdn.elifesciences.org/articles/73360/elife-73360-data1-v2.pdf
Download links
A two-part list of links to download the article, or parts of the article, in various formats.
Downloads (link to download the article as PDF)
Open citations (links to open the citations from this article in various online reference manager services)
Cite this article (links to download the citations from this article in formats compatible with various reference manager tools)
TIGAR deficiency enhances skeletal muscle thermogenesis by increasing neuromuscular junction cholinergic signaling
eLife 11:e73360.
https://doi.org/10.7554/eLife.73360


