Diversification of multipotential postmitotic mouse retinal ganglion cell precursors into discrete types
- Department of Chemical and Biomolecular Engineering; Helen Wills Neuroscience Institute; Center for Computational Biology; California Institute for Quantitative Biosciences, QB3, University of California, Berkeley, United States
- Biological Systems and Engineering Division, Lawrence Berkeley National Laboratory, United States
- Broad Institute of Harvard and MIT, United States
- Center for Brain Science and Department of Molecular and Cellular Biology, Harvard University, United States
- Department of Ophthalmology, Stein Eye Institute, UCLA David Geffen School of Medicine, United States
Figures
Figure 1 with 1 supplement
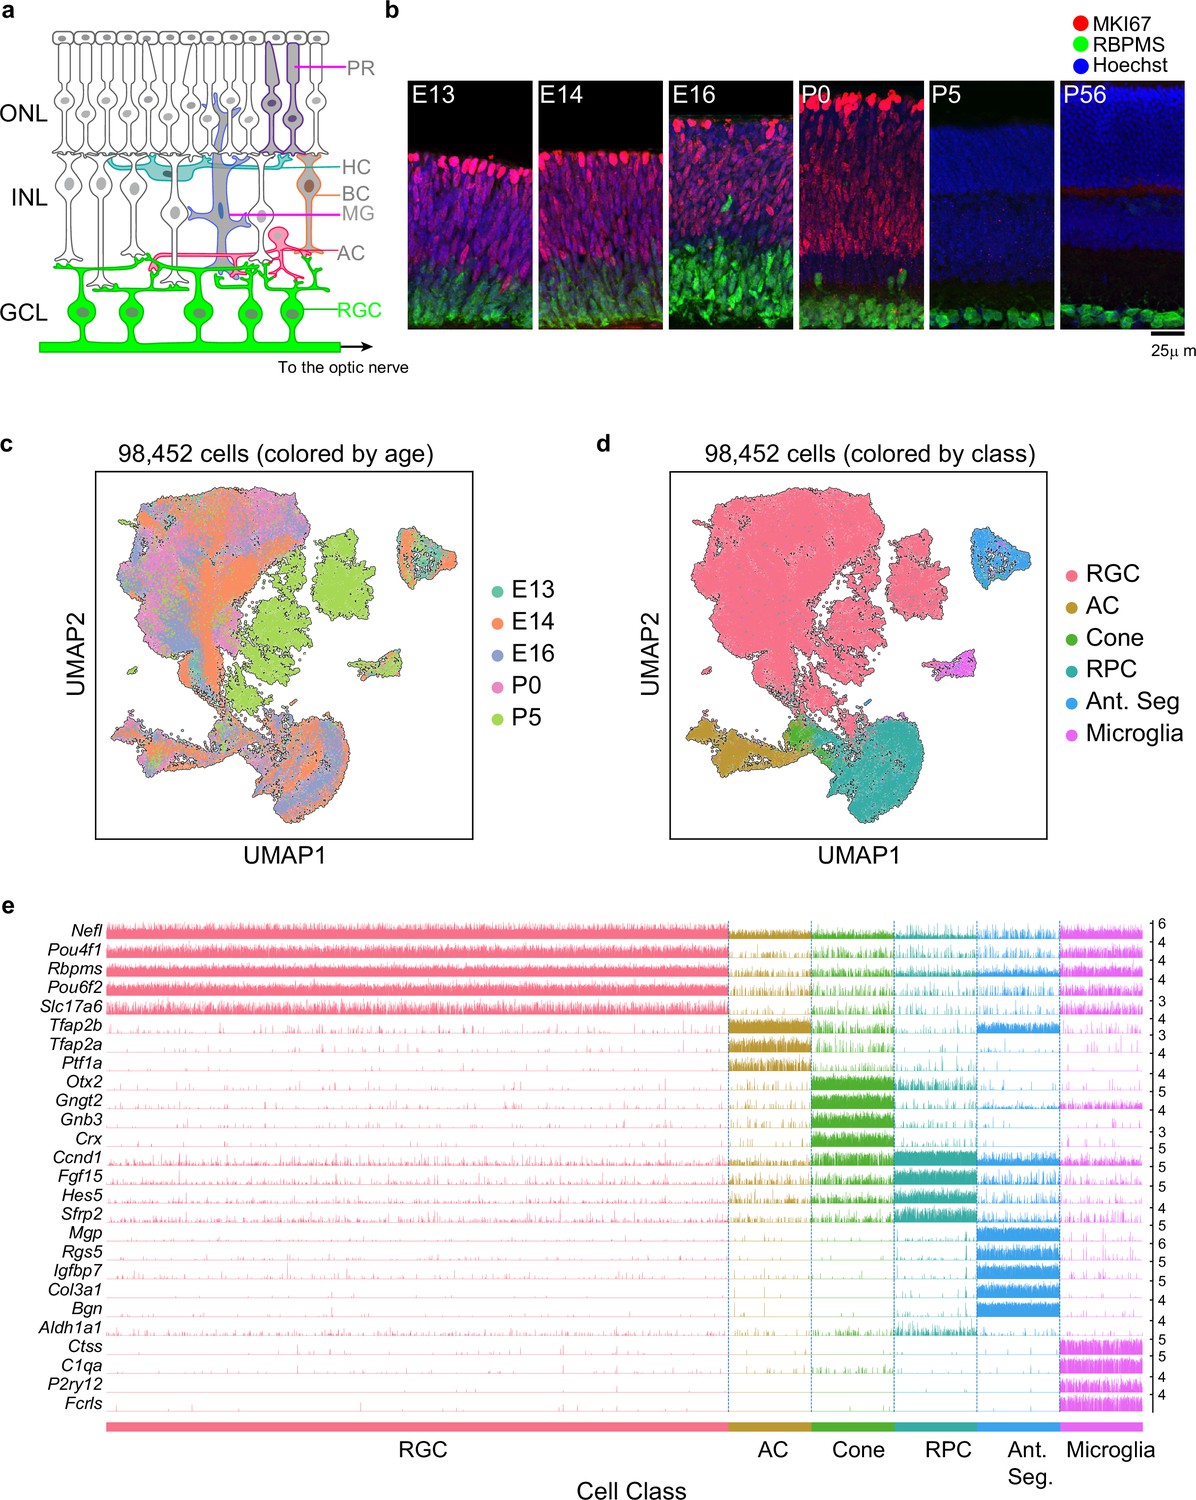
Transcriptomic profiling of single postmitotic retinal ganglion cells (RGCs) during embryonic and postnatal development in mice.
(a) Sketch of a section of the mouse retina showing major cell classes – photoreceptors (PRs; rods and cones), horizontal cells (HCs), bipolar cells (BCs), amacrine cells (ACs), Müller glia (MGs), and RGCs. PRs reside in the outer nuclear layer (ONL), while BCs, HCs, and most ACs reside in the inner nuclear layer (INL). RGCs and some ACs reside in the ganglion cell layer (GCL). Axons of RGCs project to higher visual areas via the optic nerve. (b) Retinal section of the indicated ages labeled for the cell cycle marker MKI67 (red) and the RGC marker RBPMS (green); nuclei are counterstained by the Hoeschst dye (blue). Micrographs are orientated as the schematic in panel (a). (c) Visualization of transcriptional diversity of 98,452 cells using Uniform Manifold Approximation and Projection (UMAP), a nonlinear dimensionality reduction algorithm that assigns proximal x-y coordinates to cells (dots) with similar transcriptional profiles (Becht et al., 2018). (d) Same as (c), with cells colored by cell class, assigned based on transcriptional signatures displayed in panel (e). RPC, retinal progenitor cells; Ant. Seg., anterior segment cells. (e) Tracksplot showing expression patterns of cell class-specific marker genes (rows) across single cells (columns). Cells are grouped by class as in (d). For each class, we randomly sampled 20% of total cells covering all immature time points (embryonic day [E]13, E14, E16, postnatal day [P]0, P5). For each gene, the scale on the y-axis (right) corresponds to normalized, log-transformed transcript counts detected in each cell.
Figure 1—figure supplement 1
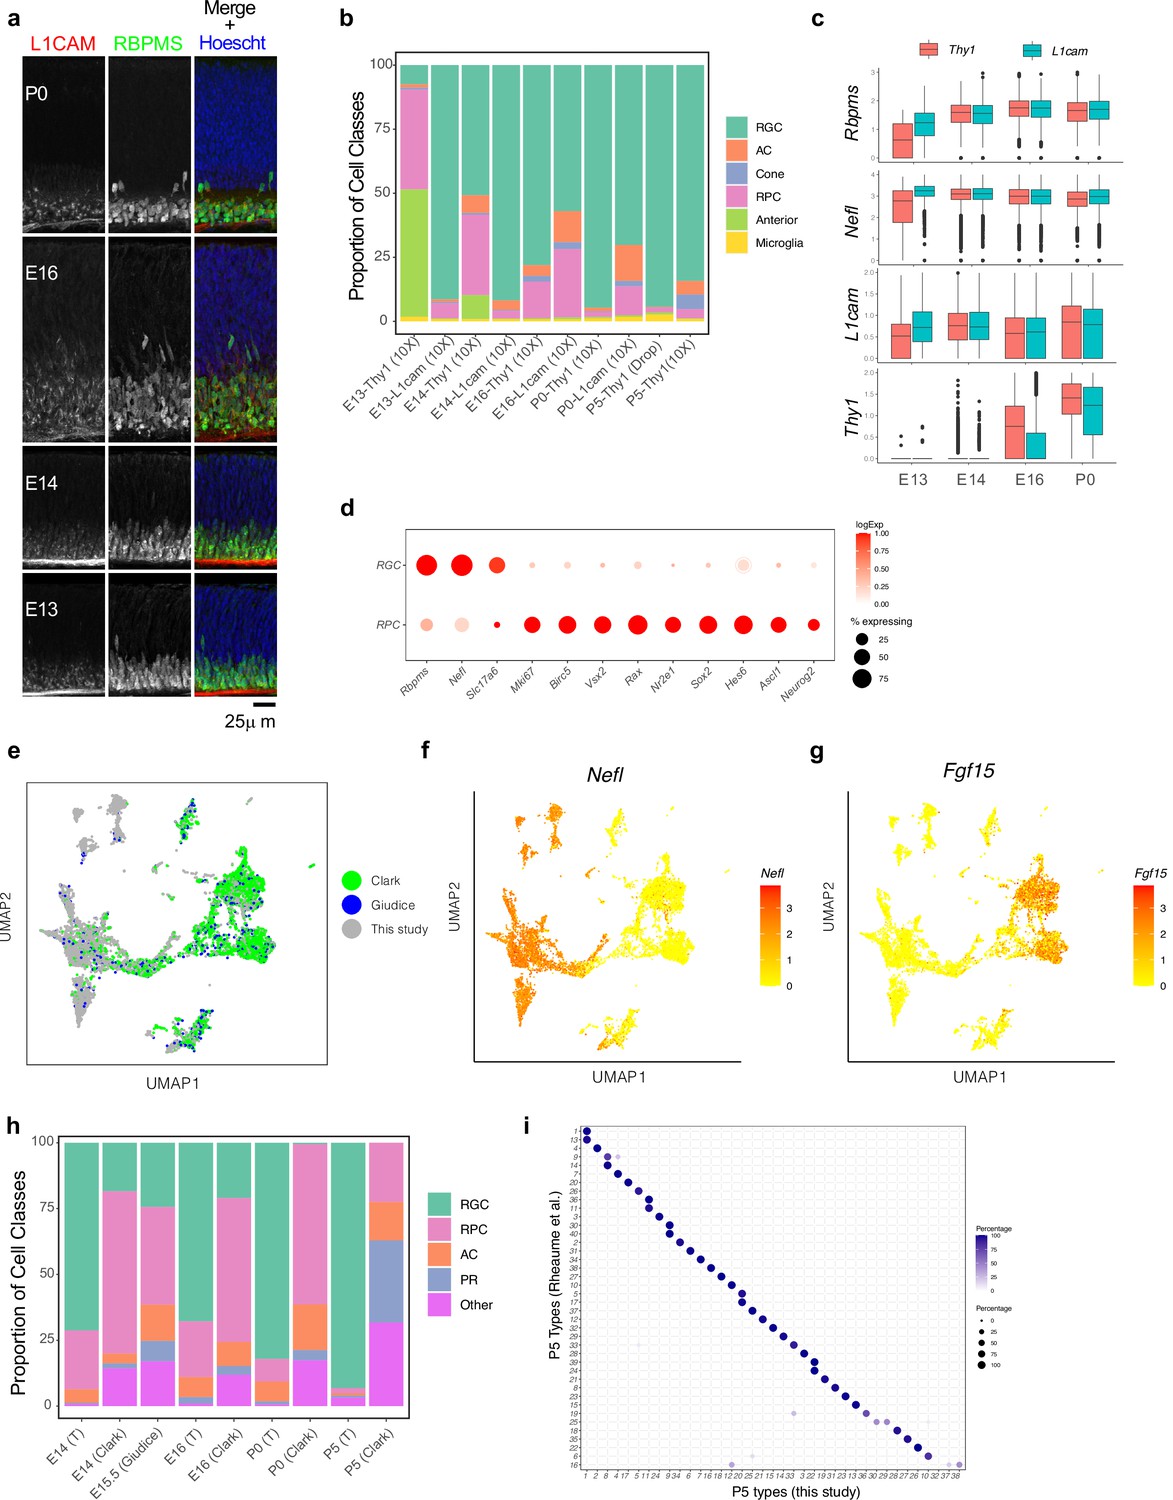
Separation of major transcriptomic groups and assessment of immature retinal ganglion cells (RGCs) at embryonic day (E)13 to postnatal day (P)5.
(a) Retinal sections stained with L1CAM (red), which was used to enrich for RGCs at early stages, and the pan-RGC marker RBPMS, (green) at E13, E14, E16, and P0. Nuclei are counterstained by the Hoeschst dye (blue). (b) Relative proportions (y-axis) of major cell classes shown in Figure 1c–e at each combination of age and enrichment method. Both anti-Thy1 and anti-L1cam were used to enrich RGCs at E13, E14, E16, and P0, but only anti-Thy1 was used at P5, because L1cam becomes localized to axons postnatally. AC, amacrine cells; RPC, retinal progenitor cells. (c) Box-and-whisker plots show gene expression levels of key markers by RGCs as a function of age and enrichment method. Markers shown are two pan-RGC markers, Rbpms, Nefl, and the two cell surface proteins used for enrichment, Thy1 and L1cam. Note that Thy1 expression is poor at E13, consistent with low RGC yield in anti-Thy1-enriched cells in panel (b). Black horizontal line, median; bars, interquartile range; vertical lines, range; dots, outliers. (d) Dotplot showing genes (columns) that are selectively expressed in RGCs and RPCs. The size of each circle is proportional to the percentage of cells expressing the gene, and the color depicts the average log-normalized expression. (e) Co-embedding analysis of E14, E16, and P0 data collected in this study with whole retina single-cell transcriptomes in independent studies: E14, E16, and P0 data from Clark et al., 2019 and E15.5 data from Lo Giudice et al., 2019. Cells (points) are visualized in Uniform Manifold Approximation and Projection (UMAP) and colored by study of origin. (f) Same as (e), with cells colored by the expression level of Nefl, an RGC marker. This shows the higher enrichment of RGCs in our study compared to Clark et al., 2019 and Lo Giudice et al., 2019. (g) Same as (e), with cells colored by expression level of Fgf15, an RPC marker. (h) Relative proportions of major cell classes across different datasets analyzed in panel (e) separated by age. T, this study. (i) Confusion matrix showing post hoc transcriptomic correspondence between P5 RGC types identified in Rheaume et al., 2018 (y-axis) and P5 RGC clusters reported in this study (x-axis). In each case, RGCs from Rheaume et al. were assigned P5 cluster labels using an XGBoost classifier trained on P5 RGCs profiled in this study.
Figure 2 with 1 supplement

The number and discreteness of transcriptomic clusters of retinal ganglion cells (RGCs) increase with age.
(a) Extreme models of RGC diversification. In one scenario (left), immature RGCs commit to one of the terminal types by the time of birth (i.e., mitotic exit) or shortly after. Alternatively (right), initially identical postmitotic RGC precursors acquire distinct molecular identities in a gradual process of restriction. (b–g) Visualization of transcriptomic diversity of immature RGCs at embryonic day (E)13 (b), E14 (c), E16 (d), postnatal day (P)0 (e), P5 (f), and P56 (g) using Uniform Manifold Approximation and Projection (UMAP). Cells are colored by their cluster identity, determined independently using dimensionality reduction and graph clustering (Materials and methods). Clusters are numbered based on decreasing size at each age. Data for adults (P56) are replotted from Tran et al., 2019. In that study, 45 transcriptomic types were identified via unsupervised approaches, one of which was mapped to two known functional types by supervised approaches. We do not distinguish them in this study. (h) Transcriptional diversity of RGCs as measured by the Rao diversity index (y-axis) increases with age (x-axis). The trend is insensitive to the number of genes used to compute inter-cluster distance (colors). See Materials and methods for details underlying the calculation. (i) Transcriptomic distinctions between RGC clusters become sharper with age as shown by decreasing average per-cluster error of a multiclass classifier with age. Gradient boosted decision trees (Chen and Guestrin, 2016) were trained on a subset of the data and applied on held-out samples to determine the test error. (j) RGC clusters also become better separated in the UMAP embedding, as shown by the decreasing values of the average relative cluster diameter with age.
Figure 2—figure supplement 1
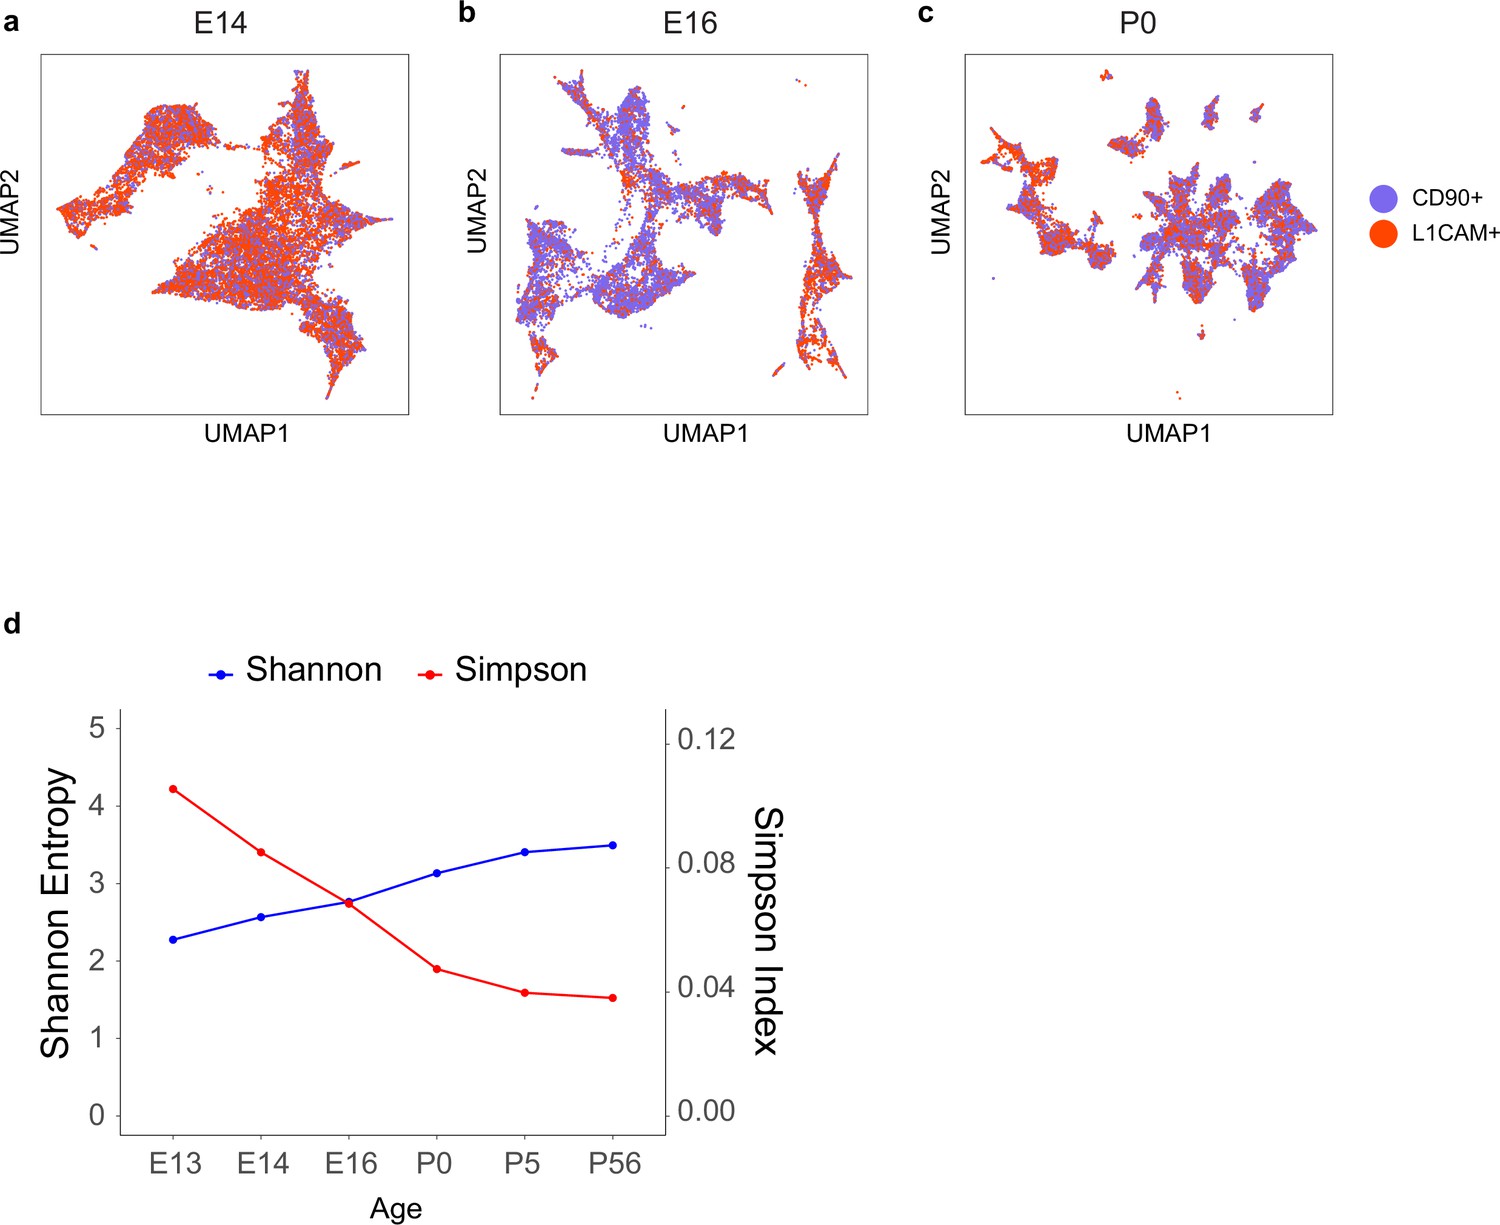
Transcriptomic diversity of immature retinal ganglion cells (RGCs) by age.
(a–c) Uniform Manifold Approximation and Projection (UMAP) embedding for RGCs at embryonic day (E)14 (a, same as Figure 2c), E16 (b, same as Figure 2d), and postnatal day (P)0 (c, same as Figure 2e) with cells colored by enrichment method showing comparable transcriptomic diversity of immature RGCs enriched by L1cam or Thy1. All clusters are present in both collection types, although the relative frequencies vary. This concordance supports the idea that neither marker excludes particular types. (d) Simpson and Shannon diversity indices (see Materials and methods) associated with clustering decrease and increase with age, respectively, consistent with increasing transcriptomic diversity.
Figure 3 with 1 supplement
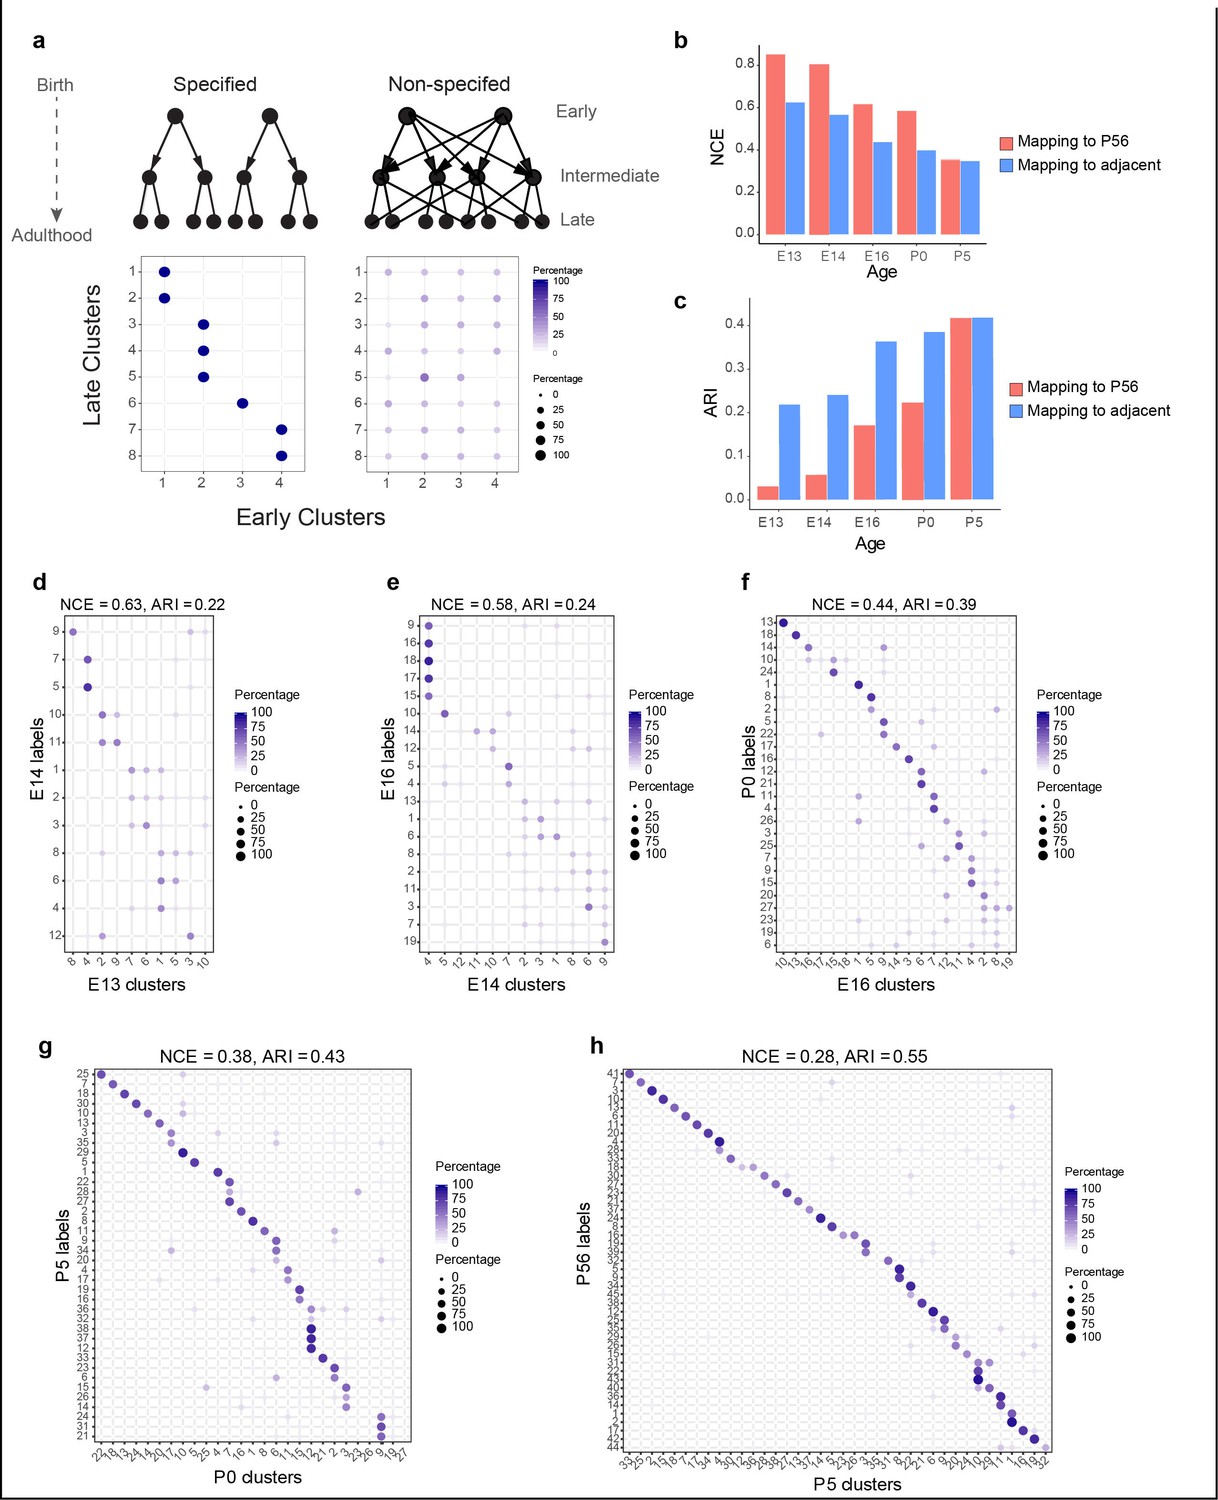
Incompletely specified temporal relationships among retinal ganglion cell (RGC) clusters.
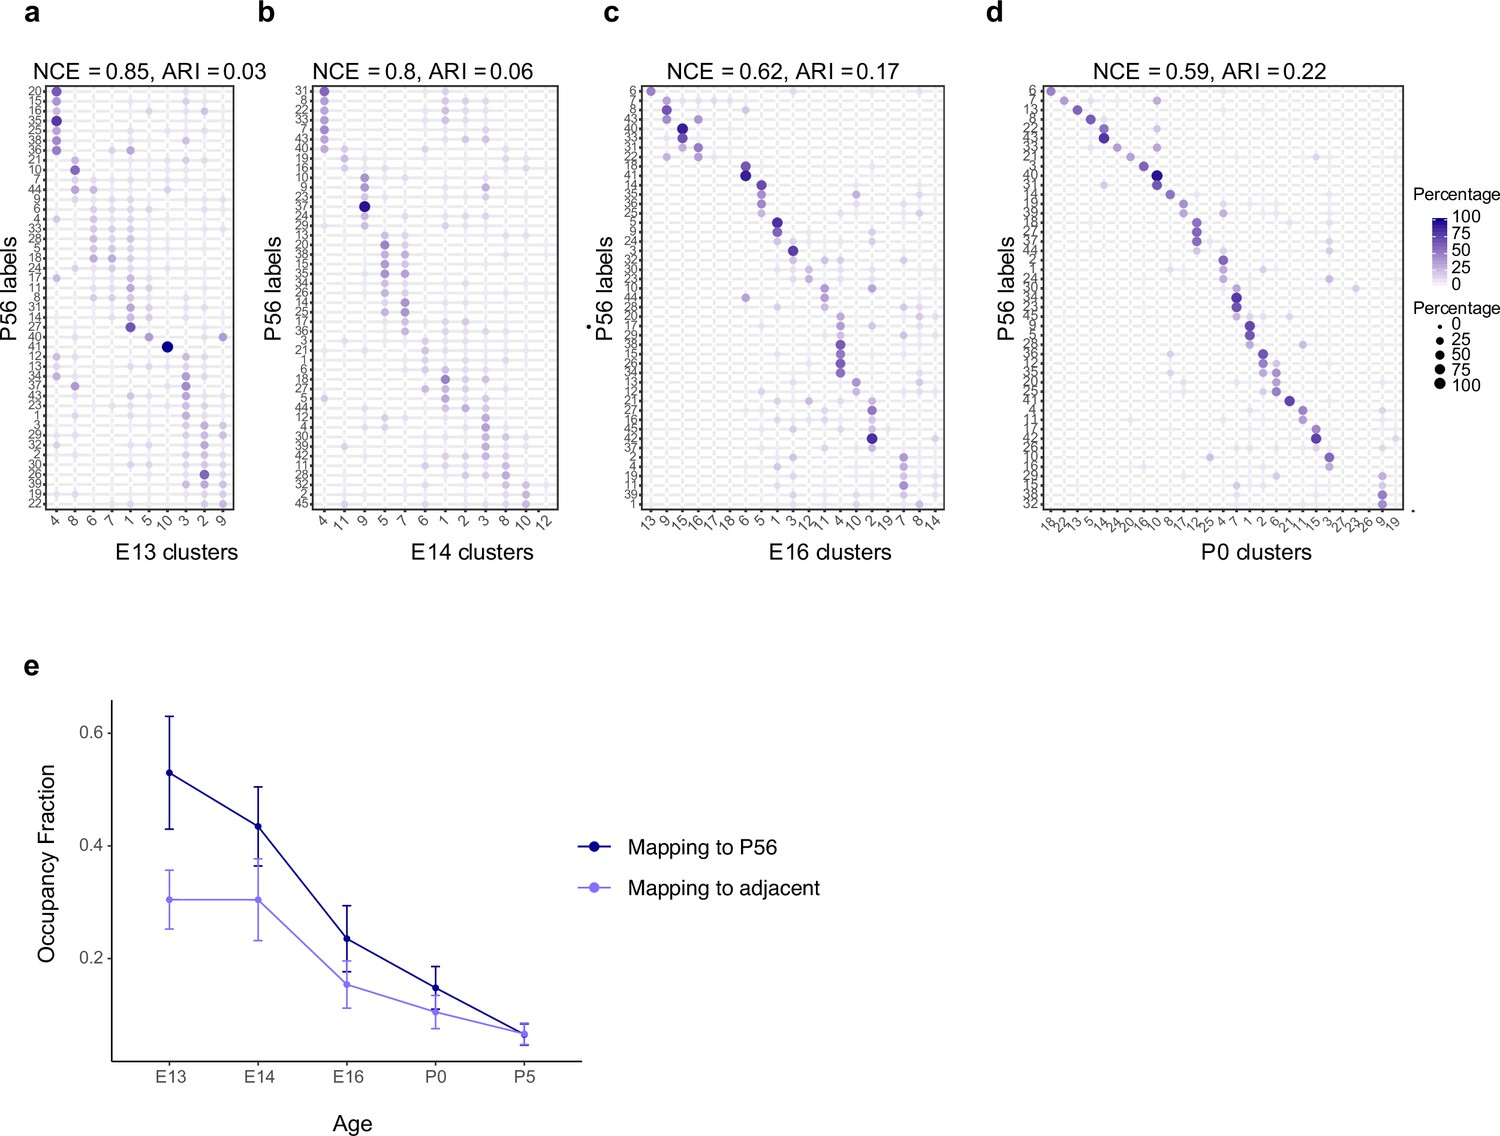
(a) Top: specified (left) and nonspecified (right) modes of diversification. Nodes denote transcriptomic clusters of immature RGCs, and arrows denote fate relationships. Bottom: confusion matrices depicting transcriptomic correspondence between late and early clusters expected for the two modes. Circles and colors indicate the percentage of a given late cluster (row) assigned to a corresponding early cluster (column) by transcriptome-based classifier trained on early clusters. The number of late and early clusters has been set to 8 and 4 for illustration purposes. (b) Barplot showing values of the normalized conditional entropy (NCE) for each age calculated using the transcriptional cluster IDs and the XGBoost-assigned cluster IDs corresponding to the next age or to postnatal day (P)56 (e.g., for embryonic day [E1]3, the NCE was calculated across E13 RGCs by comparing their transcriptional cluster ID with the assigned E14 cluster IDs based on a classifier trained on the E14 data). Lower values indicate specific mappings. (c) Same as (b), but plotting values of the adjusted Rand Index (ARI), where larger values correspond to higher specificity. (d–h) Confusion matrices (representation as in a), showing transcriptomic correspondence between consecutive ages: E14–E13 (d), E16–E14 (e), P0–E16 (f), P5–P0 (g), and P56–P5 (h). In each case, the classifier was trained on the late time point and applied to the early time point. Rows sum to 100%.
Figure 3—figure supplement 1
Temporal correspondences between transcriptomic clusters evaluated using supervised classification.
(a–d) Confusion matrices showing transcriptomic correspondence between adult retinal ganglion cell (RGC) types at postnatal day (P)56 (rows) and immature RGC clusters (columns) at ages embryonic day (E)13 (a), E14 (b), E16 (c), and P0 (d). In each case, immature RGCs were assigned adult labels using an XGBoost classifier trained on adult RGCs. The P56 to P5 mapping is shown in Figure 3h. (e) Line plots showing occupancy fraction (OF) of mapping of an early cluster to cluster IDs at later ages. OF values quantify the specificity of mapping of an early cluster to late clusters, with lower values denoting higher specificity. The average OF across clusters decreases steadily with age consistent with the decrease and increase in normalized conditional entropy (NCE) and adjusted Rand Index (ARI), respectively (Figure 3b and c). Error bars indicate standard deviation computed across clusters. Also, as expected, the OF values are lower for mapping to adjacent time points than to P56.
Figure 4 with 2 supplements
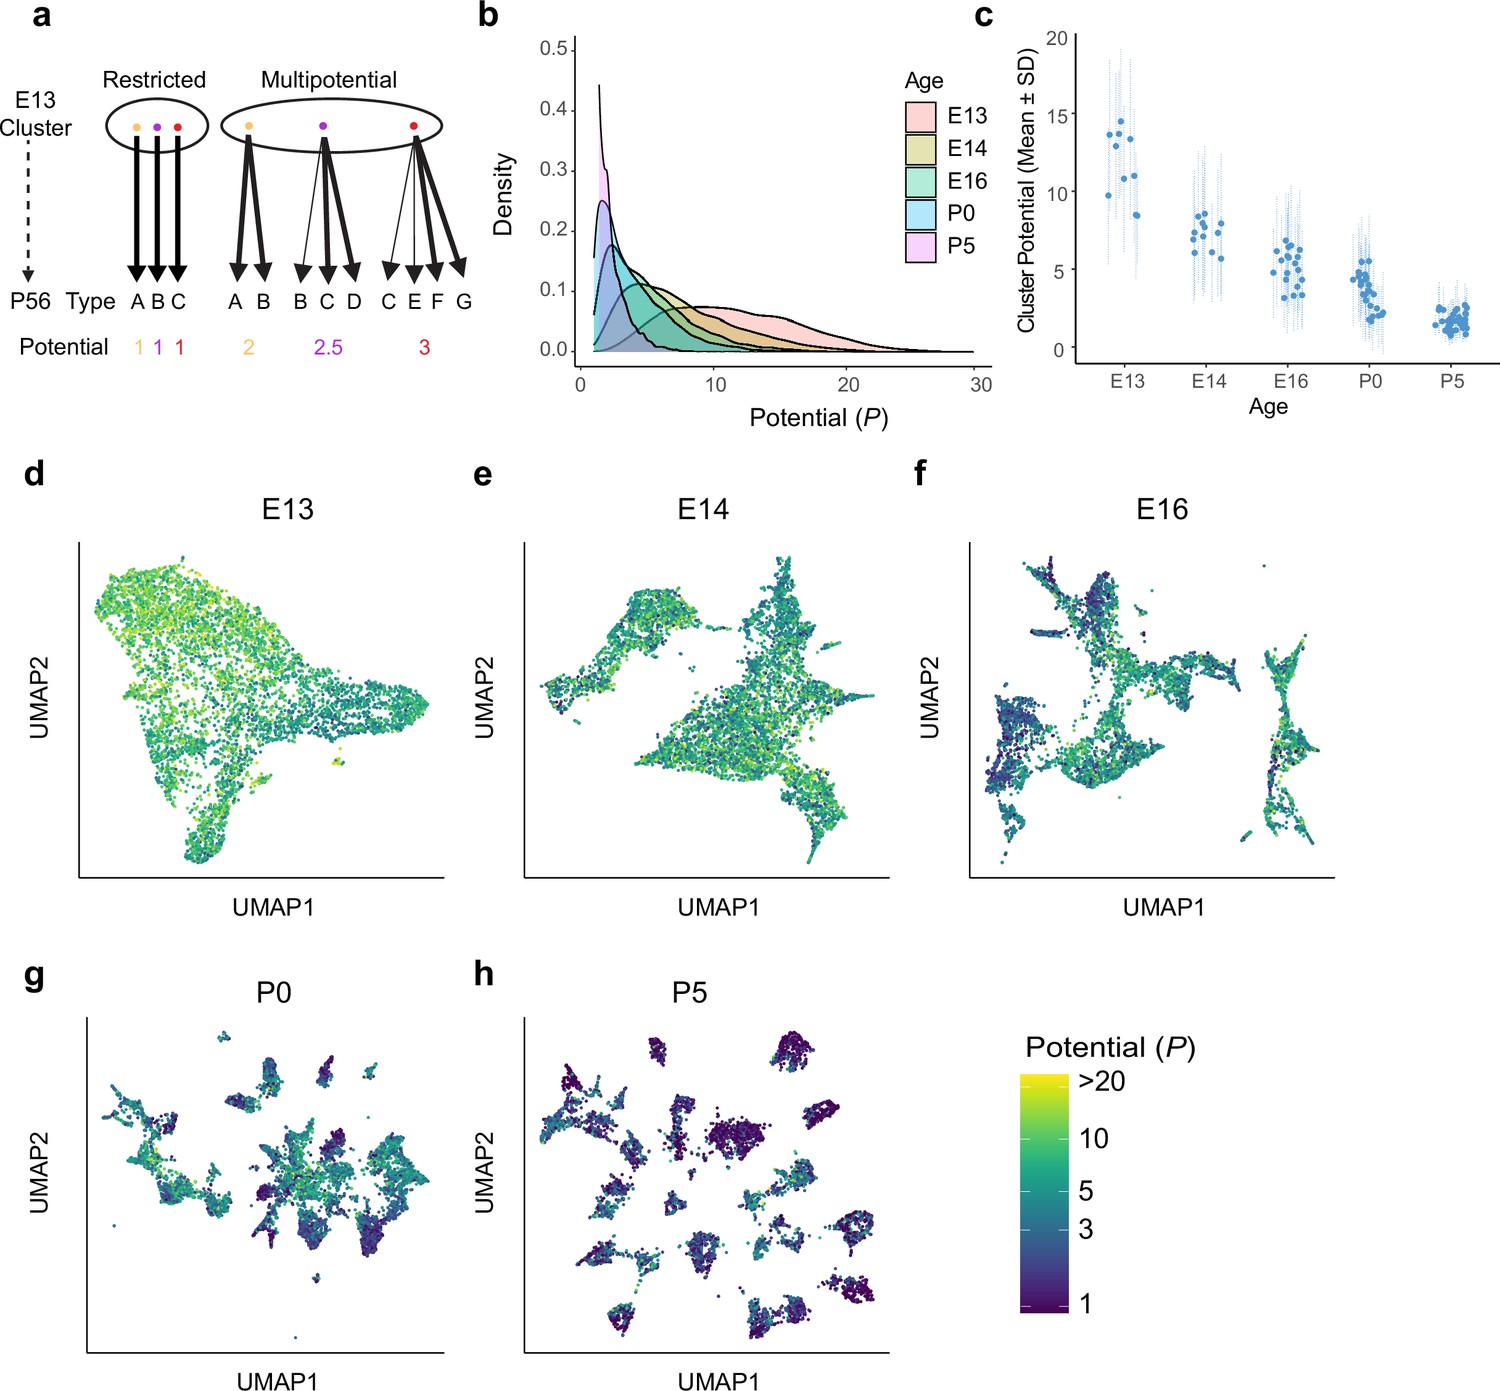
Multipotential fate associations between immature retinal ganglion cells (RGCs) and terminal types inferred via optimal transport.
(a) Extreme models of diversification at single-cell resolution. Multipotential fate associations in a transcriptionally defined cluster (ellipse) could arise from a mixture of unipotential RGCs (left) or from multipotential RGCs (right). (b) Distributions of potential P across immature RGCs by age showing that restriction increases with age. (c) Inter- and intra-cluster variation of potential by age. At each age, variation in the potential values is shown for each transcriptomically defined cluster at that age. Dots denote the average potential, and dotted lines depict the standard deviation for cells within each cluster. (d–h) Uniform Manifold Approximation and Projection (UMAP) projections of embryonic day (E)13 (d), E14 (e), E16 (f), postnatal day (P)0 (g), and P5 (h) RGCs as in Figure 2, but with individual cells colored by their inferred potential. Potential of all RGCs at P56 = 1. The colorbar on the lower right is common to all panels, and values are thresholded at P = 20.
Figure 4—figure supplement 1
Variations in Waddington optimal transport (WOT)-inferred temporal couplings and tests across variations in hyperparameters.
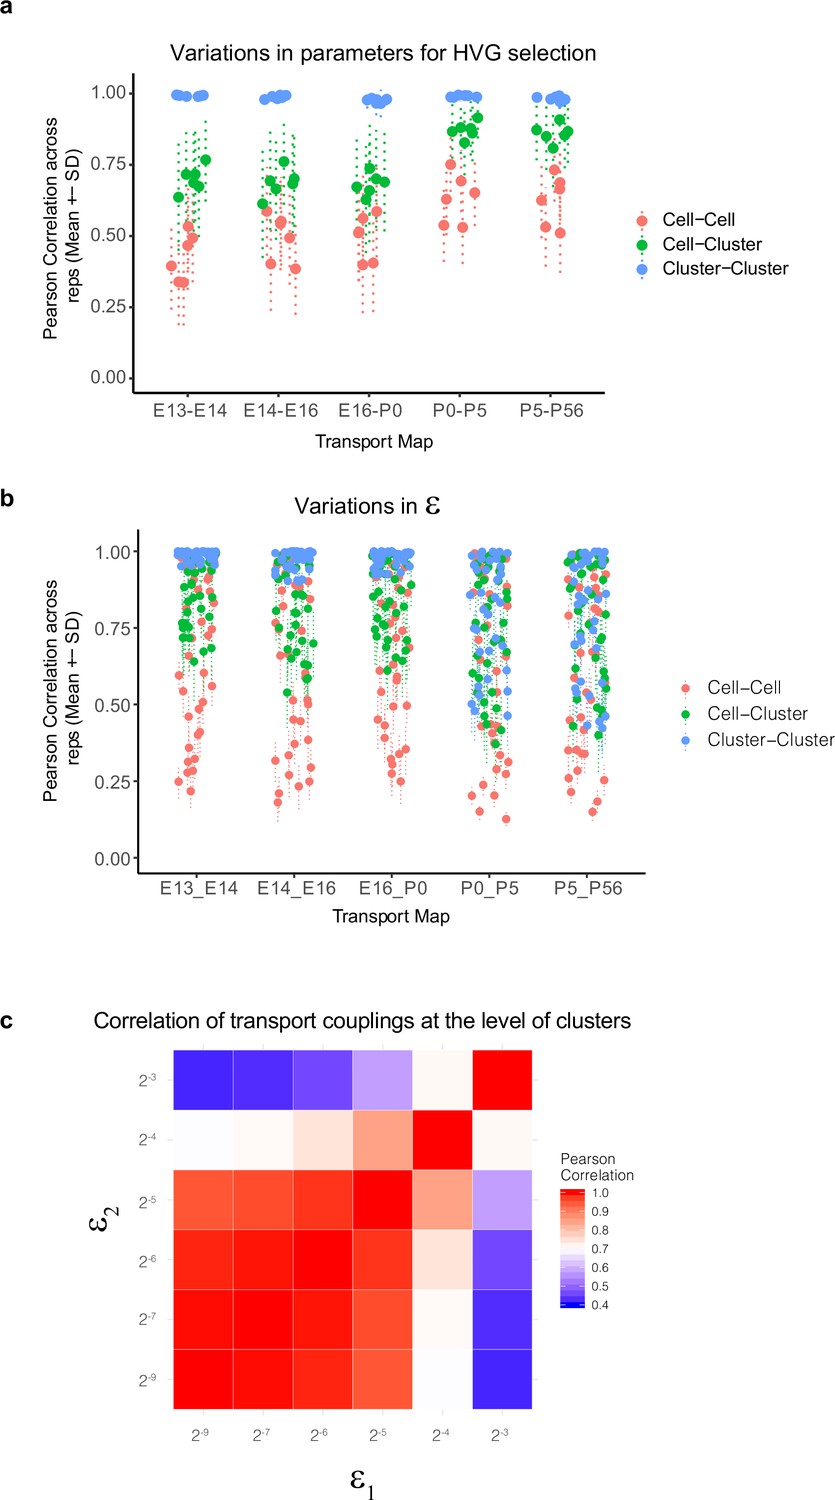
(a) Variations in WOT-inferred temporal couplings () at the level of cells and clusters to changes in the set of highly variable genes (HVGs) used for computing transport maps. Four sets of features were tested corresponding to the top 800, 1100, 1400, and 1800 HVGs based on our previously described Poisson-Gamma model (Liu et al., 2018). Using these sets, we inferred four corresponding transport maps at each of the five age pairs embryonic day (E)13–E14, E14–E16, E16–postnatal day (P0), P0–P5, and P5–P56. The entropic regularization hyperparameter (see panels b, c) was held constant at a value 2–7 in these tests. At each age pair, we computed the Pearson correlation coefficient (PCC) between estimated temporal couplings for every older cell (column of the transport map ) across each pairwise combination of the four transport maps, towards a total of six combinations. These are indicated as red dots and lines (mean ± SD). We then grouped (summed) the rows of the transport map by transcriptomic cluster at the younger age, such that each element of the new matrix indicates cell (column)–cluster (row) couplings. The PCC values of these couplings were computed for each older cell (column) within each pairwise combination of the four transport maps and are indicated as green dots and lines (mean ± SD). Finally, we grouped (summed) both the rows and columns of the transport map by transcriptomic cluster at either age to obtain a matrix of cluster–cluster couplings. The PCC values of these couplings were computed for each older cluster within each pairwise combination of the four transport maps and are indicated as blue dots and lines (mean ± SD). We find that the cell–cell couplings increase in robustness at later ages, but the cell–cluster and cluster–cluster couplings are quite robust (correlation >0.6). (b) Variations in WOT-inferred temporal couplings at the level of cells and clusters as in panel (a), but to changes in the entropic regularization . Six values were used (2–8 , 2–7 , 2–6, 2–5, 2–4, 2–3) with increasing values corresponding to more transport maps with decreasingly localized (or increasingly distributed) couplings. At each age pair, six transport maps are computed and PCC values for cell–cell, cell–cluster, and cluster–cluster couplings are computed as in panel (a) for each of the 15 transport map pairs. Here too, the cluster–cluster and cell–cluster couplings show higher stability, although at later stages higher values of exhibit loss of stability even at the cluster–cluster level (see panel c). (c) Heatmap showing cluster–cluster PCC values for P5–P56 transport maps inferred using different values of the entropic regularization parameter, epsilon (rows and columns). Loss of stability occurs at higher values of the entropic regularization, consistent with panel (b). Based on this, we used ε = 2–7 to calculate the results shown in Figure 4.
Figure 4—figure supplement 2
Temporal correspondences between transcriptomic clusters evaluated using Waddington optimal transport (WOT).
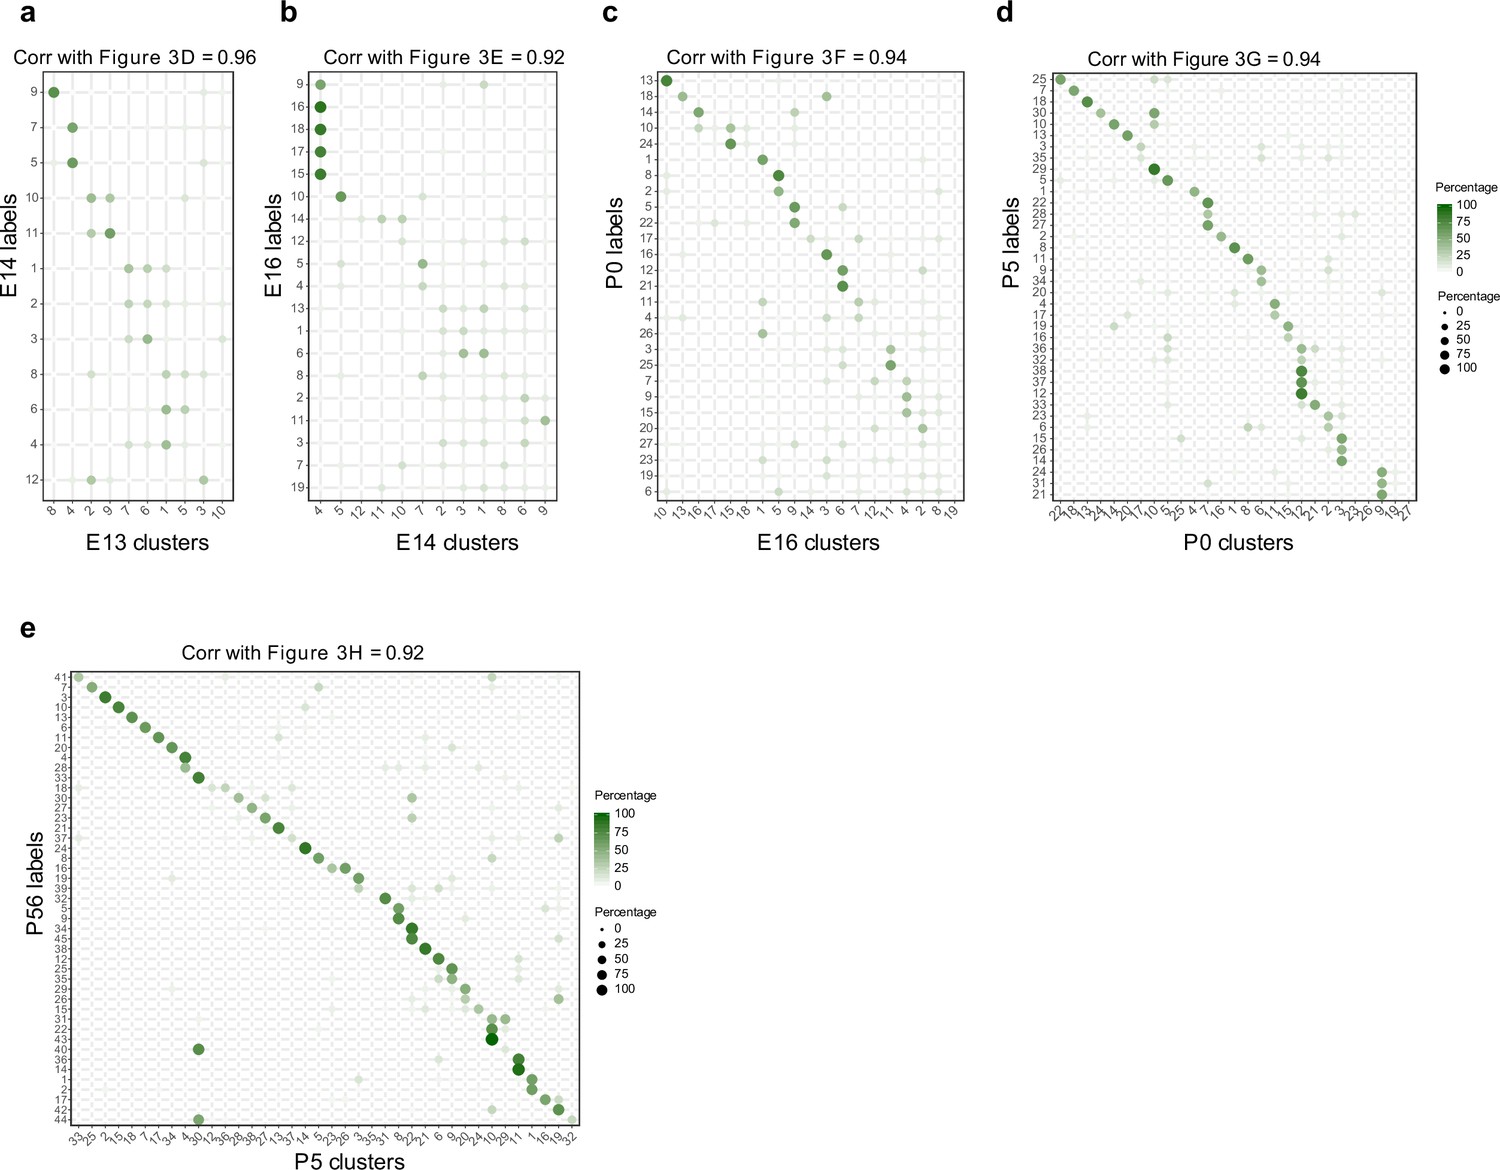
(a–e) Average temporal couplings at the level of clusters. Panels correspond to the pairs embryonic day (E14)–E13 (a), E16–E14 (b), postnatal day (P0)–E16 (c), P5–P0 (d), and P56–P5 (e), respectively. In each case, the WOT-inferred transport map was grouped along rows and columns based on transcriptomic cluster, and the elements were summed within each group. The resulting matrix was normalized such that each row sums to 100%. These matrices strongly resemble those in Figure 3d–h, as confirmed by the high values of the Pearson correlation coefficient (top, all P ≥ 0.92).
Figure 5 with 1 supplement
Fate decoupling of retinal ganglion cell (RGC) types.
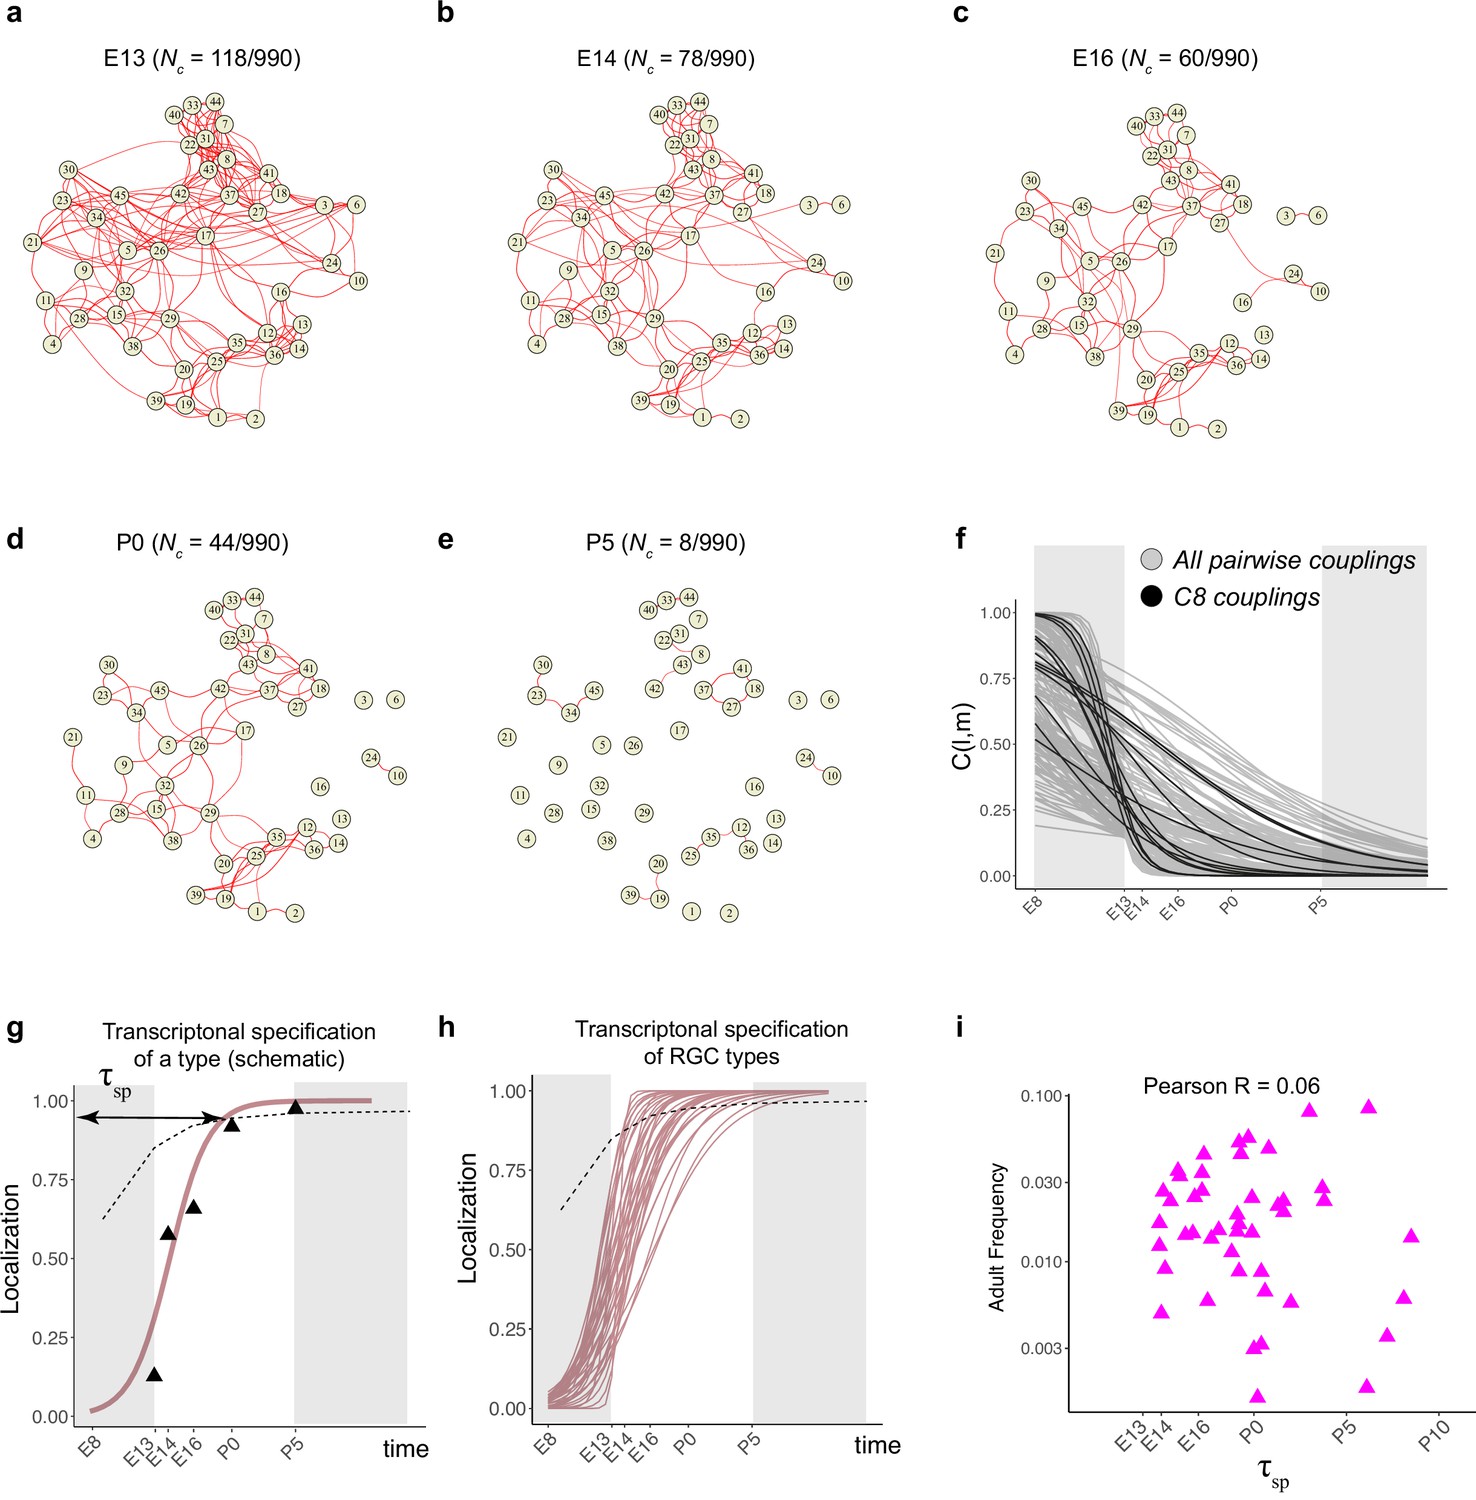
(a) Force-directed layout visualization of fate couplings at embryonic day (E)13, with nodes representing RGC types (numbered as in Tran et al., 2019) and the thickness of edges representing values of C(l,m;E13). Edges with C(l,m; E13) < 0.2 are not shown. Number of edges with C(l,m; E13) > 0.2 are indicated on top. (b–e) Visualization of fate couplings at E14 (b), E16 (c), postnatal day (P)0 (d), and P5 (e). The positions of the nodes are maintained as in panel (a), but the edges are redrawn based on values of C(l,m;age) at each age. As in panel (a), we only show edges C(l,m; age) > 0.2. (f) The decay of pairwise fate couplings (y-axis) with age (x-axis). Each line corresponds to the temporal decay of C(l,m) for RGC pair l and m estimated via a logistic model (Materials and methods). For each pair, couplings at each age were fit to a model with representing fitted parameters. The fitting was performed using data for ages E13, E14, E16, P0, and P5. The shaded portions correspond to the periods E8–E13 and P5 representing the extrapolations of the model. Black lines highlight the decay of all nonzero pairwise couplings for RGC type C8 as an example. (g) Schematic showing logistic modeling to estimate specification time for a particular type. The y-axis is a measure of the extent to which precursors biased towards the type are present in a single transcriptomically defined cluster (i.e., localization, see Materials and methods for details). Localization is defined as a numerical value in the range (0, 1) with higher values consistent with increasing specification. Individual triangles represent the localization values computed using Waddington optimal transport (WOT)-inferred fate couplings at each age, while the curve represents the fit using the logistic model. Dotted line shows the minimum threshold a type to be specified at each age. Its curved shape arises due to the increase in the number of clusters with age. (h) Localization curves (as in g) for the 38 RGC types showing the range of inferred specification times. Seven low-frequency types have been excluded from display (see Figure 5—figure supplement 1d). (i) Scatter plot showing poor correlation between adult frequency of a type (from Tran et al., 2019) and its predicated specification time (calculated from h).
Figure 5—figure supplement 1
Fate decoupling and temporal specification of retinal ganglion cell (RGC) types.
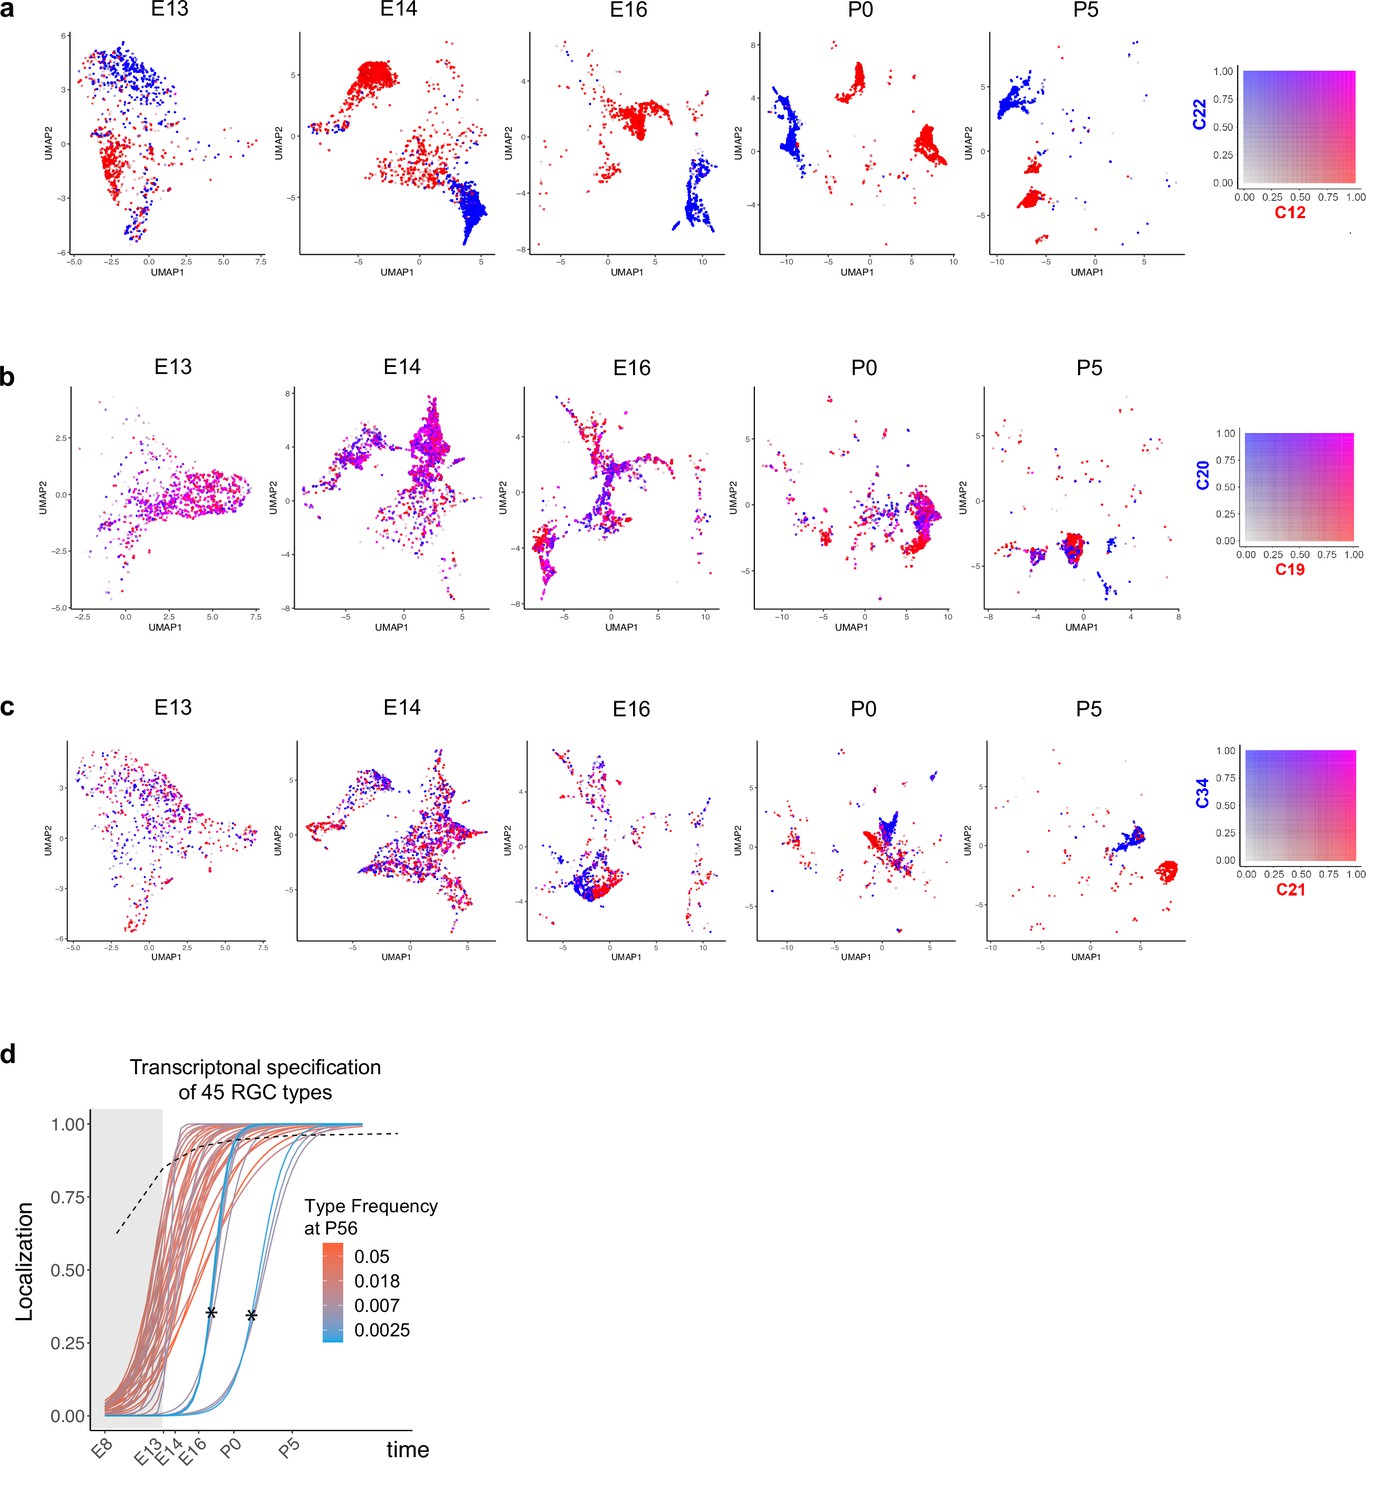
(a–c) Examples of fate decoupling. Panels from left to right correspond to ages embryonic day (E)13–postnatal day (P)5 with precursor RGCs shown on a reduced dimensional Uniform Manifold Approximation and Projection (UMAP) representation as in Figure 2c–g. Each RGC is colored using a biaxial color scale (legend) based on its predicted fate values. C12 and C22 are transcriptomically distinct as early as E13 (a). C19 and C20 exhibit high fate coupling at all embryonic ages and are only decoupled at P5 (b). C21 and C34 decouple around E16 (c). (d) Same as Figure 6h showing specification curves for RGC types, but in this case each curve is colored based on adult frequency (colorbar, right). The seven curves marked by asterisks correspond to late-specified types. As can be seen from their colors, they are also among the types with the lowest frequency (<0.3%), which may result in the dropout of the corresponding precursors because of sampling fluctuations. Such dropouts at earlier time points give the appearance of late specification. Because of this issue, we exclude them from our analysis.
Figure 6 with 1 supplement
Temporal dynamics of retinal ganglion cell (RGC) subsets expressing specific transcription factors (TFs).
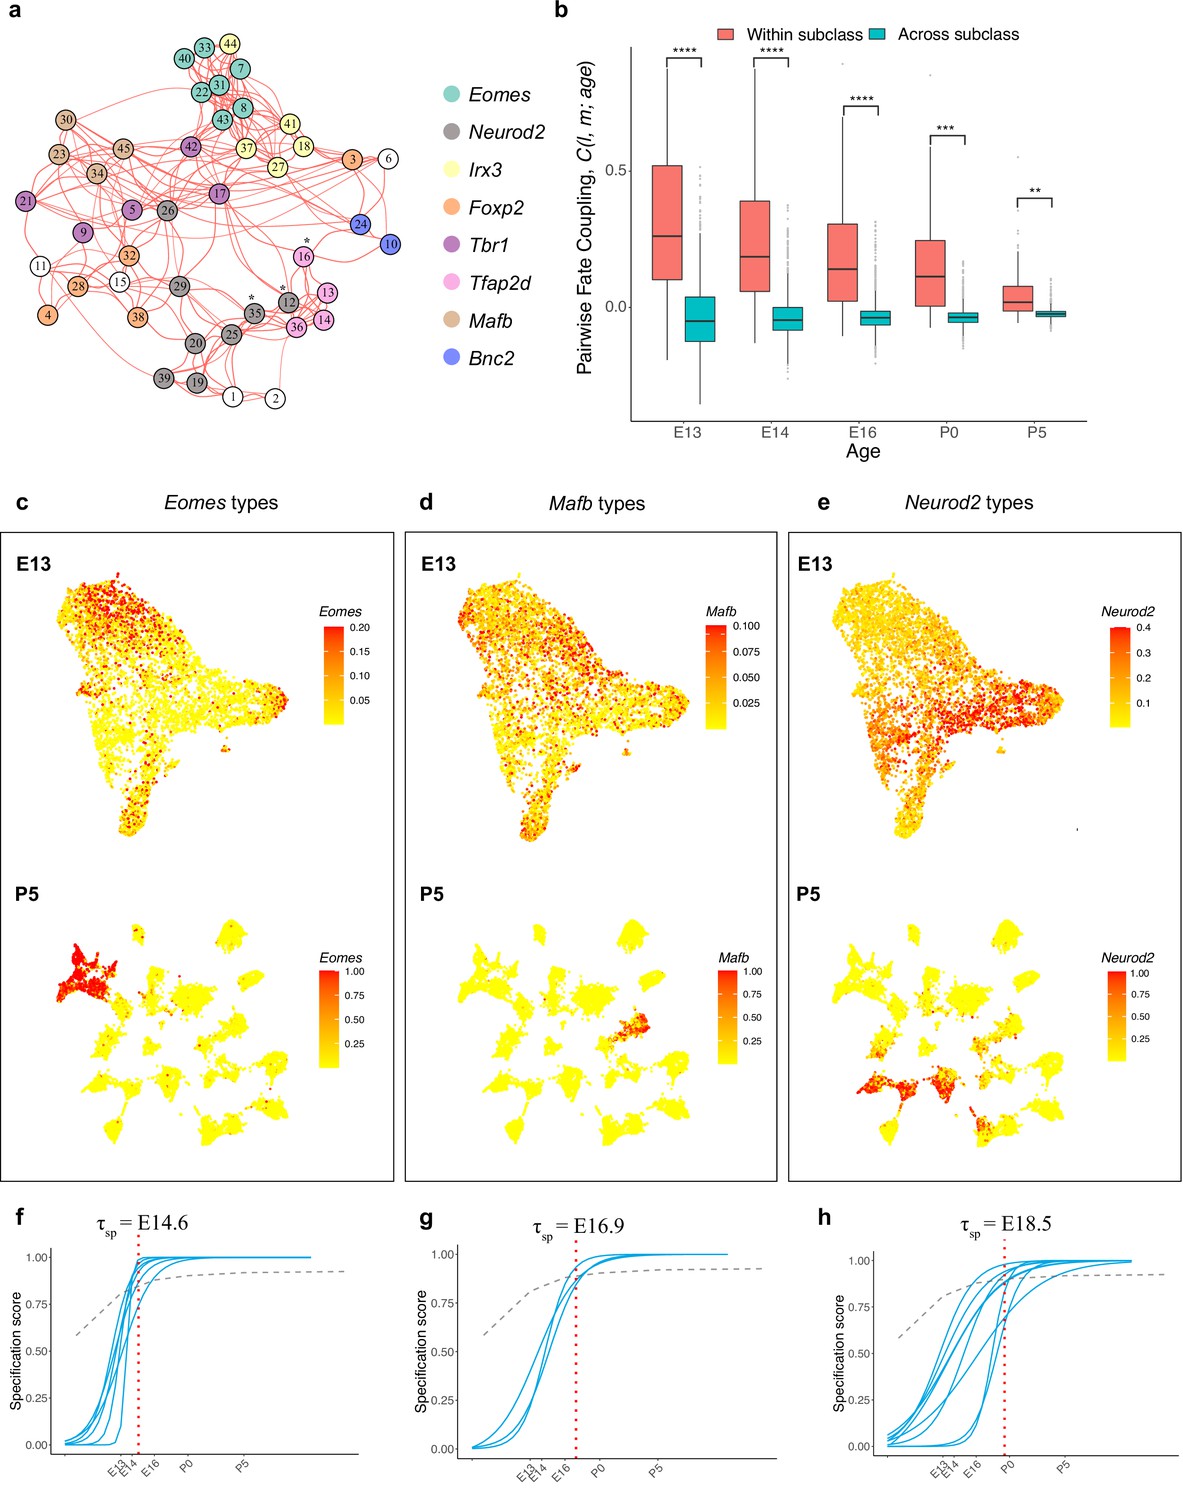
(a) Embryonic day (E)13 network graph of fate couplings from Figure 5a, with RGC types colored based on their selective expression of TFs at postnatal day (P)56. Asterisks denote 3/45 types that express more than one TF (also see Figure 6—figure supplement 1a). (b) Box-and-whisker plots showing that pairwise fate couplings are higher between types within the same TF subclass than between types in different TF subclasses at all immature ages. Black horizontal line, median; bars, interquartile range; vertical lines, 1st and 99th percentile; dots, outliers. Asterisks indicate significant p-values based on a two-sided t-test (****p<10–7; ***p<10–5; **p<10–2). (c) Eomes+ types. Top: Uniform Manifold Approximation and Projection (UMAP) representation of E13 RGCs with cells colored based on their cumulative fate association towards the seven Eomes+ types. Bottom: UMAP representation of P5 RGCs with cells colored based on their cumulative fate association towards the seven Eomes+ types. The value corresponding to the color of each cell (colorbar, right) can be interpreted as the probability of commitment towards the corresponding subclass. Note that the color does not denote the expression level for the gene. (d) Same as (c) for Mafb+ types. (e) Same as (c) for Neurod2+ types (f–h). Localization curves (as in Figure 5g) for Eomes+ types (f), Mafb+ types (g), and Neurod2+ types (h). The mean inferred specification time for each group is indicated on the top of each panel.
Figure 6—figure supplement 1
Transcription factor (TF)-based subgroups.
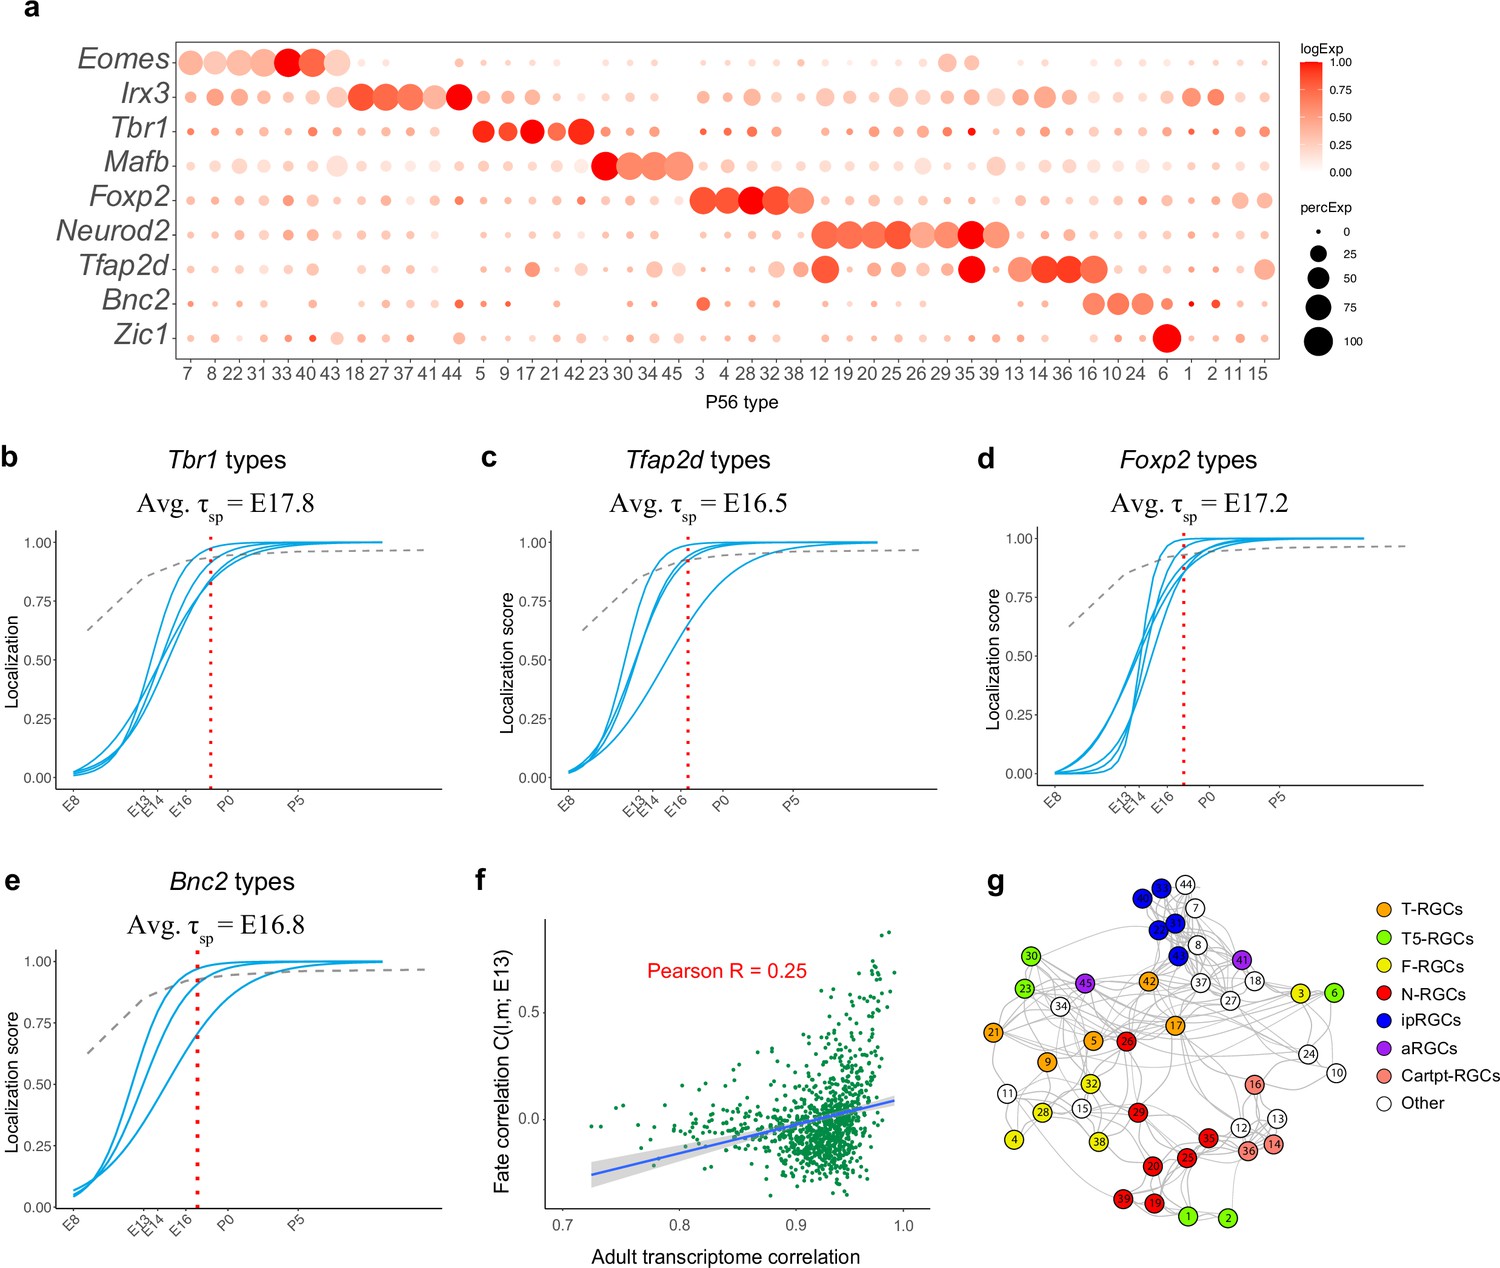
(a) Dotplot showing mutually exclusive patterns of expression of TFs that mark groups of retinal ganglion cell (RGC) types. In addition to the eight TFs shown in Figure 6a, we highlight Zic1, which selectively labels C6. Selectively expressed TFs could not be identified for four types (C1, C2, C11, and C15). (b–e) Localization curves (as in Figure 5g) for Tbr1+ types (b), Tfap2d+ types (c), Foxp2+ types (d), and Bnc2+ types (e). Note that the ‘low-frequency’ types labeled in Figure 5—figure supplement 1d are not shown. The mean specification time for each group is shown above the graphs. (f) Correlation of fate coupling at embryonic day (E)13 with transcriptomic correlation at postnatal day (P)56. (g) Same as Figure 6a, with nodes corresponding to subclasses defined in Tran et al., 2019, which includes ipRGCs, alpha-RGCs, and T5-RGCs.
Figure 7 with 1 supplement
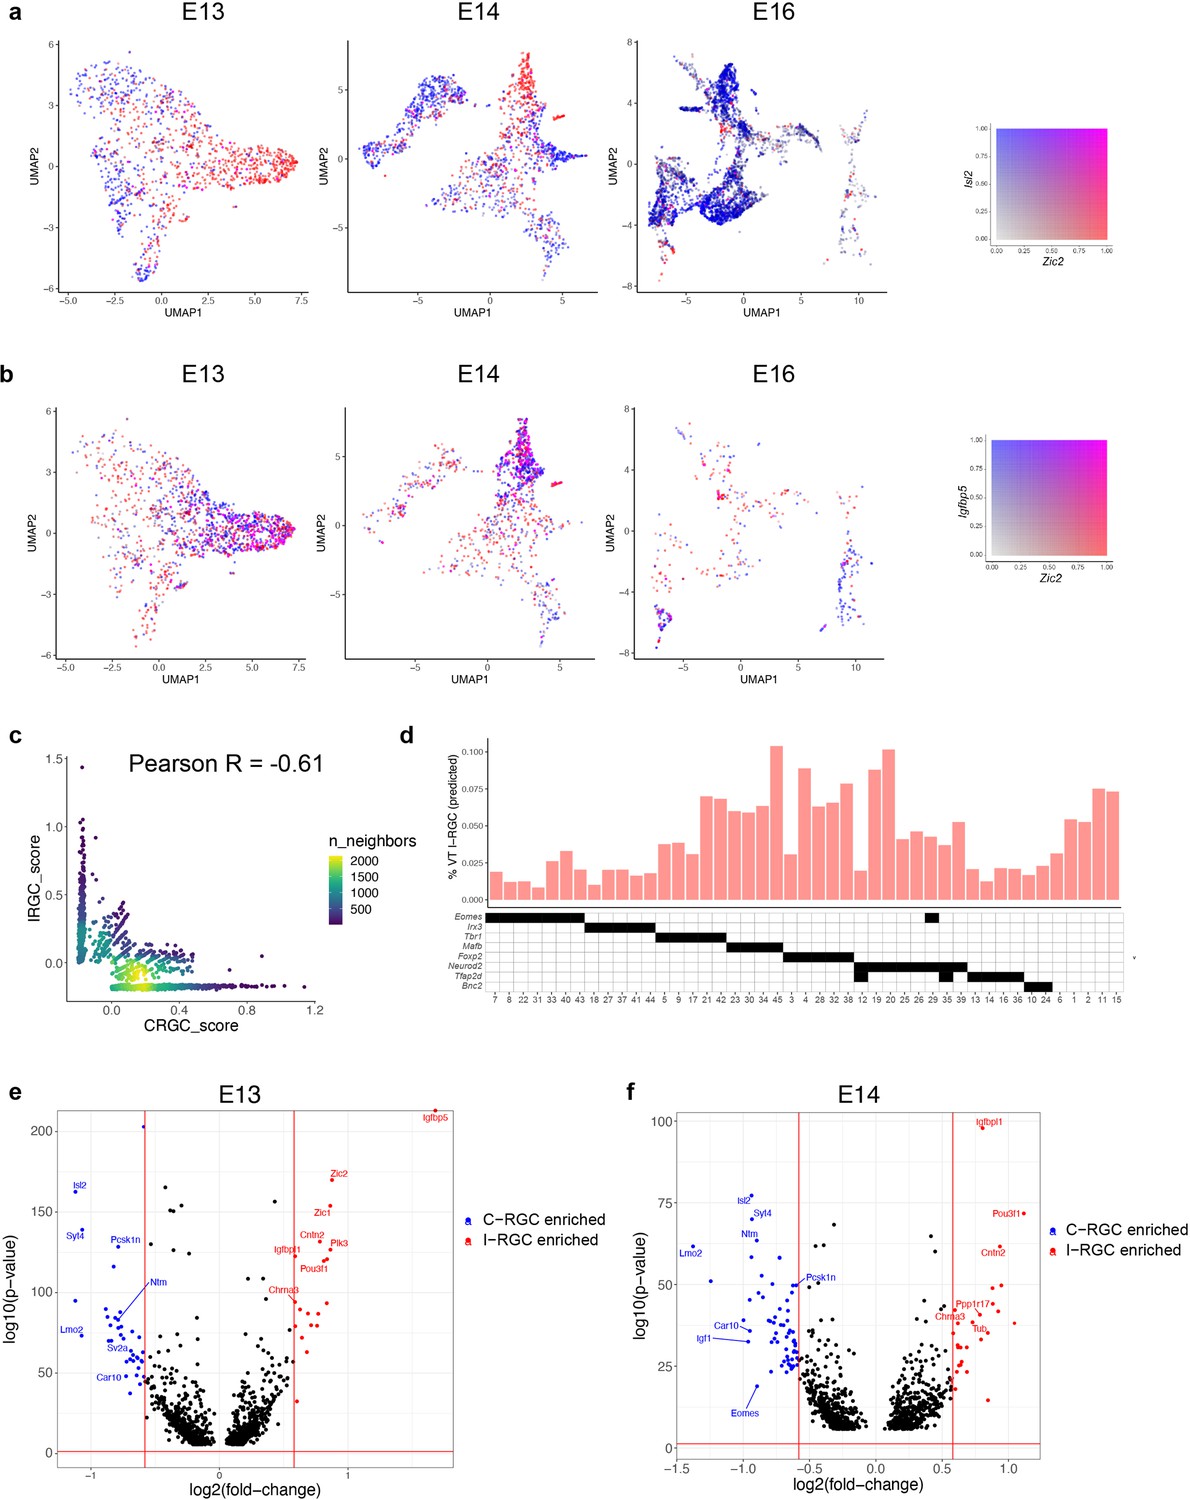
Transcriptomic identification of ipsilaterally projecting retinal ganglion cells (RGCs).
(a) Zic2, an I-RGC marker, and Isl2, a C-RGC marker, are expressed in a mutually exclusive pattern at embryonic day (E)13 (left), E14 (middle), and E16 (right). Zic2 is undetectable after E16 (Figure 7—figure supplement 1a). Cells are colored based on a bivariate color scale representing co-expression of two markers (colorbar, right). (b) Zic2 and Igfbp5, two I-RGC markers, are co-expressed at E13 (left) and E14 (middle). Representation as in panel (a). (c) Scatter plots of gene signatures used to identify I-RGCs (y-axis) and C-RGCs (x-axis) at E13 are negatively correlated (Pearson R = –0.61). Each dot corresponds to a cell, the color represents the number of cells located at a particular (x, y) location (see colorbar, right). (d) Barplot showing % of putative I-RGCs (y-axis) within each of the 45 adult RGC types, estimated by computing the descendants of E13 I-RGCs using Waddington optimal transport (WOT). RGC types are arranged along the x-axis based on their membership of transcription factor (TF) groups shown in Figure 6a (annotation matrix, bottom). (e) Volcano plot showing differentially expressed genes (MAST test) between predicted I-RGCs and C-RGCs at E13. The x- and the y-axes show the fold change and the p-value in log2- and log10- units, respectively. Dots represent genes, with red and blue dots highlighting I- and C-RGC-enriched genes, respectively, at fold change >1.5 and Bonferroni-corrected p-value<5 × 10⁻⁵. The two vertical bars correspond to a fold change of 1.5 in either direction. Select I-RGC- and C-RGC-enriched genes are labeled. (f) Same as panel (e), for E14.
Figure 7—figure supplement 1
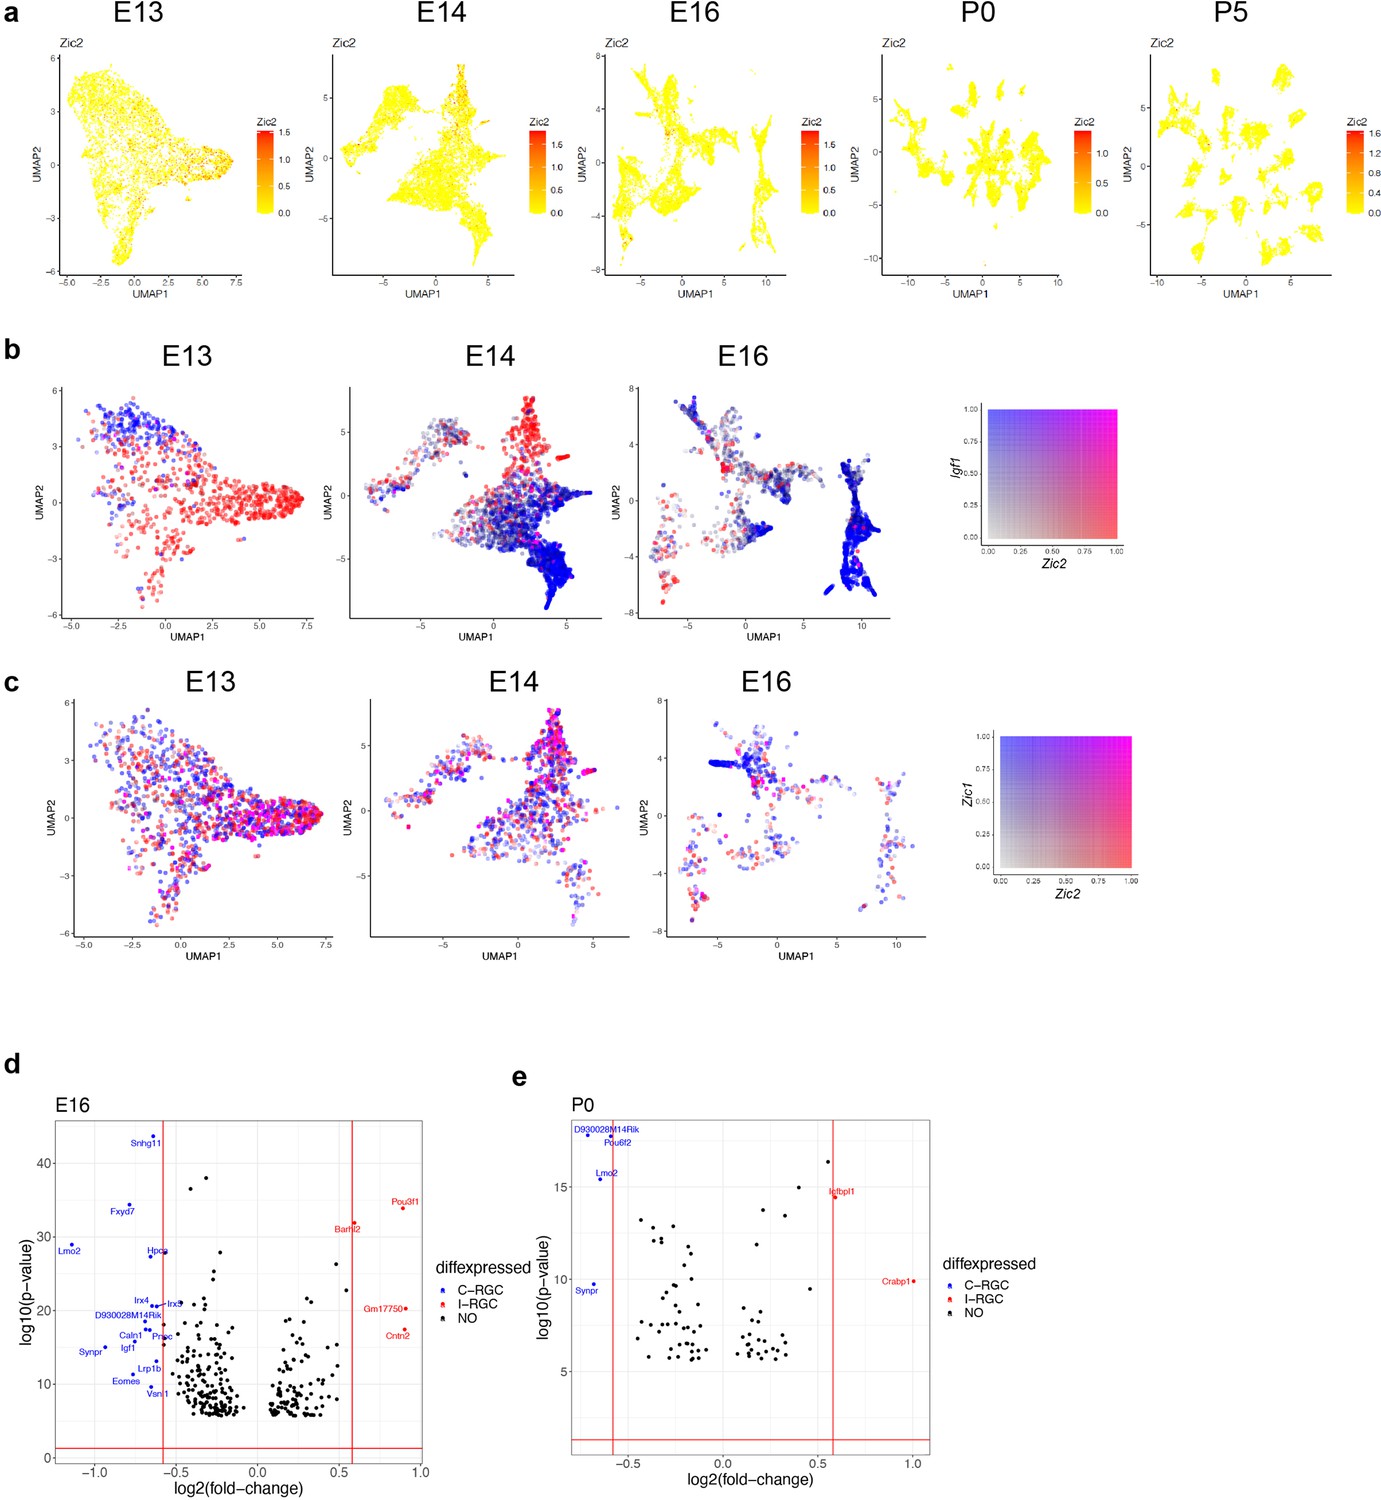
Transcriptomic analysis of retinal ganglion cell (RGC) laterality.
(a) RGCs at embryonic day (E)13, E14, E16, postnatal day (P)0, and P5 colored by their expression of Zic2, an I-RGC marker. Zic2 is expressed in a localized fashion until E16 and becomes undetectable beyond this age. (b) Zic2, an I-RGC marker, and Igf1, a C-RGC marker, are expressed in mutually exclusive patterns at E13–E16. (c) Zic2 and Zic1, two I-RGC markers, are co-expressed in subsets of RGCs at E13–E16. (d) Volcano plot showing differentially expressed genes (MAST test, p<10–6) between predicted I-RGCs and C-RGCs at E16. The x- and the y-axes show the fold change and the p-value in log2- and log10- units, respectively. Dots represent genes, with red and dots highlighting I- and C-RGC-enriched genes, respectively, at fold change >1.5 and Bonferroni-corrected p-value<5e-5. The two vertical bars correspond to a fold change of 1.5 in either direction. (e) Same as (d), for P0.
Author response image 1
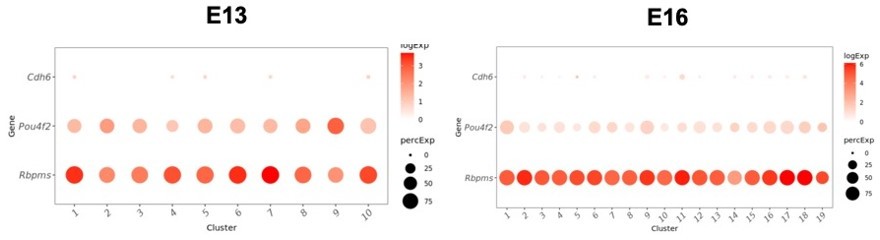
Low levels of expression of Cdh6 in immature clusters at E13 (left) and E16 (right).
Cdh6 is expressed at similarly low levels at all other time points (not shown). RGC markers Pou4f2 and Rbpms are shown for comparison.
Tables
Key resources table
| Reagent type (species) or resource | Designation | Source or reference | Identifiers | Additional information |
|---|---|---|---|---|
| Strain, strain background (Mus musculus) | C57BL/6 | Charles River or Jackson Labs | Cat#JAX000664; RRID: IMSR_JAX:000664 | |
| Antibody | Anti-Thy1/anti-CD90(rat monoclonal) | Thermo Fisher Scientific | #17-0902-82 | 1:200 |
| Antibody | Anti-L1cam(rat monoclonal) | Miltenyi Biotec | #130-102-243 | 1:10 |
| Antibody | Anti-CD90 pre-conjugated (rat monoclonal) | Miltenyi Biotec | #130-049-101 | 1:200 |
| Antibody | Anti-RBPMS (guinea pig polyclonal) | PhosphoSolutions | #1832-RBPMS | 1:1000 |
| Antibody | Anti-KI67 (rabbit monoclonal) | Thermo Fisher Scientific | #MA5-14520 | 1:250 |
| Chemical compound, drug | Fluoro-Gel | Electron Microscopy Sciences | #17985 | |
| Commercial assay or kit | MACS Large Cell Columns | Miltenyi Biotec | #130-042-202 | |
| Sequence-based reagent | Drop-seq beads | ChemGenes Corporation | #Macosko201110 | |
| Commercial assay or kit | Papain dissociation system | Worthington | #LK003160 | |
| Commercial assay or kit | Chromium Single Cell 30Library and Gel Bead Kit v2, 10X Genomics 16rxns | 10X Genomics | #120237 | |
| Software, algorithm | Cell Ranger v2.6.0 | 10X Genomics | https://support.10xgenomics.com/single-cell-gene-expression/software/downloads/latest | |
| Software, algorithm | ImageJ (Fiji) version 2.1.0 | Fiji | https://imagej.net/Fiji | |
| Software, algorithm | R 3.6.2 | The R Foundation | https://www.r-project.org/ | |
| Software, algorithm | RStudio 1.3.1056 | RStudio | https://www.adobe.com |
Additional files
Download links
A two-part list of links to download the article, or parts of the article, in various formats.
Downloads (link to download the article as PDF)
Open citations (links to open the citations from this article in various online reference manager services)
Cite this article (links to download the citations from this article in formats compatible with various reference manager tools)
Diversification of multipotential postmitotic mouse retinal ganglion cell precursors into discrete types
eLife 11:e73809.
https://doi.org/10.7554/eLife.73809


