Structural basis of malaria transmission blockade by a monoclonal antibody to gamete fusogen HAP2
- Program in Cellular and Molecular Medicine, Boston Children's Hospital, United States
- School of Life Sciences, Nanjing University, China
- Burnet Institute, Australia
- Department of Pathology, University of Cambridge, United Kingdom
- Boston Children's Hospital, United States
Figures
Figure 1
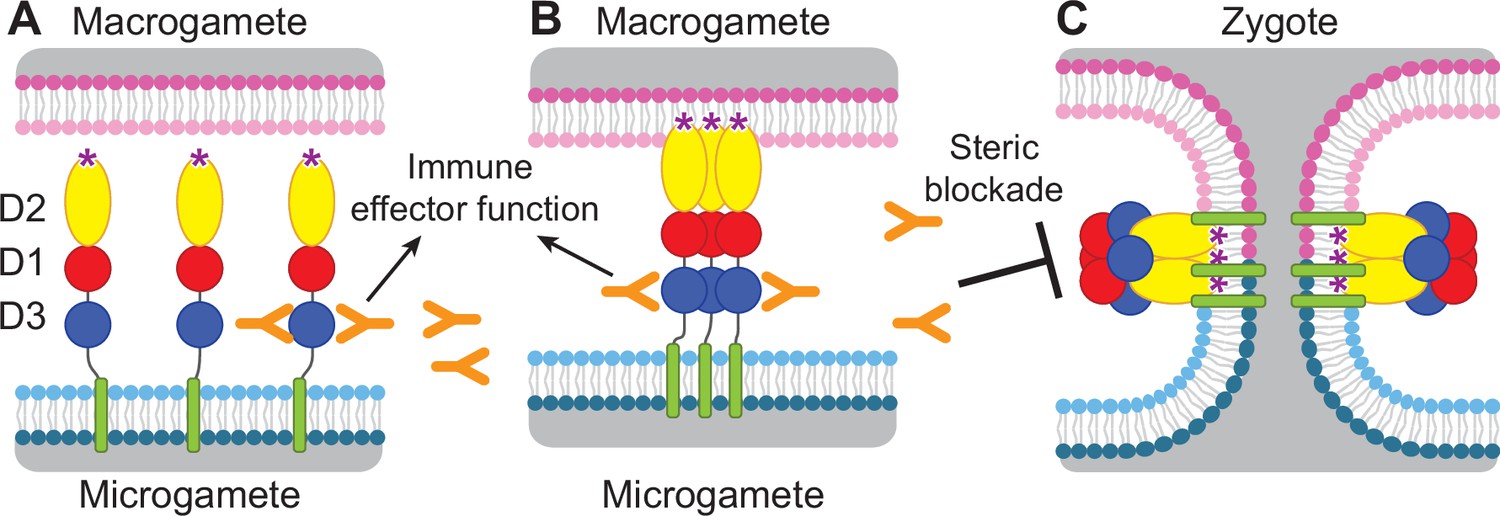
Diagram of HAP2 pre-fusion monomer, trimerization and membrane fusion.
The model is based on postfusion structures of HAP2 referenced in the text, their similarity to postfusion structures of viral class II proteins, models for the conversion of prefusion to postfusion class II fusion proteins (Kielian and Rey, 2006), and work showing that D1 and D2 are sufficient for trimer formation (Liao et al., 2010), which suggests that the last step may be concerted foldback of D3 over D1 and D2 and fusion of the macrogamete and microgamete plasma membranes. (A) pre-fusion monomer on the surface of male gametes, (B) extended trimeric intermediate, and (C) post-fusion trimer and fusion of gamete membranes. Domains are colored. Fusion loops at the tip of D2 are shown as ‘*’. Antibodies to D3, shown as Y shapes, may agglutinate microgametes, trigger antibody Fc-dependent effector functions, or neutralize HAP2 function by interfering with trimer formation and gamete membrane fusion.
Figure 2 with 3 supplements
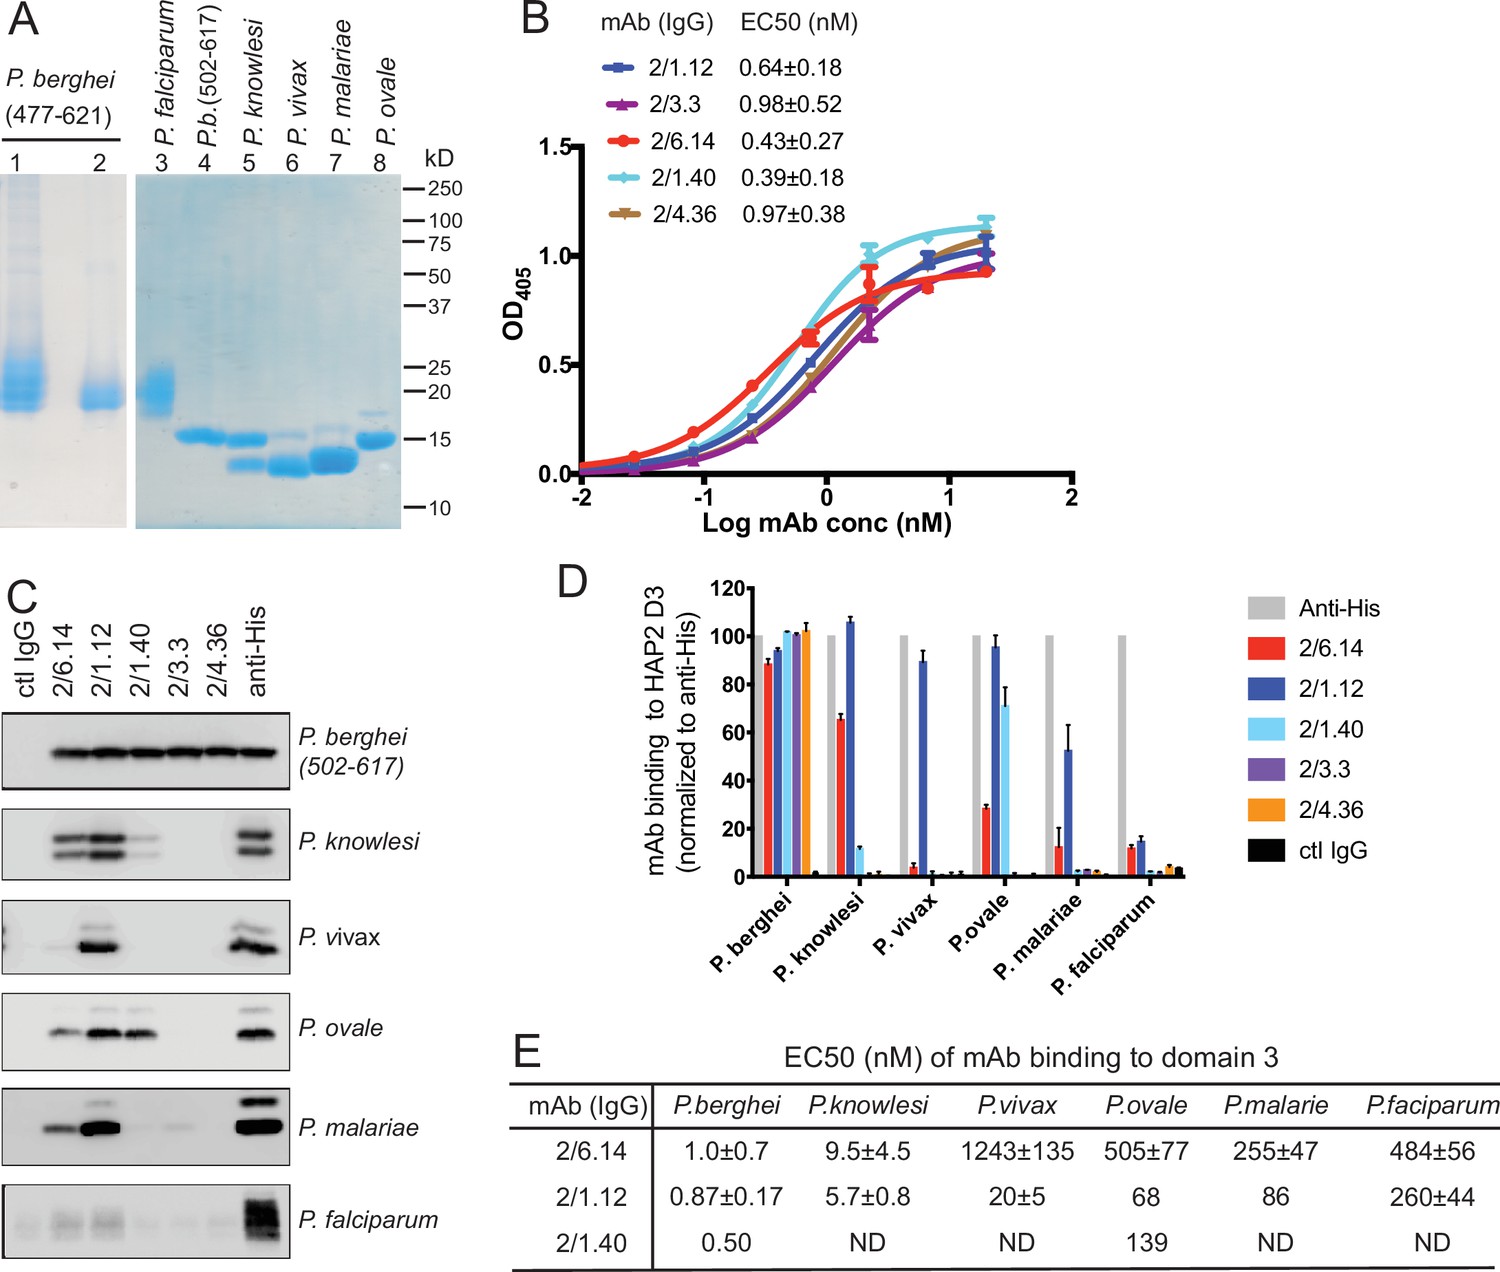
Cross-reactivity of HAP2 D3 mAbs among Plasmodium species.
(A) Reducing SDS 12.5% PAGE of purified HAP2 D3 stained with Coomassie blue. Lanes 1 and 2: P. berghei HAP2 D3 (aa 477–621) purified by Ni-NTA (lane 1) and then treated with Endo D and purified by gel filtration (lane 2). Lanes 3–8: Purified HAP2 D3 fragments from Plasmodium species treated with Endo D or from P. berghei (aa 502–617) with N-linked sites removed by mutation. (B) Titration of antibody binding to Endo D-treated P. berghei HAP2 D3 (aa 477–621) by ELISA. Sigmoidal curve fits show one representative experiment with mean ± difference from the mean of duplicates; EC50 values show mean ± SD of three experiments. (C) Cross-species reactivity of HAP2 D3 mAbs by immunoprecipitation. Purified D3 proteins shown in (A) (2 µg each) were subjected to immunoprecipitation with the indicated mAbs, anti-His 1/5.13, or control IgG (8 µg each). Immunocomplexes were analyzed by reducing 12.5% SDS-PAGE and Western blot using rabbit polyclonal antibodies to the C-terminal His tag of D3. (D) Quantitation of results from (C) and a repeat experiment. Intensities of bands were quantitated and data normalized to anti-His. Results shown are averages of the two experiments ± difference from the mean. (E) EC50 measurements of HAP2 D3 binding to immobilized mAbs by ELISA. Purified D3 proteins shown in (A), lanes 3–8, were used. Sigmoidal curve fitting of D3 titration (Figure 2—figure supplement 3) and EC50 used GraphPad Prism 7 software. EC50 shown are mean ± difference from means of two experiments, each experiment with triplicates. ND, Not determined.
Figure 2—figure supplement 1
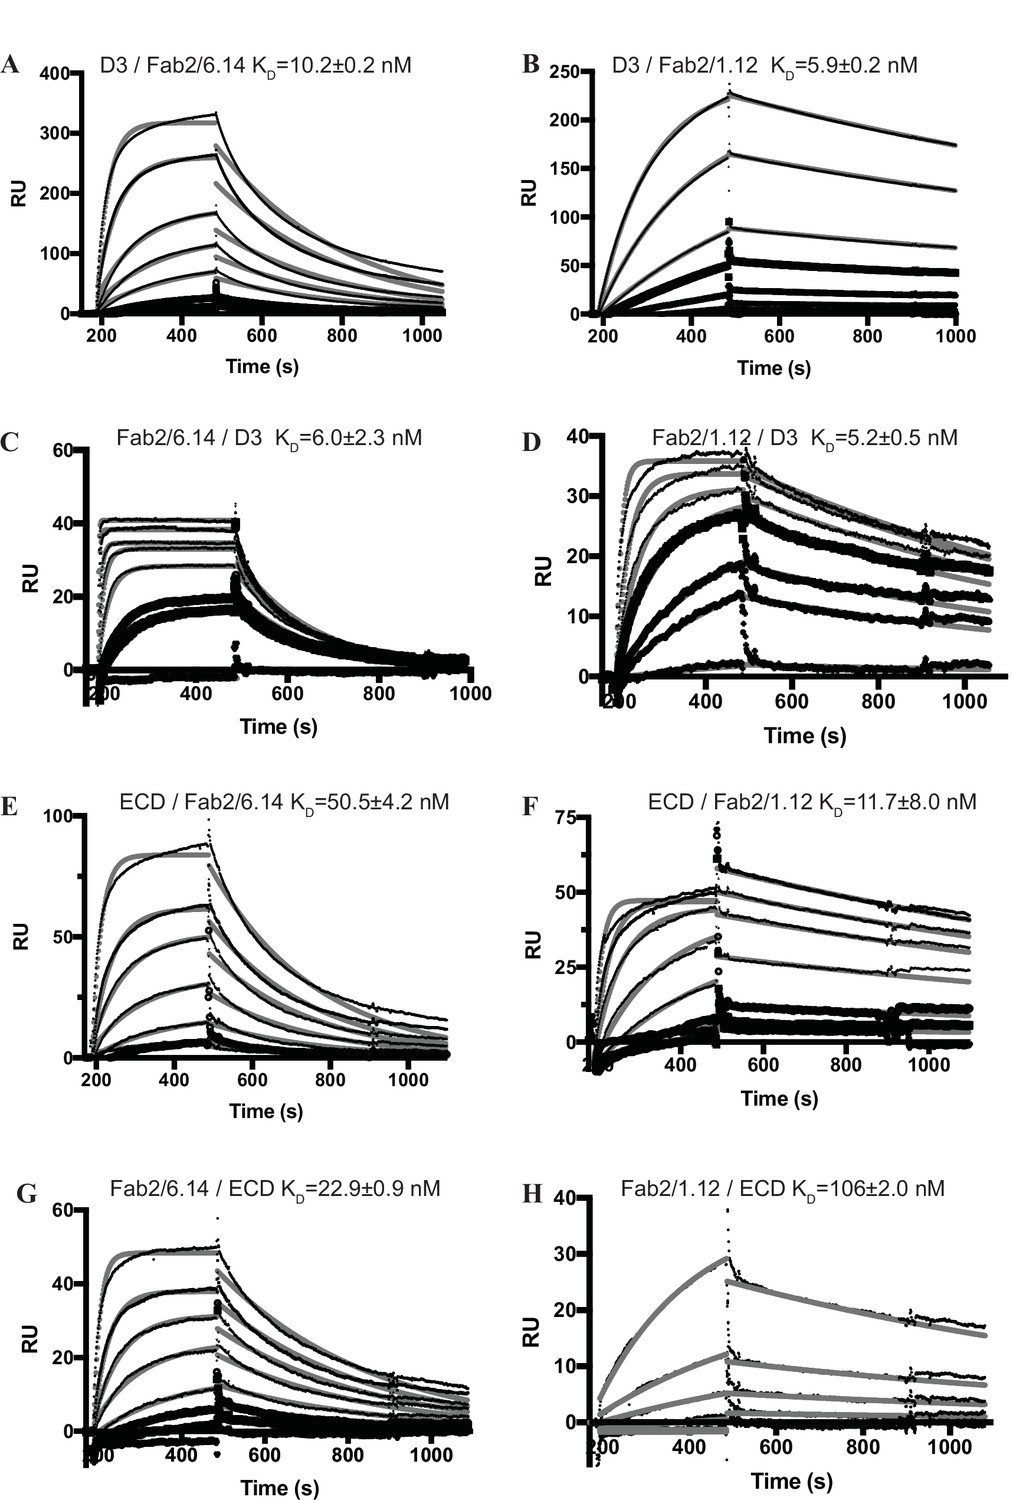
Surface plasmon resonance (SPR) analysis of binding Interactions of Fab 2/6.14 and Fab 2/1.12 with PbHAP2 D3 and monomeric ectodomain.
(A–H) SPR sensorgrams are shown in thin black lines and fits in thick gray lines. Concentrations used for Fab 2/6.14 (A) and Fab2/1.12 (B) were 100, 50, 20, 10, 5, 2, 1 nM. Concentrations used for D3 (C) were 1000, 500, 200, 100, 50, 20, 10, 5 nM and for D3 (D) were 500, 200, 100, 50, 20, 5 nM. Concentrations used for Fab 2/6.14 (E) and Fab2/1.12 (F) were 500, 200, 100, 50, 20, 10, 5 nM. Concentrations used for ectodomain (G and H) were 300, 120, 60, 30, 12, 6, 3 nM.
Figure 2—figure supplement 2
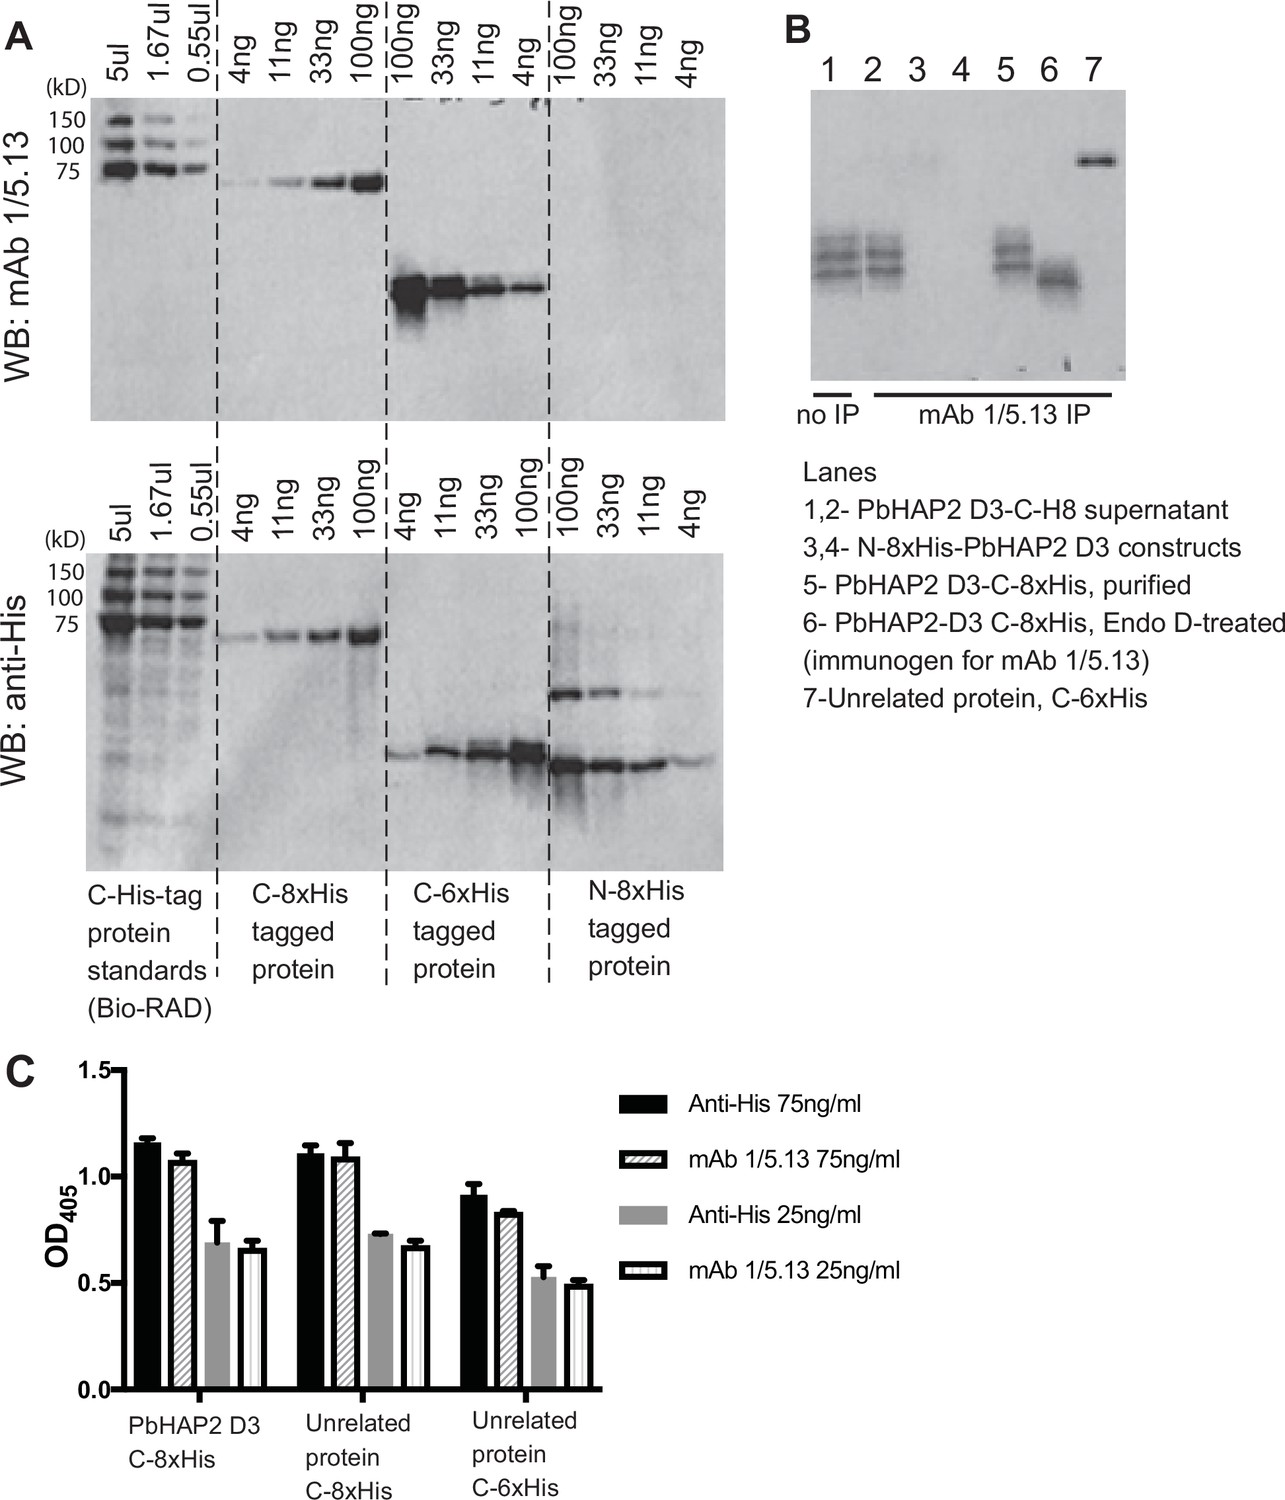
Reactivity of mAb 1/5.13 to fusion proteins with His tags.
(A) Western blot. C-, N-terminal His tagged purified proteins (C-8xHis Chlamydomonas HAP2 ectodomain, C-6xHis Plasmodium falciparum TRAP fragment, N-8xHis-pro-TGFß1) or Bio-RAD Precision Plus All Blue Protein Standards (Cat #1610373, the 75, 100, and 150kD proteins are C-His tagged) were loaded at the indicated concentration per lane and run on 10% reducing SDS-PAGE. The blot was detected with 1µg/ml mAb 1/5.13 or THE His Tag Antibody (Genscript, Cat. No. A00186). THE His Tag Antibody detected C- and N-His-tagged proteins with correct molecular sizes, whereas mAb 1/5.13 didn’t detect the N-His protein at the concentrations tested. (B) Immunoprecipitation. Three µg of purified proteins (lanes 3–7) or 100µl of cultural supernatant of transfectants (lane 2) were subjected to immunoprecipitation with mAb 1/5.13 (8 µg). Immunoprecipitates were analyzed by western blot using rabbit anti-His followed by HRP-anti-rabbit. (C) Elisa. Plates were coated with 5µg/ml C-His tagged PbHAP2 D3 or proteins unrelated to PbHAP2 D3, incubated with mAb 1/5.13 or THE His Tag Antibody at the indicated concentrations.
Figure 2—figure supplement 3
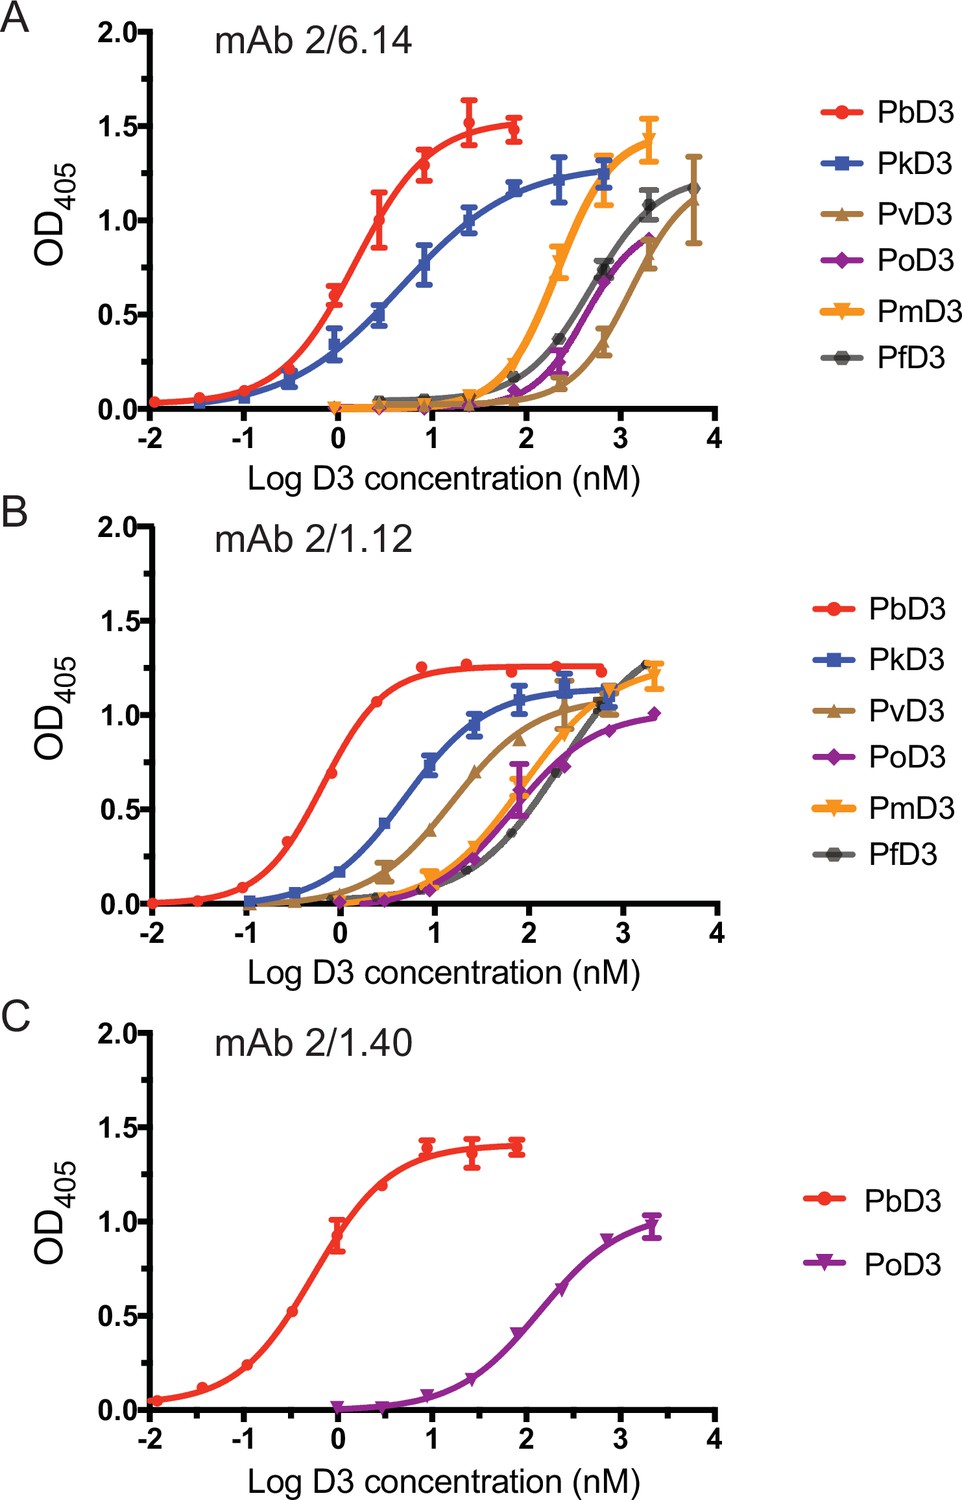
Titration of binding of HAP2 D3 from Plasmodium species to immobilized mAbs.
Elisa plates on which mAb 2/6.14 (A), 2/1.12 (B) or 2/1.40 (C) at 5 µg/ml were immobilized were then incubated with purified, His-tagged D3 from Plasmodium spp at varying concentrations. Binding was detected by incubation with HRP-conjugated anti-His. Non-linear titration curve fitting was performed using GraphPad Prism 7 software. Data shown are mean ± SD of triplicate measurements in one representative experiment.
Figure 3 with 1 supplement
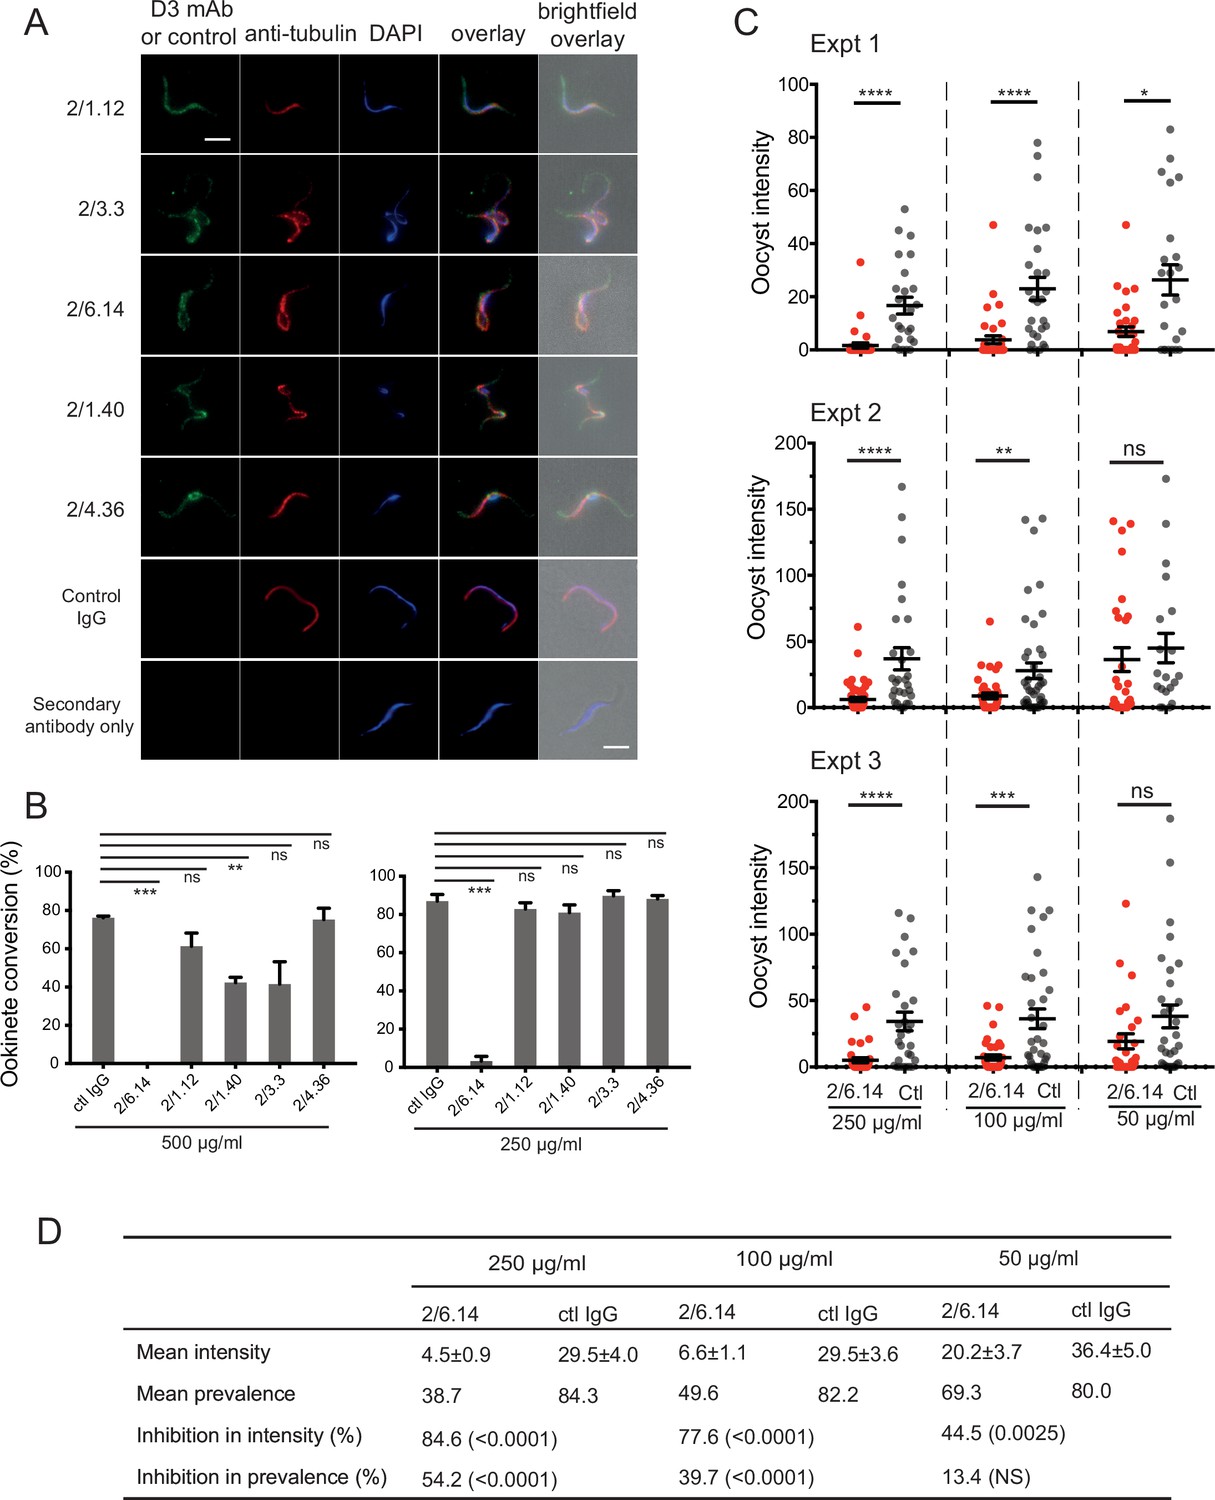
Immunofluorescent staining and inhibition of P.
berghei fertilizaton by mAbs. (A) Immunofluorescent staining of microgametes from P. berghei. Fixed microgametes were stained with mouse D3 mAbs or control IgG, rabbit anti-α-tubulin, secondary Alexa Fluor-488 anti-mouse IgG and Alexa Fluor-594 anti-rabbit IgG, DAPI, and imaged with epifluorescence. Scale bars = 5 µm. (B) Fertilization in vitro measured as macrogamete conversion to ookinetes (% ookinetes/(ookinetes + macrogametes)) in the presence of indicated antibodies. Results are mean ± SEM of three independent experiments, analyzed by paired t test: *** p < 0.001, **p < 0.01, ns, non-significant p > 0.05. Total number of macrogametes + ookinetes in all three experiments are from right to left at 500 µg/ml: 139, 177, 147,104, 199 and 129, and at 250 µg/ml: 222, 120, 270, 410, 275, and 306. (C) ( and D) Mosquitoes were allowed to feed on antibody or control IgG diluted in infected mouse blood placed in membrane feeders; results are shown from three independent experiments. (C) Oocyst intensities (oocysts per mosquito) are shown as filled circles with means as horizontal bars ± SEM. ****p < 0.0001, ***p = 0.0001–0.001, **p = 0.001–0.01, *p = 0.01–0.05, ns p > 0.05 by Mann-Whitney test. (D) Summary of intensity and prevalence (% of infected mosquitoes) with SEM from all three experiments. Prevalence and N values are shown in Figure 3—figure supplement 1. Inhibition (%) was calculated relative to negative control IgG at the same concentrations. The significance of inhibition is shown in parentheses for intensity (Mann-Whitney test) and prevalence (Fisher’s exact test).
Figure 3—figure supplement 1
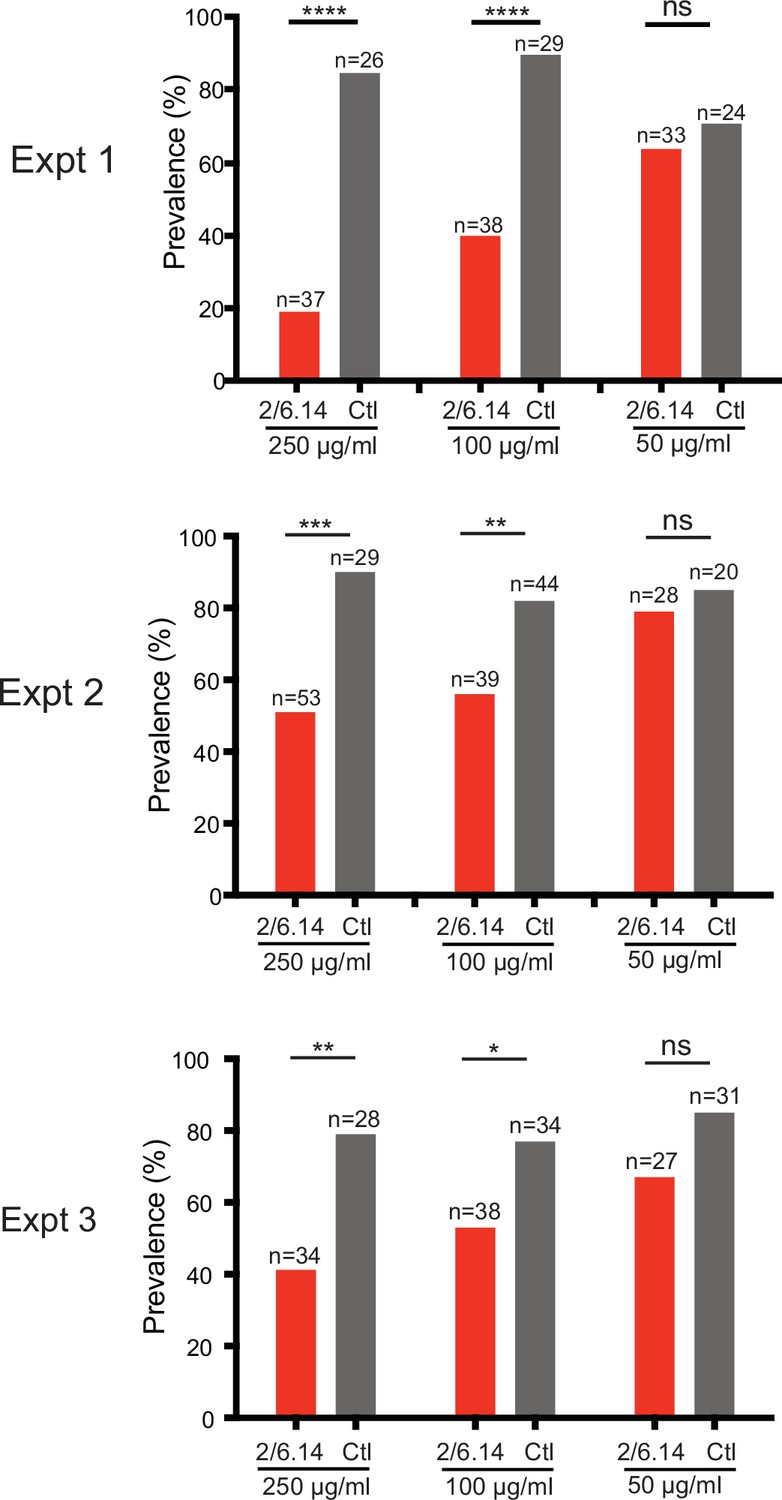
Transmission blocking activity of mAb 2/6.14 in standard membrane feeding assay.
Data shown are prevalence (% of infected mosquitoes) in three independent experiments. Number of mosquitoes per group is shown above bars. Significance was determined by Fisher’s exact test. ****p < 0.0001, ***p = 0.0001–0.001, **p = 0.001–0.01, *p = 0.01–0.05, ns p > 0.05.
Figure 4 with 2 supplements
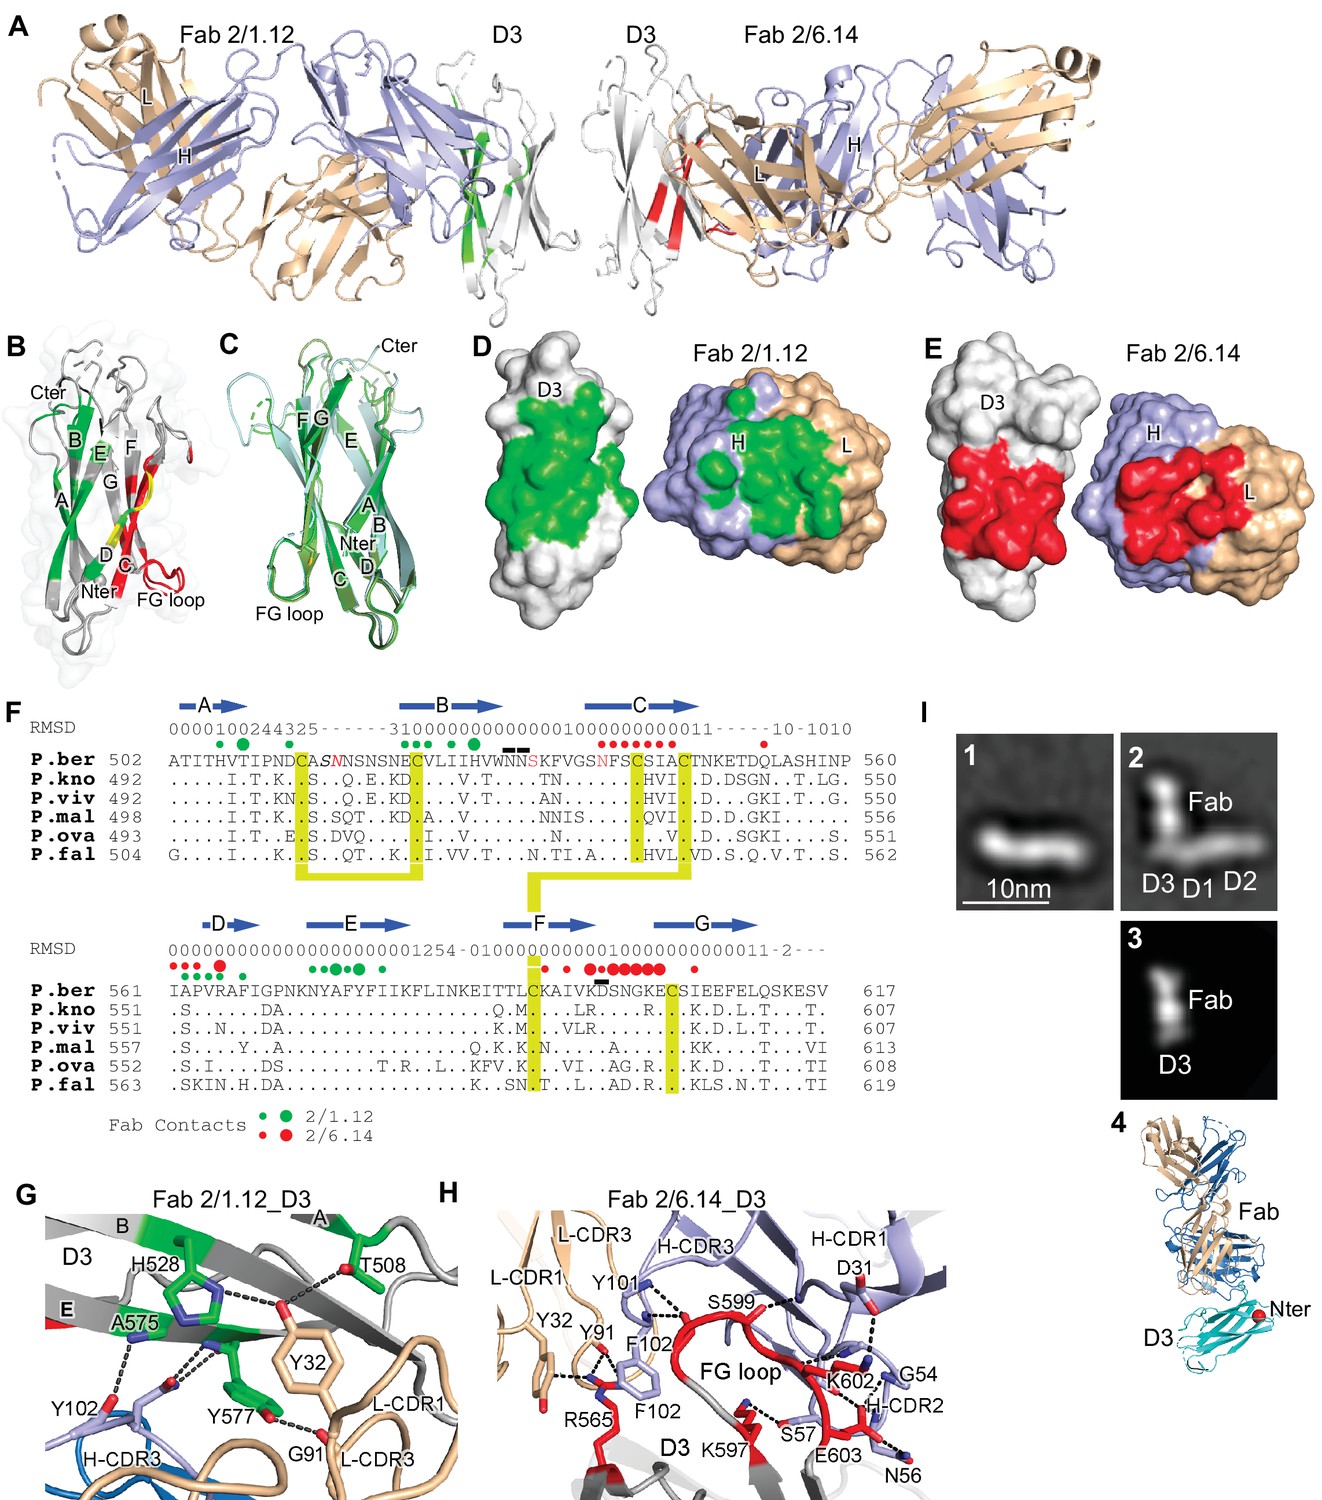
Structures of HAP2 D3 in complex with 2/6.14 Fab or 2/1.12 Fab.
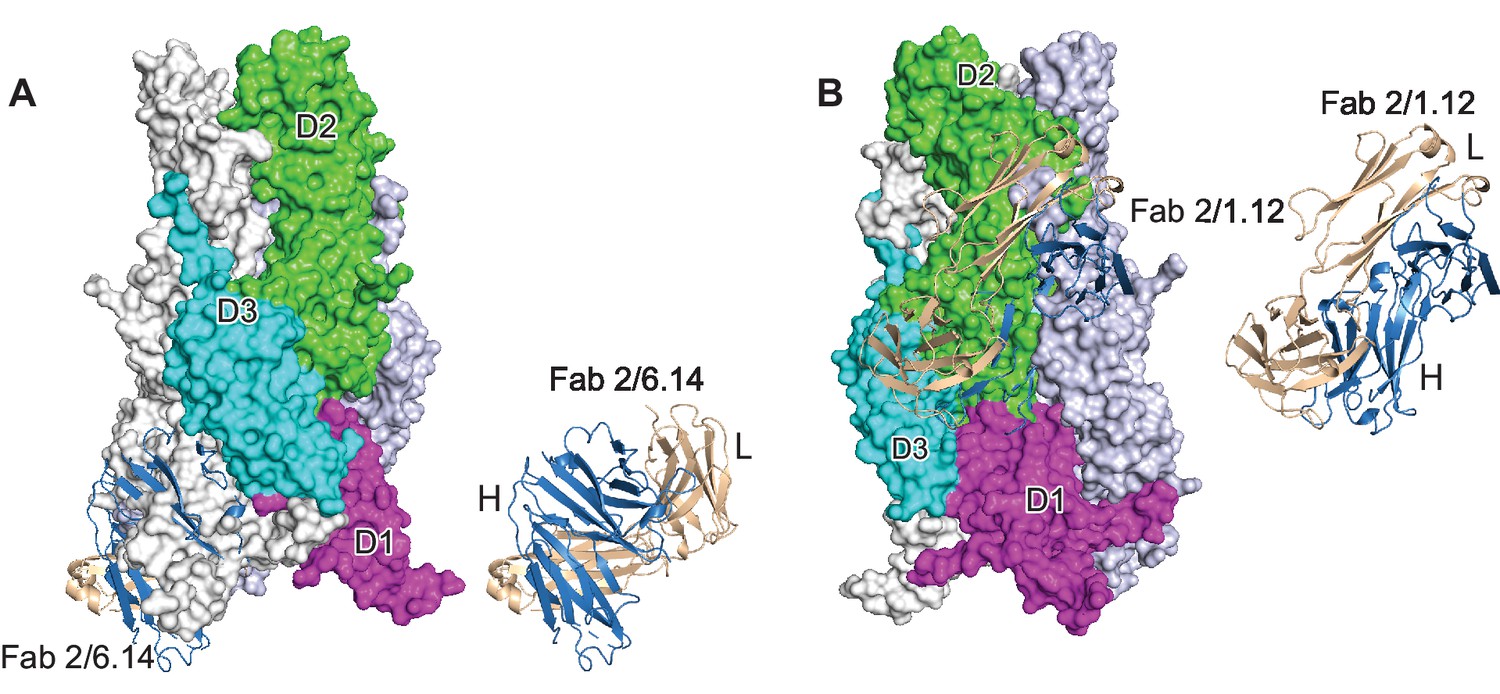
(A) Overview of D3-2/1.12 Fab (left) and D3-2/6.14 Fab complexes (right). (B) Cartoon representation of D3 with residues colored that contact Fab 2/1.12 (green), Fab 2/6.14 (red) or both Fabs (yellow). (C) Cartoon representations of three independent molecules in the two crystals, excluding the one molecule with multiple conformations. Each molecule is colored in a different variation of green. Dashes symbolize loops with missing density. (D) and (E) Solvent accessible surfaces of complexes are shown in open book views in which the Fab and D3 components are rotated apart like two facing pages in an open book. In B, D and E, atoms in D3 and Fabs within 5 Å of one another are colored green (Fab 2/1.12 complex) or red (Fab 2/6.14 complex) and are otherwise white (D3), light blue (Fab H chain), or wheat (Fab L chain). (F) Structural and sequence conservation of D3 and its 2/1.12 and 2/6.14 epitopes. Top line: β-strands shown as arrows. Second line: RMSD of Cα atom position (Å) among the two independent Fab 2/1.12 - D3 complexes and the Fab 2/6.14-D3 complex with a single conformation, calculated after structure alignment by RaptorX (Wang et al., 2013). A dash shows positions where residues were defined in only 0 or 1 of the three structures. Third line: Filled circles show Fab contacts (green for 2/1.12 Fab and red for Fab 2/6.14); residues that mediate major interactions ( > 10 Å2 of buried solvent accessible surface area or H-bonds) or minor interactions ( < 10 Å2 buried solvent accessible surface) are shown with large or small circles, respectively. Remaining lines show D3 sequence in P. berghei, P. knowlesi, P. vivax, P. malariae, P. ovale, and P. falciparum with identities to P. berghei shown as dots. P. berghei residues in red are wild-type and were mutated to remove N-linked sites. Residues in italics were not visualized in any of the three structures. P. berghei residues with sidechains mentioned in the text that stabilize hydrogen bonds in the B-C and F-G loops are overlined. Cysteines are highlighted in yellow and connected when disulfide-linked. (G) and (H). Details of D3 interactions with the 2/1.12 Fab (G) and 2/6.14 Fab (H). D3 is silver, Fab H and L chains are light blue and wheat, respectively, and residues with major interactions with Fabs as defined in (F) have carbons colored green (G) or red (H). Dashes show hydrogen bond and pi-cation interactions. (I) The most populated negative stain EM class averages of the HAP2 ectodomain (residues 43–617) alone (panel 1, 1,128 particles) and in complex with the 2/6.14 Fab (panel 2, 379 particles). Panel 3 shows the best correlating projection from the complex crystal structure. Panel 4 shows a ribbon diagram of the crystal structure in the same orientation. D3 colored cyan, Fab H and L chains colored light blue and wheat, respectively, and N-terminal of D3 shown as a red sphere.
Figure 4—figure supplement 1
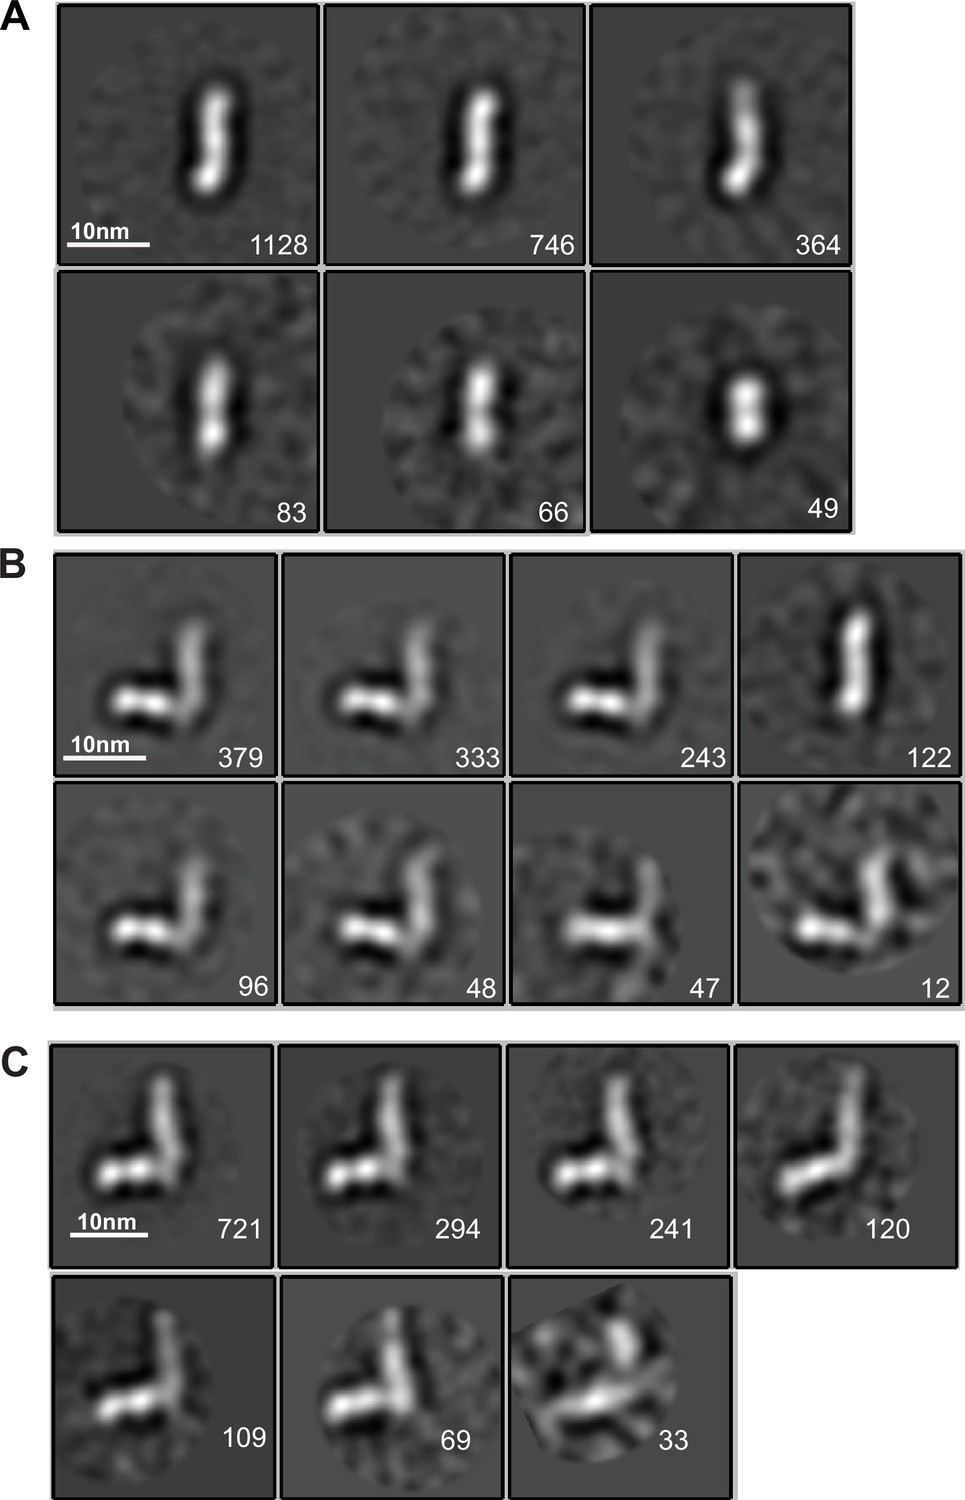
EM class averages.
Classes are from RELION classification of negatively stained particles of the Hap2 ectodomain, residues 43–617 (A) or Fab 2/6.14 complexes with the Hap2 ectodomain, residues 43–617 (B) or with the Hap2 ectodomain, residues 61–611 (C). Particle numbers are shown for each class average. Scale bars (10 nm) are shown as a white line.
Figure 4—figure supplement 2
Steric clashes of mAbs 2/6.14 and 2/1.12 with the postfusion HAP2 conformation.
Complexes of PbHAP2 D3 with the 2/6.14 Fab (A) and 2/1.12 Fab (B) were superimposed on D3 of the postfusion C. reinhardtii HAP2 trimer. The postfusion HAP2 structure is shown as a surface and colored by domain in one monomer; other monomers are white and lightblue (pdb ID:6DBS). Fab H and L chains are light blue and wheat, respectively, and are shown alone to the right to emphasize how much of each Fab is buried.
Figure 5
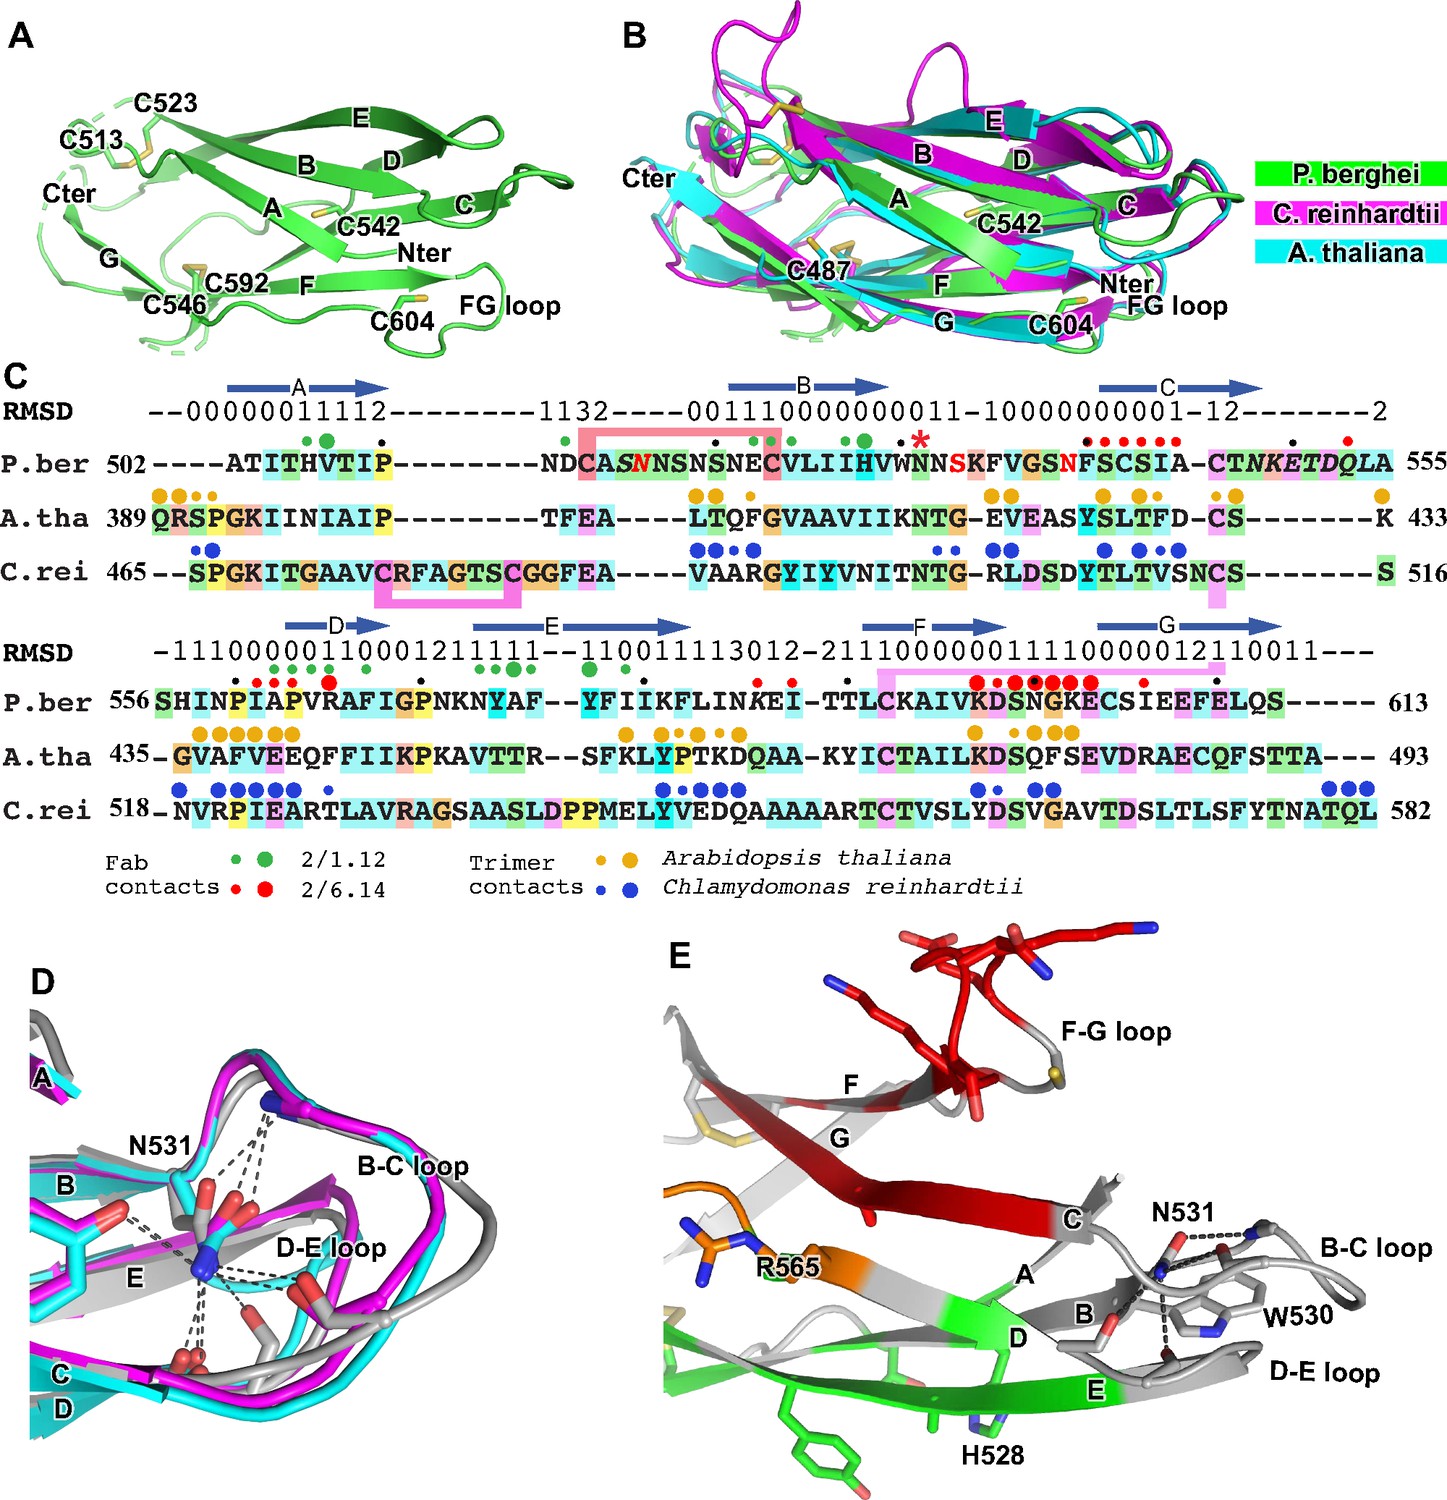
Structural conservation of D3 of HAP2 across phyla.
(A) P. berghei HAP2 D3 from the Fab 2/1.12 complex showing the disulfide-bonded and free cysteines. (B) Superimposition of HAP2 D3 from the P. berghei 2/6.14 Fab complex and trimeric fusion states of Chlamydomonas reinhardtii (pdb ID:6DBS) and Arabidopsis thaliana (pdb ID: 5ow3). Structures were aligned using RaptorX (Wang et al., 2013). (C) Structure-based sequence alignment from the superimposition shown in (B). β-strands and RMSD (Å) of Cα atom positions are shown above the sequences. Green and red filled circles above the P. berghei sequence show Fab 2/1.12 and Fab 2/6.14 contacts, respectively as defined in Figure 4F legend. In the P. berghei sequence, the three residues in red mark residues that were mutated to remove N-linked sites. Orange and blue filled large and small circles above Arabidopsis thaliana and Chlamydomonas reinhardtii sequences mark residues buried in trimer contacts with >10 Ų burial or a hydrogen bond or <10 Ų, respectively. Solvent accessible surface area burial was calculated with PISA (Krissinel and Henrick, 2007). (D) Asn-531, present in an N-glycosylation sequon in the P. berghei sequence, forms stabilizing hydrogen bonds to the backbones of the B-C and D-E loops, a function that is conserved in HAP2 in other phyla. The color code is the same as in panel B, except P. berghei is in silver. (E) Asn-531 locates near mAb epitopes. Asn-531 and sidechains or backbones to which it hydrogen bonds are shown in stick. Residues with major or minor contacts with Fabs as defined in Figure 4F legend are shown with both backbone and sidechain, or backbone only, respectively, and colored according to the Figure 4F legend and the key. Residues in both epitopes are in orange.
Figure 6 with 1 supplement
Antibody binding to the HAP2 ectodomain.
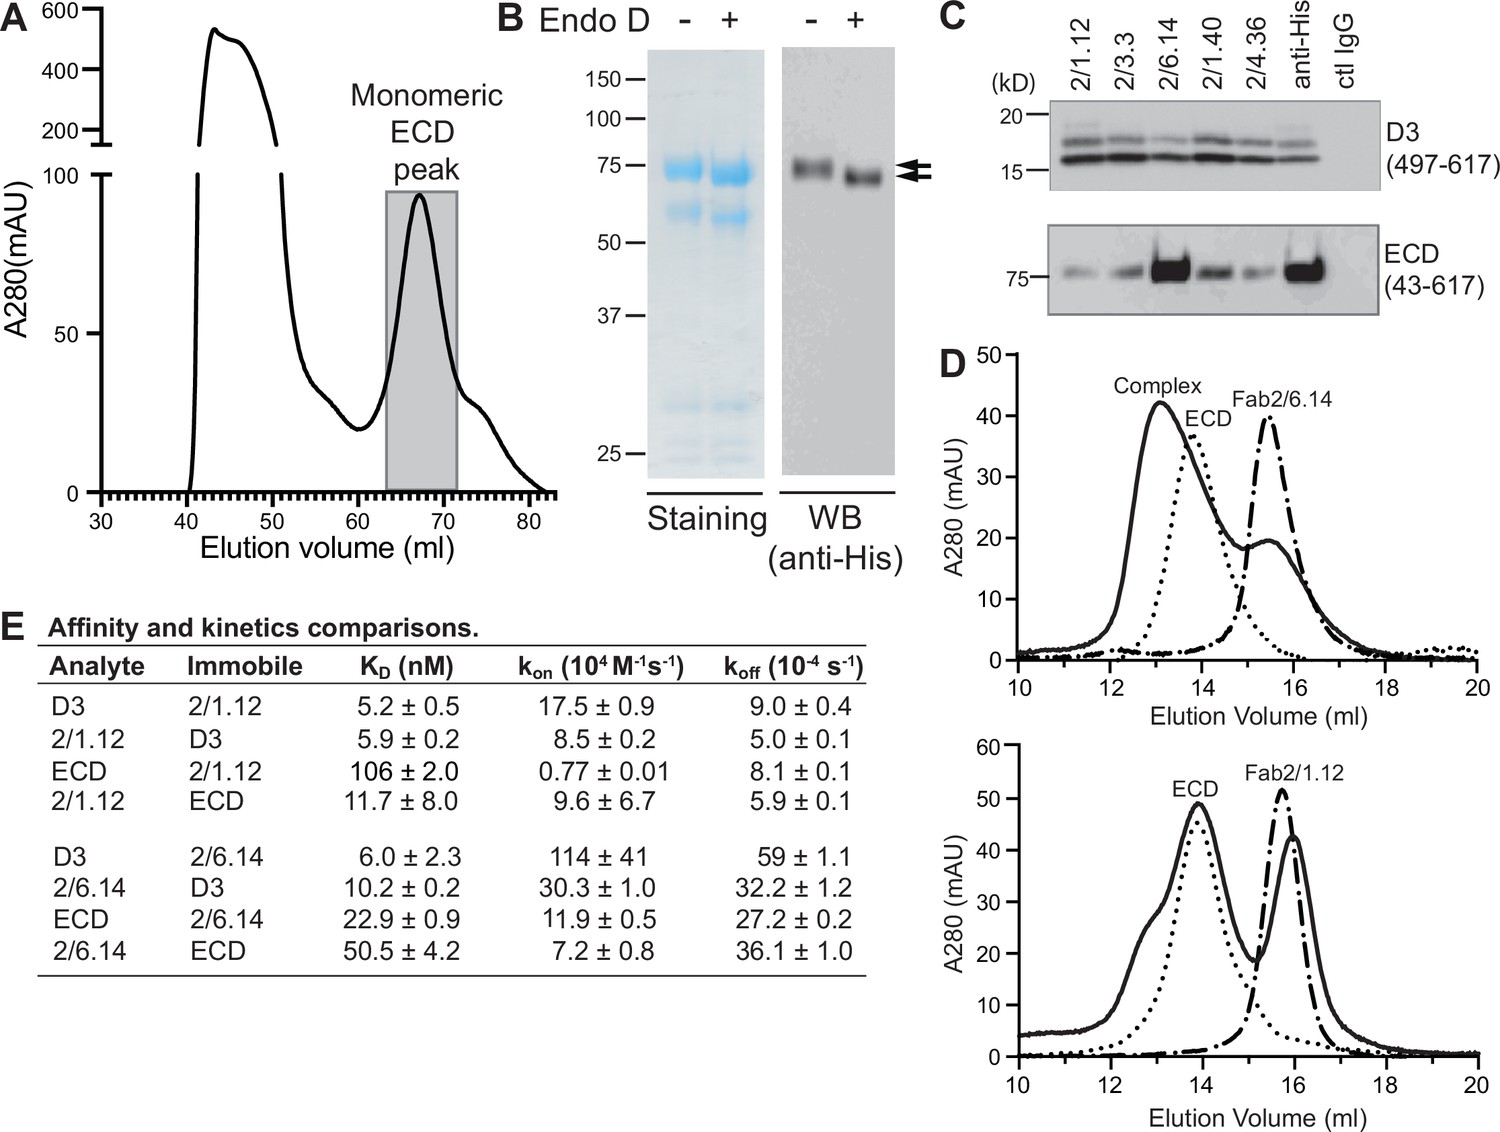
(A) Gel filtration profile of Ni-NTA affinity-purified ectodomain (residues 43–617) on a Hiload 16/600 Superdex 200 column. (B) Reducing SDS 7.5% PAGE and Coomassie blue staining and Western blot (WB) of the peak eluted at 67.2 mL (shaded in A). Aliquots were treated with or without Endo D to remove N-linked glycans. Arrows indicate ectodomain bands before and after Endo D treatment. The HAP2 ectodomain contains 11 putative N-glycosylation sites; however, Endo D treatment reduced the mass by only ~3 kD. It is unknown how many sites are N-glycosylated and whether all sites are accessible to Endo D. (C) Immunoprecipitation. Reactivity of D3 mAbs to HAP2 ectodomain (bottom) in comparison to D3 (top). Two µg purified ectodomain from (A), without Endo D treatment, was subjected to immunoprecipitation with the indicated D3 mAbs, anti-His mAb 1/5.13 or control IgG. D3 (497–617, containing three putative N-glycosylation sites) was immunoprecipitated from culture supernatants of S2 transfectants. Multiple D3 bands are different glycoforms. (D) Analysis of formation of PbHAP2 ectodomain complex with 2/6.14 Fab (top) and 2/1.12 Fab (bottom) by gel filtration. Ectodomain and Fab 2/6.14 or Fab 2/1.12 were mixed in 20 mM Tris-HCl pH 8.0, 500 mM NaCl at 1:1 molar ratios and incubated at 4 °C for 1 hr. Mixtures was then subjected to gel filtration on a Superdex 200 10/300 GL column in the same buffer. Elution profiles of the mixture, ectodomain or Fabs are shown as solid, dotted, or dashed lines, respectively. (E) KD values (koff/kon) and kinetic values measured by surface plasmon resonance. Values are mean ± difference of the means from two independent experiments. D3 contained residues 502–617 with N516T, S533N and N539Q mutations and the ectodomain (ECD) contained residues 43–617 without Endo D treatment.
Figure 6—figure supplement 1
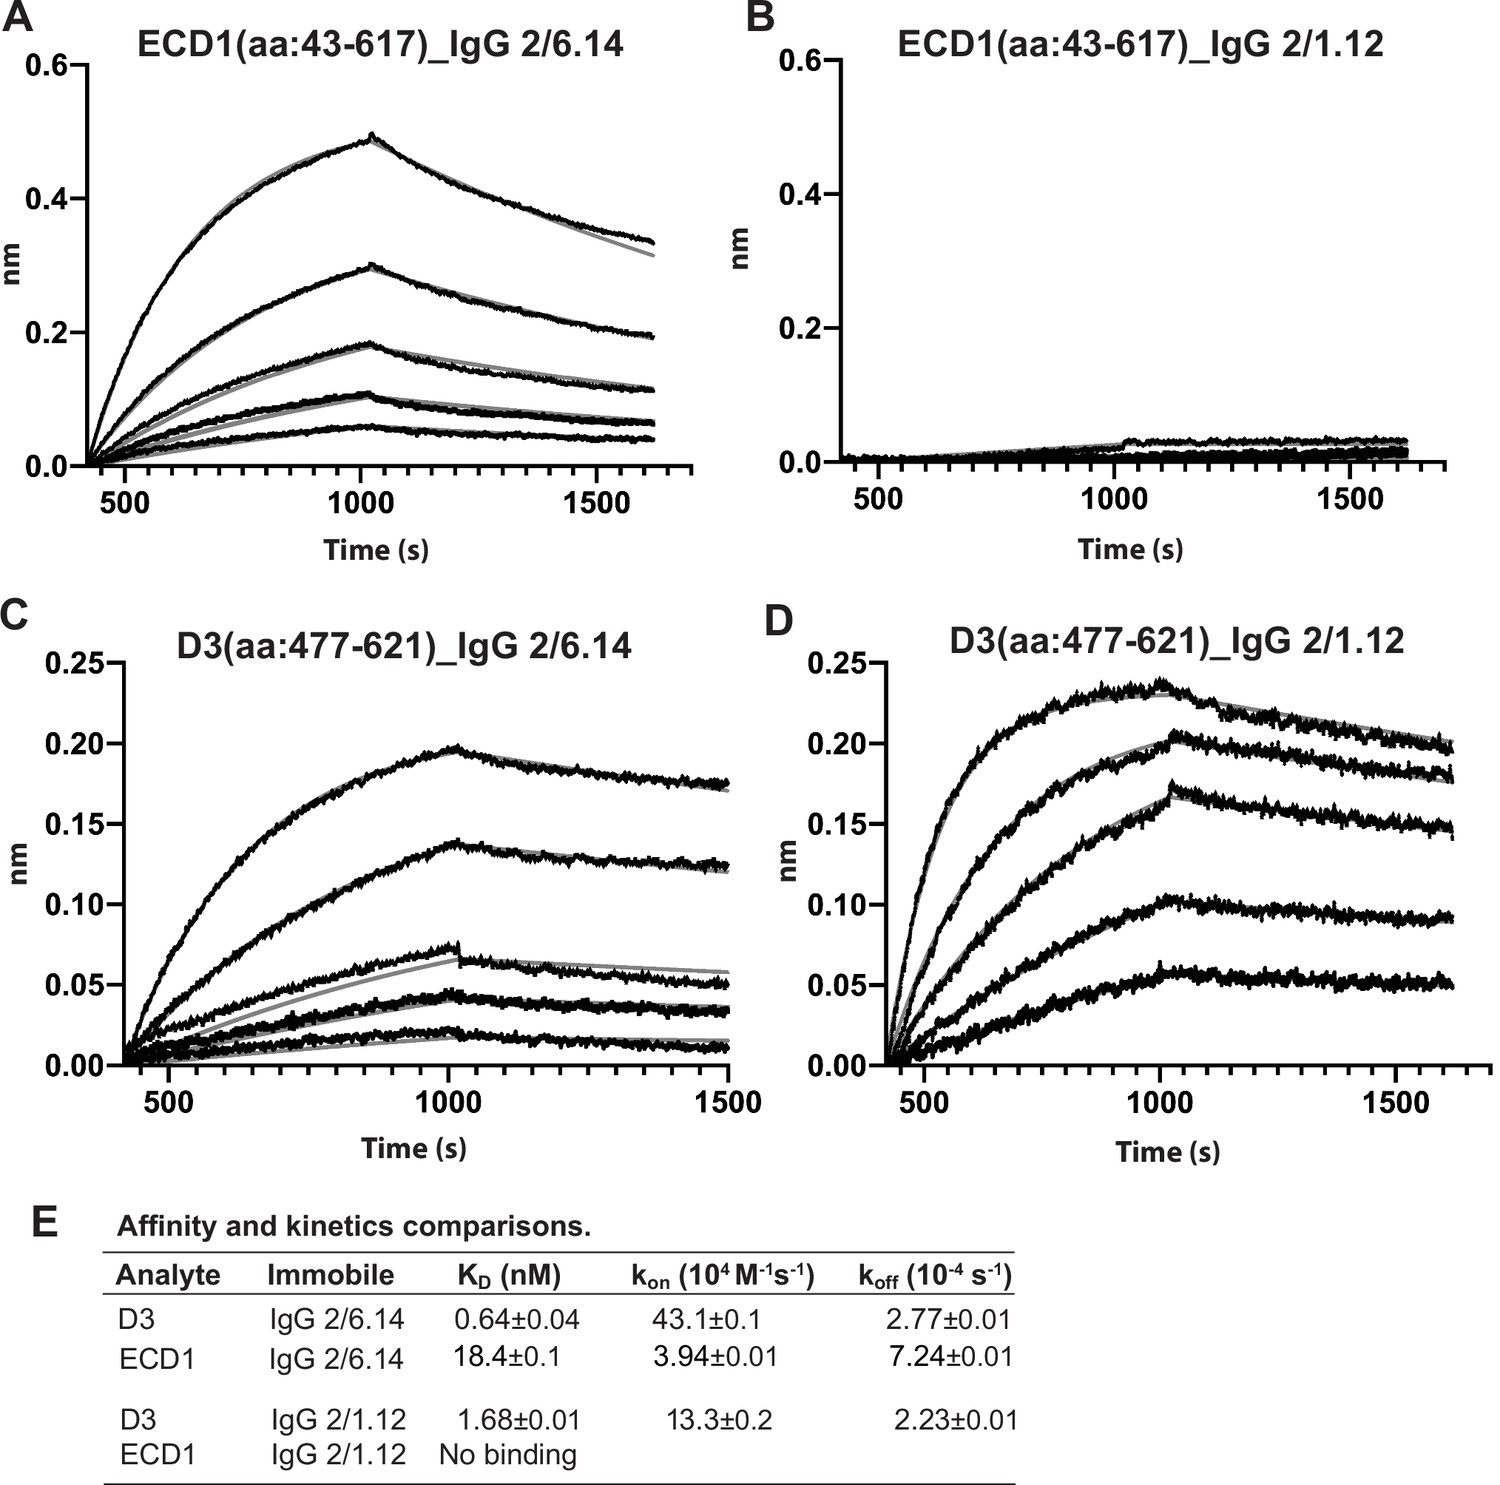
Biolayer interferometry (BLI) analysis of binding Interactions of PbHAP2 D3 and monomeric ectodomain with IgG 2/6.14 and IgG 2/1.12.
Concentrations used for (A–B) monomeric ectodomain (ECD1) were 100, 50, 25, 12.5, 6.25, 0 nM. Concentrations used for PbD3 (C–D) were 16, 8, 4, 2, 1, 0 nM. Response curves of BLI are in black and fitting curves in gray. (E) KD values (koff/kon) and kinetic values measured by BLI. The kinetic parameters were fit globally to sensorgrams at different analyte concentrations. Errors are SE(standard error) from nonlinear least square fits. All experiments were repeated at least twice with essentially identical results. PbD3 contained the residues 477–621, and the ECD1 contained residues 43–617, both of the PbD3 and ECD1 are without Endo D treatment.
Tables
Table 1
Statistics of X-ray diffraction and structure refinement of PbHAP2 domain 3 (D3) complexed with 2/6.14 Fab or 2/1.12 Fab.
| D3-2/6.14 Fab | D3-2/1.12 Fab | |
|---|---|---|
| Data collection statistics | ||
| Space group | P222 | P21 |
| α, β, γ, ° | 90, 90, 90 | 90, 95.8, 90 |
| Unit cell (a, b, c), Å | 78.3, 122.6, 168.5 | 43.9, 187.1, 74.4 |
| Resolution range (Å) | 50.0–2.80 (2.87-2.80)* | 50.0–2.10 (2.15–2.10) |
| Completeness (%) | 99.3 (99.5) | 98.4 (96.9) |
| Number unique reflections | 40,741 (2,938) | 68,138 (4,935) |
| Redundancy | 3.8 (4.0) | 3.6 (3.7) |
| Rmerge (%)† | 5.7 (70.2) | 8.3 (153) |
| I/σ(I) | 12.8 (2.2) | 8.42 (0.52) |
| CC½ (%) ‡ | 99.8 (90.9) | 99.7 (10.9) |
| Wavelength (Å) | 1.0332 | 1.0332 |
| Refinement statistics | ||
| Rwork (%) § | 25.3 (33.7) | 18.97 (37.3) |
| Rfree (%) | 29.2 (34.8) | 23.27 (40.5) |
| Bond RMSD (Å) | 0.003 | 0.003 |
| Angle RMSD (°) | 0.548 | 0.603 |
| Ramachandran plot ¶(Favored/allowed/outlier) | 91.5/7.6/0.9 | 95.93/4.07/0.1 |
| Number of atoms | ||
| Protein | 10,310 | 8,183 |
| Ligand | 22 | 54 |
| Water | 18 | 353 |
| B factor | ||
| Protein | 128.6 | 72.7 |
| Ligand | 112.8 | 112.9 |
| Water | 138.0 | 64.9 |
| Molprobity percentile | ||
| (Clash/Geometry) | 98/97 | 99/97 |
| PDB | 7LR3 | 7LR4 |
-
*
The numbers in parentheses refer to the highest resolution shell.
-
†
Rmerge = Σh Σi |Ii(h) -< I(h)> | / ΣhΣi Ii(h), where Ii(h) and< I(h)> are the ith and mean measurement of the intensity of reflection h.
-
‡
Pearson’s correlation coefficient between average intensities of random half-datasets for each unique reflection (Karplus and Diederichs, 2012).
-
§
Rfactor = Σh||Fobs (h)|-|Fcalc (h)|| / Σh|Fobs (h)|, where Fobs (h) and F calc (h) are the observed and calculated structure factors, respectively. No I/σ(I) cutoff was applied.
-
¶
Calculated with MolProbity (Davis et al., 2007).
Key resources table
| Reagent type (species) or resource | Designation | Source or reference | Identifiers | Additional information |
|---|---|---|---|---|
| Genetic reagent (Drosophila) | EXpreS2 transfection reagent | ExpreS2ion Biotechnologies | Catalog NO: 95-055-075 | https://expressionsystems.com/product/expres2-tr-transfection-reagent/ |
| Cell line (Drosophila) | Drosophila melanogaster Schneider S2 | ExpreS2 cells | ExpreS2ion Biotechnologies | |
| Transfected construct (Drosophila) | ET15S2 vector | Feng et al., 2018 | ExpreS2ion Biotechnologies | Modified from the pExpreS2-2 vector, Includes N-terminal secretion signal from Hspa5 and C-terminal His8 tag |
| Cell line (Homo-sapiens) | Expi293F cells | Thermo Fisher Scientific | Catalog NO: A14527 | |
| Transfected construct (Expi293F cells) | pD2529-CAG vector | This paper | Atum, Newark, CA | |
| Strain, strain background (M. musculus) | CB6F1 | The Jackson Laboratory | CB6F1 mice were immunized with the glycan-shaved D3 protein | |
| Strain, strain background (P. berghei) | P. berghei | This paper | P. berghei – WT strain ANKA 2.34 | Strain maintained in Dr. Andrew Blagborough lab |
| Strain, strain background (Mosquitoes) | Female Anopheles stephensi | This paper | SDA 500 strain | Strain maintained in Dr. Andrew Blagborough lab |
| Gene(P. berghei) | P. berghei HAP2 ectodomain | UniProt | Q4YCF6.1 | All constructs were codon-optimized for mammalian cells |
| Gene(P. falciparum) | HAP2 D3(aa:479–626) | NCBI | XP_001347424.1 | All constructs were codon-optimized for mammalian cells |
| Gene(P. knowlesi) | HAP2 D3(aa:492–607) | NCBI | XP_002258781.1 | All constructs were codon-optimized for mammalian cells |
| Gene(P.vivax) | HAP2 D3(aa:492–608) | GenBank | SGX77070.1 | All constructs were codon-optimized for mammalian cells |
| Gene(P. malariae) | HAP2 D3(aa:498–613) | GenBank | SCN12177.1 | All constructs were codon-optimized for mammalian cells |
| Gene(P. ovale) | HAP2 D3(aa:493–608) | GenBank | SBS88209.1 | All constructs were codon-optimized for mammalian cells |
| Antibody | Anti-His (Rabbit polyclonal) | Cell Signaling | Catalog NO:2,365 S | (0.4 µg/ml) |
| Antibody | Rabbit anti-alpha tubulin (Rabbit polyclonal) | Abcam | Catalog NO:AB18251 | (1:1000) |
| Antibody | Goat anti-Mouse IgG (H + L) Cross-Adsorbed Secondary Antibody, Alexa Fluor 488 (Goat polyclonal) | Molecular Probes/ ThermoFisher | Catalog NO: A-11001 | (25 µg/ml) |
| Antibody | Goat anti-Rabbit IgG (H + L) Cross-Adsorbed Secondary Antibody, Alexa Fluor 594 (Goat polyclonal) | Molecular Probes/ ThermoFisher | Catalog NO:A-11012 | (25 µg/ml) |
| Software, algorithm | XDS | https://strucbio.biologie.uni-konstanz.de/xdswiki/index.php/Xds | Diffraction data was processed with XDS | |
| Software, algorithm | Phenix | https://www.phenix-online.org/ | The structure was solved by molecular replacement with Phaser in the Phenix suite | |
| Software, algorithm | CCP4 | http://www.ccp4.ac.uk/ | Refinement |
Additional files
Download links
A two-part list of links to download the article, or parts of the article, in various formats.
Downloads (link to download the article as PDF)
Open citations (links to open the citations from this article in various online reference manager services)
Cite this article (links to download the citations from this article in formats compatible with various reference manager tools)
Structural basis of malaria transmission blockade by a monoclonal antibody to gamete fusogen HAP2
eLife 10:e74707.
https://doi.org/10.7554/eLife.74707


