Somite morphogenesis is required for axial blood vessel formation during zebrafish embryogenesis
- Department of Biochemistry and Cell Biology, Stony Brook University, United States
- Molecular Cardiovascular Biology Division and Heart Institute, Cincinnati Children's Hospital Medical Center, United States
- Department of Pediatrics, University of Cincinnati College of Medicine, United States
Figures
Figure 1 with 1 supplement
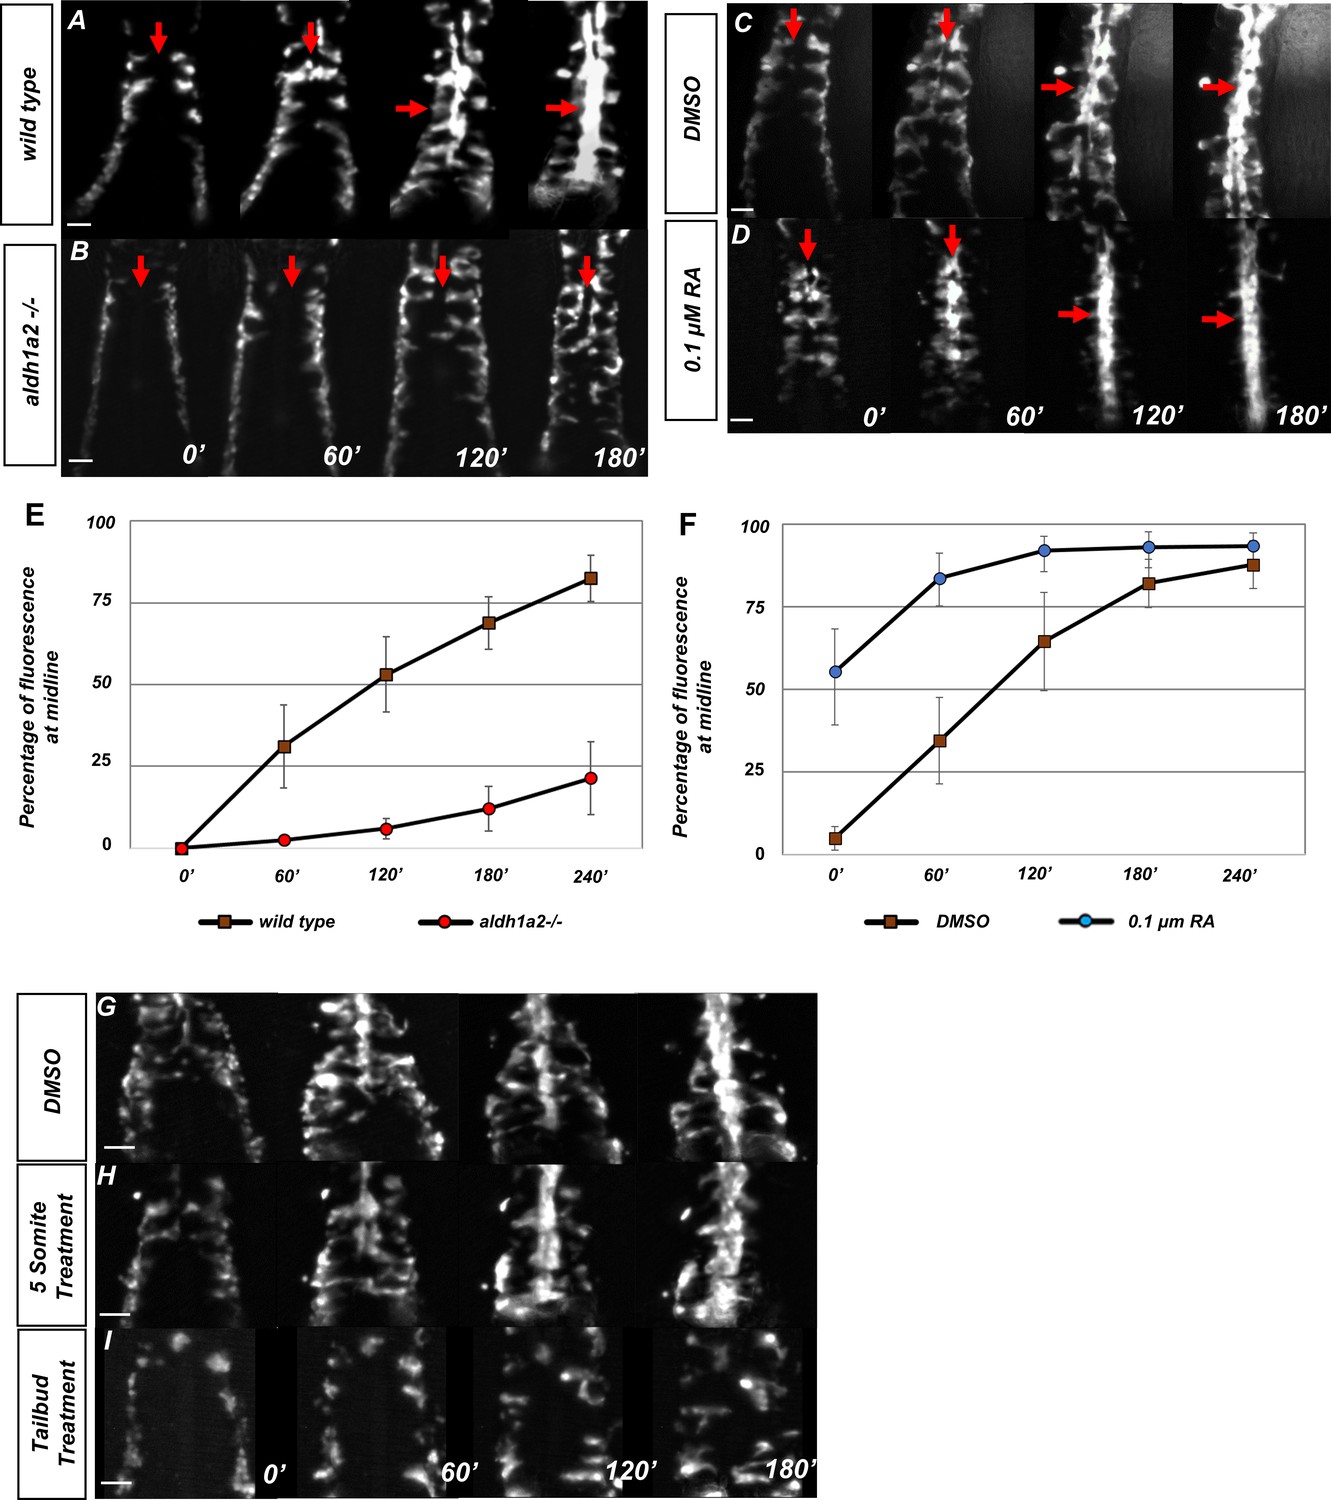
Retinoic acid (RA) is required prior to segmentation for angioblast migration.
(A–D) Dorsal view of tg(kdrl:eGFP) embryos with representative images taken every 60 min over the course of 180 min, in (A) untreated (N = 12, see Video 1), (B) aldh1a2-/- mutants (N = 12, see Video 2), (C) DMSO-treated (N = 10), or (D) 0.1 µM RA-treated embryos (N = 8, see Video 3). The anterior of the embryo is at the top, and red arrows indicate the midline. (E, F) Graph of fluorescence intensity as angioblasts arrive at the midline for (E) wild-type and aldh1a2-/- and for (F) DMSO and 0.1 μM RA. Y-axis indicates the percentage of fluorescent intensity at midline relative to the fluorescence intensity of whole embryo. Time is measured on the X-axis. N = 8 for all conditions, error bars indicate standard deviation. (G–I) Time-lapse images of tg(kdrl:eGFP) embryos treated with either (G) DMSO vehicle (n = 10) or (H) 20 μM DEAB at the five-somite stage (n = 6), and (I) 20 μM DEAB at tailbud stage (n = 14). Scale bars, 50 µm.
-
Figure 1—source data 1
Wild-type and aldh1a2 -/- midline fluorescence percentages.
- https://cdn.elifesciences.org/articles/74821/elife-74821-fig1-data1-v2.csv
-
Figure 1—source data 2
DMSO and RA treatment midline fluorescence percentages.
- https://cdn.elifesciences.org/articles/74821/elife-74821-fig1-data2-v2.csv
Figure 1—figure supplement 1
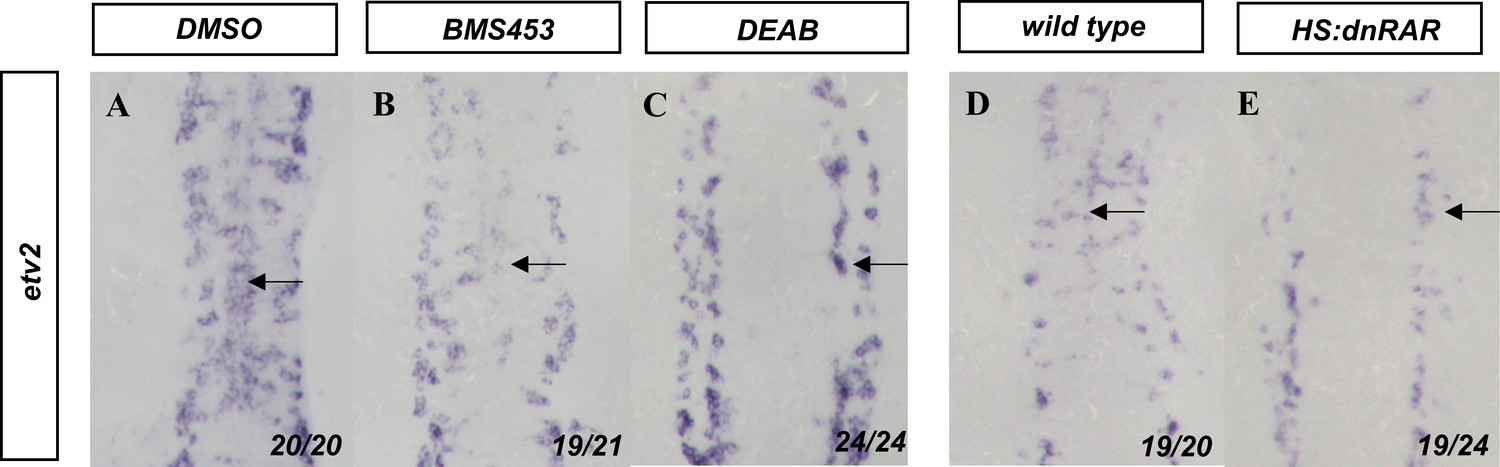
Three alternative methods of retinoic acid (RA) signaling disruption inhibit midline angioblast migration.
Angioblasts are labeled by etv2 in situ hybridization in 13-somite stage embryos (black arrows) after (A) DMSO, (B) BMS453, or (C) DEAB treatment, or after bud stage heat shock in (D) wild-type and (E) HS:dnrar embryos. Embryos are shown from a dorsal view with anterior to the top.
Figure 2 with 1 supplement
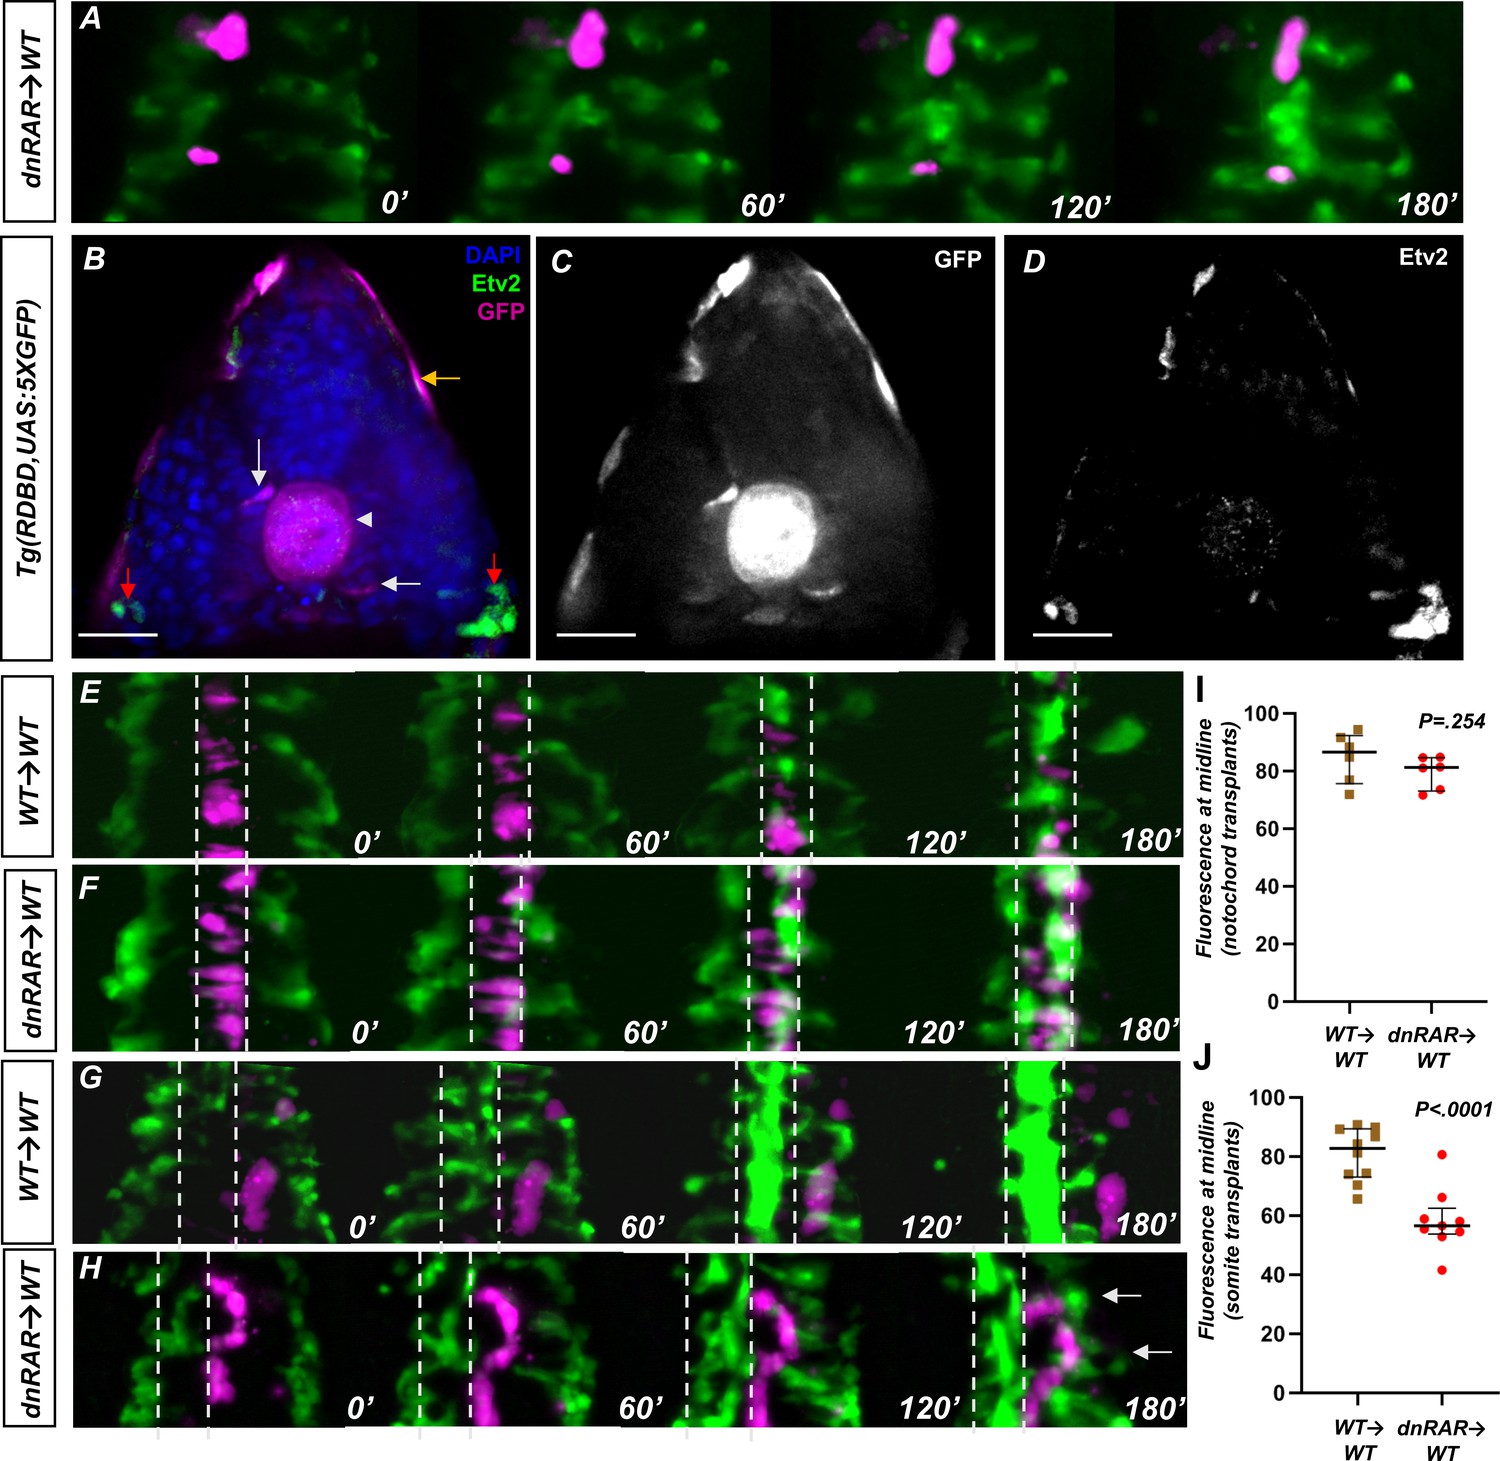
Retinoic acid (RA) signaling is not present in the endothelium and is required in the somites for angioblast migration.
(A) Representative images of a time-lapse of tg(HS:dnRAR), tg(HS:id3) cells transplanted into a wild-type embryo. Cells labeled in magenta indicate migrating cells. These cells migrate along with the host angioblasts labeled by tg(kdrl:gfp), indicating normal migration patterns in the absence of cell-autonomous RA-depletion conditions (n = 3) (see Video 4). (B) DAPI-stained section of the 13-somite stage tg(RDBD,5XUAS:GFP) embryo, immunostained for GFP and Etv2 (n = 12). GFP signal is present in the adaxial region of the somite, the notochord, and the epidermis (white arrow, white arrowhead, and gold arrows, respectively). The red arrows indicate areas of Etv2 staining. (C) GFP channel of image in (B). (D) Etv2 channel of image in (B). Note the lack of overlap between Etv2 staining and GFP staining. (E) Representative images of a time-lapse of wild-type cells transplanted into a wild-type notochord. (F) Representative images of a time-lapse of tg(HS:dnRAR) cells transplanted into a wild-type notochord. (G) Representative images of a time-lapse of wild-type cells transplanted into a wild-type somite. (H) Representative images of a time-lapse of tg(HS:dnRAR) cells transplanted into a wild-type somite. White arrows indicate angioblast migration defects. (I) Quantification of midline fluorescence, as a percentage of total, for notochord transplants at 180′. The difference for wild-type and tg(HS:dnRAR) was not statistically significant (p=0.254). (J) Quantification of midline fluorescence, as a percentage of total, for somite transplants at 180′. The difference for wild-type and tg(HS:dnRAR) was statistically significant (p<0.0001). Scale bars, 50 µm.
-
Figure 2—source data 1
Fluorescence percentage at midline for somite targeted transplants.
- https://cdn.elifesciences.org/articles/74821/elife-74821-fig2-data1-v2.csv
-
Figure 2—source data 2
Fluorescence percentage at midline for notochord targeted transplants.
- https://cdn.elifesciences.org/articles/74821/elife-74821-fig2-data2-v2.csv
Figure 2—figure supplement 1
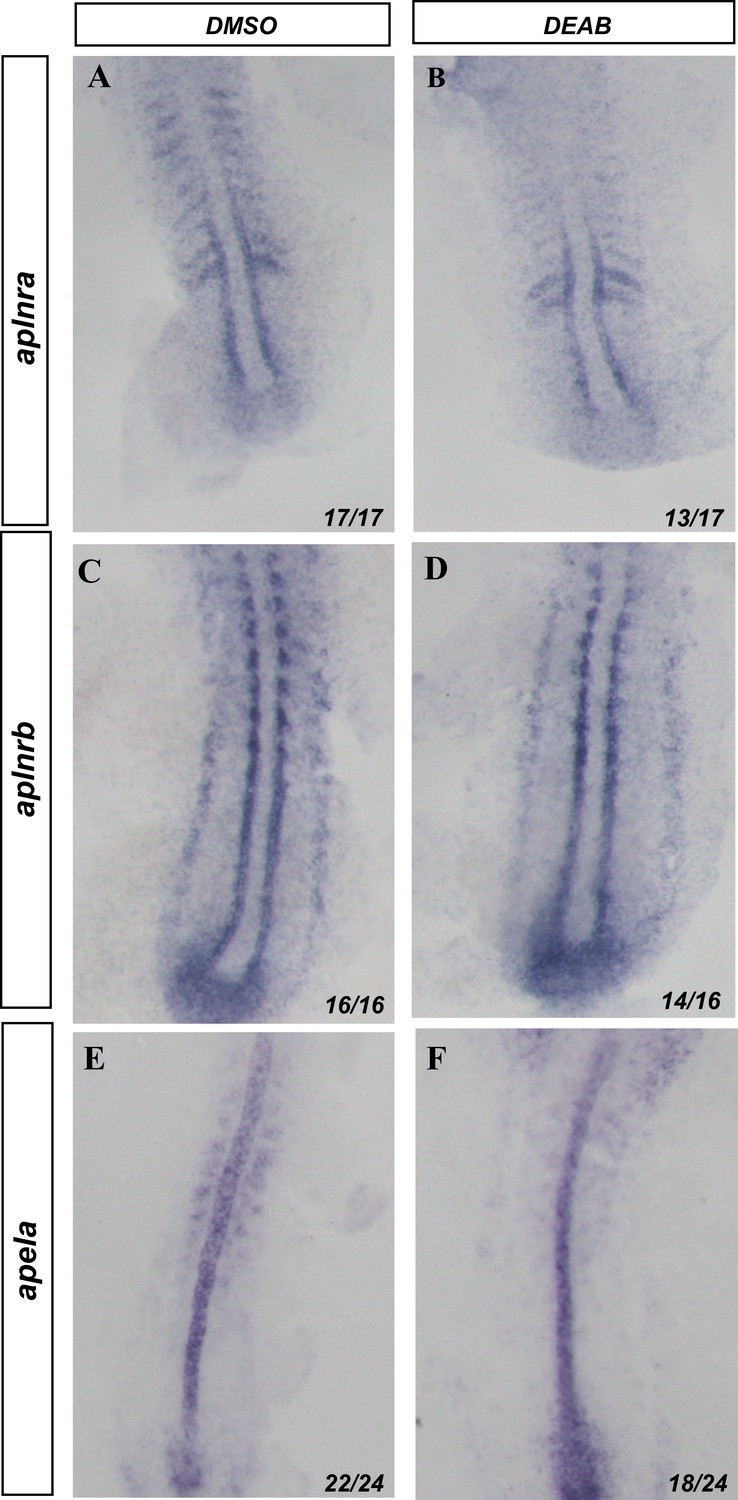
Apela/Aplnr axis is not altered by the changes in retinoic acid signaling.
In situ hybridization of the 10-somite stage embryos. (A, B) In situ hybridization against aplnra. (A) DMSO-treated embryos. (B) DEAB-treated embryos. (C, D) In situ hybridization against aplnrb. (C) DMSO-treated embryos. (D) DEAB-treated embryos. (E, F) In situ hybridization against apela. (E) DMSO-treated embryos. (F) DEAB-treated embryos.
Figure 3 with 1 supplement
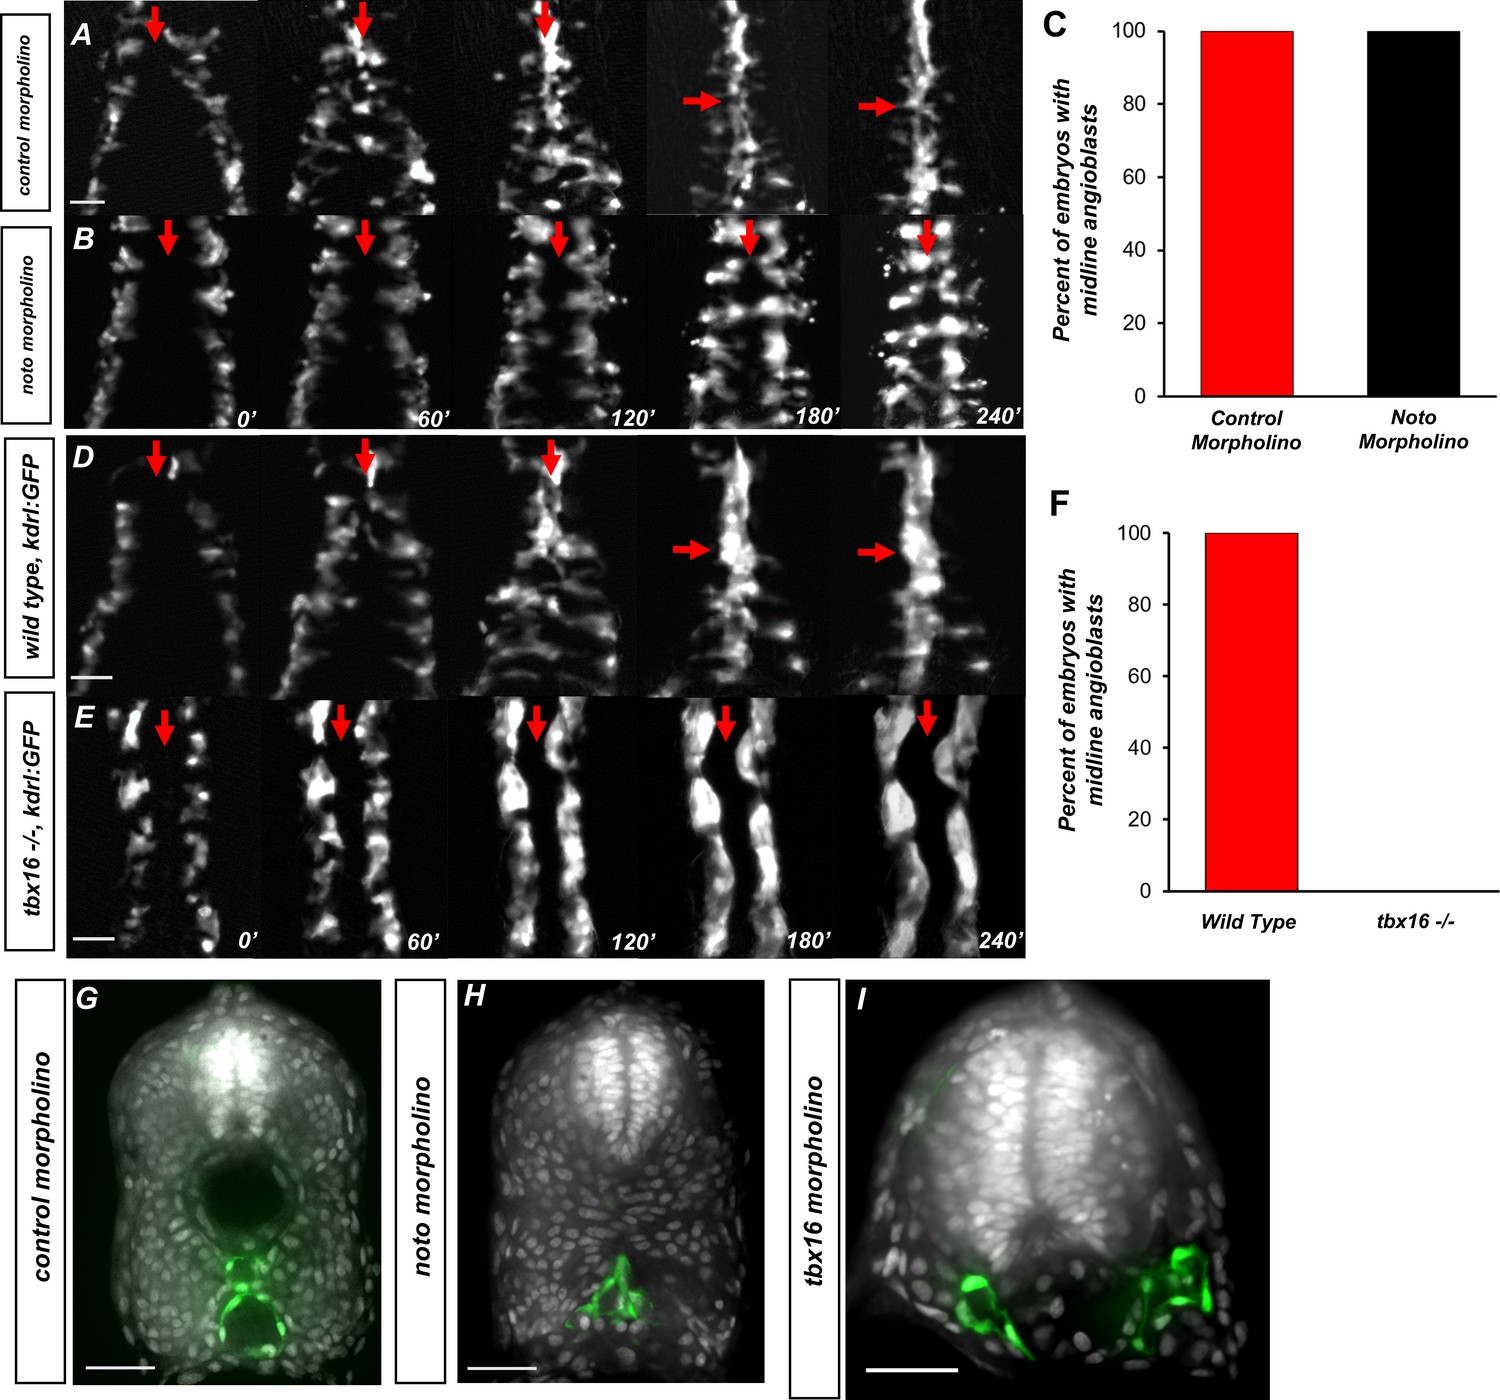
The somitic mesoderm, not the notochord, is required for midline convergence of angioblasts.
(A) Time-lapse imaging of tg(kdrl:eGFP) embryos injected with control morpholino over a 240′ period. (B) tg(kdrl:eGFP) embryos injected with noto morpholino over a 240′ period. Red arrows indicate the midline. (C) Graph of embryos with midline angioblasts in noto and control morphants after 240′. N = 15 for both conditions (D) Time-lapse imaging of wild-type, tg(kdrl:eGFP) embryos over a 240′ period. (E) Time-lapse imaging of tbx16-/-, tg(kdrl:eGFP) embryos over a 240′ period. Red arrows indicate the midline. (F) Graph of embryos with midline angioblasts in wild-type and tbx16-/- after 240′. N = 18 for both conditions. (G) Section of wild-type, tg(kdrl:eGFP) embryos over a 240′ period. (H) Section of 24 hpf tg(kdrl:eGFP) embryos injected noto morpholino and stained with DAPI. (I) Section of 24 hpf tg(kdrl:eGFP) embryos injected tbx16 morpholino. Blood vessels are labeled in green and nuclei labeled in gray. Scale bars, 50 µm.
Figure 3—figure supplement 1
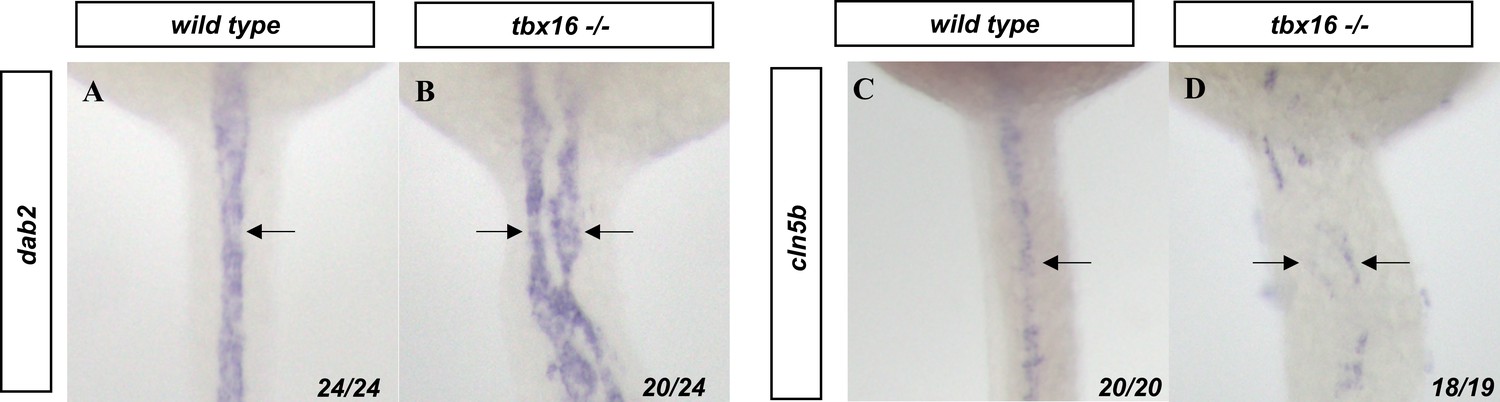
Bifurcated angioblasts in tbx16 mutants preferentially join the venous population.
(A, B) dab2 and (C, D) cldn5b in situ hybridization labels the veins and arteries, respectively (black arrows) in (A, C) wild-type and (B, D) tbx16-/- embryos. Embryos are shown from a dorsal view with anterior to the top.
Figure 4
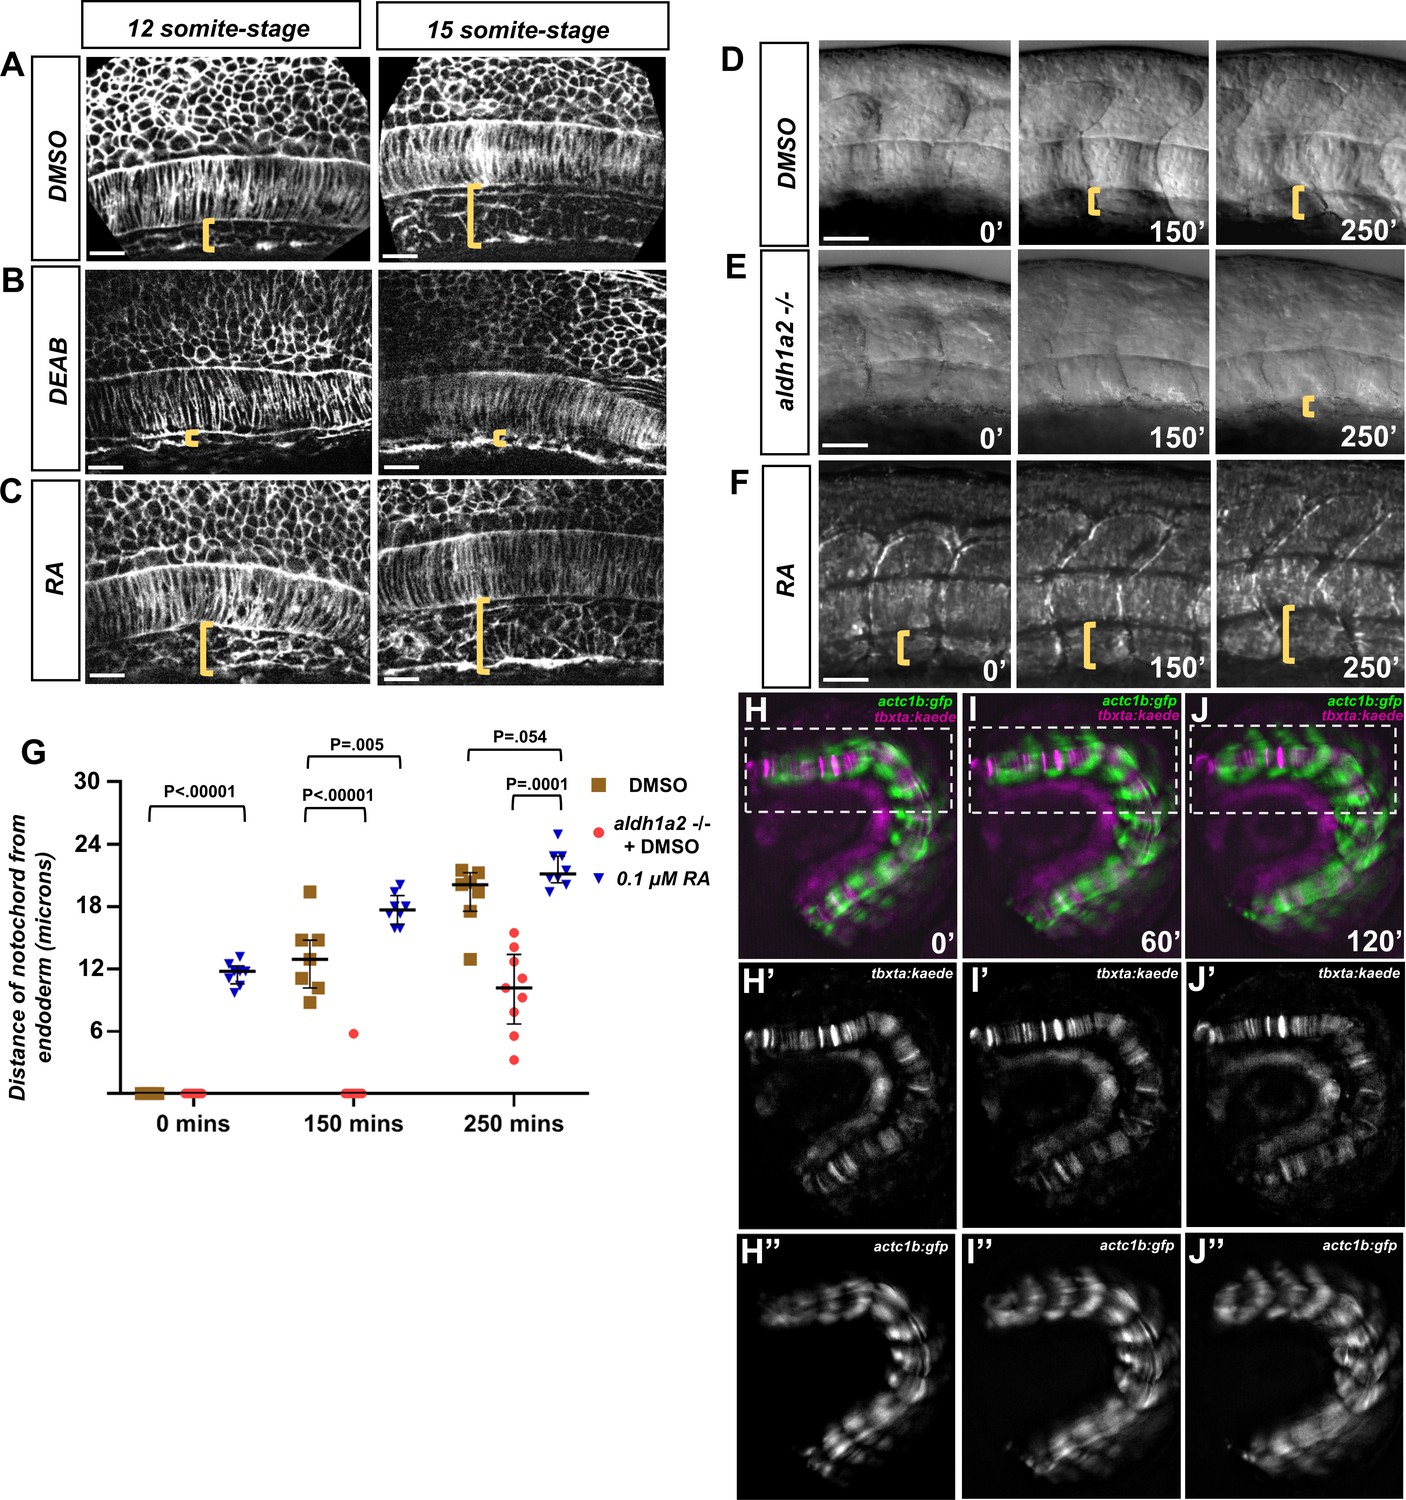
Retinoic acid (RA) signaling promotes dorsal translocation of the notochord.
(A–C) Fluorescent images of fixed (A) DMSO-treated, (B), DEAD-treated, and (C) RA-treated tg(ubb:lck-mNG) embryo trunks at the 12- and 15-somite stage. Yellow brackets indicate the distance between the notochord and underlying yolk cell. (D–F) DIC time-lapse images of the notochord and zebrafish trunk. Focal planes of the notochord and somites were overlaid to show the relative location to one another. Yellow brackets indicate the distance of the ventral notochord to the ventral-most portion of the embryo in (D) DMSO-treated embryos, (E) aldh1a2-/- embryos treated with DMSO, or (F) 0.1 μM RA-treated embryos. (G) Quantification of dorsal translocation of notochord from the ventral tissue. Black lines indicate the median and interquartile range. Wild-type are indicated by brown squares, while aldh1a2-/- and 0.1 μM RA embryos are shown by red circles and blue triangles, respectively. At t = 0, DMSO vs. RA is p<0.00001. At 150′, DMSO is p<0.00001 and p=0.005 vs. aldh1a2-/- and RA treatment, respectively. At 250′, DMSO is p=0.0001 and 0.054 vs. aldh1a2-/- and RA treatment, respectively. (H–J) Time-lapse image of a trunk explant from tg(actc1b:gfp), tg(tbxta:kaede) embryo at (H) 0′, (I) 60′, and (J) 120′. (H’–J’) Time-lapse image of explant showing tg(tbxta:kaede) only. (H’’–J’’) Time-lapse image of explant showing tg(actc1b:gfp) only. Time-lapse shows the notochord adjacent the yolk at time 0′, but moves dorsally from the yolk at time 120′. Scale bars, 25 µm.
-
Figure 4—source data 1
Distances of notochord to endoderm after RA manipulation.
- https://cdn.elifesciences.org/articles/74821/elife-74821-fig4-data1-v2.csv
Figure 5 with 1 supplement

Retinoic acid (RA) mediates a notochord-endoderm separation required for terminal angioblast migration.
(A–I) Embryos generated by crossing tg(HS:lifeact) to tg(kdrl:eGFP) to label both actin and angioblasts. Yellow arrowheads indicate the midline while white arrows indicate angioblasts. A magnified image includes a white dashed line to indicate notochord-endoderm separation. (A–C) DMSO-treated embryos sectioned at the fifth somite during the (A) 12-somite stage (n = 8), (B) 15-somite stage (N = 8), and (C) 18-somite stage (N = 6). (D, E) 0.1 μM RA-treated embryos sectioned at the fifth somite during the (D) 12-somite stage (N = 8) and (E) 15-somite stage (n = 8). (F–I) 20 μM DEAB-treated embryos sectioned at the fifth somite during the (F) 12-somite stage (N = 7), (G) 15-somite stage (N = 8), (H) 18-somite stage (N = 6), and (I) 21-somite stage (N = 6). (J–L) 15-somite stage embryos generated by crossing tg(HS:lifeact) to tg(Kdrl:eGFP). White dashed lines indicate outline of somites while yellow brackets indicate distance of notochord to ventral endoderm. (J) Schematic showing the sectioned region for experiments in (K–O). Red line indicates sectioning at 5th somite, and the blue line indicates sectioning at the 12th somite. (K) A DMSO embryo sectioned at the 12th somite. Note the lack of midline angioblasts and small distance between the notochord and the ventral endoderm. (L) A DMSO-treated embryo sectioned at the fifth somite. Note the angioblasts at the midline and larger distance from the notochord to the ventral endoderm. (M) A DEAB embryo sectioned at the fifth somite. Note the lack of midline angioblasts and small distance between the notochord and the ventral endoderm. (N) A two-variable graph showing the percentage of angioblast fluorescence at the midline compared to the distance between the notochord and the ventral endoderm. Blue dots indicate DMSO-treated, 15-somite stage embryos sectioned at the 5th somite, and red squares are the same embryos sectioned at the 12th somite (N = 8). (O) A two-variable graph showing the percentage of angioblast fluorescence at the midline compared to the distance between the notochord and the ventral endoderm. Blue dots indicate DEAB-treated, 15-somite stage embryos sectioned at the 5th somite, and red squares are the same embryos sectioned at the 12th somite (N = 8). Scale bars, 50 µm.
-
Figure 5—source data 1
Fluorescence percentage at midline for DMSO treated embryos at 5th and 12th somite.
- https://cdn.elifesciences.org/articles/74821/elife-74821-fig5-data1-v2.csv
-
Figure 5—source data 2
Fluorescence percentage at midline for DEAB treated embryos at 5th and 12th somite.
- https://cdn.elifesciences.org/articles/74821/elife-74821-fig5-data2-v2.csv
Figure 5—figure supplement 1
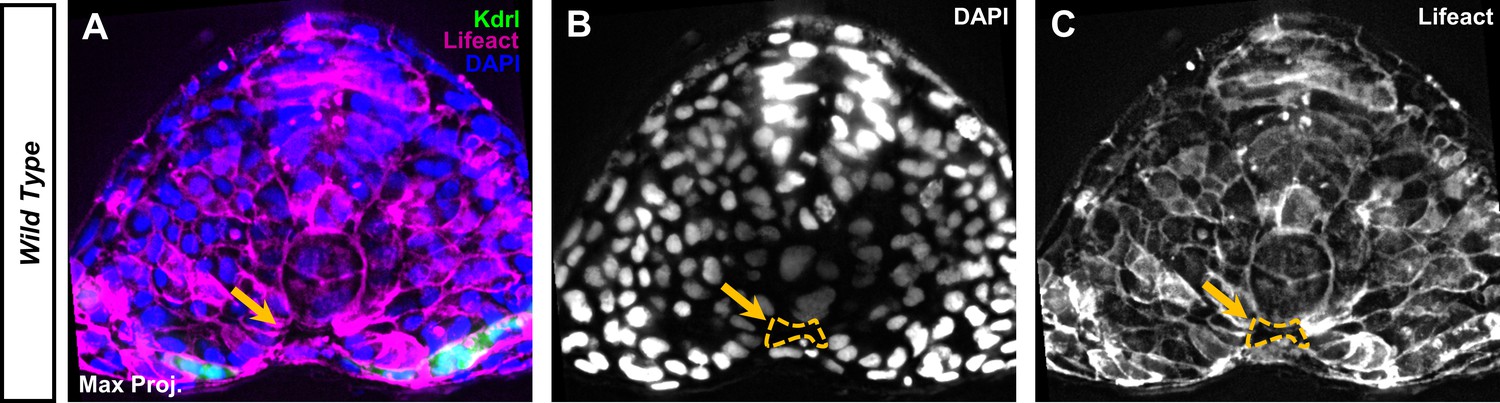
The ventral midline cavity is acellular.
Maximum projections of a 15 µm image stack from a section at the fifth somite of a 12-somite stage embryo. The transgenic tg(kdrl:eGFP), tg(HS:lifeact) embryos were labeled with DAPI to stain nuclei. (A) Embryo section shows a ventral midline cavity (VMC) with no nuclei or Lifeact present (yellow arrow). (B) DAPI fluorescence with a label for VMC location labeled (yellow dashed lines). (C) Lifeact-mScarlet fluorescence with a label for the VMC location (yellow dashed lines).
Figure 6 with 1 supplement
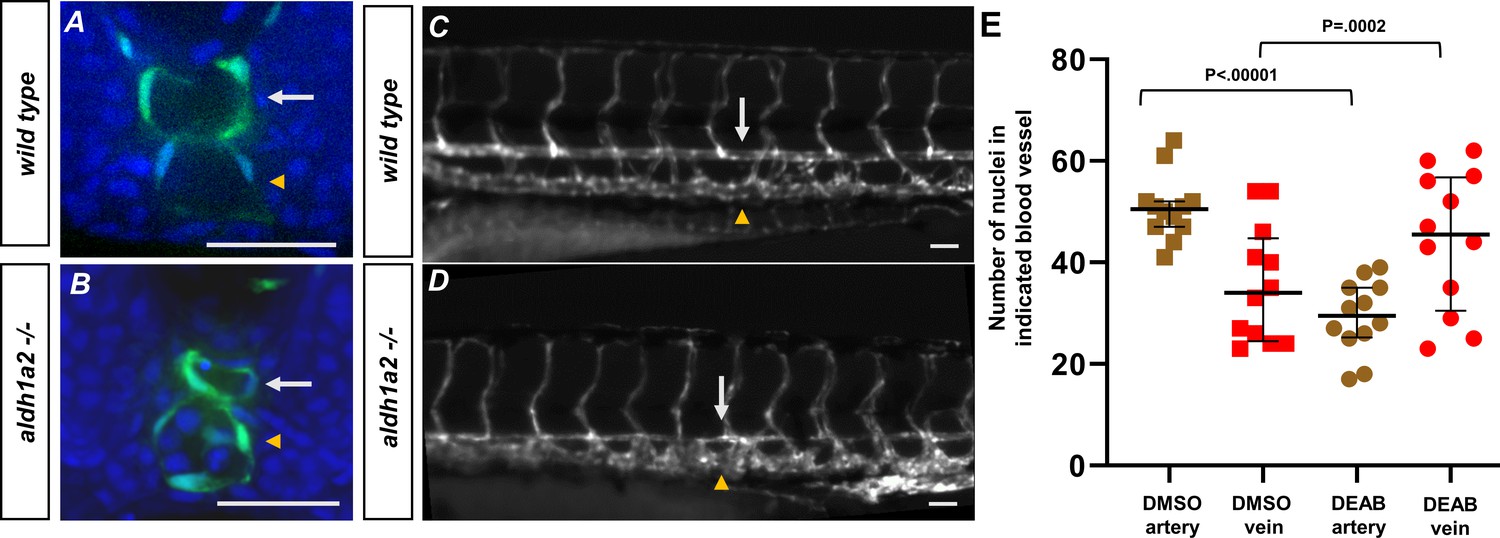
Retinoic acid loss contributes to changes in the definitive vasculature, resulting in large veins and small arteries.
(A, B) A 24 hpf tg(kdrl:eGFP) embryo labeled with DAPI. (A) Wild-type embryos show lumenized blood vessels and normal-sized dorsal aorta. (B) Labeled aldh1a2-/-, tg(kdrl:eGFP) sibling shows small lumenized dorsal aorta with large posterior cardinal vein. (C) A 5 dpf tg(kdrl:eGFP) embryo. White arrows indicate the dorsal aorta, and yellow arrowheads indicate the cardinal vein. (D) A 5 dpf tg(kdrl:eGFP), aldh1a2-/- embryo. White arrows indicate reduced size of dorsal aorta. (E) Quantification of DMSO (n = 12) or 20 μM DEAB (n = 12)-treated tg(kdrl:nls-eGFP) embryos. Nuclei were counted in each structure over a 225 μM long transverse section of the zebrafish trunk. Two-tailed p-values for the unpaired t-test of wild-type vs. 20 μM DEAB-treated embryos are <0.00001 and 0.0002 for arteries and veins, respectively. Scale bars, 50 µm.
-
Figure 6—source data 1
Nuclei count in dorsal aorta and cardinal vein.
- https://cdn.elifesciences.org/articles/74821/elife-74821-fig6-data1-v2.csv
Figure 6—figure supplement 1
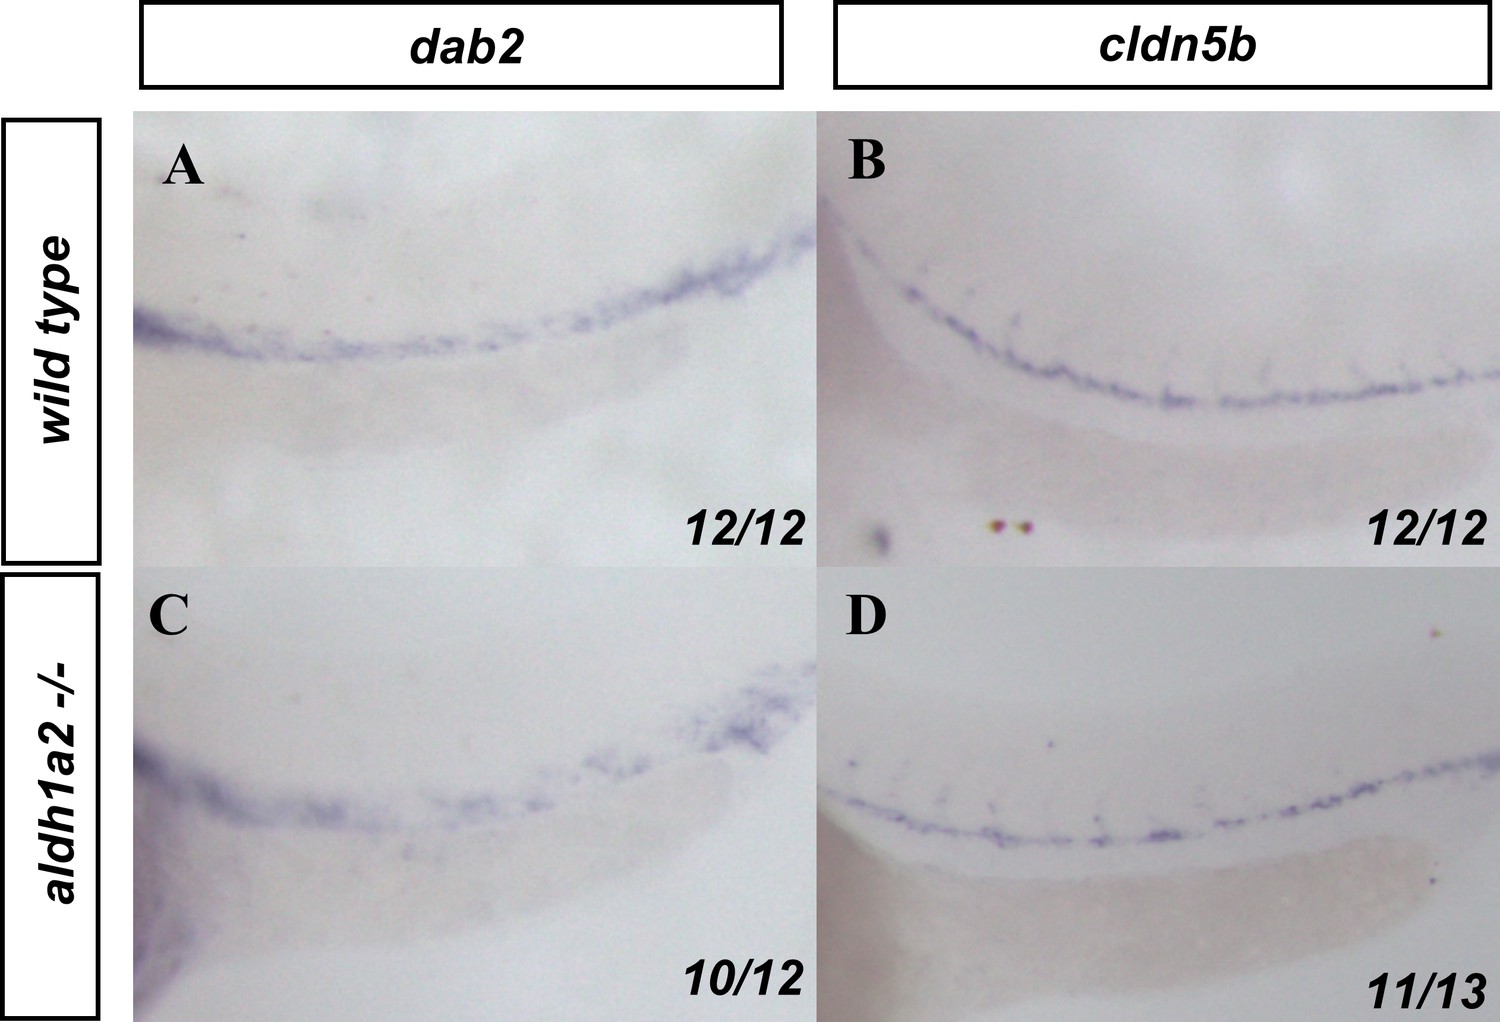
Effects of retinoic acid (RA) depletion on arterial and venous markers.
(A, C) dab2 and (B, D) cldn5b in situ hybridization labels the veins and arteries, respectively, in (A, B) wild-type or (C, D) aldh1a2-/- embryos. Embryos are shown from a lateral view with anterior to the left.
Figure 7 with 2 supplements

Retinoic acid controls intrasomitic cellular movements and somite shape changes that contribute to angioblast convergence to the midline.
(A) Image and schematic of newly born 12th somite using tg(HS:lifeact), tg(kdrl:eGFP) embryo as reference. Dashed lines indicate the somite and notochord. (B) Schematic of more mature fifth somite (at the 12-somite stage) of tg(HS:lifeact), tg(kdrl:eGFP) embryo as reference. Dashed lines indicate somite and notochord. (C) Transplant of rhodamine dextran-labeled wild-type cells into tg(ubb:lck-mNG). Dashed lines indicate somite shape. (D) Transplant of tg(HS:dnRAR) cells into tg(ubb:lck-mNG). Dashed lines indicate somite shape. Note the immature shape of the somite containing transplanted cells. (E) Overlapping somite shapes of either WT→WT, tg(HS:dnRAR)→WT, or the contralateral somite tg(HS:dnRAR)→WT. (F, G) Time-lapse images of transplanted rhodamine dextran-labeled cells in DMSO and DEAB embryos at 12-somite stage. (F) DMSO-treated embryos over 180′. White arrows indicate labeled cells. (G) 20 μM DEAB-treated embryos over 180′. Scale bars, 50 μm. Retinoic acid-depleted embryos show little cellular movement during somite development. (H) Quantification of nuclei displacement in the second somite of DMSO and DEAB embryos over a 4 hr time period. Displacement is defined as the distance between the beginning location and end location of the nuclei within the somite 2. (I) Quantification of speed in somite 2, defined as average units over 4 hr in 10 min increments. (J) Sample of tracks from DMSO-treated tg(hsp70l:CAAX-mCherry-2A-NLS-KikGR) embryos. (K) Sample tracks of DEAB-treated tg(hsp70l:CAAX-mCherry-2A-NLS-KikGR) embryos. Tracks sort from red to blue, with red being the highest displacement. Scale bars, 20 µm (L) Diagram of ventral somite expansion and notochord to endoderm separation. Ventral somite expansion is calculated by ventral somite length (black bracket) – the notochord diameter (yellow bracket). Notochord/endoderm separation is shown in the blue bracket. (M) Quantification of the ventral expansion of the somite over notochord/endoderm separation in wild-type embryos. The linear regression indicated by the black line, where slope = 0.002, shows ventral somite expansion correlates with notochord/endoderm separation. (N) A two-variable graph showing the percentage of angioblast fluorescence at the midline compared to the distance of ventral somite expansion beneath the notochord. Blue dots indicate DMSO-treated, 15-somite stage embryos sectioned at the 5th somite, and red squares are the same embryos sectioned at the 12th somite (N = 8). Scale bars, 50 µm. (O) Live section of mCherry-CAAX-injected tg(kdrl:eGFP) embryos over 120′. Yellow arrowheads indicate the midline while white arrows indicate angioblasts. (P) Same live section as in (N), except at 240′ focused at the midline. Note the separation of the hypochord and endoderm prior to midline fusion of angioblasts. Scale bars, 50 µm.
-
Figure 7—source data 1
Displacement of nuclei within the somite.
- https://cdn.elifesciences.org/articles/74821/elife-74821-fig7-data1-v2.csv
-
Figure 7—source data 2
Speed of nuclei within the somite.
- https://cdn.elifesciences.org/articles/74821/elife-74821-fig7-data2-v2.csv
-
Figure 7—source data 3
The ratio of ventral expansion of the somite over NES.
- https://cdn.elifesciences.org/articles/74821/elife-74821-fig7-data3-v2.csv
-
Figure 7—source data 4
The percentage of midline fluorescence in relation to ventral somite expansion.The percentage of midline fluorescence in relation to ventral somite expansion.The percentage of midline fluorescence in relation to ventral somite expansion.
- https://cdn.elifesciences.org/articles/74821/elife-74821-fig7-data4-v2.csv
Figure 7—figure supplement 1
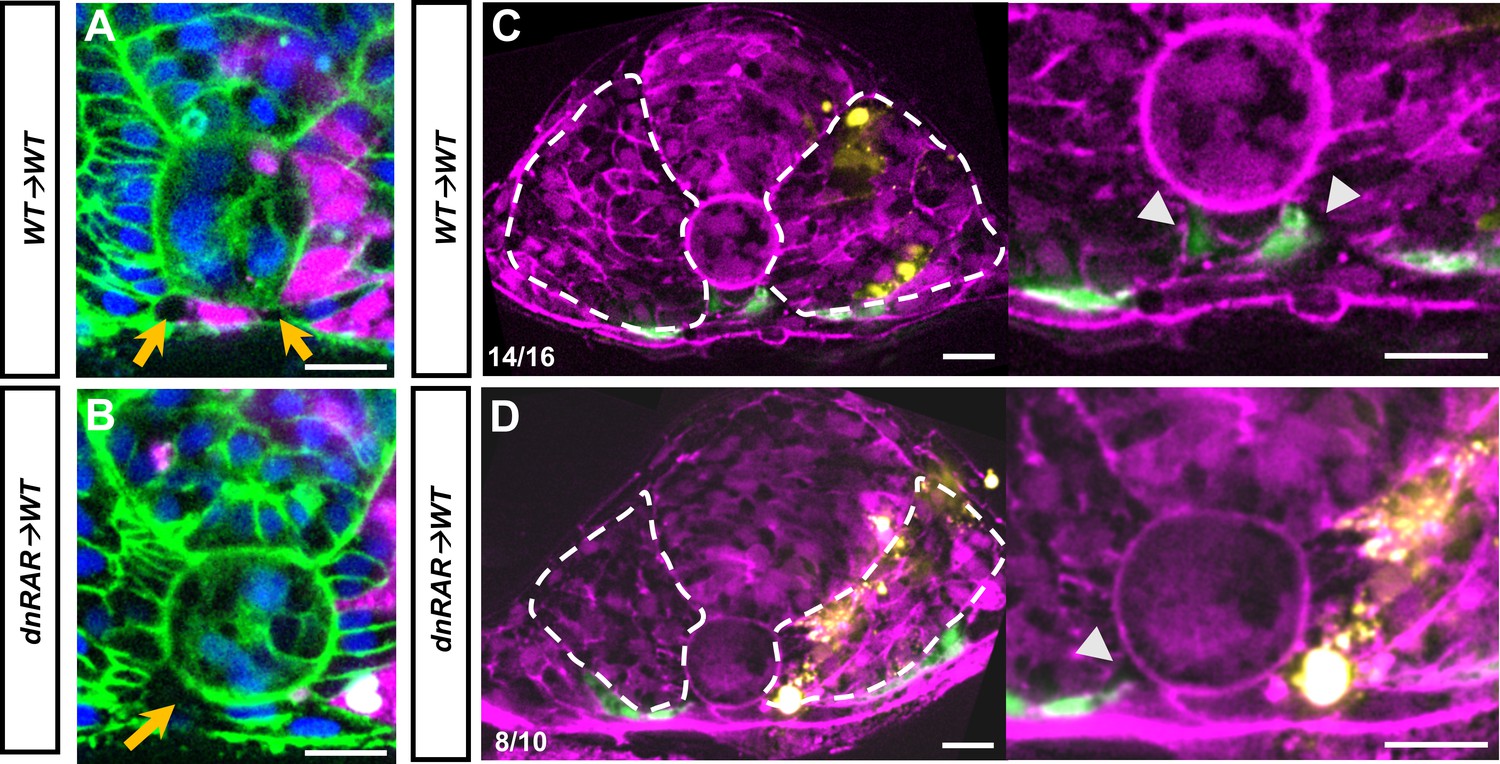
Loss of retinoic acid (RA) function in chimeric embryos shows regional defects in notochord-endoderm separation (NES) and angioblast migration.
(A–D) Sections of chimeric embryos at roughly the fifth somite. (A) Transplant of rhodamine dextran-labeled wild-type cells into tg(ubb:lck-mNG) host embryo at the 12-somite stage. (B) Transplant of tg(dnRAR) cells into tg(ubb:lck-mNG) host embryo at the 12-somite stage. Yellow arrows indicate emerging separation of the notochord and endoderm. Note that for somites with tg(dnRAR) cells only the contralateral side undergoes separation. (C) Transplant of Alexa Fluor 647-labeled wild-type cells into a tg(HS:lifeact), tg(kdrl:eGFP) host embryo at the 14-somite stage. White arrowheads indicate areas of NES and angioblast arrival to the midline. (C) Transplant of tg(dnRAR) cells into tg(HS:lifeact), tg(kdrl:eGFP) embryo at the 14-somite stage. White arrowheads indicate areas of NES and angioblast arrival to the midline. Note the increased progression of the contralateral side compared to the side containing tg(dnRAR) cells. Scale bars, 50 µm.
Figure 7—figure supplement 2
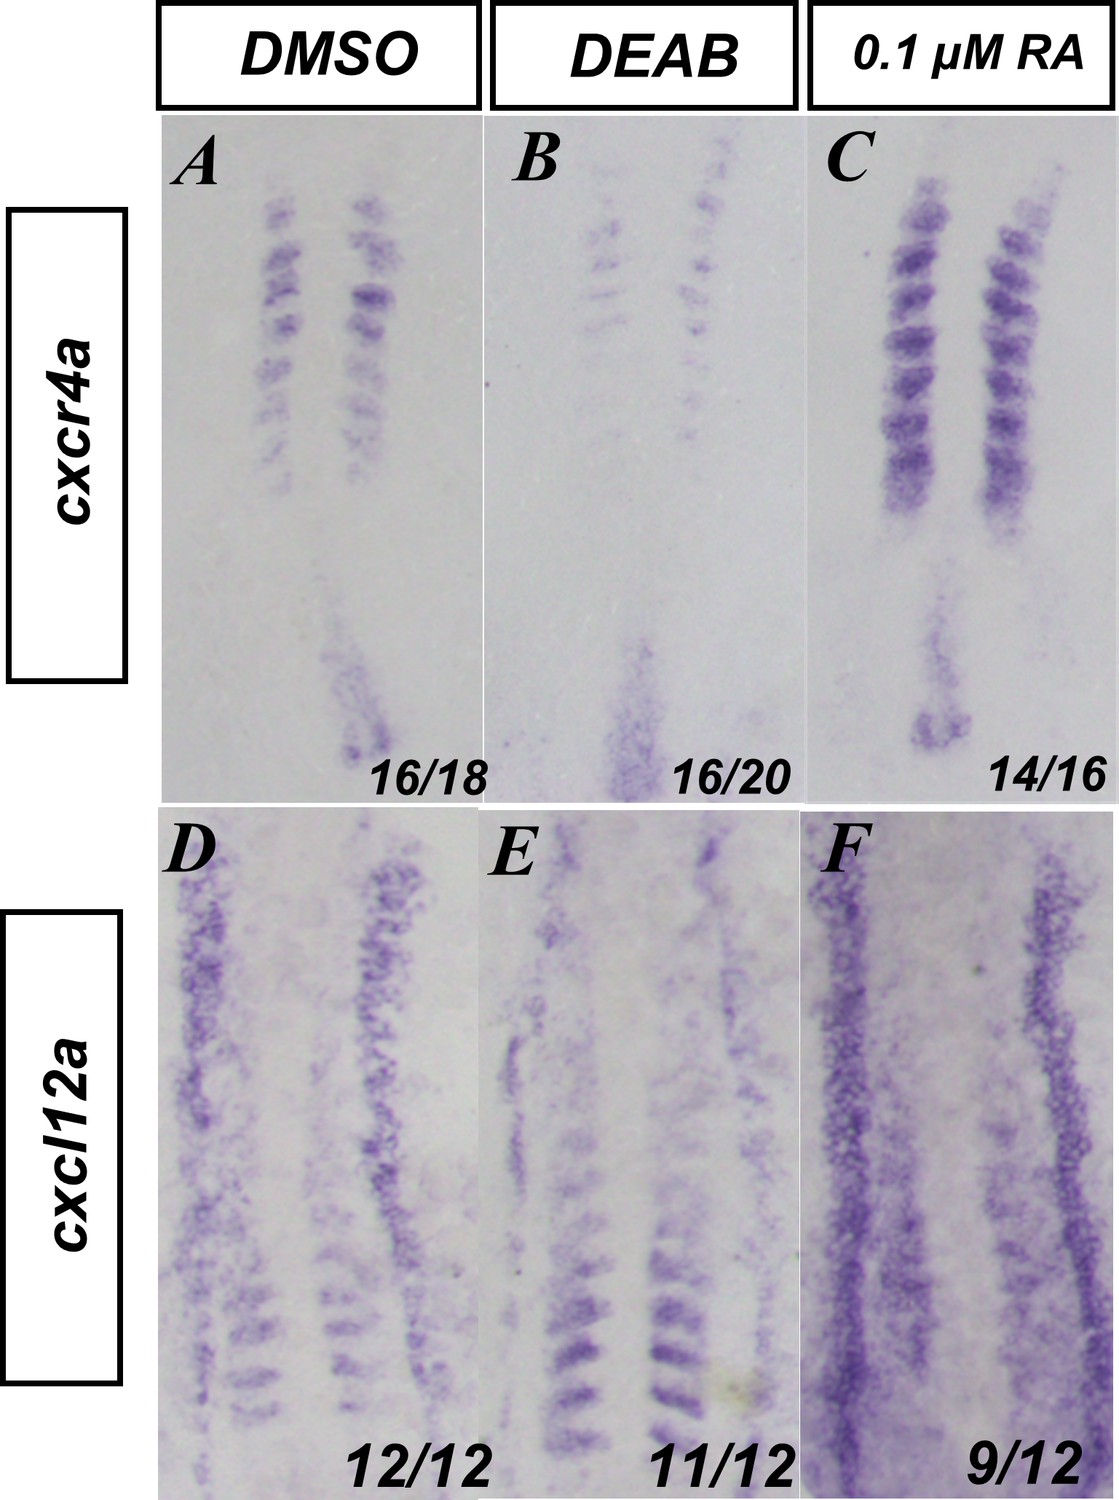
Retinoic acid (RA) signaling affects the expression of genes associated with somitic movements.
(A–C) In situ hybridization for cxcr4a and (D–F) cxcl12a in (A, D) DMSO, (B, E) 20 µM DEAB, or (C, F) 0.1 µM RA-treated embryos. Embryos are shown from a dorsal view with anterior to the top.
Videos
Video 1
Time-lapse fluorescent imaging of tg(kdrl:eGFP) embryo at the 10-somite stage.tg(kdrl:eGFP) marks angioblasts as they migrate to the midline.
Angioblasts display the anterior posterior processivity while coalescing at the midline. Frame rate = 1 image/5 min. Run time = 235 min.
Video 2
Time-lapse fluorescent imaging of tg(kdrl:eGFP), aldh1a2-/- embryo at the 10-somite stage.tg(kdrl:eGFP) marks angioblasts as they migrate to the midline.
Angioblasts lose anterior to posterior processivity and show disrupted migration. Frame rate = 1 image/5 min. Run time = 235 min.
Video 3
Time-lapse fluorescent imaging of a 10-somite stage tg(kdrl:eGFP) embryo with addition of 0.1 μM retinoic acid (RA) at the tailbud stage.
tg(kdrl:eGFP) marks angioblasts as they migrate to the midline. Angioblasts accelerate their processivity toward the midline. Frame rate = 1 image/5 min. Run time = 235 min.
Video 4
Time-lapse fluorescent imaging of HS:id3, HS;dnRAR cells in a tg(kdrl:eGFP) host.
Cells expressing HS:id3, HS;dnRAR migrate to the midline along with angioblasts in a tg(kdrl:eGFP) host. Cells with dnRAR migrate faithfully with angioblasts. Frame rate = 1 image/5 min. Run time = 180 min.
Video 5
Time-lapse fluorescent imaging of tg(tbxta:kaedae), tg(actc1b:gfp) trunk explant.
Trunk explant shows notochord displacement away from ventral-most portion of somites. Frame rate = 1 image/15 min. Run time = 285 min.
Video 6
Time-lapse confocal fluorescent imaging of an HS:mCherry-CAAX-p2a-NLS-kikume embryo in DMSO treatment.
HS:mCherry-CAAX-p2a-NLS-kikume marks nuclei within the somite. Sample tracks ranging from red (most displacement) to blue (least displacement) show broad movement within the somite. Frame rate = 1 image/5 min. Run time = 240 min.
Video 7
Time-lapse confocal fluorescent imaging of an HS:mCherry-CAAX-p2a-NLS-kikume embryo in DEAB treatment.
HS:mCherry-CAAX-p2a-NLS-kikume marks nuclei within the somite. Sample tracks ranging from red (most displacement) to blue (least displacement) show little directional movement in 20 μM DEAB treatment conditions. Frame rate = 1 image/5 min. Run time = 240 min.
Video 8
Time-lapse fluorescent video of mCherry-CAAX mRNA-injected tg(kdrl:eGFP) explant at the 10-somite stage.
tg(kdrl:eGFP) marks angioblasts as they migrate to the midline, and mCherry-CAAX marks the cell surfaces. A trunk explant, imaged around the fifth somite, shows normal migration of the angioblasts to the midline. Frame rate = 1 image/5 min. Run time = 280 min.
Video 9
Time-lapse fluorescent video of mCherry-CAAX mRNA-injected tg(kdrl:eGFP) explant at the 10-somite stage, treated with 20 μM DEAB.
tg(kdrl:eGFP) marks angioblasts as they migrate to the midline. The trunk explant shows angioblast migration defects seen in fixed DEAB sections. Frame rate = 1 image/5 min. Run time = 175 min.
Tables
Key resources table
| Reagent type (species) or resource | Designation | Source or reference | Identifiers | Additional information |
|---|---|---|---|---|
| Antibody | Anti-Etv2 (rabbit polyclonal) | Kerafast | Cat# ES1004; RRID:AB_2904554 | IH (1:500) |
| Antibody | Anti-GFP (mouse monoclonal) | Thermo Fisher | Cat# A11120; RRID:AB_221568 | IH (1:500) |
| Antibody | Secondary antibody, Alexa Fluor 488 (goat polyclonal) | Thermo Fisher | Cat# A11008; RRID:AB_143165 | IH (1:1000) |
| Antibody | Secondary antibody, Alexa Fluor 568 (goat polyclonal) | Thermo Fisher | Cat# A11004; RRID:AB_2534072 | IH (1:1000) |
| Antibody | Anti-Digoxigenin-AP, Fab fragments (sheep polyclonal) | Roche | Cat# 11093274910; RRID: AB_514497 | ISH (1:5000) |
| Chemical compound, drug | 4-Nitro blue tetrazolium chloride, solution | Roche | Cat# 11383213001 | |
| Chemical compound, drug | 5-Bromo-4-chloro-3-indolyl phosphate p-toluidine | Roche | Cat# 11383221001 | |
| Chemical compound, drug | DIG RNA Labeling Mix | Roche | Cat# 11277073910 | |
| Peptide, recombinant protein | SP6 RNA polymerase | NEB | Cat# M0207S | |
| Peptide, recombinant protein | T7 RNA polymerase | NEB | Cat# M0251S | |
| Chemical compound, drug | Tricaine-S (MS-222) | Pentair | Cat# TRS1 | |
| Chemical compound, drug | DAPI | Sigma | Cat# D9542 | |
| Chemical compound, drug | 4-Diethylamino benzaldehyde (DEAB) | Sigma | Cat# D86256 | |
| Chemical compound, drug | BMS453 | Cayman Chemical | CAS# 166977-43-1 | |
| Chemical compound, drug | All-trans retinoic acid | Sigma | Cat# R2625 | |
| Other | Tetramethylrhodamine dextran, 10,000 MW, lysine fixable | Invitrogen | Cat# D1817 | |
| Other | Alexa Fluor 647 Dextran, 10,000 MW, Anionic, Fixable | Invitrogen | Cat# D22914 | |
| Other | Modified Barth’s Saline (1×), liquid, without Ficoll 400 | Sigma | Cat# 32160801 | |
| Strain, strain background (Danio rerio) | Wild-type Tupfel long-fin/AB | N/A | N/A | Wild-type progeny of Tupfel long-fin and AB |
| Strain, strain background (D. rerio) | aldh1a2i26 | Begemann et al., 2001 | ZFIN ID: ZDB-FISH-150901-19358; RRID:ZFIN_ZDB-ALT-000412-8 | |
| Strain, strain background (D. rerio) | aldh1a2i26, tg(kdrl:eGFP) s843 | Begemann et al., 2001; Jin et al., 2005 | RRID:ZFIN_ZDB-ALT-000412-8; RRID: ZFIN_ZDB-GENO-170216-13 | |
| Strain, strain background (D. rerio) | tg(hsp70l:id3-2A-NLS-KikGR) sbu105 | Row et al., 2018 | ZFIN ID: ZDB-ALT-190306-81; RRID:ZFIN_ZDB-ALT-190306-81 | |
| Strain, strain background (D. rerio) | tg(hsp70l:eGFP-dnHsa.RARA) ci1008 | Brilli Skvarca et al., 2019 | ZFIN ID: ZDB-TGCONSTRCT-190925-6; RRID:ZFIN_ZDB-ALT-190925-15 | |
| Strain, strain background (D. rerio) | tg(kdrl:NLS-eGFP)ubs1 | Blum et al., 2008 | ZFIN ID: ZDB-TGCONSTRCT-081105-1; RRID:ZFIN_ZDB-GENO-081105-1 | |
| Strain, strain background (D. rerio) | tg(kdrl:eGFP) s843 | Jin et al., 2005 | RRID:ZFIN_ZDB-GENO-170216-13 | |
| Strain, strain background (D. rerio) | tg(hsp70l:CAAX-mCherry-2A-NLS-KikGR) sbu104 | Goto et al., 2017 | ZFIN ID: ZDB-ALT-170829-4;RRID:ZFIN_ ZDB-ALT-170829-4 | |
| Strain, strain background (D. rerio) | tg(β-actin:GDBD-RLBD) ci1001, Tg(5XUAS:eGFP)nkwasgfp1a | Mandal et al., 2013 | ZFIN ID: ZDB-FISH-150901-11429; RRID:ZFIN_ZDB-GENO-131107-12 | |
| Strain, strain background (D. rerio) | tbx16b104, tg(kdrl:eGFP) s843 | Kimmel et al., 1989; Jin et al., 2005 | RRID:ZFIN_ZDB-ALT-980224-16; RRID: ZFIN_ZDB-GENO-170216-13 | |
| Strain, strain background (D. rerio) | tg(actc1b:gfp) zf13tg | ichi et al., 1997 | ZFIN ID: ZDBTGCONSTRCT-070117-83; RRID:ZFIN_ZDB-GENO-070830-2 | |
| Strain, strain background (D. rerio) | tg(tbxta:kaedae) sbu102 | Row et al., 2016 | ZFIN ID: ZDB-TGCONSTRCT-160321-5; RRID:ZFIN_ZDB-TGCONSTRCT-160321-5 | |
| Strain, strain background (D. rerio) | tg(hsp70l:lifeact-mScarlet) sbu110 | This paper | N/A | Transgenic zebrafish line with heat shock-inducible Lifeact |
| Sequence-based reagent | Morpholino: MO-Noto | Ouyang et al., 2009 | ZFIN ID: ZDB-MRPHLNO-100514-1 | GGGAATCTGCATGGCGTCTGTTTAG |
| Sequence-based reagent | Morpholino: MO1-tbx16 | Row et al., 2011 | ZFIN ID: ZDB-MRPHLNO-051107-1 | AGCCTGCATTATTTAGCCTTCTCTA |
| Sequence-based reagent | Morpholino: MO2-tbx16: | Row et al., 2011 | ZFIN ID: ZDB-MRPHLNO-051107-2 | GATGTCCTCTAAAAGAAAATGTCAG |
| Sequence-based reagent | Riboprobe: etv2 | Sumanas et al., 2005 | N/A | Anti-sense riboprobe synthesized using DIG-labeled nucleotides |
| Sequence-based reagent | Riboprobe: cldn5b | This paper | N/A | Anti-sense riboprobe synthesized using DIG-labeled nucleotides |
| Sequence-based reagent | Riboprobe: cxcr4a | This paper | N/A | Anti-sense riboprobe synthesized using DIG-labeled nucleotides |
| Sequence-based reagent | Riboprobe: cxcl12a | This paper | N/A | Anti-sense riboprobe synthesized using DIG-labeled nucleotides |
| Sequence-based reagent | Riboprobe: dab2 | This paper | N/A | Anti-sense riboprobe synthesized using DIG-labeled nucleotides |
| Sequence-based reagent | Riboprobe: apela | This paper | N/A | Anti-sense riboprobe synthesized using DIG-labeled nucleotides |
| Sequence-based reagent | Riboprobe: aplnra | This paper | N/A | Anti-sense riboprobe synthesized using DIG-labeled nucleotides |
| Sequence-based reagent | Riboprobe: aplnrb | This paper | N/A | Anti-sense riboprobe synthesized using DIG-labeled nucleotides |
| Sequence-based reagent | Primer: cldn5b forward | This paper | N/A | GCAGGCTTGTTTGTTCTGATTC |
| Sequence-based reagent | Primer: cldn5b reverse | This paper | N/A | CACAAACAAGTGGGTCGCTG |
| Sequence-based reagent | Primer: apela forward | This paper | N/A | CCATCCCTCAGAGGACAGAG |
| Sequence-based reagent | Primer: apela reverse | This paper | N/A | CATGTTTGGCAGCAGTAGGA |
| Sequence-based reagent | Primer: aplnra forward | This paper | N/A | ATGGAGCCAACGCCGGAAT |
| Sequence-based reagent | Primer: aplnra reverse | This paper | N/A | TCACACTTTGGTGGCCAGC |
| Sequence-based reagent | Primer: aplnrb forward | This paper | N/A | ATGAATGCCATGGACAACAT |
| Sequence-based reagent | Primer: aplnrb reverse | This paper | N/A | TCACACCTTCGTAGCCAGC |
| Sequence-based reagent | Primer: cxcr4a forward | This paper | N/A | CTGAAGGAGCTGGAGAAGTC |
| Sequence-based reagent | Primer: cxcr4a reverse | This paper | N/A | GCATGTTCATAGTCCAAGGTG |
| Sequence-based reagent | Primer: cxcr12a forward | This paper | N/A | GCGGATCTCTTCTTCACACTGC |
| Sequence-based reagent | Primer: cxcr12a reverse | This paper | N/A | TTACACACGCTCTGATCGGTC |
| Sequence-based reagent | Primer: dab2 forward | This paper | N/A | CTCCTTCATTGCTCGTGATGTC |
| Sequence-based reagent | Primer: dab2 reverse | This paper | N/A | GCCCTGGTTCAGGTTTCTGG |
| Sequence-based reagent | Primer: lifeact-mScarlet forward | This paper | N/A | CAAGCTACTTGTTCTTTTTGCAGGA TCCATGGGCGTGGCCGACTTG |
| Sequence-based reagent | Primer: lifeact-mScarlet reverse | This paper | N/A | TTCGTGGCTCCAGAGAATCGATTC ACTTGTACAGCTCGTCCATGC |
| Recombinant DNA reagent | Plasmid: PCRII-cldn5b | This paper | N/A | Recombinant vector used for riboprobe synthesis |
| Recombinant DNA reagent | Plasmid: PCRII-apela | This paper | N/A | Recombinant vector used for riboprobe synthesis |
| Recombinant DNA reagent | Plasmid: PCRII-aplnra | This paper | N/A | Recombinant vector used for riboprobe synthesis |
| Recombinant DNA reagent | Plasmid: PCRII-aplnrb | This paper | N/A | Recombinant vector used for riboprobe synthesis |
| Recombinant DNA reagent | Plasmid: PCRII-cxcr4a | This paper | N/A | Recombinant vector used for riboprobe synthesis |
| Recombinant DNA reagent | Plasmid: PCRII-cxcr12a | This paper | N/A | Recombinant vector used for riboprobe synthesis |
| Recombinant DNA reagent | Plasmid: PCRII-dab2 | This paper | N/A | Recombinant vector used for riboprobe synthesis |
| Recombinant DNA reagent | Plasmid: hsp70l:lifeact-mscarlet | This paper | pNJP002 | Plasmid used to generate tg(hsp70l:lifeact-mscarlet) |
| Software, algorithm | ImageJ/Fiji | NIH-public domain | https://imagej.nih.gov/ij/download.html; RRID:SCR_003070 | |
| Software, algorithm | Imaris | Bitplane | https://www.bitplane.comhttps://www.bitplane.com; RRID:SCR_007370 | |
| Software, algorithm | Excel | Microsoft | https://www.microsoft.com/en-us/microsoft-365/excel; RRID:SCR_016137 | |
| Software, algorithm | GraphPad Prism 8.4.2 | GraphPad | http://www.graphpad.com/; RRID:SCR_002798 |
Additional files
Download links
A two-part list of links to download the article, or parts of the article, in various formats.
Downloads (link to download the article as PDF)
Open citations (links to open the citations from this article in various online reference manager services)
Cite this article (links to download the citations from this article in formats compatible with various reference manager tools)
Somite morphogenesis is required for axial blood vessel formation during zebrafish embryogenesis
eLife 11:e74821.
https://doi.org/10.7554/eLife.74821


