Zinc finger protein Zfp335 controls early T-cell development and survival through β-selection-dependent and -independent mechanisms
- Department of Pathogenic Microbiology and Immunology, School of Basic Medical Sciences, Xi'an Jiaotong University, China
- Institute of Infection and Immunity, Translational Medicine Institute, Xi’an Jiaotong University Health Science Center, China
- Key Laboratory of Environment and Genes Related to Diseases (Xi'an Jiaotong University), Ministry of Education, China
- Xi’an Key Laboratory of Immune Related Diseases, China
Figures
Figure 1 with 3 supplements
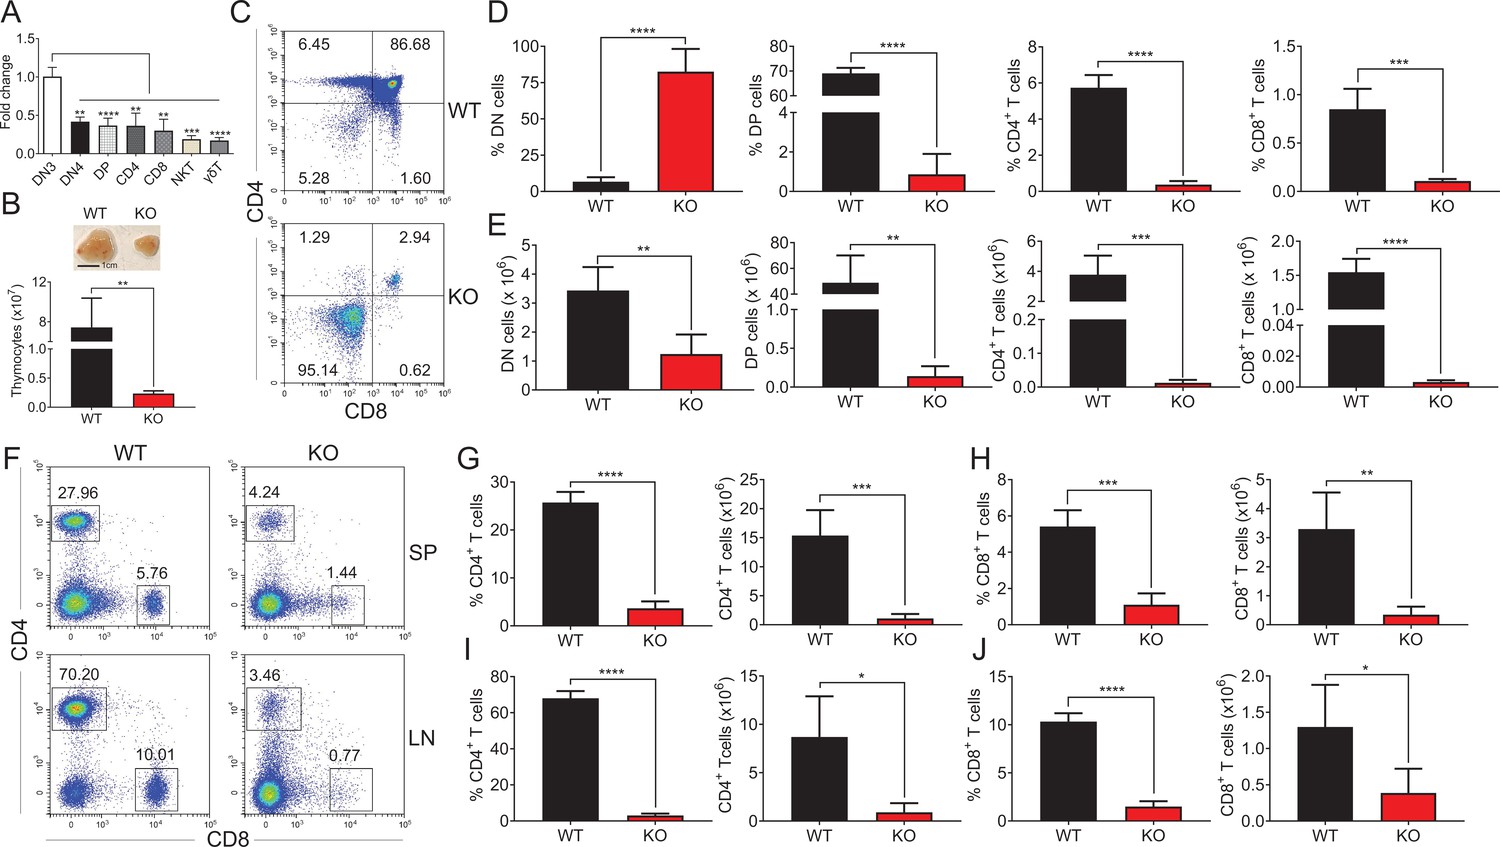
Impaired thymocyte development in Zfp335-deficient mice.
(A) DN3, DN4, DP, CD4, CD8, NKT, and γδT cells were sorted from C57BL/6 thymocytes by flow cytometry. The mRNA levels of Zfp335 were measured by qPCR. (B) Thymi from LckCre+Zfp335+/+ (WT) and LckCre+Zfp335fl/fl (KO) mice. Representative thymi and total cell number of thymocytes. Scale bar, 1 cm. (C–E) The different stages of thymocyte development in WT and KO mice were measured by flow cytometry. (C) Representative flow cytometry (FACS) plots of DN, DP, CD4, and CD8 thymocytes. (D) The percentages of DN, DP, CD4, and CD8 thymocytes. (E) The numbers of DN, DP, CD4, and CD8 thymocytes. (F–J) CD4+ and CD8+ cells in spleen and lymph nodes from WT and KO mice were measured by flow cytometry. (F) Representative FACS plots of CD4+ and CD8+ cells in spleen and lymph nodes. The percentage and number of CD4+ T cells (G) and CD8+ T cells (H) in the spleen from WT and KO mice. The percentage and number of CD4+ T cells (I) and CD8+ T cells (J) in the lymph nodes from WT and KO mice. Results represent three independent experiments. n = 4 mice per group. *p < 0.05, **p < 0.01, ***p < 0.001, and ****p < 0.0001.
-
Figure 1—source data 1
Figure 1D The percentages of DN, DP, CD4, and CD8 thymocytes from WT and KO mice.
Figure 1E. The numbers of DN, DP, CD4, and CD8 thymocytes from WT and KO mice. Figure 1G, H. The percentages and numbers of CD4+ and CD8+ T cells in spleen from WT and KO mice. Figure 1I, J. The percentages and numbers of CD4+ and CD8+ T cells in lymph nodes from WT and KO mice.
- https://cdn.elifesciences.org/articles/75508/elife-75508-fig1-data1-v2.xlsx
Figure 1—figure supplement 1
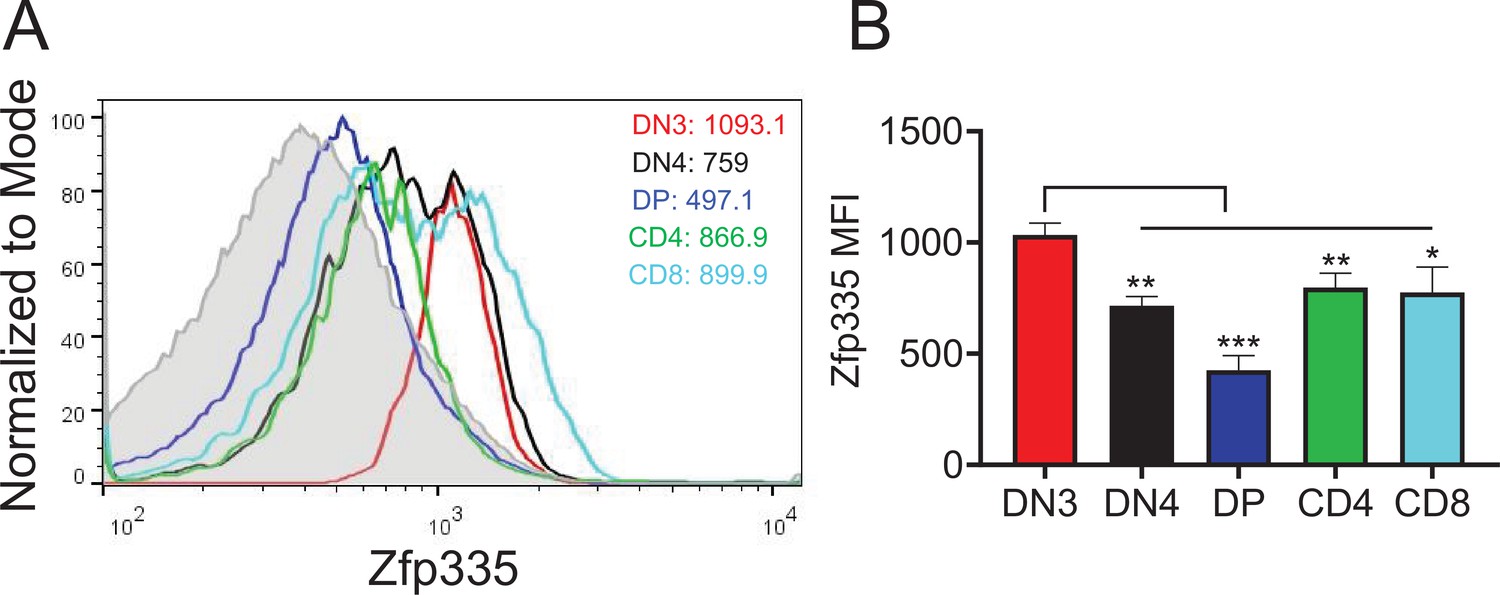
Zfp335 protein expression in thymocytes.
(A) Representative FACS plots of Zfp335 protein expression in DN3, DN4, DP, CD4 SP, and CD8 SP thymocytes. (B) Mean fluorescence intensity (MFI) of Zfp335 in (A). Results shown represent three independent experiments. n = 3 per group. *p < 0.05, **p < 0.01, and ***p < 0.001.
-
Figure 1—figure supplement 1—source data 1
Figure 1—figure supplement 1B.
Zfp335 protein expression in thymocytes.
- https://cdn.elifesciences.org/articles/75508/elife-75508-fig1-figsupp1-data1-v2.xlsx
Figure 1—figure supplement 2
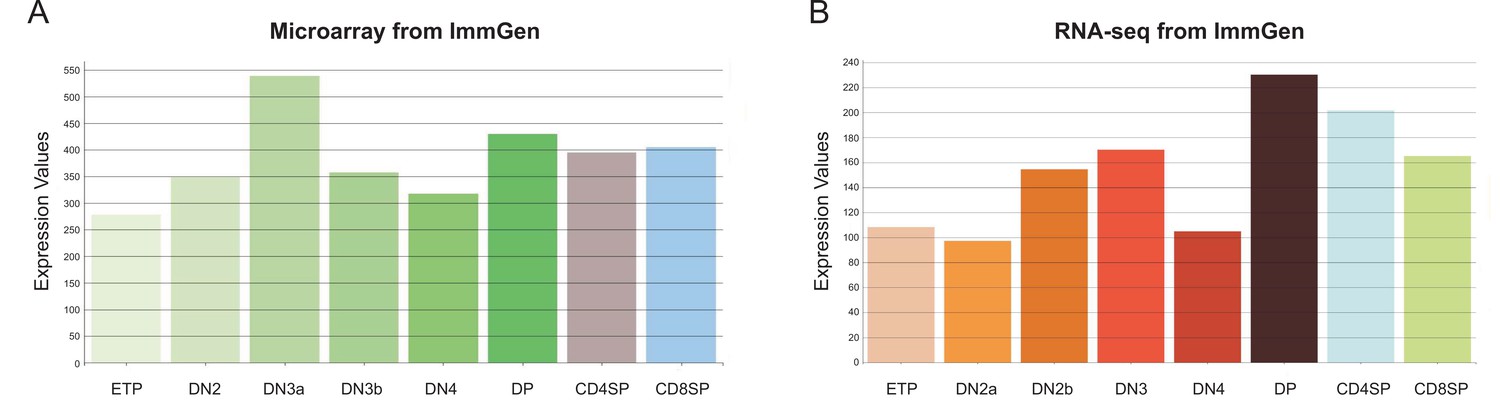
The transcriptional profiling of Zfp335 expression in various subsets of thymocytes.
The RNA profiling datasets of Zfp335 generated by microarray (A) or RNA-seq (B) data on the ImmGen database.
Figure 1—figure supplement 3
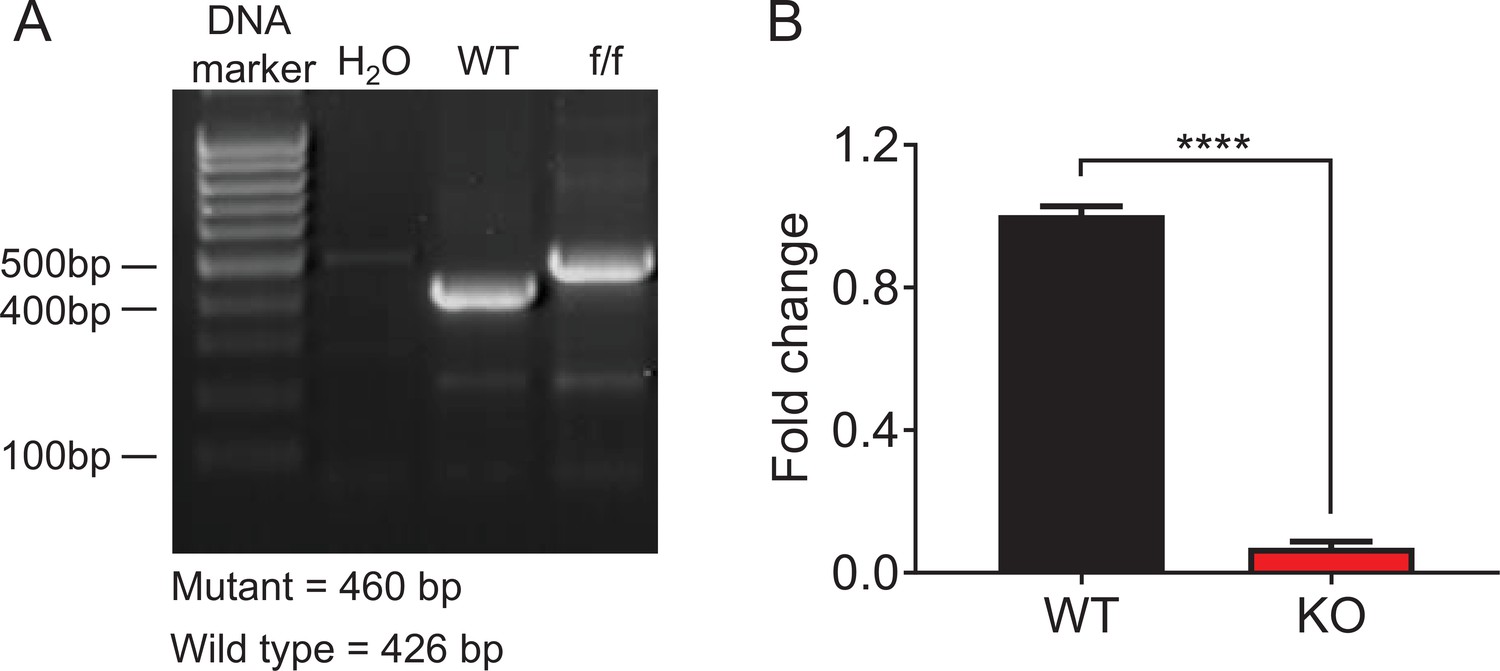
Verification of Zfp335 conditional knockout mouse strain.
(A–B) Zfp335fl/fl mice were crossed with LckCre mice to generate LckCre+Zfp335fl/fl mice. (A) The size of Zfp335 DNA in WT and KO mice. (B) The mRNA level of Zfp335 in DN4 cells from WT and KO mice. n = 3, ****p < 0.0001.
-
Figure 1—figure supplement 3—source data 1
The gel of Zfp335 DNA in WT and KO mice.
Lines 1–8: 1: marker; 2: H2O; 3: WT; 4: KO1; 5: KO2; 6: KO3; 7: KO4; 8: KO5.
- https://cdn.elifesciences.org/articles/75508/elife-75508-fig1-figsupp3-data1-v2.zip
Figure 2 with 2 supplements
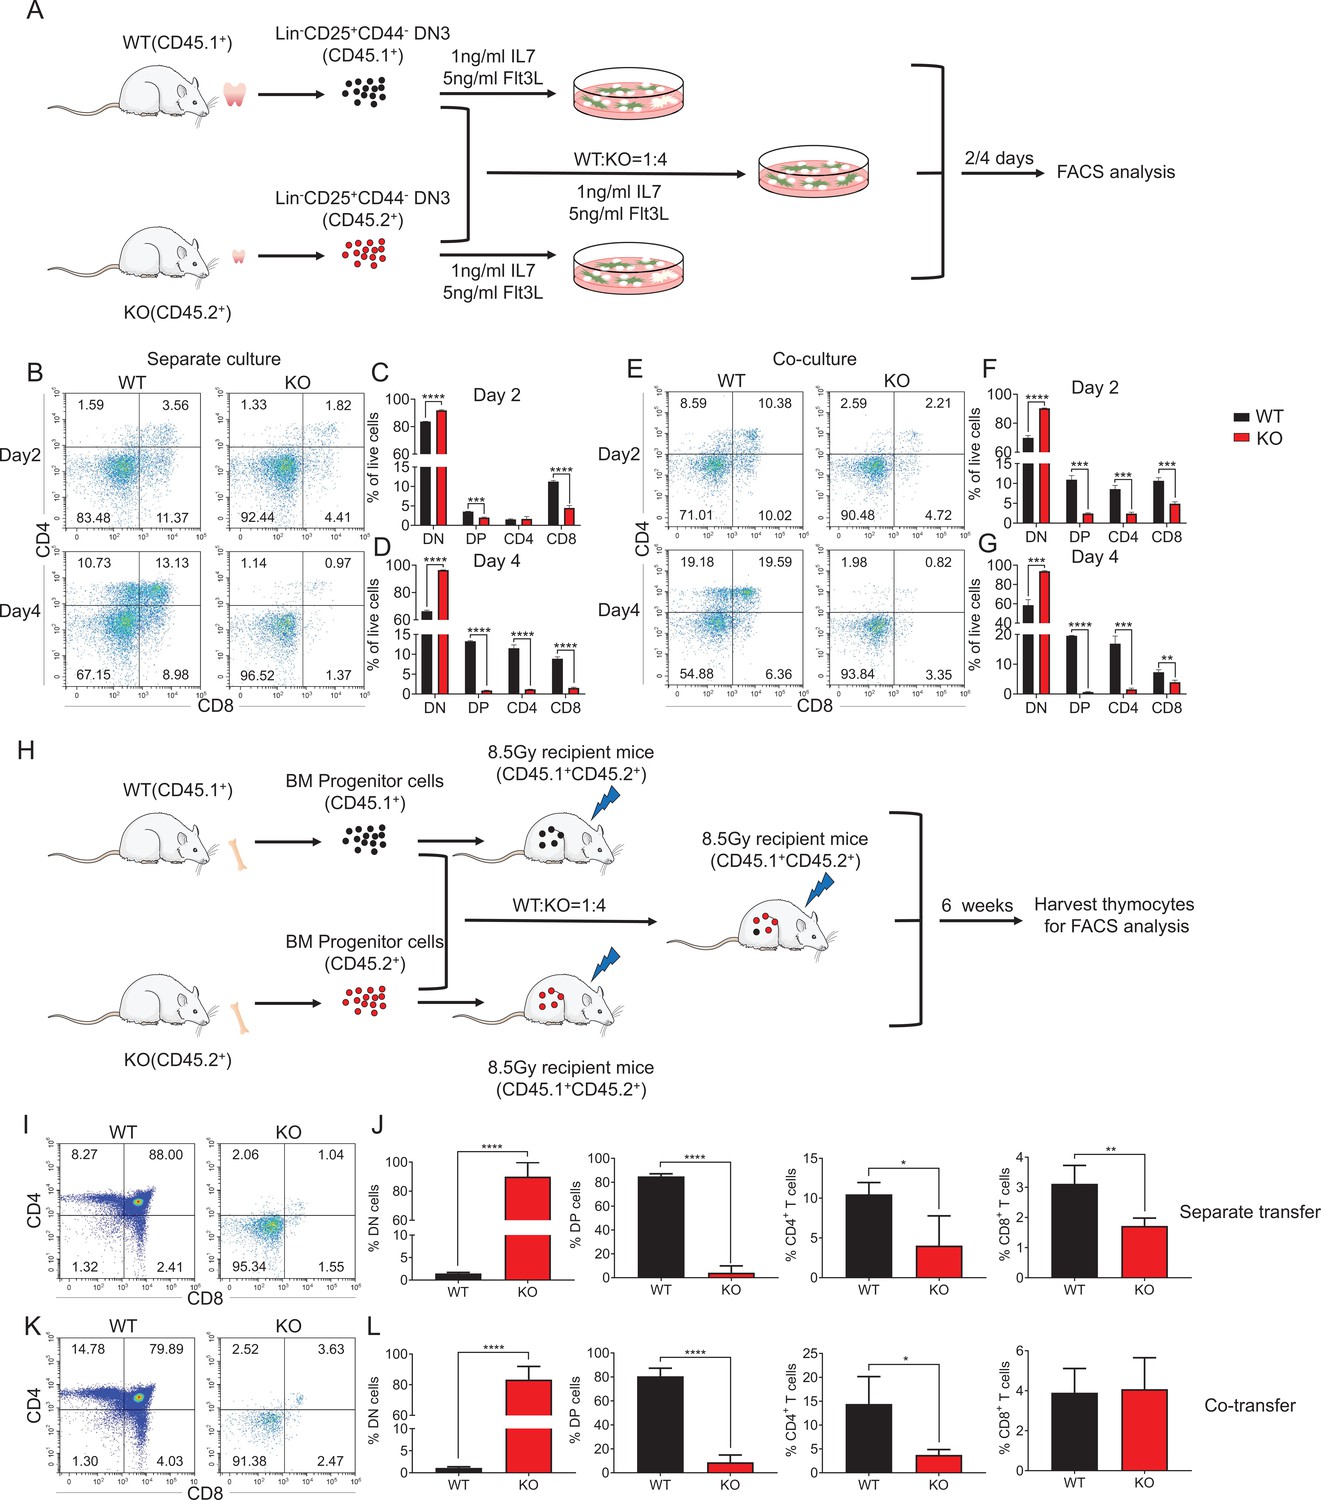
An intrinsic block from DN to DP stage in Zfp335-deficient mice.
(A) Schematic overview of the in vitro OP9-DL1 stromal coculture assay for T-cell differentiation from WT (CD45.1+) and KO (CD45.2+) DN3 thymocytes to DP and SP thymocytes. (B–D) WT and KO DN3 thymocytes were cultured with OP9-DL1 feeder cells in vitro in the presence of IL-7 (1 ng/ml) and Flt3L (5 ng/ml) for 2 and 4 days. The DN and DP thymocytes were measured by flow cytometry (n = 3). (B) Representative FACS plots of DN, DP, CD4+, and CD8+ thymocytes. (C) The percentages of DN, DP, CD4+, and CD8+ thymocytes 2 days post culture in vitro. (D) The percentage of DN, DP, CD4+, and CD8+ thymocytes 4 days post culture in vitro. (E–G) A mixed population of WT and KO DN3 thymocytes at a 1:4 ratio was cocultured with OP9-DL1 feeder cells in vitro in the presence of IL-7 (1 ng/ml) and Flt3L (5 ng/ml) for 2 and 4 days. The DN and DP thymocytes were phenotyped by flow cytometry (n = 3). (E) Representative FACS plots of DN, DP, CD4+, and CD8+ thymocytes. (F) Percentages of DN, DP, CD4+, and CD8+ thymocytes 2 days post culture in vitro. (G) Percentages of DN, DP, CD4+, and CD8+ thymocytes 4 days postculture in vitro. (H) Schematic overview of the in vivo bone marrow chimeric mice model for T-cell differentiation from WT (CD45.1+) and KO (CD45.2+) progenitors cells to DP and SP thymocytes. (I, J) Full chimeric mice were generated by transplanting WT (CD45.1+) or KO (CD45.2+) bone marrow progenitor cells into lethally irradiated (8.5 Gy) WT recipient mice (CD45.1+CD45.2+). Six weeks after transplantation, thymi from recipient mice were harvested. (I) Representative FACS plots of DN, DP, CD4+, and CD8+ thymocytes. (J) The percentages of DN, DP, CD4+, and CD8+ thymocytes. (K, L) Full chimeric mice were generated by transplanting a mixed population of WT (CD45.1+) and KO (CD45.2+) bone marrow progenitor cells at a 1:4 ratio into lethally irradiated WT recipients (CD45.1+CD45.2+) with 8.5 Gy. Six weeks after transplantation, thymi from recipient mice were harvested. (K) Representative FACS plots of DN, DP, CD4+, and CD8+ thymocytes. (L) Percentages of DN, DP, CD4+, and CD8+ thymocytes. Results represent three independent experiments. n = 4 mice per group. *p < 0.05, **p < 0.01, ***p < 0.001, and ****p < 0.0001.
-
Figure 2—source data 1
Figure 2C, D. The percentages of DN, DP, CD4+, and CD8+ thymocytes 2 and 4 days post separate culture in vitro.
Figure 2F, G. The percentages of DN, DP, CD4+, and CD8+ thymocytes 2 and 4 days post coculture in vitro . Figure 2J. The percentages of DN, DP, CD4+, and CD8+ thymocytes in chimeric mice separately transferred with WT and KO bone marrow cells. Figure 2L. The percentages of DN, DP, CD4+, and CD8+ 7 thymocytes in chimeric mice cotransferred with WT and KO bone marrow cells.
- https://cdn.elifesciences.org/articles/75508/elife-75508-fig2-data1-v2.xlsx
Figure 2—figure supplement 1
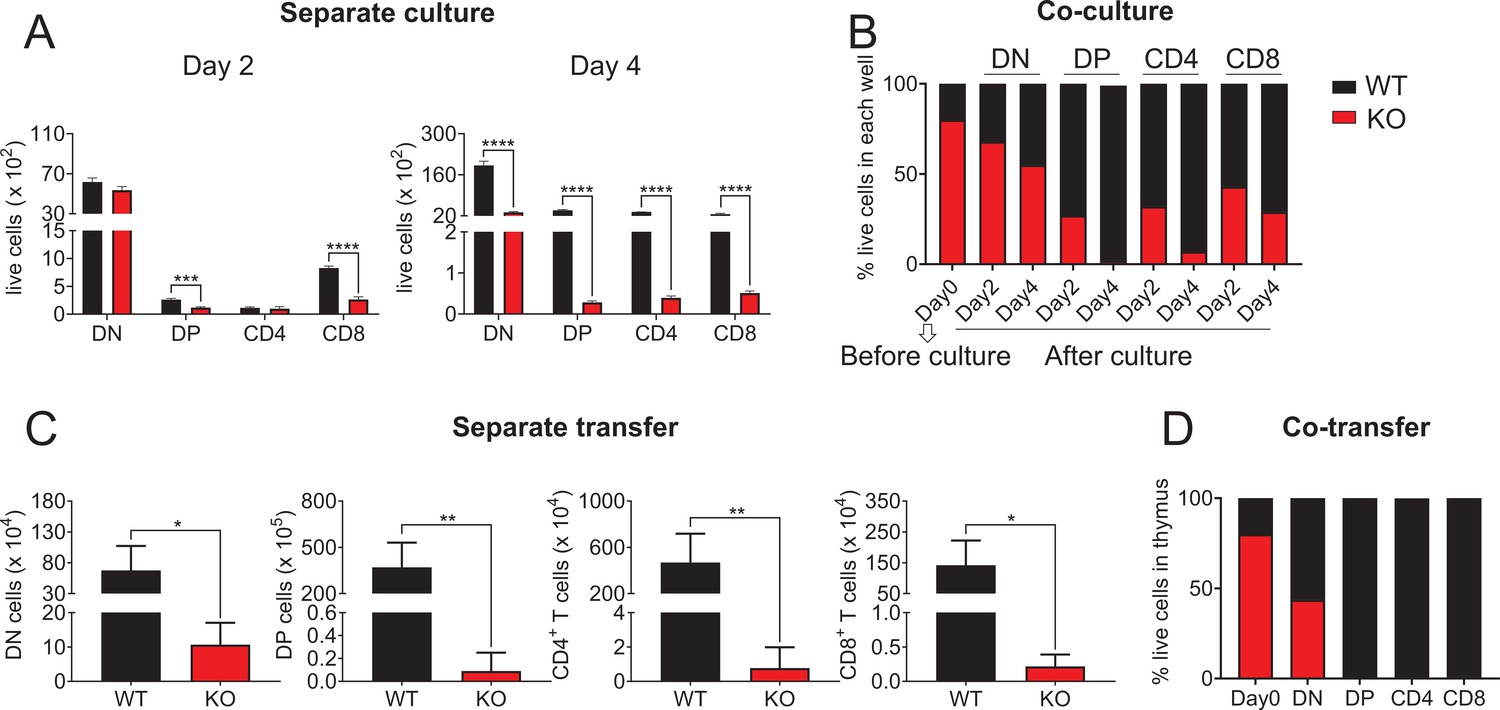
Zfp335 deletion caused defects of thymocyte development.
(A) WT and KO DN3 thymocytes were cultured with OP9-DL1 feeder cells in vitro in the presence of IL-7 (1 ng/ml) and Flt3L (5 ng/ml) for 2 and 4 days. Thymocytes were analyzed by flow cytometry. The numbers of DN, DP, CD4+, and CD8+ thymocytes 2 days (left) and 4 days (right) post culture in vitro (n = 3). (B) WT and KO DN3 thymocytes were mixed and cocultured in the in vitro development model. The numbers of DN, DP, CD4+, and CD8+ thymocytes 2 and 4 days post culture (n = 3). (C) Full chimeric mice were generated by transplanting WT (CD45.1+) or KO (CD45.2+) bone marrow progenitor cells into lethally irradiated (8.5 Gy) WT recipient mice (CD45.1+CD45.2+). Six weeks after transplantation, thymi from recipient mice were harvested. The numbers of DN, DP, CD4+, and CD8+ thymocytes are indicated (n = 4). (D) WT and KO mixed bone marrow chimeric mice were generated and thymi from recipient mice were harvested. The numbers of DN, DP, CD4+, and CD8+ thymocytes are indicated (n = 4). Results shown represent three independent experiments. *p < 0.05, **p < 0.01, ***p < 0.001, and ****p < 0.0001.
-
Figure 2—figure supplement 1—source data 1
Figure 2—figure supplement 1A. The numbers of DN, DP, CD4+, and CD8+ thymocytes 2 and 4 days post separate culture in vitro.
Figure 2—figure supplement 1B. The numbers of DN, DP, CD4+, and CD8+ thymocytes 2 and 4 days post coculture in vitro. Figure 2—figure supplement 1C. The numbers of DN, DP, CD4+, and CD8+ thymocytes in chimeric mice separately transferred with WT and KO bone marrow cells. Figure 2—figure supplement 1D. The numbers of DN, DP, CD4+, and CD8+ thymocytes in chimeric mice cotransferred with WT and KO bone marrow cells.
- https://cdn.elifesciences.org/articles/75508/elife-75508-fig2-figsupp1-data1-v2.xlsx
Figure 2—figure supplement 2
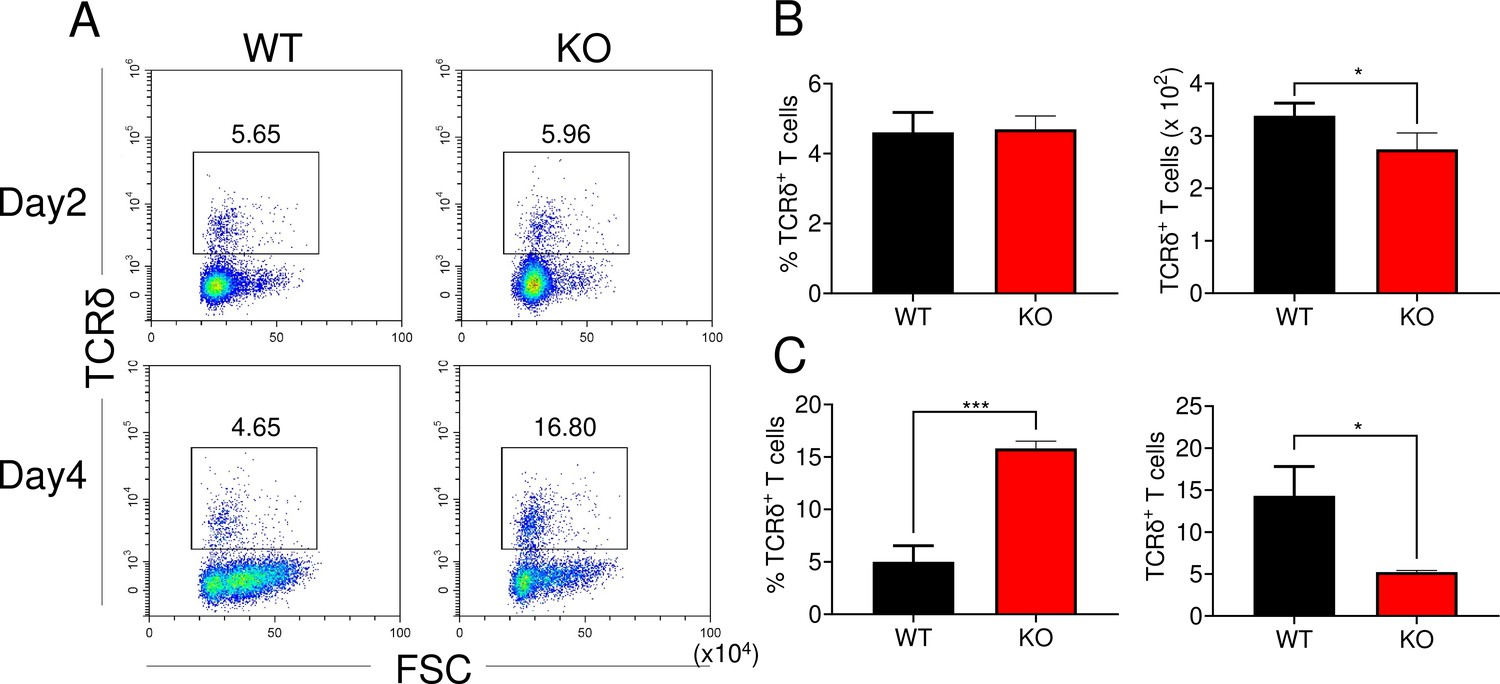
Effect of Zfp335 deletion on γδ T-cell percentages and cellularity in vitro.
WT and KO DN3 thymocytes were cultured with OP9-DL1 feeder cells in vitro in the presence of IL-7 (1 ng/ml) and Flt3L (5 ng/ml) for 2 and 4 days. The γδ T cells were measured by flow cytometry (n = 3). (A) Representative FACS plots of γδ T cells. The percentages of γδ T cells on day 2 (B) and day 4 (C). Data are representative of at least three independent experiments shown as the mean ± standard error of the mean (SEM). Two-tailed, unpaired t-tests were used for statistical analyses; *p < 0.05 and ***p < 0.001.
-
Figure 2—figure supplement 2—source data 1
Figure 2—figure supplement 2B, C. The percentages and numbers of γδ T cells in WT and KO mice 2 and 4 days post coculture in vitro.
- https://cdn.elifesciences.org/articles/75508/elife-75508-fig2-figsupp2-data1-v2.xlsx
Figure 3
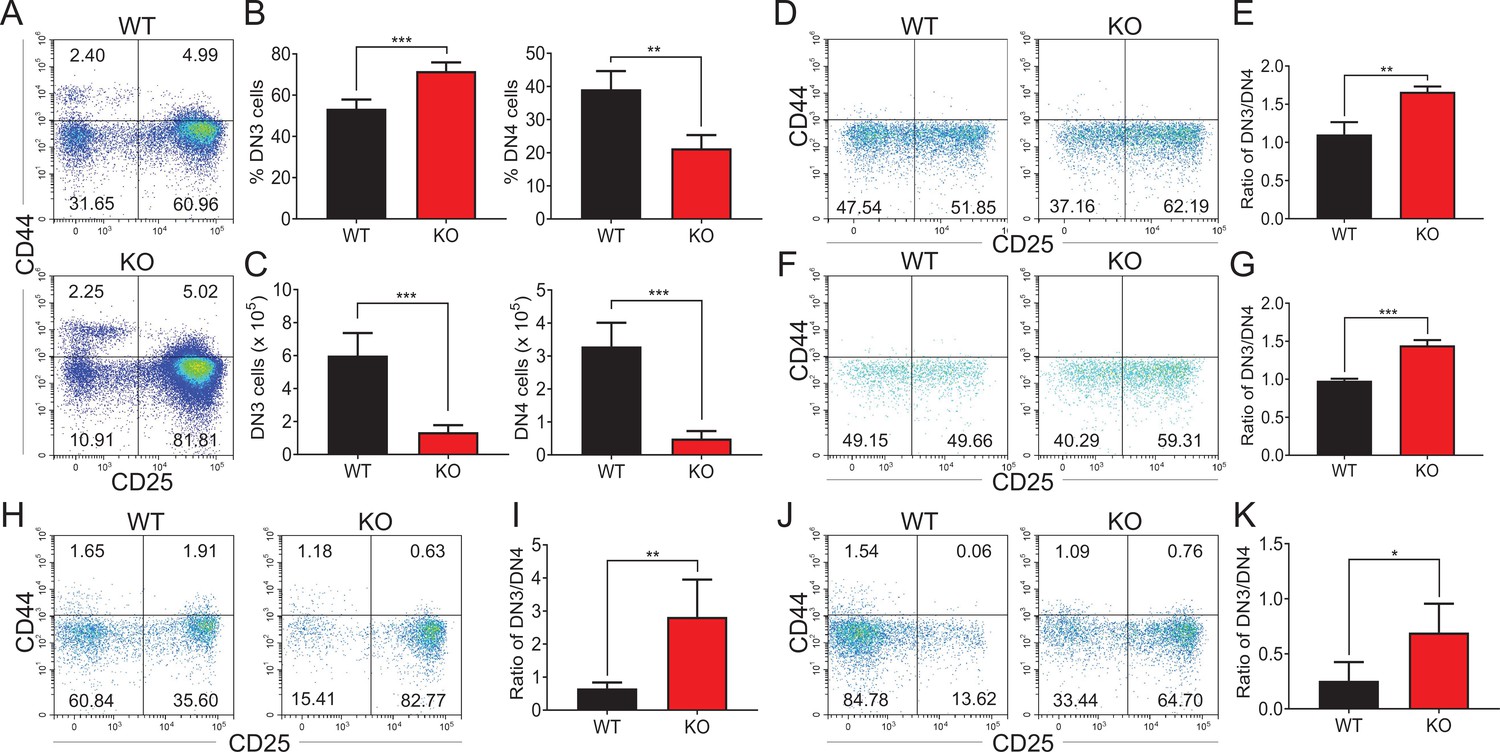
Zfp335-deficient thymocytes undergo a developmental block during DN3 to DN4 transition.
(A–C) Thymi were harvested from 6- to 8-week-old WT and KO mice. The different stages of DN thymocytes in WT and KO mice were measured by flow cytometry (n = 4). (A) Representative FACS plots of DN1 (CD25−CD44+), DN2 (CD25+CD44+), DN3 (CD25+CD44−), and DN4 (CD25−CD44−) thymocytes. (B) The percentages of DN3 and DN4 thymocytes. (C) The numbers of DN3 and DN4 thymocytes. (D–E) WT and KO DN3 thymocytes were cultured with OP9-DL1 feeder cells in vitro in the presence of IL-7 (1 ng/ml) and Flt3L (5 ng/ml) for 2 days. The expression of CD44 versus CD25 was measured by flow cytometry (n = 3). (D) Representative FACS plots of DN3 and DN4 thymocytes. (E) The ratio of DN3 to DN4 thymocytes 2 days post culture in vitro. (F–G) A mixed population of WT and KO DN3 thymocytes at a 1:4 ratio was cocultured with OP9-DL1 feeder cells in vitro in the presence of IL-7 (1 ng/ml) and Flt3L (5 ng/ml) for 2 days. The expression of CD44 versus CD25 was measured by flow cytometry (n = 3). (F) Representative FACS plots of DN3 and DN4 thymocytes. (G) The ratio of DN3 to DN4 thymocytes 2 days post culture in vitro. (H, I) Full chimeric mice were generated by transplanting WT (CD45.1+) or KO (CD45.2+) bone marrow progenitor cells into lethally irradiated (8.5 Gy) WT recipients (CD45.1+CD45.2+). Six weeks after transplantation, thymi from recipient mice were harvested. The expression of CD44 versus CD25 was measured by flow cytometry (n = 4). (H) Representative FACS plots of DN3 and DN4 cells. (I) The ratio of DN3 to DN4 thymocytes. (J, K) Full chimeric mice were generated by transplanting a mixed population of WT (CD45.1+) and KO (CD45.2+) bone marrow progenitor cells at a 1:4 ratio into lethally irradiated (8.5 Gy) WT recipient mice (CD45.1+CD45.2+). Six weeks after transplantation, thymi from recipient mice were harvested. The expression of CD44 versus CD25 was measured by flow cytometry (n = 4). (J) Representative FACS plots of DN3 and DN4 thymocytes. (K) The ratio of DN3 to DN4 thymocytes. Results represent three independent experiments. *p < 0.05, **p < 0.01, and ***p < 0.001.
-
Figure 3—source data 1
Figure 3B, C. The percentages and numbers of DN3 and DN4 thymocytes from WT and KO mice.
Figure 3E–G. The ratio of DN3 to DN4 thymocytes 2 days post culture in vitro. Figure 3I–K. The ratio of DN3 to DN4 thymocytes in chimeric mice transferred with WT and KO bone marrow cells.
- https://cdn.elifesciences.org/articles/75508/elife-75508-fig3-data1-v2.xlsx
Figure 4 with 2 supplements
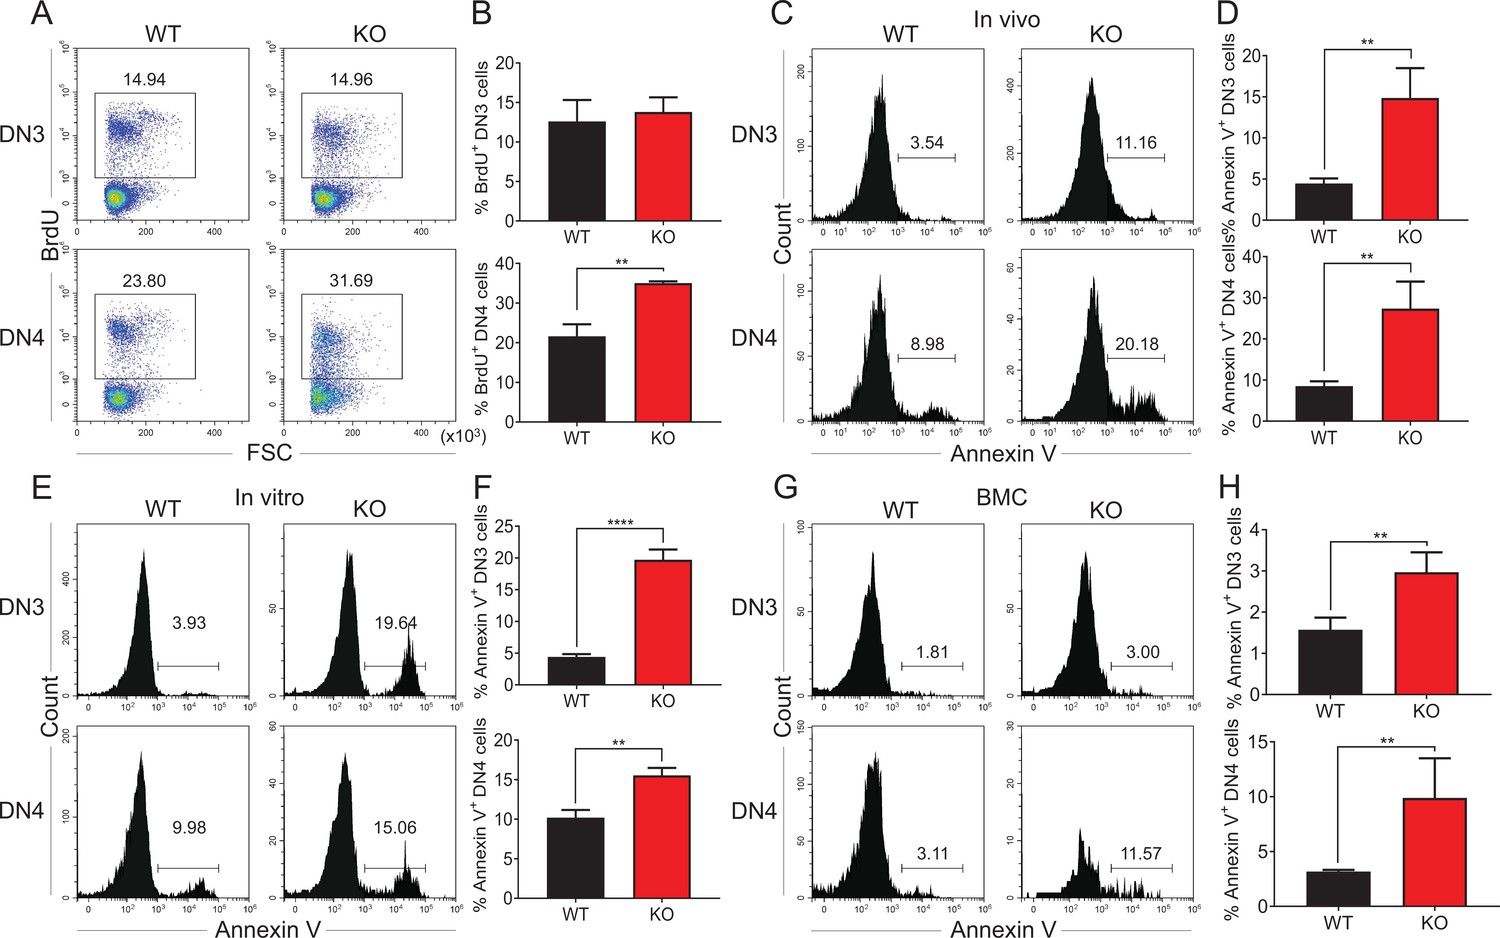
Zfp335 deficiency promotes thymocyte apoptosis in vivo and in vitro.
(A, B) Thymi were harvested from 6- to 8-week-old WT and KO mice. The expression of BrdU in DN3 and DN4 thymocytes from WT and KO thymi was measured by flow cytometry (n = 3). (A) Representative FACS plots of BrdU expression in DN3 and DN4 thymocytes. (B) The percentages of BrdU+ thymocytes in DN3 and DN4 cells. (C, D) The binding of Annexin V in DN3 and DN4 thymocytes from WT and KO thymi was measured by flow cytometry (n = 3). (C) Representative FACS plots of Annexin V binding in DN3 and DN4 thymocytes. (D) The percentages of Annexin V+ DN3 and DN4 cells. (E, F) A mixed population of WT and KO DN3 thymocytes at a 1:4 ratio was cocultured with OP9-DL1 feeder cells in vitro in the presence of IL-7 (1 ng/ml) and Flt3L (5 ng/ml) for 4 days. The binding of Annexin V was measured by flow cytometry (n = 3). (E) Representative FACS plots of Annexin V+ DN3 and DN4 cells. (F) The percentage of Annexin V+ DN3 and DN4 cells. (G, H) Full chimeric mice were generated by transplanting a mixed population of WT (CD45.1+) and KO (CD45.2+) bone marrow progenitor cells at a 1:4 ratio into lethally irradiated WT recipient mice (CD45.1+CD45.2+) with 8.5 Gy. Five weeks after transplantation, thymi from recipient mice were harvested. The binding of Annexin V was measured by flow cytometry (n = 4). (G) Representative FACS plots of Annexin V+ DN3 and DN4 cells. (H) The percentage of Annexin V binding in DN3 and DN4 thymocytes. Results represent three independent experiments. **p < 0.01 and ****p < 0.0001.
-
Figure 4—source data 1
Figure 4B. The percentages of BrdU+ thymocytes in DN3 and DN4 cells from WT and KO mice.
- https://cdn.elifesciences.org/articles/75508/elife-75508-fig4-data1-v2.xlsx
Figure 4—figure supplement 1

Zfp335 deficiency has no effect on the proliferation of DN3 and DN4 cells.
(A, B) Thymi from WT and KO mice were harvested. The expressions of Ki67 in DN3 and DN4 thymocytes from WT and KO thymi was measured by flow cytometry (n = 3). (A) Representative FACS plots of Ki67 expression in DN3 and DN4 thymocytes. (B) The percentages of Ki67+ thymocytes in DN3 and DN4 cells. Data are representative of at least three independent experiments shown as the mean ± standard error of the mean (SEM). Two-tailed, unpaired t-tests were used for statistical analyses; *p < 0.05.
-
Figure 4—figure supplement 1—source data 1
Figure 4—figure supplement 1B. The percentages of Ki67+ thymocytes in DN3 and DN4 cells from WT and KO mice.
- https://cdn.elifesciences.org/articles/75508/elife-75508-fig4-figsupp1-data1-v2.xlsx
Figure 4—figure supplement 2
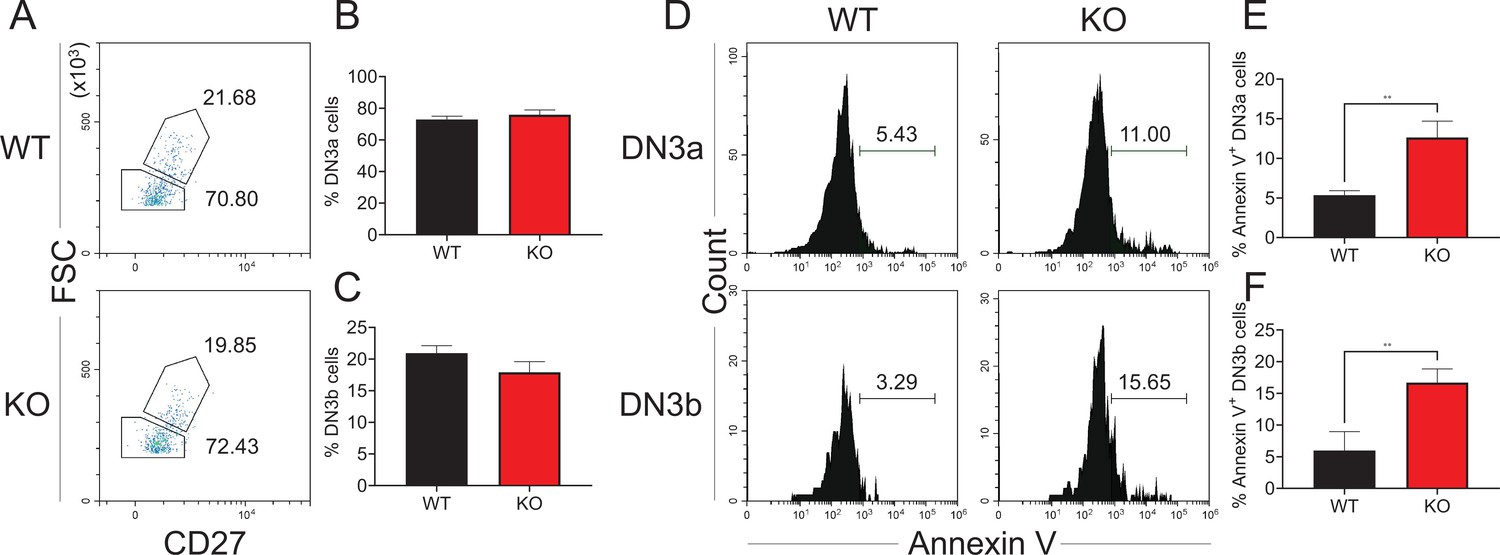
Effect of Zfp335 deletion on DN3a and DN3b Cells.
(A) Representative FACS plots of WT and Zfp335 KO DN3a and DN3b cells gated in DN3 thymocytes from 6- to 8-week-old mice. The percentages of DN3a (B) and DN3b (C) cells in (A). (D) Histograms showing the Annexin V expression in WT and Zfp335 KO DN3a and DN3b thymocytes. The percentages of Annexin V+ DN3a (E) and DN3b (F) cells in (D). Results represent three independent experiments. n = 3 per group. **p < 0.01.
-
Figure 4—figure supplement 2—source data 1
Figure 4—figure supplement 2E, F. The percentages of Annexin V+ DN3a and DN3b cells from WT and KO mice.
- https://cdn.elifesciences.org/articles/75508/elife-75508-fig4-figsupp2-data1-v2.xlsx
Figure 5 with 5 supplements
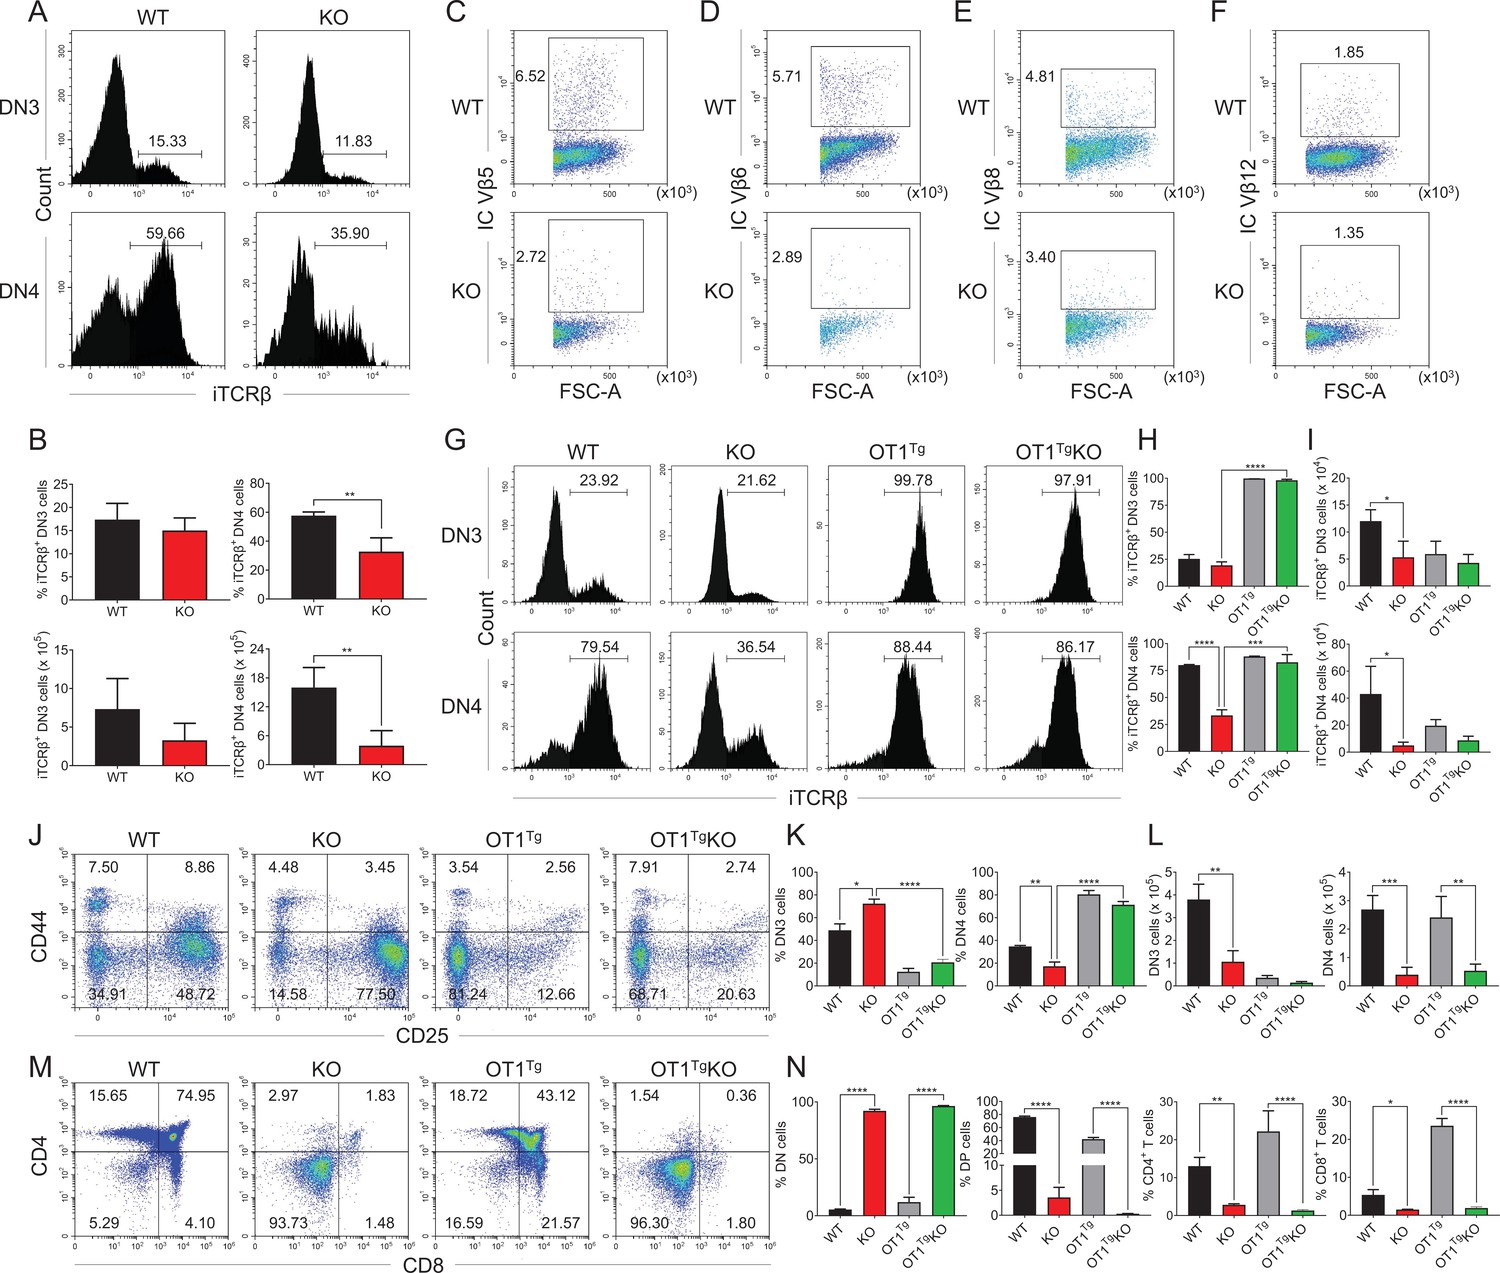
OT1 transgenic TCR overexpression rescued Zfp335 deficiency-induced defect during DN3 to DN4 transition.
(A, B) Thymi were harvested from 6- to 8-week-old WT and KO mice. The expression of iTCRβ in DN3 and DN4 thymocytes was measured by flow cytometry (WT n = 3; KO n = 4). (A) Representative FACS plots of iTCRβ expression in DN3 and DN4 thymocytes. (B) Percentages and numbers of iTCRβ+ thymocytes in DN3 and DN4 cells. Representative FACS plots of intercellular TCR Vβ5 (C), Vβ6 (D), Vβ8 (E), and Vβ12 (F) expression in DN4 cells from WT and KO mice. (G–I) Thymi from WT, KO, OT1+ (OT1Tg), and OT1+LckCre+Zfp335fl/fl (OT1Tg KO) mice were harvested. The expressions of iTCRβ in DN3 (up) and DN4 (down) thymocytes were measured by flow cytometry (WT n = 3; KO n = 5; OT1Tg n = 3; OT1Tg KO n = 5). (G) Representative FACS plots of iTCRβ expression in DN3 and DN4 thymocytes. (H) The percentage of iTCRβ+ DN3 and DN4 cells in WT, KO, OT1Tg, and OT1Tg KO mice. (I) The numbers of iTCRβ+ DN3 and DN4 cells in WT, KO, OT1Tg, and OT1Tg KO mice. (J–L) The different stages of DN thymocytes in WT, KO, OT1Tg, and OT1Tg KO mice were measured by flow cytometry (WT n = 3; KO n = 5; OT1Tg n = 3; OT1Tg KO n = 5). (J) Representative FACS plots of DN3 and DN4 thymocytes. (K) The percentages of DN3 and DN4 thymocytes. (L) The numbers of DN3 and DN4 thymocytes. (M, N) The different stages of thymocyte development in WT, KO, OT1Tg, and OT1Tg KO mice were measured by flow cytometry (WT n = 3; KO n = 5; OT1Tg n = 3; OT1Tg KO n = 5). (M) Representative FACS plots of thymocytes. (N) The percentages of DN, DP, CD4+CD8−, and CD4−CD8+ thymocytes. Results represent three independent experiments. n = 3 per group. *p < 0.05, **p < 0.01, ***p < 0.001, and ****p < 0.0001.
-
Figure 5—source data 1
Figure 5B. The percentages and numbers of iTCRβ+ thymocytes in DN3 and DN4 cells from WT and KO mice.
Figure 5H, I. The percentages of iTCRβ+ DN3 and DN4 cells in WT, KO, OT1Tg, and OT1Tg KO mice. Figure 5K, L. The percentages and numbers of DN3 and DN4 thymocytes in WT, KO, OT1Tg, and OT1Tg KO mice. Figure 5N. The percentages of DN, DP, CD4+, and CD8+ thymocytes in WT, KO, OT1Tg, and OT1Tg KO mice.
- https://cdn.elifesciences.org/articles/75508/elife-75508-fig5-data1-v2.xlsx
Figure 5—figure supplement 1
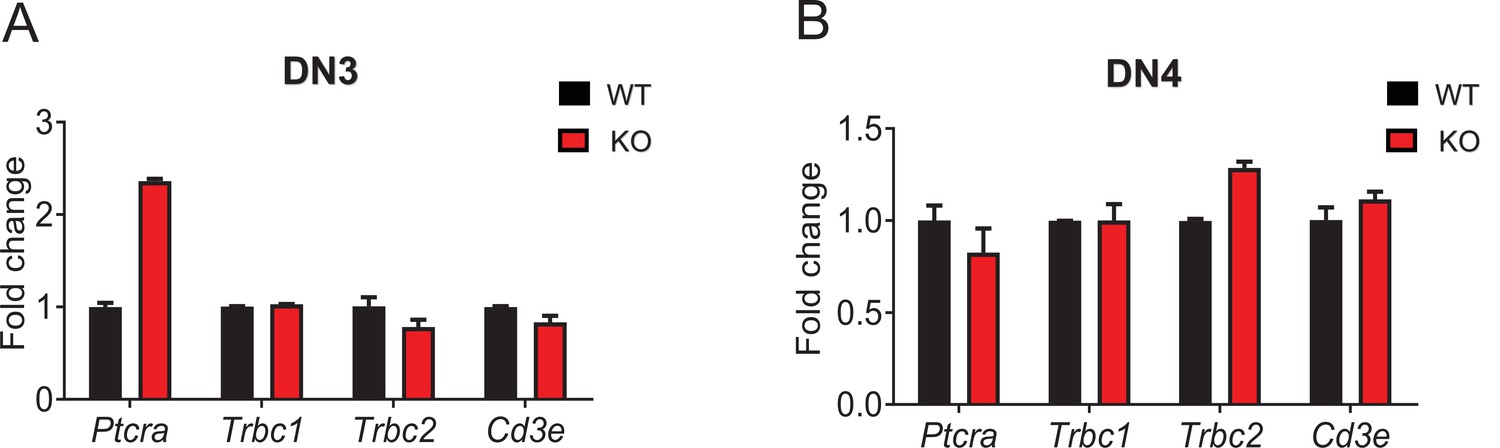
Effect of Zfp335 deletion on pre-TCR complex expression in DN3 and DN4 cells.
qPCR analysis of Ptcrα, Trbc1,Trbc2, and CD3e expression in DN3 (A) and DN4 (B) cells from WT and KO mice.
Figure 5—figure supplement 2
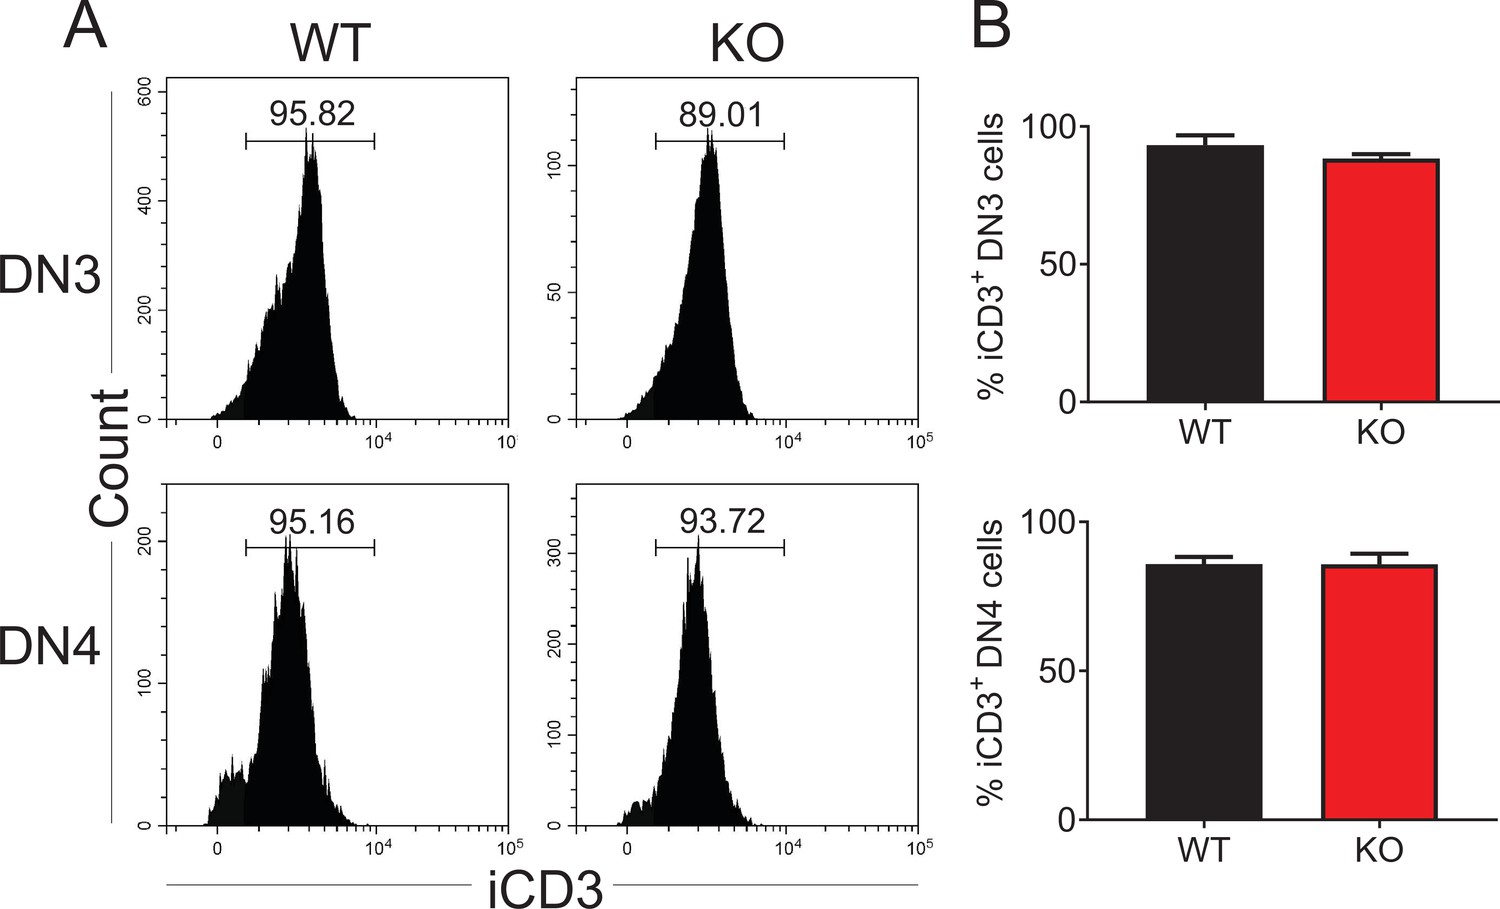
Intercellular CD3 (iCD3) expression in Zfp335-deficient DN3 and DN4 thymocytes.
(A) Representative FACS plots of iCD3 expression in DN3 and DN4 thymocytes. (B) The percentages of iCD3+ DN3 and DN4 cells in WT and KO mice. Data are representative of at least three independent experiments shown as the mean ± standard error of the mean (SEM). Two-tailed, unpaired t-tests were used for statistical analyses, WT n = 3; KO n = 4.
-
Figure 5—figure supplement 2—source data 1
Figure 5—figure supplement 2B. Intercellular CD3 expression in Zfp335-deficient DN3 and DN4 thymocytes.
- https://cdn.elifesciences.org/articles/75508/elife-75508-fig5-figsupp2-data1-v2.xlsx
Figure 5—figure supplement 3
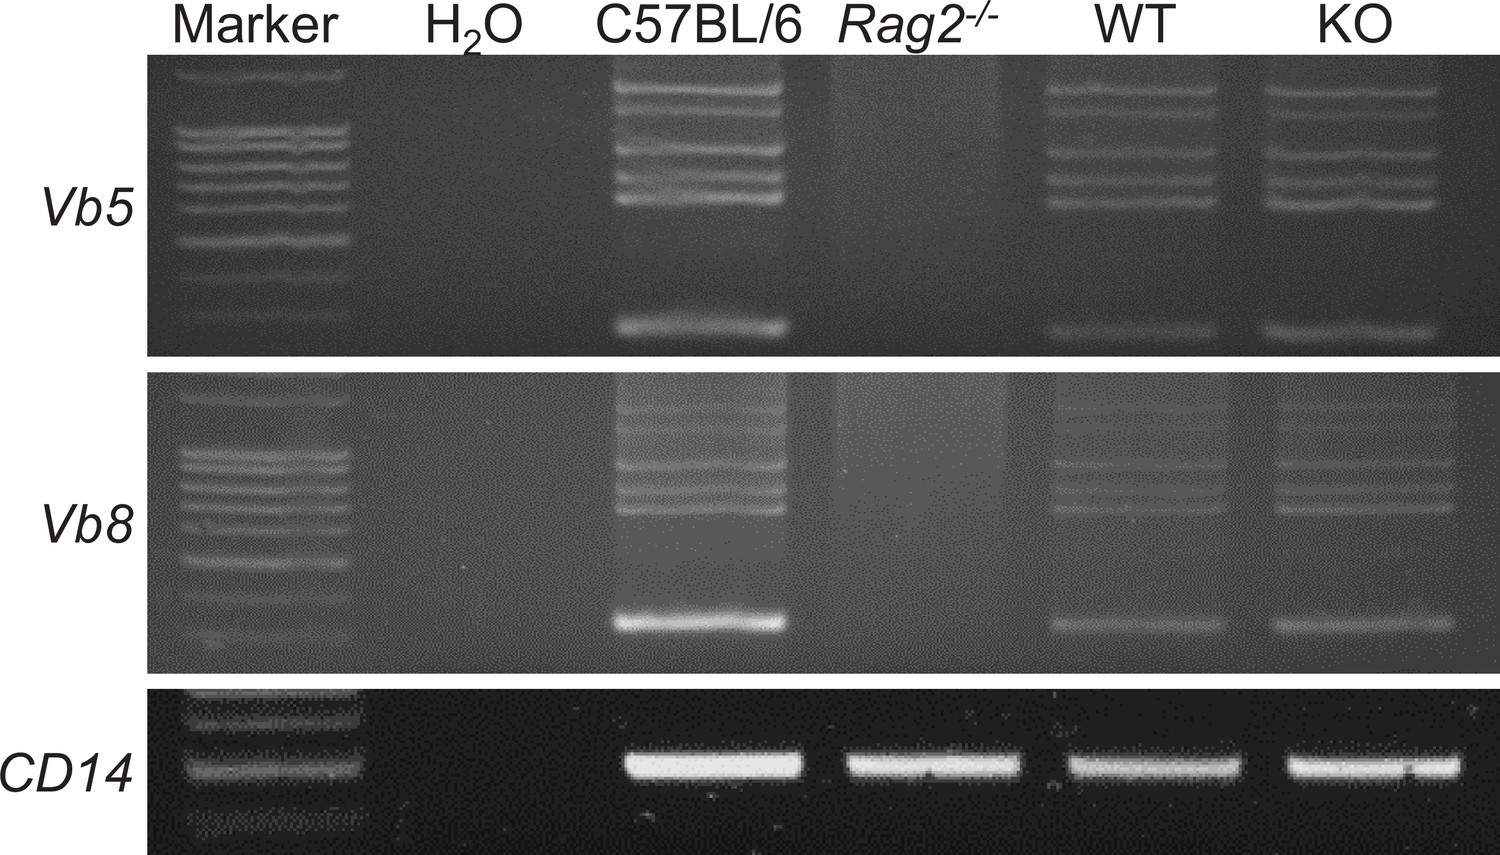
Effect of Zfp335 deletion on TCRβ rearrangement in DN3 thymocytes.
PCR analysis of TCRβ gene rearrangements. Genomic DNA isolated from thymocytes of B6, recombinase-activating gene-2-deficient (Rag2−/−), WT, and KO mice was amplified with primers that detect rearrangements both Vβ5 and Vβ8. Data are representative of three replicates.
-
Figure 5—figure supplement 3—source data 1
The gel of CD14 gene.
Lines 1–8: 1: marker; 2: H2O; 3: WT; 4: Rag2−/−; 5: WT DN3; 6: KO DN3; 7: WT DN4; 8: KO DN4.
- https://cdn.elifesciences.org/articles/75508/elife-75508-fig5-figsupp3-data1-v2.zip
-
Figure 5—figure supplement 3—source data 2
The gel of TCR Vb5.
Lines 1–6: 1: marker; 2: H2O; 3: WT; 4: Rag2−/−; 5: WT DN3; 6: KO DN3.
- https://cdn.elifesciences.org/articles/75508/elife-75508-fig5-figsupp3-data2-v2.zip
-
Figure 5—figure supplement 3—source data 3
The gel of TCR Vb8.
Lines 1–6: 1: marker; 2: H2O; 3: WT; 4: Rag2−/−; 5: WT DN3; 6: KO DN3.
- https://cdn.elifesciences.org/articles/75508/elife-75508-fig5-figsupp3-data3-v2.zip
Figure 5—figure supplement 4
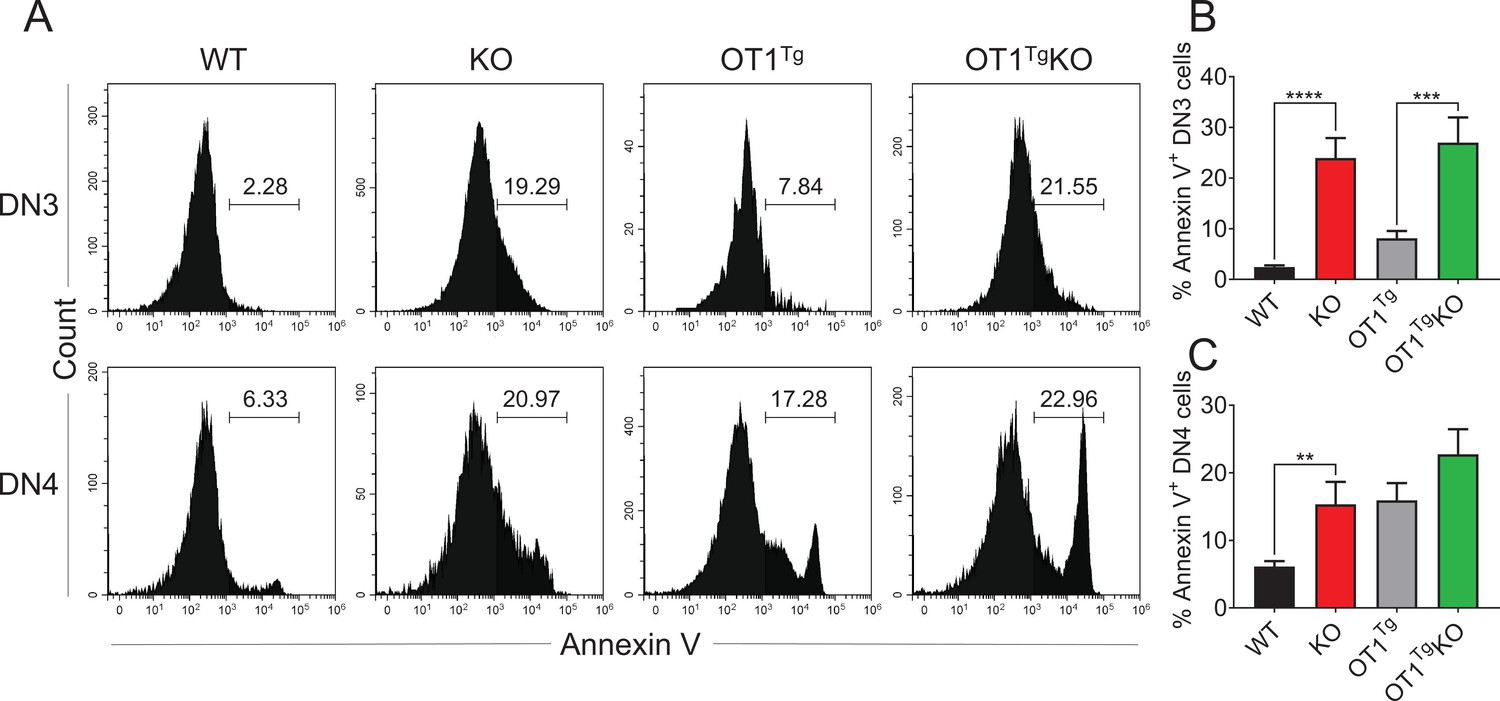
TCRβ overexpression could not rescue the increased DN cell apoptosis caused by Zfp335 deficiency.
(A) Representative FACS plots of Annexin V expression in DN3 and DN4 thymocytes from WT, KO, OT1Tg, and OT1Tg KO mice. (B, C) The percentages of Annexin V+ DN3 and DN4 cells in each group in (A). Results shown represent three independent experiments. **p < 0.01, ***p < 0.001, and ****p < 0.0001.
-
Figure 5—figure supplement 4—source data 1
Figure 5—figure supplement 4B, C. The percentages of Annexin V+ DN3 and DN4 cells in WT, KO, OT1Tg, and OT1Tg KO mice.
- https://cdn.elifesciences.org/articles/75508/elife-75508-fig5-figsupp4-data1-v2.xlsx
Figure 5—figure supplement 5
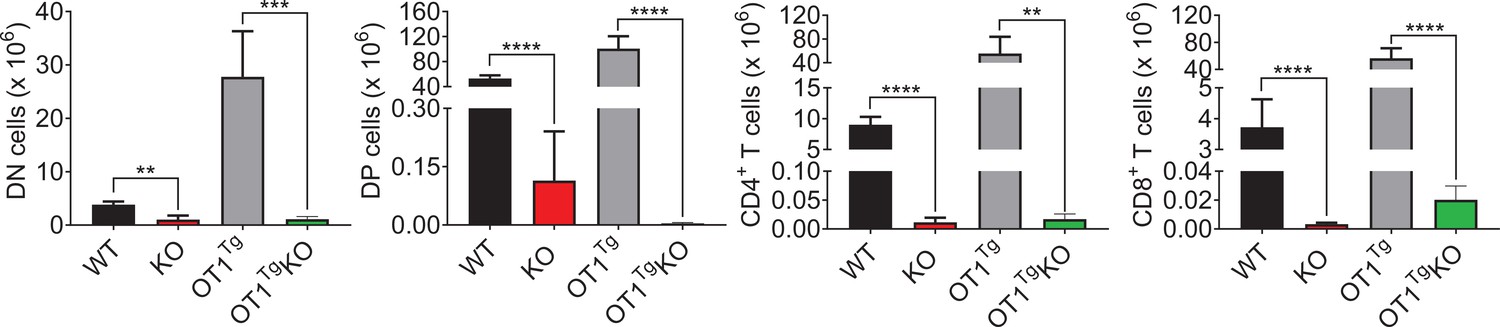
OT1Tg failed to rescue thymocyte numbers.
The numbers of DN, DP, CD4+CD8−, and CD4−CD8+ thymocytes in WT, KO, OT1Tg, and OT1Tg KO mice were measured (WT n = 3; KO n = 5; OT1Tg n = 3; OT1Tg KO n = 5). **p < 0.01, ***p < 0.001, and ****p < 0.0001.
-
Figure 5—figure supplement 5—source data 1
Figure 5—figure supplement 5. The numbers of DN, DP, CD4+, and CD8+ thymocytes in WT, KO, OT1Tg, and OT1Tg KO mice.
- https://cdn.elifesciences.org/articles/75508/elife-75508-fig5-figsupp5-data1-v2.xlsx
Figure 6 with 2 supplements

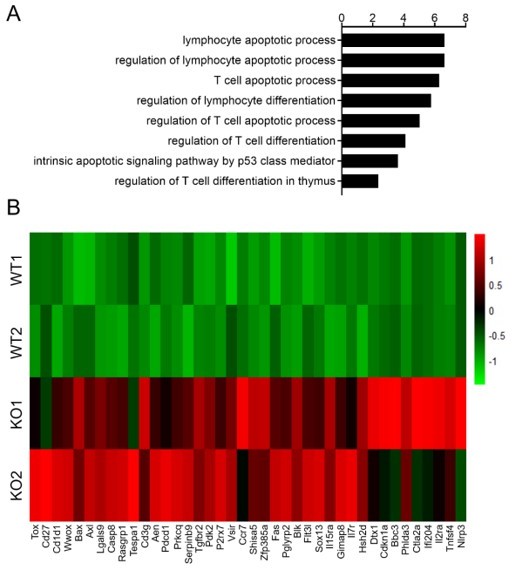
Zfp335 downstream target analysis in DN4 thymocytes.
(A) Volcano plot depicting log2 (fold change) (x-axis) and −log10 (p value) (y-axis) for differentially expressed genes (FC >1.25, p < 0.05) in DN4 thymocytes sorted from WT and KO mice; upregulated (red) and downregulated (blue). n = 2 per group. (B) Gene ontology (GO) analysis of genes that downregulated in Zfp335-deficient DN4 thymocytes, showing the GO terms related to lymphocyte differentiation and apoptosis (left), the number of genes overlapped with database from the indicated terms (middle left column), p values (middle column) and Q values (middle right column) and genes annotated to the indicated term (right). (C) Heatmap of representative genes related to lymphocyte differentiation and apoptosis. The scale ranges from minimum (green boxes) to medium (black boxes) to maximum (red boxes) relative expression. (D) The mRNA level of Bcl6 (top) and Rorc (bottom) in DN4 thymocytes from WT and KO mice (n = 3). (E) ChIP-seq analysis for binding of Zfp335 to the Bcl6 and Rorc loci in wild-type DN4 cells. (F) Luciferase assay for the binding of different domains of Zfp335 to the promoter regions of Bcl6 and Rorc. The pGL4.16 plasmid was transfected into 293T cells together with MSCV vector carrying different domains (n = 3). Data represent three independent experiments. *p < 0.05, **p < 0.01, and ****p < 0.0001.
Figure 6—figure supplement 1
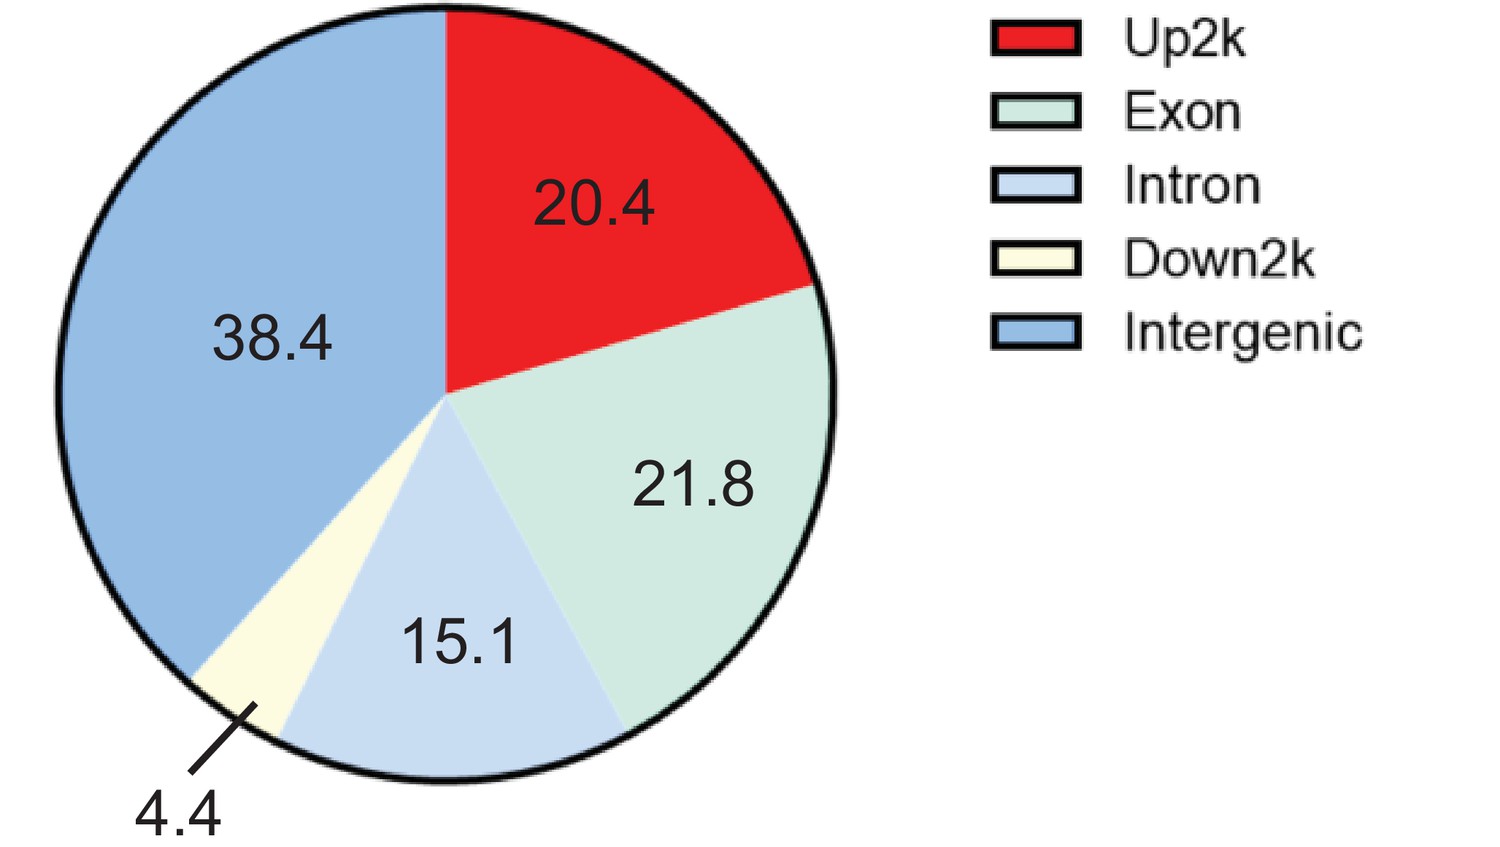
ChIP-seq analysis of Zfp335-binding sites.
The distribution of Zfp335-binding peaks in various regions of the genome was calculated.
Figure 6—figure supplement 2
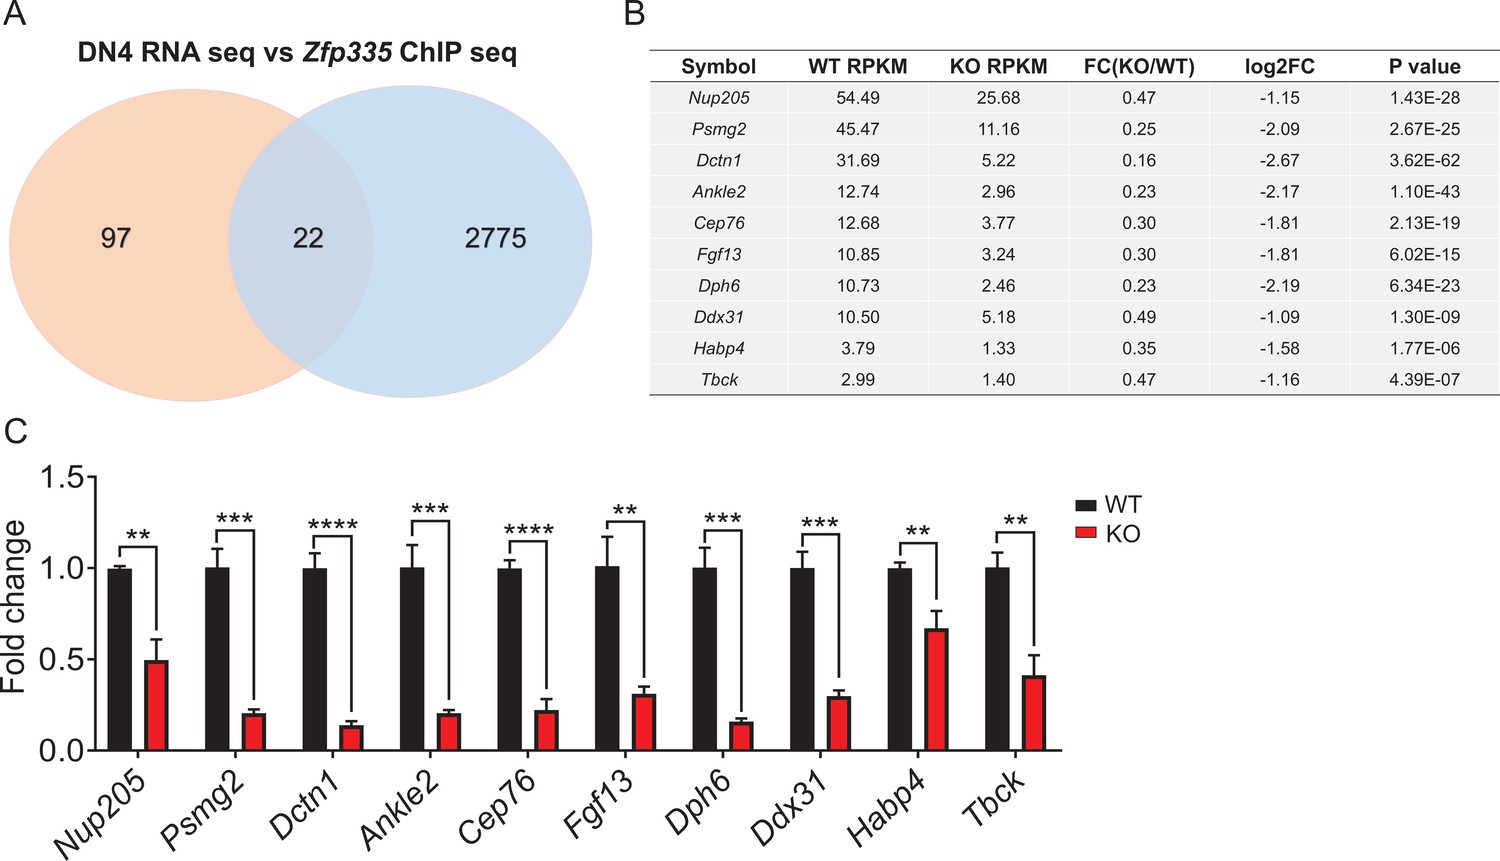
The intersection analysis of Zfp335 by RNA- and ChIP-seq.
(A) Venn diagram depicting the overlapping portion of differentially expressed genes in RNA-seq (red) and Zfp335-binding regions in ChIP-seq (blue). One hundred and nineteen profoundly downregulated genes from RNA-seq were selected out by a cutoff of twofold change. (B) The shared top 10 overlapped genes from the RNA- and ChIP-seq. (C) qPCR analysis of the top 10 overlapped genes depicted in (B). **p < 0.01, ***p<0.001 and ****p < 0.0001.
Figure 7 with 3 supplements

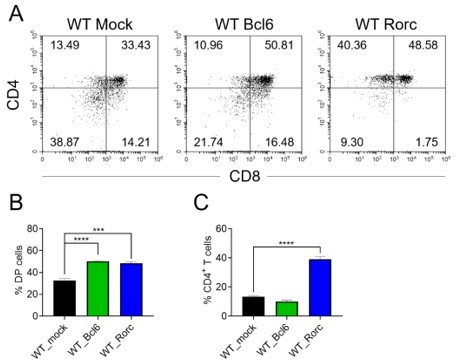
Identification of Bcl6 and Rorc as functional targets of Zfp335 for regulating thymocyte development.
(A) Schematic overview of the in vitro gene overexpression in KO DN3 thymocytes and following T-cell differentiation in OP9-DL1 coculture system. (B, C) Zfp335-deficient DN3 thymocytes (KO) were cultured with OP9-DL1 feeder cells in vitro, then transduced with either Mock, Zfp335-, Bcl6-, or Rorc-overexpressing vector for 3.5 days. The different stages of thymocyte development from GFP-positive cells were measured by flow cytometry (n = 3). (B) Representative FACS plots of DN and DP thymocytes from the indicated groups. (C) The percentage of DP thymocytes from GFP-positive cells. (D–G) KO DN3 thymocytes were cultured with OP9-DL1 feeder cells in vitro, then transduced with either Mock, Zfp335-, Bcl6-, or Rorc-overexpressing vector for 3.5 days. The expressions of Annexin V in DN and DP thymocytes were measured by flow cytometry (n = 3). (D) Representative FACS plots of Annexin V+ DN thymocytes from the indicated groups. (E) The percentage of Annexin V+ DN thymocytes from GFP-positive cells. (F) Representative FACS plots of Annexin V+ DP thymocytes from the indicated groups. (G) The percentage of Annexin V+ DP thymocytes from GFP-positive cells. Results shown represent three independent experiments. **p < 0.01, ***p < 0.001, and ****p < 0.0001.
-
Figure 7—source data 1
Figure 7C. The percentages of DP cells differentiated from KO DN3 thymocytes transduced with Mock, or Zfp335, Bcl6, and Rorc genes.
- https://cdn.elifesciences.org/articles/75508/elife-75508-fig7-data1-v2.xlsx
Figure 7—figure supplement 1
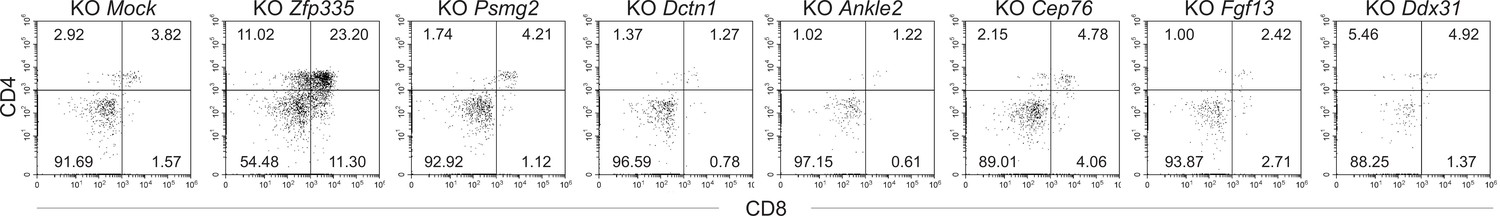
Identification of the top 10 overlapped genes in KO DN3 thymocytes for the regulation of thymocyte development.
Zfp335 deficiency DN3 thymocytes (KO) were cultured with OP9-DL1 feeder cells in vitro, then transduced with the top 10 overlapped genes overexpression vector for 3.5 days. The different stages of thymocyte development were measured by flow cytometry.
Figure 7—figure supplement 2
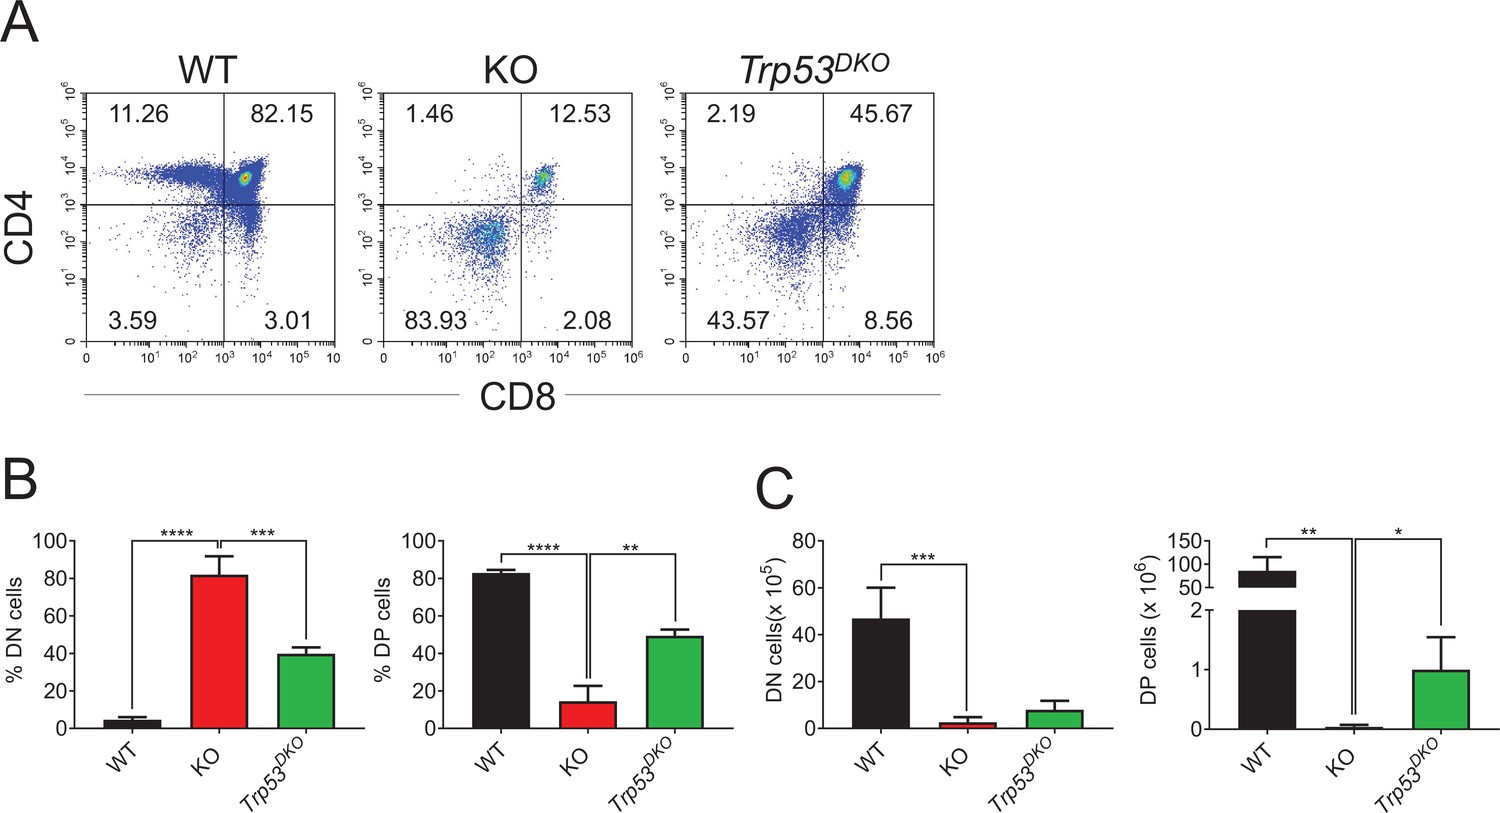
Examination of Trp53 as the target of Zfp335 during the regulation of thymocyte development.
Thymi from WT, KO, and Trp53KOLckCre+Zfp335fl/fl (Trp53DKO) mice were harvested. The different stages of thymocyte development in WT, KO, and Trp53DKO mice were measured by flow cytometry (WT n = 4; KO n = 4; Trp53DKO n = 3). (A) Representative FACS plots of thymocytes. (B) The percentages of DN, DP, CD4+CD8−, and CD4−CD8+ thymocytes. (C) The numbers of DN, DP, CD4+CD8−, and CD4−CD8+ thymocytes. Data are representative of at least three independent experiments shown as the mean ± standard error of the mean (SEM). Two-tailed, unpaired t-tests were used for statistical analyses; *p < 0.05, **p < 0.01, ***p < 0.001, and ****p < 0.0001.
-
Figure 7—figure supplement 2—source data 1
Figure 7—figure supplement 2B, C. The percentages and numbers of DN, DP, CD4+, and CD8+ thymocytes from WT, KO, and Trp53DKO mice.
- https://cdn.elifesciences.org/articles/75508/elife-75508-fig7-figsupp2-data1-v2.xlsx
Figure 7—figure supplement 3
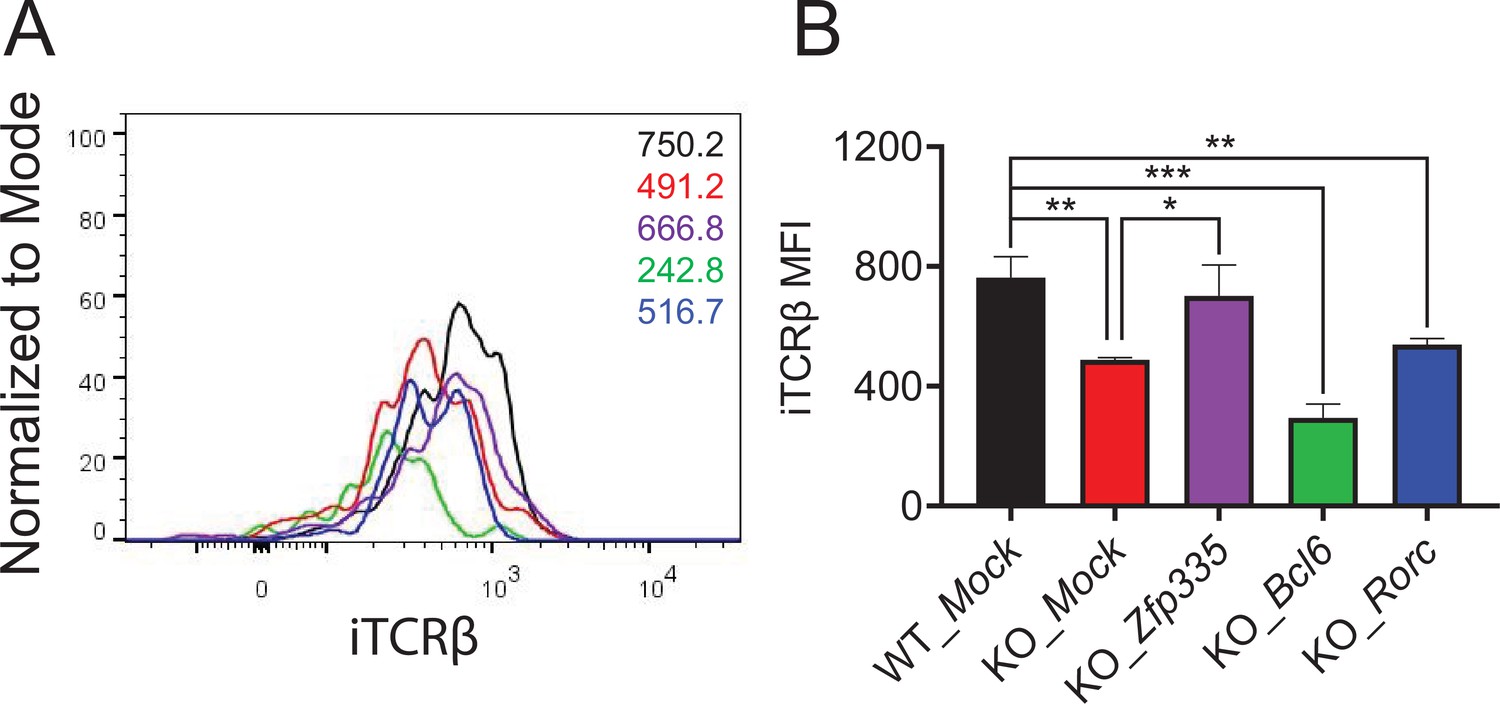
Intracellular TCRβ (iTCRβ) expression in DN4 cells infected by Zfp335, Bcl6, and Rorc overexpression retrovirus.
WT and Zfp335 KO DN3 cells were isolated and infected with Mock (WT and KO), Zfp335, Bcl6, and Rorc (KO) overexpression retrovirus. Three days later, iTCRβ expression was examined. Histogram plot (A) and mean fluorescence intensity (MFI) (B) of iTCRβ expression in each group (n = 3). *p < 0.05, **p < 0.01, and ***p < 0.001.
-
Figure 7—figure supplement 3—source data 1
Figure 7—figure supplement 3. iTCRβ expression in DN4 cells infected by Zfp335, Bcl6, and Rorc overexpression retrovirus.
- https://cdn.elifesciences.org/articles/75508/elife-75508-fig7-figsupp3-data1-v2.xlsx
Author response image 1
Author response image 2
Tables
Key resources table
| Reagent type (species) or resource | Designation | Source or reference | Identifiers | Additional information |
|---|---|---|---|---|
| Genetic reagent (M. musculus) | C57BL/6J background | Jackson Laboratory | Stock No. 000664 | |
| Genetic reagent (M. musculus) | C57BL/6-Zfp335tm1Caw | Jackson Laboratory | Stock No. 022413 | |
| Genetic reagent (M. musculus) | C57BL/6-Tg(TcraTcrb)1,100Mjb/J | Jackson Laboratory | Stock No. 003831 | Common Name: OT-1 |
| Genetic reagent (M. musculus) | B6.Cg-Tg(Lck-cre)548Jxm/J | Jackson Laboratory | Stock No. 003802 | |
| Genetic reagent (M. musculus) | C3Ou.129S2(B6)-Trp53tm1Tyj/J | Jackson Laboratory | Stock No. 002547 | |
| Antibody | anti-mouse CD4 APC/Cyanine7 (Rat monoclonal) | Biolegend | Cat# 100414; RRID:AB_312699 | cell surface staining 1:400 |
| Antibody | anti-mouse CD8a PE (Rat monoclonal) | Biolegend | Cat# 100708; RRID:AB_312747 | cell surface staining 1:400 |
| Antibody | anti-mouse CD8a Pacific Blue (Rat monoclonal) | Biolegend | Cat# 100725; RRID:AB_493425 | cell surface staining 1:400 |
| Antibody | anti-mouse CD8a PE/Cyanine7 (Rat monoclonal) | Biolegend | Cat# 100722; RRID:AB_312761 | cell surface staining 1:400 |
| Antibody | anti-mouse TCR Vβ5.1, 5.2 PE (Mouse monoclonal) | Biolegend | Cat# 139504, RRID:AB_10613279 | cell surface staining 1:400 |
| Antibody | anti-mouse TCR Vβ6 PE (Rat monoclonal) | Biolegend | Cat# 140004; RRID:AB_10643583 | cell surface staining 1:400 |
| Antibody | anti-mouse TCR Vβ8.1, 8.2 PE (Mouse monoclonal) | Biolegend | Cat# 140104; RRID:AB_10639942 | cell surface staining 1:400 |
| Antibody | anti-mouse TCR Vβ12 PE (Mouse monoclonal) | Biolegend | Cat# 139704; RRID:AB_10639729 | cell surface staining 1:400 |
| Antibody | anti-mouse TCR β chain APC/Cyanine7 (Armenian Hamster monoclonal) | Biolegend | Cat# 109220; RRID:AB_893624 | cell surface staining 1:400 |
| Antibody | anti-mouse TCR β chain PE/Cyanine5 (Armenian Hamster monoclonal) | Biolegend | Cat# 109210; RRID:AB_313433 | cell surface staining 1:400 |
| Antibody | anti-mouse TCR β chain PE/Cyanine7 (Armenian Hamster monoclonal) | Biolegend | Cat# 109222; RRID:AB_893625 | cell surface staining 1:400 |
| Antibody | anti-mouse TCR γ/δ FITC (Armenian Hamster monoclonal) | Biolegend | Cat# 118106; RRID:AB_313830 | cell surface staining 1:400 |
| Antibody | anti-mouse TCR γ/δ PerCP/Cyaninne5.5 (Armenian Hamster monoclonal) | Biolegend | Cat# 118118; RRID:AB_10612756 | cell surface staining 1:400 |
| Antibody | anti-mouse TCR γ/δ APC (Armenian Hamster monoclonal) | Biolegend | Cat# 118116; RRID:AB_1731813 | cell surface staining 1:400 |
| Antibody | anti-mouse/human CD44 PE/Cyanine7 (Rat monoclonal) | Biolegend | Cat# 103030; RRID:AB_830787 | cell surface staining 1:400 |
| Antibody | anti-mouse CD25 PE (Rat monoclonal) | Biolegend | Cat# 102008; RRID:AB_312857 | cell surface staining 1:400 |
| Antibody | anti-mouse CD25 PE/Cyanine5 (Rat monoclonal) | Biolegend | Cat# 102010; RRID:AB_312859 | cell surface staining 1:400 |
| Antibody | anti-mouse CD4 FITC (Rat monoclonal) | Biolegend | Cat# 100510; RRID:AB_312713 | cell surface staining 1:400 |
| Antibody | anti-mouse CD8a FITC (Rat monoclonal) | Biolegend | Cat# 100706; RRID:AB_312745 | cell surface staining 1:400 |
| Antibody | anti-mouse TCR β chain FITC (Armenian Hamster monoclonal) | Biolegend | Cat# 109206; RRID:AB_313429 | cell surface staining 1:400 |
| Antibody | anti-mouse NK-1.1 FITC (Mouse monoclonal) | Biolegend | Cat# 108706; RRID:AB_313393 | cell surface staining 1:400 |
| Antibody | anti-mouse CD19 FITC (Rat monoclonal) | Biolegend | Cat# 115506; RRID:AB_313641 | cell surface staining 1:400 |
| Antibody | anti-mouse CD11b FITC (Rat monoclonal) | Biolegend | Cat# 101206; RRID:AB_312789 | cell surface staining 1:400 |
| Antibody | anti-mouse CD11c FITC (Armenian Hamster monoclonal) | Biolegend | Cat# 117306; RRID:AB_313775 | cell surface staining 1:400 |
| Antibody | anti-mouse TER-119/Erythroid Cells FITC (Rat monoclonal) | Biolegend | Cat# 116206; RRID:AB_313707 | |
| Antibody | anti-mouse TCR β chain Pacific Blue (Armenian Hamster monoclonal) | Biolegend | Cat# 109226; RRID:AB_1027649 | |
| Antibody | anti-mouse CD45.1 APC/Cy7 (Mouse monoclonal) | Biolegend | Cat# 110716; RRID:AB_313505 | cell surface staining 1:400 |
| Antibody | anti-mouse CD45.2 PE (Mouse monoclonal) | Biolegend | Cat# 109808; RRID:AB_313445 | |
| Antibody | anti-mouse CD45.2 APC (Mouse monoclonal) | Biolegend | Cat# 109814; RRID:AB_389211 | |
| Antibody | anti-mouse CD3 Pacific Blue (Armenian Hamster monoclonal) | Biolegend | Cat# 640918; RRID:AB_493645 | |
| Antibody | anti-mouse CD27 FITC (Armenian Hamster monoclonal) | Biolegend | Cat# 124208; RRID:AB_1236466 | |
| Antibody | anti-BrdU FITC (Mouse monoclonal) | Biolegend | Cat# 364104; RRID:AB_2564481 | |
| Antibody | anti-BrdU FITC (3D4) | Biolegend | Cat# 364104; RRID:AB_2564481 | |
| Antibody | anti-mouse Ki-67 PE (16A8) | Biolegend | Cat# 652404; RRID:AB_2561525 | |
| Antibody | Anti-Zfp335 antibody | Novus | Cat# NB100-2579 | |
| Peptide, recombinant protein | Annexin V Pacific Blue | Biolegend | Cat# 640918; RRID:AB_1279044 | |
| Peptide, recombinant protein | DNaseI | Solarbio | Cat# D8071 | |
| Commercial assay or kit | Fixation Buffer | Biolegend | Cat# 420,801 | |
| Commercial assay or kit | Intracellular Staining Permeabilization Wash Buffer (10×) | Biolegend | Cat# 421,002 | |
| Commercial assay or kit | MojoSort Streptavidin Nanobeads | Biolegend | Cat# 480,016 | |
| Commercial assay or kit | Fixation/Permeabilization Solution Kit with BD GolgiPlug | BD biosciences | Cat# 555,028 | |
| Commercial assay or kit | One-Day Chromatin Immunoprecipitation Kits | MILLIPORE | Cat# 17-10085 | |
| Commercial assay or kit | Quick-RNA MicroPrep Kit | QIAGEN | Cat# R1051 | |
| Commercial assay or kit | Fixation Buffer | Biolegend | Cat# 420,801 | |
| Software, algorithm | FlowJo software v10.7 | FlowJo LLC | https://www.flowjo.com/; RRID:SCR_008520 | |
| Software, algorithm | GSEA | Broad Institute | https://www.broadinstitute.org/gsea; RRID:SCR_003199 | |
| Software, algorithm | Prism8 (v8.1.0) | GraphPad Software | https://www.graphpad.com/ | |
| Software, algorithm | RStudio | RStudio | https://rstudio.com/; RRID: SCR_000432 | |
Additional files
-
Supplementary file 1
Summary for down- and upregulated genes induced by Zfp335 deficiency.
- https://cdn.elifesciences.org/articles/75508/elife-75508-supp1-v2.xlsx
-
Supplementary file 2
ChIP-seq analysis of Zfp335-binding peaks in DN thymocytes.
- https://cdn.elifesciences.org/articles/75508/elife-75508-supp2-v2.xlsx
-
Supplementary file 3
Overlay analysis between downregulated genes from RNA-seq data and Zfp335-binding genes from ChIP-seq data.
- https://cdn.elifesciences.org/articles/75508/elife-75508-supp3-v2.xlsx
-
Supplementary file 4
Primers used for quantitative PCR.
- https://cdn.elifesciences.org/articles/75508/elife-75508-supp4-v2.xlsx
-
Transparent reporting form
- https://cdn.elifesciences.org/articles/75508/elife-75508-transrepform1-v2.docx
Download links
A two-part list of links to download the article, or parts of the article, in various formats.
Downloads (link to download the article as PDF)
Open citations (links to open the citations from this article in various online reference manager services)
Cite this article (links to download the citations from this article in formats compatible with various reference manager tools)
Zinc finger protein Zfp335 controls early T-cell development and survival through β-selection-dependent and -independent mechanisms
eLife 11:e75508.
https://doi.org/10.7554/eLife.75508


