Active site geometry stabilization of a presenilin homolog by the lipid bilayer promotes intramembrane proteolysis
- German Center for Neurodegenerative Diseases, Germany
- Center of Functional Protein Assemblies and Physics Department T38, Technical University of Munich, Germany
- Department of Pharmacotherapeutics II, Osaka Medical and Pharmaceutical University, Japan
- Institute for Diabetes and Obesity, Monoclonal Antibody Core Facility, Helmholtz Munich, German Research Center for Environmental Health, Germany
- Biomedical Center (BMC), Division of Metabolic Biochemistry, Faculty of Medicine, Germany
Figures
Figure 1 with 1 supplement
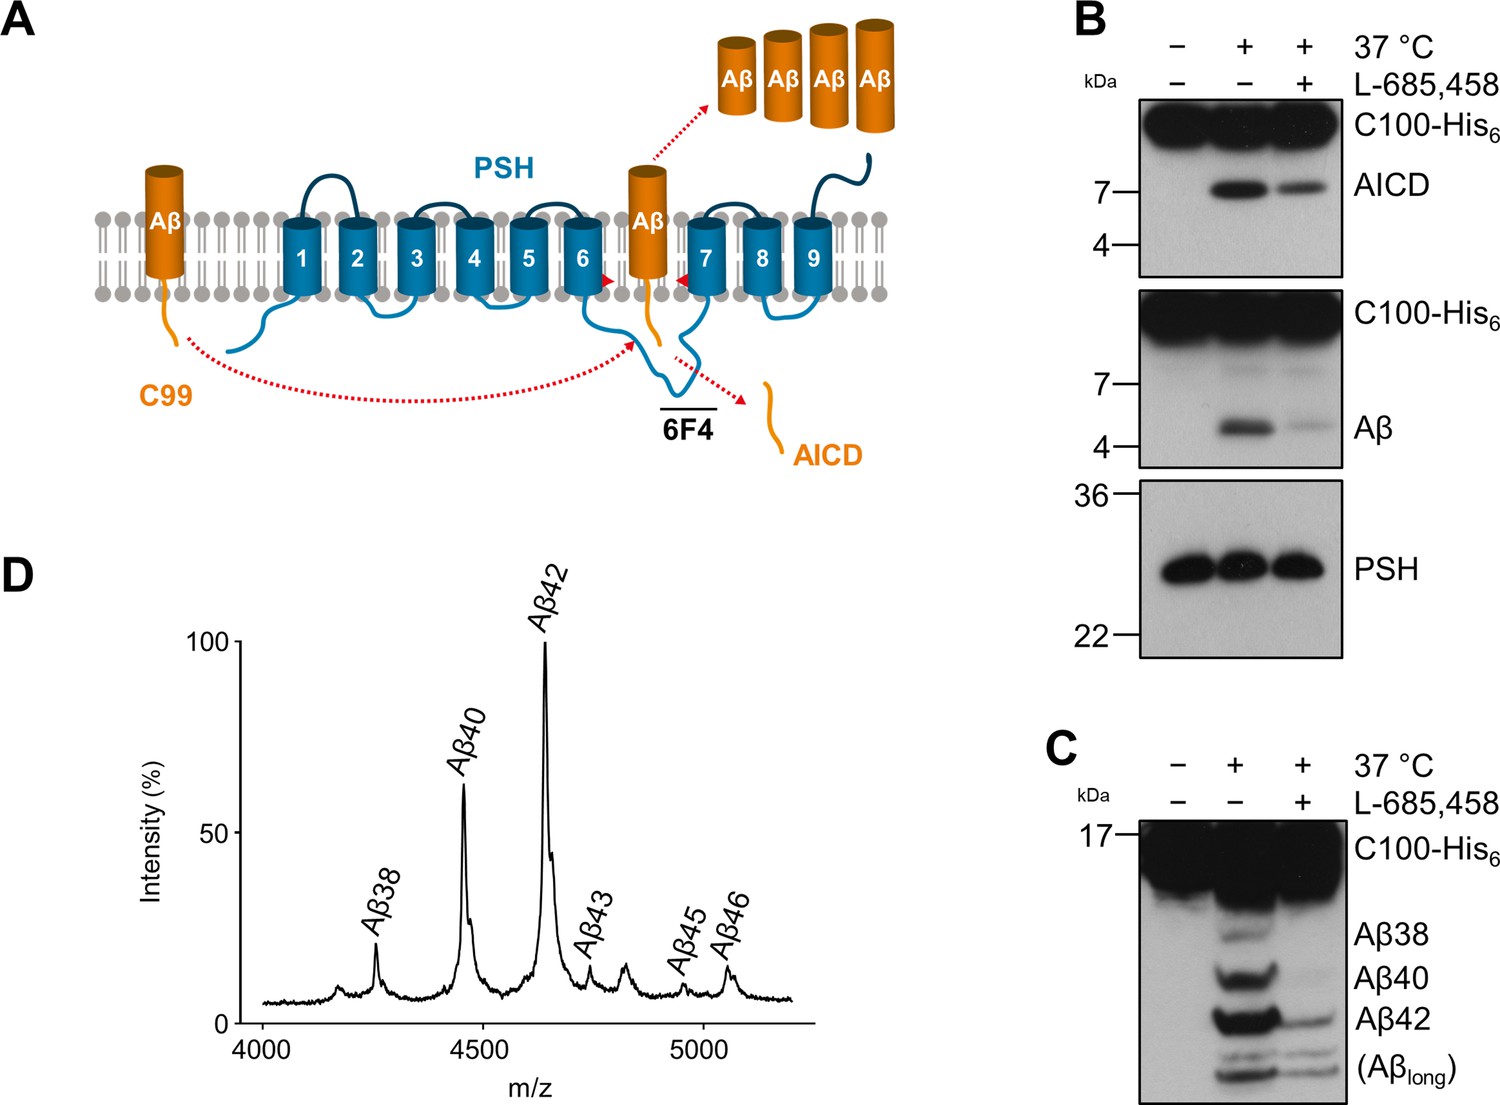
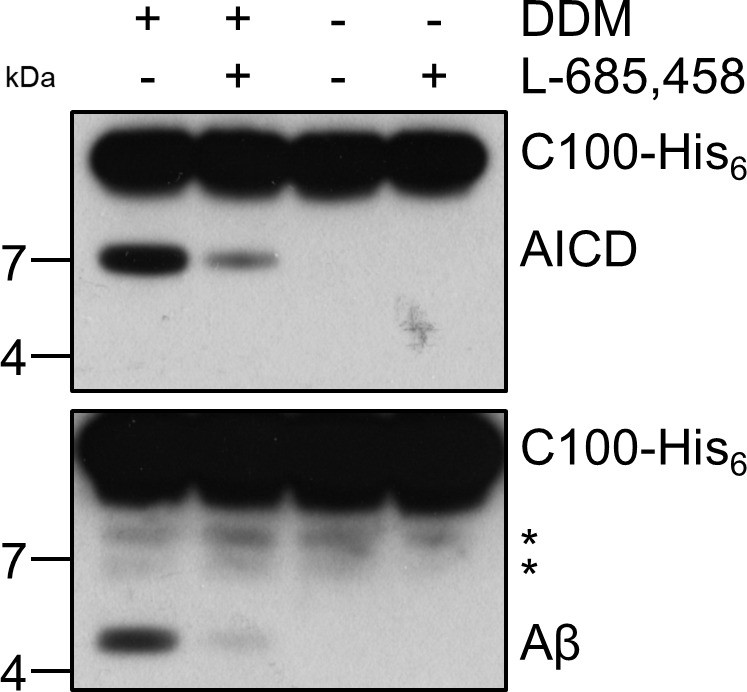
Cleavage of APP C99 by PSH.
(A) Schematic illustration of APP C99 cleavage by PSH. PSH cleaves C99 and releases an AICD fragment and Aβ peptides. The epitope of the PSH specific antibody 6F4 in the loop between TMD6 and TMD7 is indicated. (B) Analysis of PSH activity in DDM micelles after incubation with C100-His6 substrate overnight at 37 °C by immunoblotting for AICD (Y188) and Aβ (2D8). Specificity of substrate cleavage by PSH in the assay was controlled by sample incubation at 4 °C or 37 °C in presence of the GSI L-685,458 (20 µM). Immunoblotting of PSH (6F4) was performed to control for PSH levels. (C) Aliquot of samples from (B) separated by Tris-Bicine urea SDS-PAGE for identifying Aβ species produced by PSH in DDM micelles and analysis by immunoblotting (2D8). In (B) and (C), representative immunoblots from three to six independent biological replicates (i.e. independent protease preparations) are shown. (D) Representative MALDI-TOF MS spectrum of Aβ profile generated by PSH in DDM micelles from four independent biological replicates. The intensity of the highest peak was set to 100%. A GSI control is shown in Figure 1—figure supplement 1 and observed masses for identified Aβ species are shown in Figure 1—source data 1.
-
Figure 1—source data 1
Immunoblot images (raw and annotated) of cleavage assay (Source data for Figure 1B, C).
- https://cdn.elifesciences.org/articles/76090/elife-76090-fig1-data1-v2.zip
-
Figure 1—source data 2
Calculated and observed masses for Aβ species in MALDI-TOF mass spectrometry (Source data for Figure 1D).
- https://cdn.elifesciences.org/articles/76090/elife-76090-fig1-data2-v2.xlsx
Figure 1—figure supplement 1
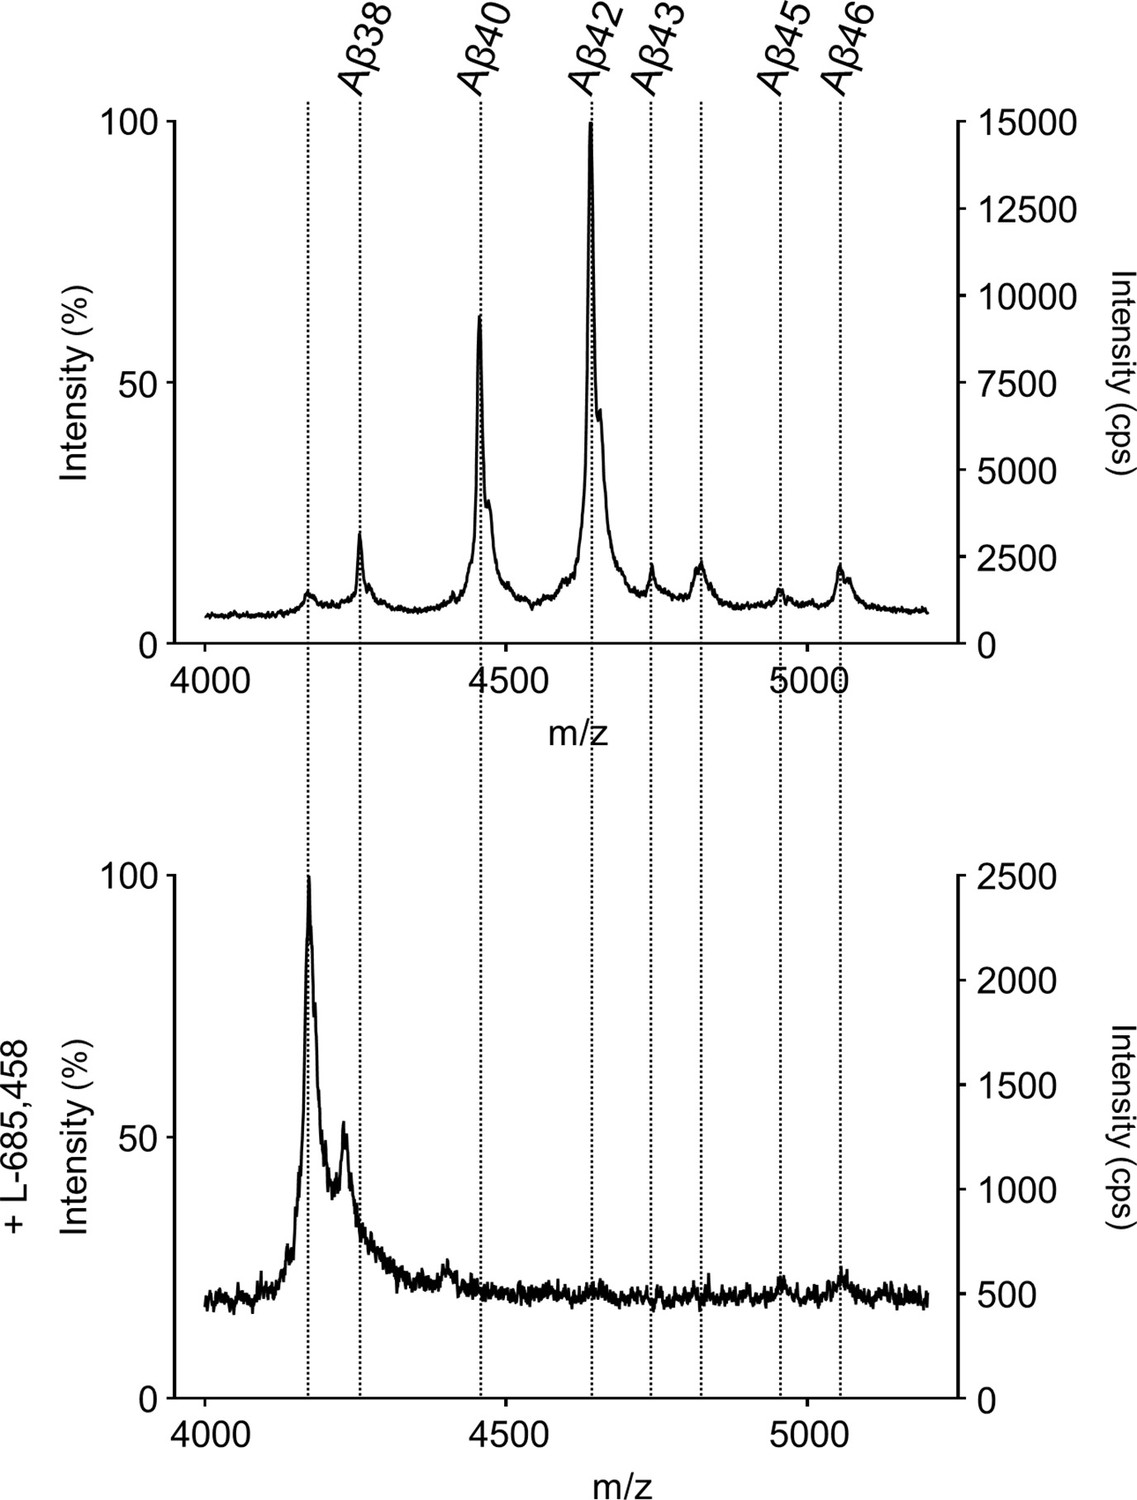
MS specificity control for Aβ cleavage products generated from APP C99 by PSH.
Representative MALDI-TOF MS spectrum of PSH cleavage assay in DDM micelles in the presence of L-685,458 from four independent biological replicates. The intensity of the highest peak was set to 100%.
Figure 2 with 2 supplements
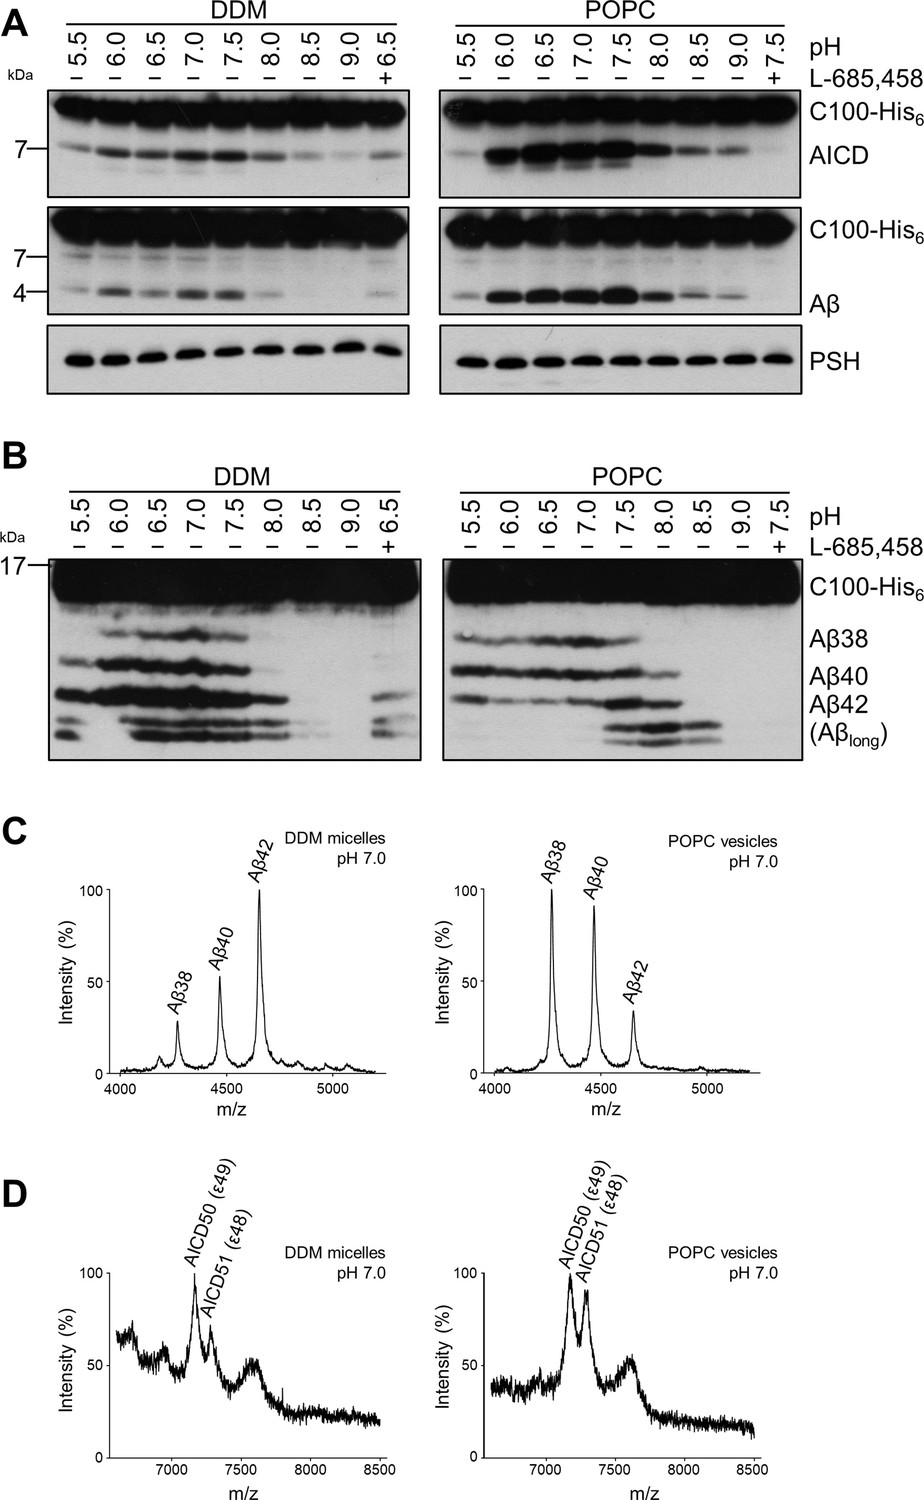
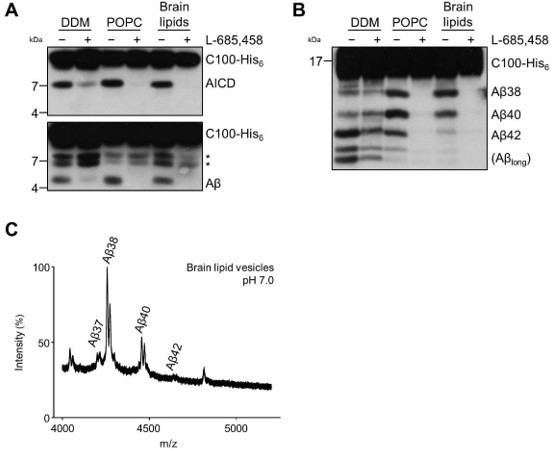
Comparison of PSH cleavage activity and processivity in DDM micelles and POPC bilayer.
(A) Analysis of PSH activity in DDM micelles and POPC vesicles after incubation with C100-His6 substrate at 37 °C overnight by immunoblotting for AICD (Y188) and Aβ (2D8). Immunoblotting of PSH (6F4) was performed to control for PSH levels. (B) Separation of Aβ species produced by PSH in DDM micelles and POPC vesicles by Tris-Bicine urea SDS-PAGE and analysis by immunoblotting for Aβ (2D8). In (A) and (B), representative immunoblots from six independent biological replicates are shown. Confirmation of PSH reconstitution in POPC SUVs is shown in Figure 2—figure supplement 1. (C, D) MALDI-TOF MS analysis of Aβ (C) and AICD (D) species generated by PSH in DDM micelles and POPC vesicles at pH 7.0. Representative mass spectra from four independent biological replicates are shown. The intensity of the highest peak was set to 100%. GSI controls are shown in Figure 2—figure supplement 2 and observed masses for identified Aβ and AICD species are shown in Figure 2—source data 1.
-
Figure 2—source data 1
Immunoblot images (raw and annotated) of cleavage assays (Source data for Figure 2A, B).
- https://cdn.elifesciences.org/articles/76090/elife-76090-fig2-data1-v2.zip
-
Figure 2—source data 2
Calculated and observed masses for Aβ, and AICD species in MALDI-TOF mass spectrometry (Source data for Figure 2C and D).
The differences between calculated and observed masses for AICD species arise from different adducts as specified in the respective tables. The GSI controls in Figure 2—figure supplement 2B show that the observed peaks are specific for AICD species derived from PSH cleavage.
- https://cdn.elifesciences.org/articles/76090/elife-76090-fig2-data2-v2.xlsx
Figure 2—figure supplement 1
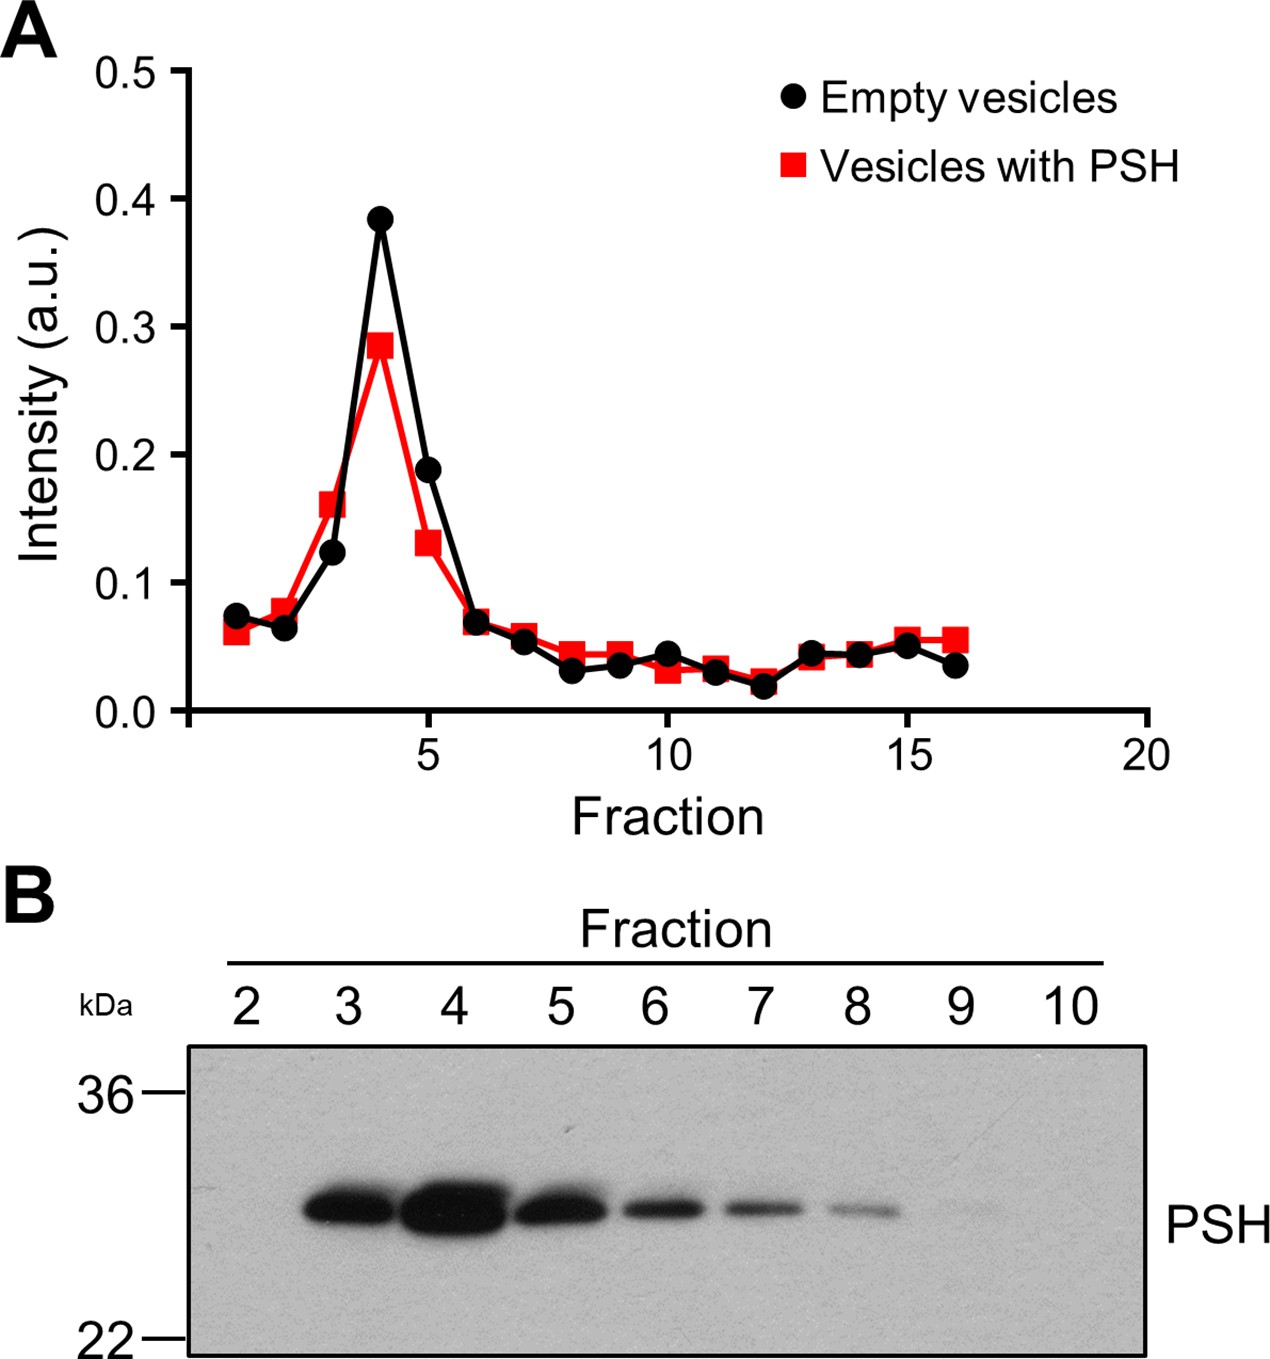
Reconstitution of PSH in POPC vesicles.
(A) Fluorometric analysis of gel filtration fractions of PSH-containing POPC vesicles with rhodamine-DHPE as fluorescent marker lipid. A representative graph from three independent biological replicates is shown. (B) Analysis of gel filtration fractions by immunoblotting for PSH (6F4). A representative immunoblot from three independent biological replicates is shown.
-
Figure 2—figure supplement 1—source data 1
Raw values of measured fluorescence intensity (Source data for Figure 2—figure supplement 1A).
- https://cdn.elifesciences.org/articles/76090/elife-76090-fig2-figsupp1-data1-v2.xlsx
-
Figure 2—figure supplement 1—source data 2
Immunoblot images (raw and annotated) of PSH reconstitution (Source data for Figure 2—figure supplement 1B).
- https://cdn.elifesciences.org/articles/76090/elife-76090-fig2-figsupp1-data2-v2.zip
Figure 2—figure supplement 2
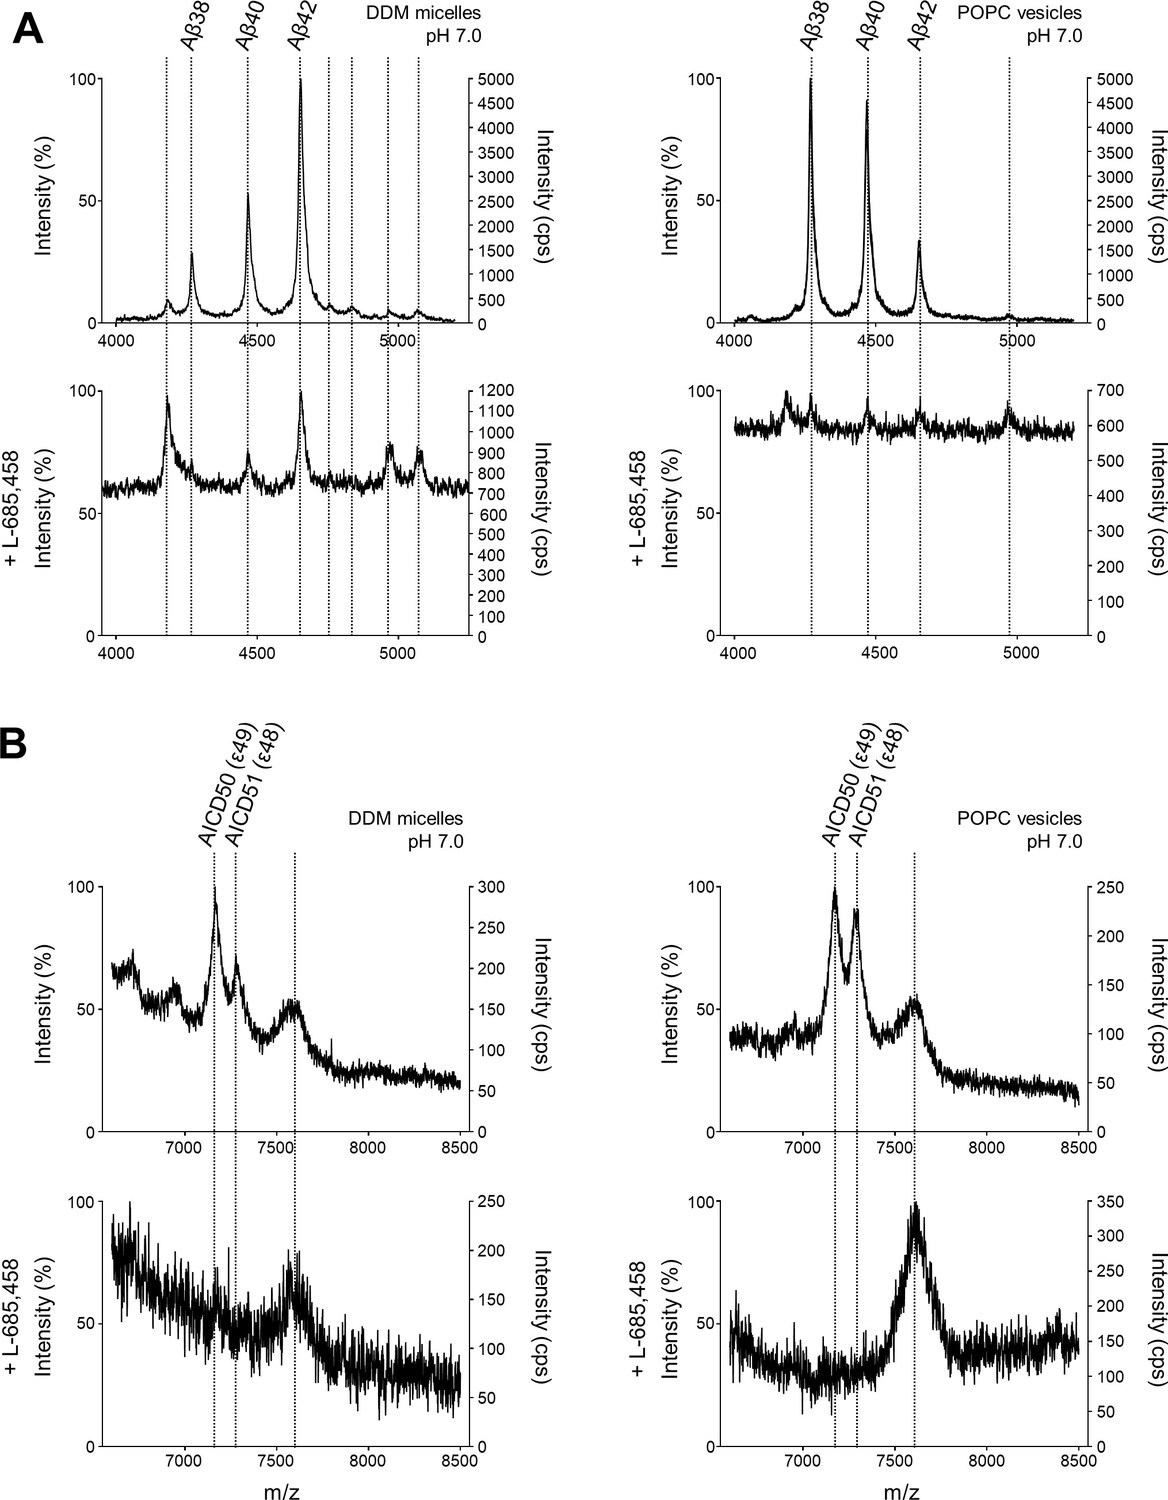
MS specificity controls for Aβ and AICD cleavage products generated from APP C99 by PSH.
(A, B) MALDI-TOF MS analysis of Aβ (A) and AICD (B) species from PSH cleavage assays in DDM micelles and POPC vesicles in the presence of L-685–458 at pH 7.0. Representative mass spectra from four independent biological replicates are shown. The intensity of the highest peak was set to 100%.
Figure 3
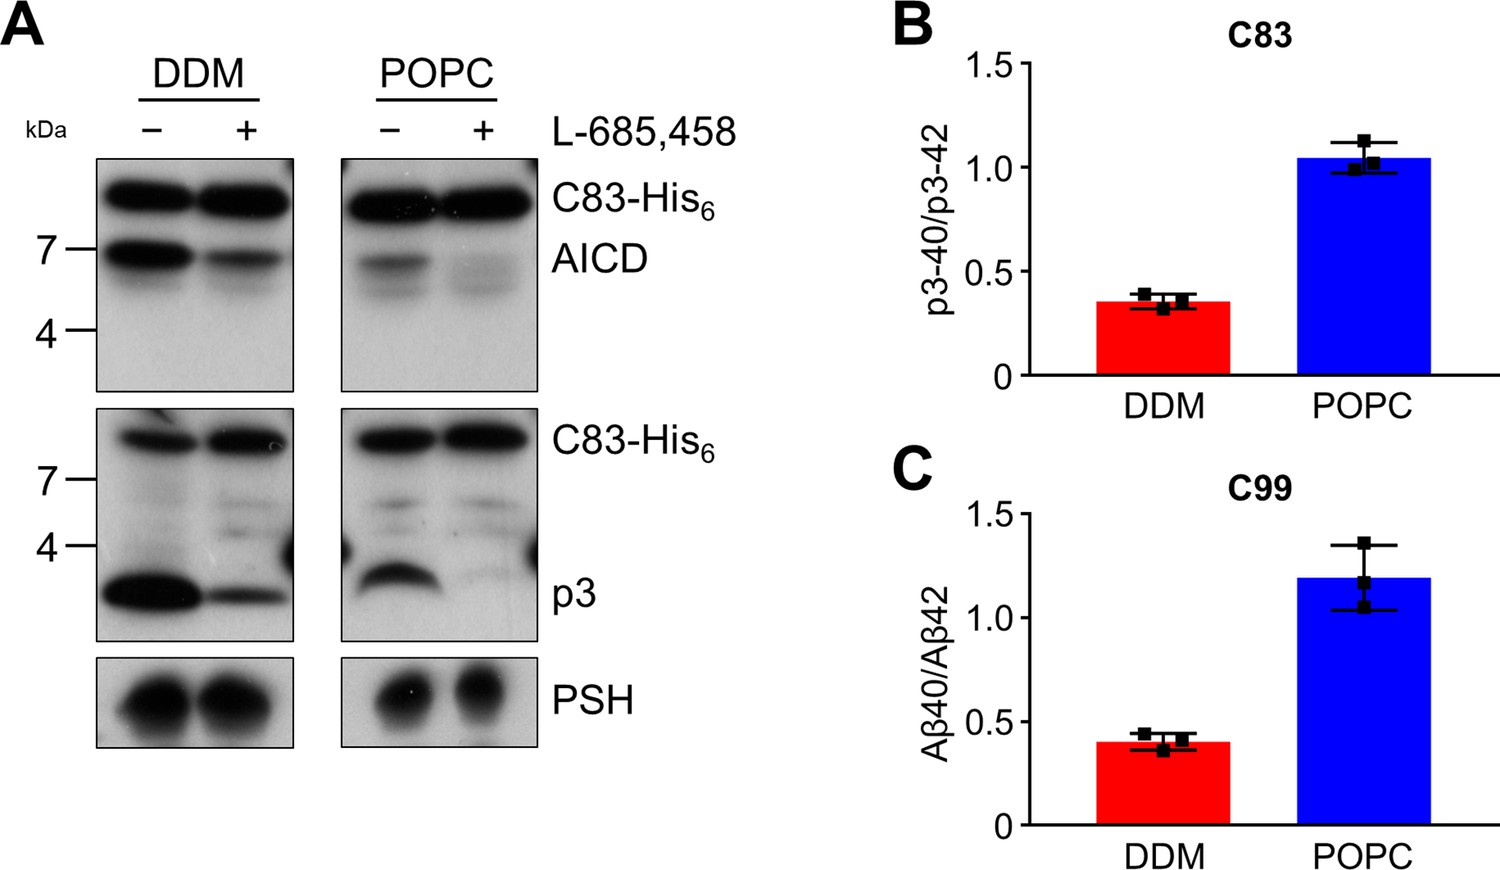
Cleavage of APP C83 by PSH.
(A) Analysis of PSH activity in DDM and POPC environment after incubation with C83-His6 and C100-His6 substrates at 37 °C and pH 7.0 by immunoblotting for AICD (penta-His) and p3 (Aβ (22-35)). Immunoblotting of PSH (6F4) was performed to control for PSH levels. (B, C) p3-40/p3-42 ratio (B) and Aβ40/Aβ42 ratio (C) from PSH activity assays in DDM (red) and POPC (blue) environment analyzed by ECL-IA. Quantitative data are represented as mean ± standard deviation (SD) (n=3 biological replicates). Source data are shown in Figure 3—source data 1.
-
Figure 3—source data 1
Immunoblot images (raw and annotated) of cleavage assays (Source data for Figure 3A).
- https://cdn.elifesciences.org/articles/76090/elife-76090-fig3-data1-v2.zip
-
Figure 3—source data 2
Raw values of p3 and Aβ concentrations measured in the ECL-IA and calculated p3-40/p3-42 and Aβ40/Aβ42 ratios (Source data for Figure 3B, C).
- https://cdn.elifesciences.org/articles/76090/elife-76090-fig3-data2-v2.xlsx
Figure 4 with 2 supplements
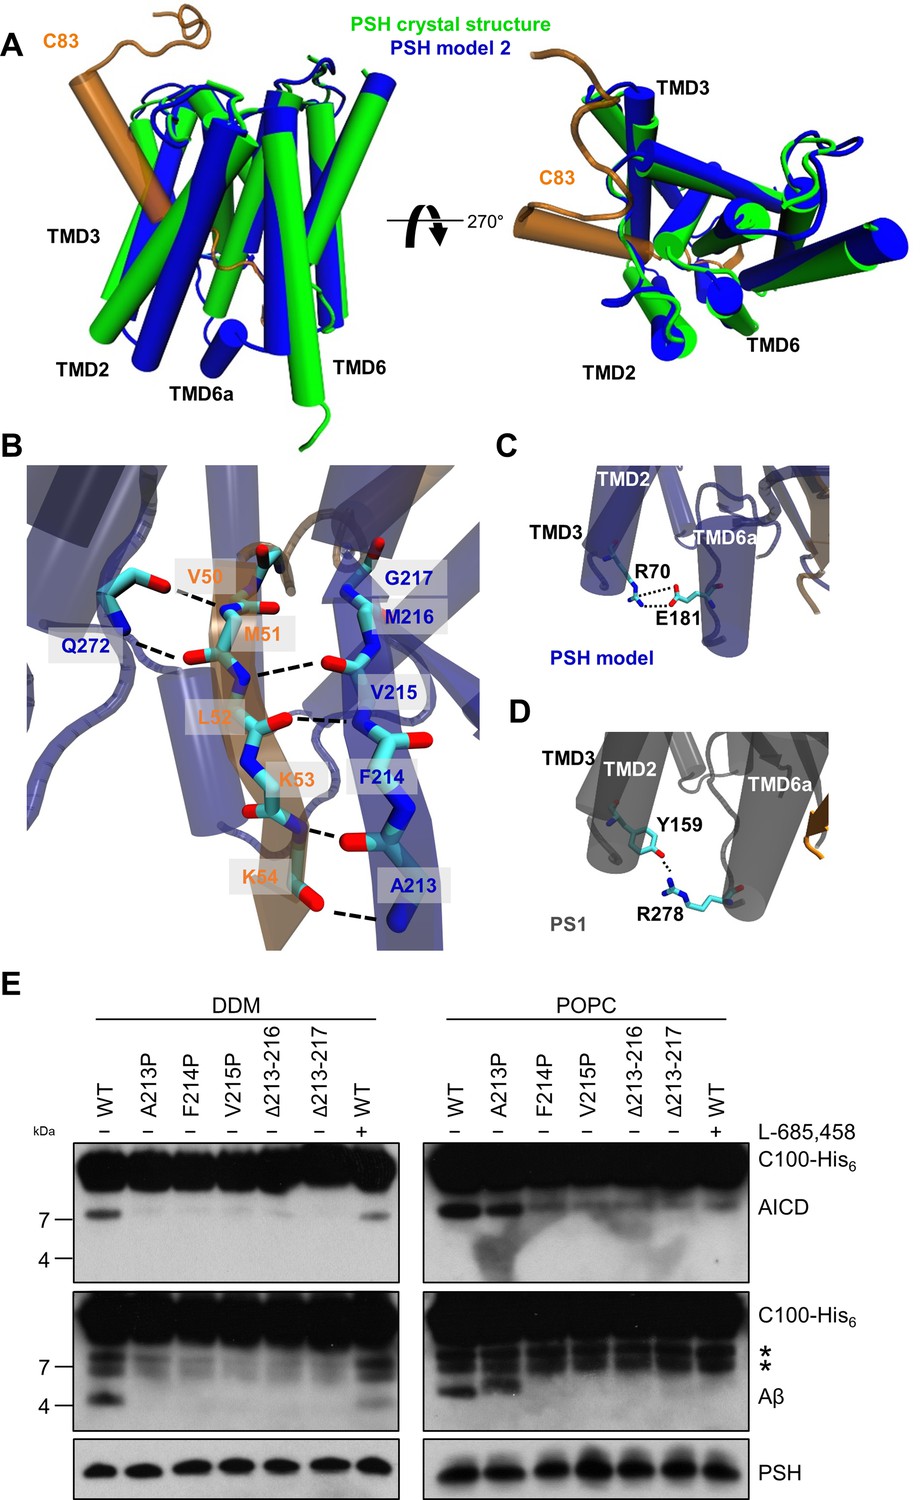
PSH homology model.
(A) Alignment of the modeled holo form (model 2) of PSH (blue) with APP C83 substrate (orange) and the crystal structure of PSH (PDB 4HYG) in the apo form (green) in side view (left panel) and top view (right panel). An overlay of all three models and their RMSD values are provided in Figure 4—figure supplement 1A and B. (B) Schematic representation of the hydrogen bonds formed between β3 of the substrate (orange), β2, and Q272, respectively, of PSH (blue). (C) Interaction of TMD3 and TMD6a in the C83-bound PSH model through residues R70 and E181. (D) Interaction of TMD3 and TMD6a through residues Y159 and R278 in the C83-bound γ-secretase cryo-EM structure (PDB 6IYC). (E) Analysis of WT and mutant PSH activity in DDM and POPC environment after incubation with C100-His6 substrate at 37 °C overnight by immunoblotting for AICD (Y188) and Aβ (2D8). Immunoblotting of PSH (6F4) was performed to control for PSH levels. The asterisks mark two substrate degradation bands, which are independent of PSH cleavage.
-
Figure 4—source data 1
Immunoblot images (raw and annotated) of cleavage assays (Source data for Figure 4E).
- https://cdn.elifesciences.org/articles/76090/elife-76090-fig4-data1-v2.zip
Figure 4—figure supplement 1
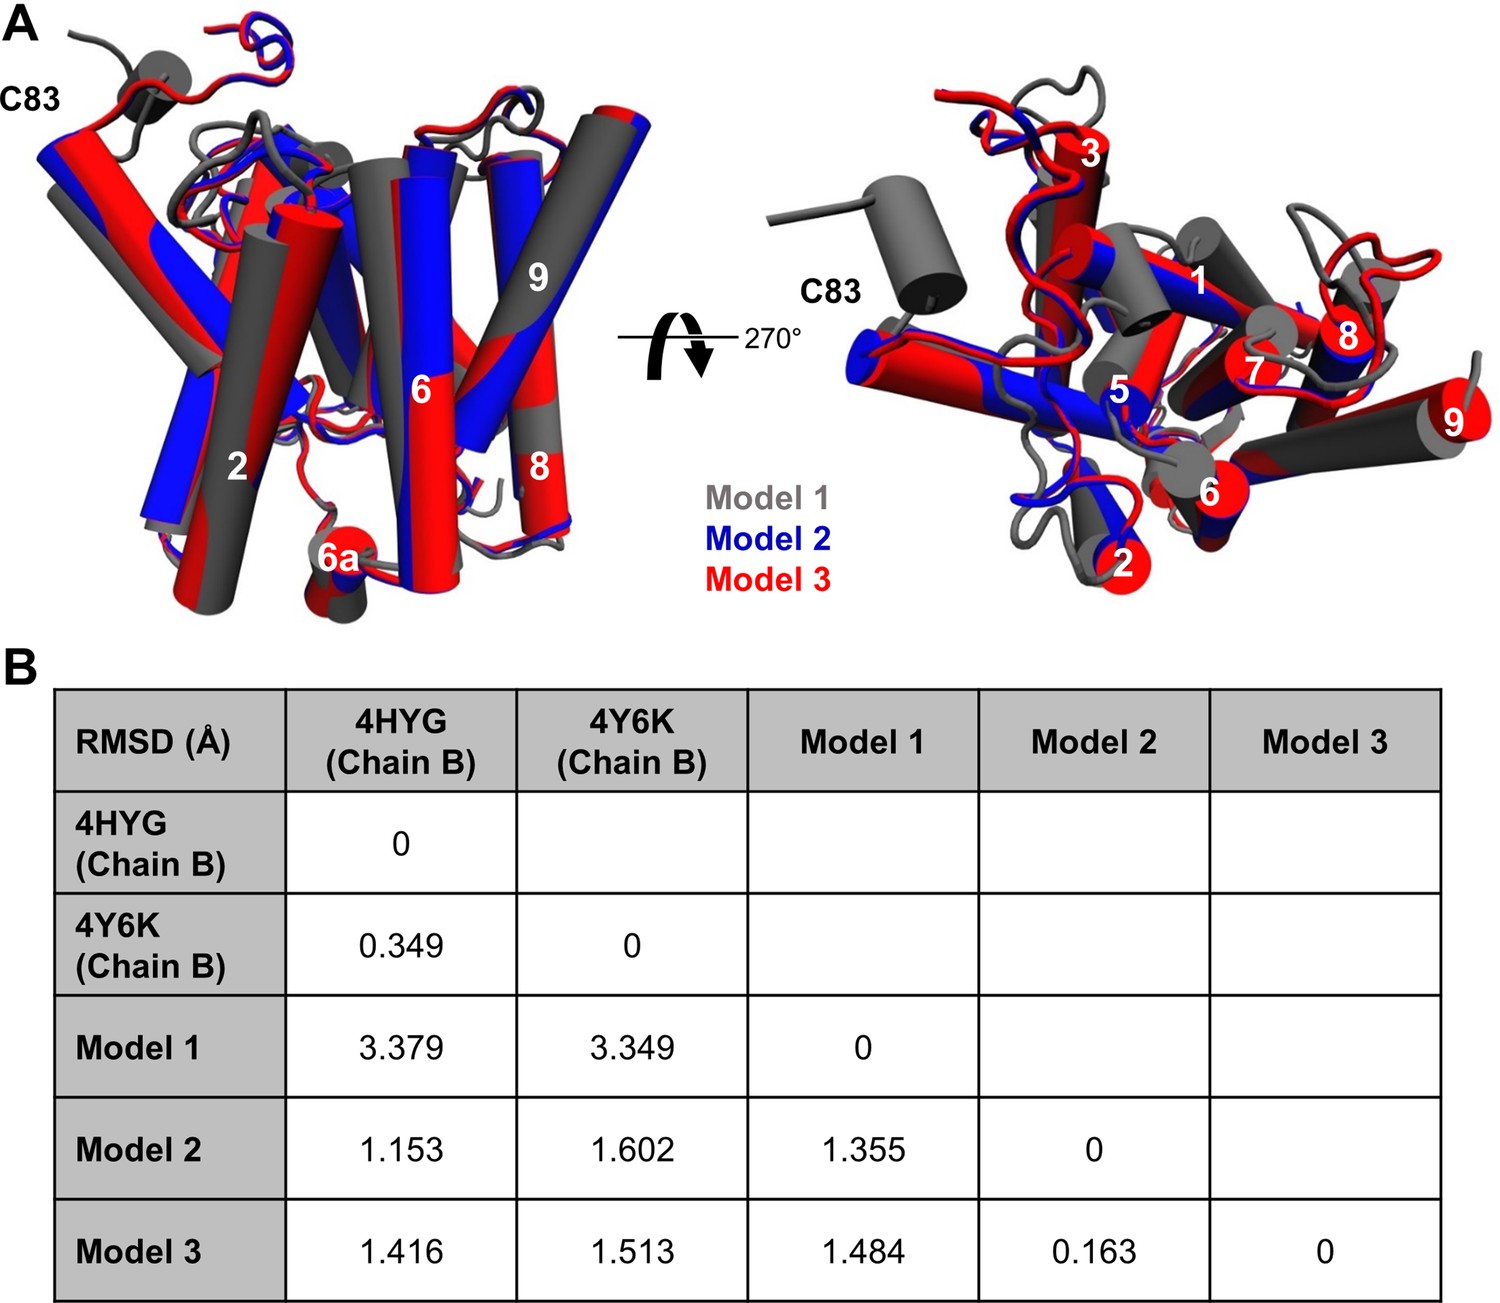
Comparison of the three different homology models.
(A) Alignment of the three modeled holo forms of PSH in side view (left panel) and top view (right panel). (B) RMSD values between the available crystal structures (PDB 4HYG and 4Y6K) and the three different PSH models.
Figure 4—figure supplement 2
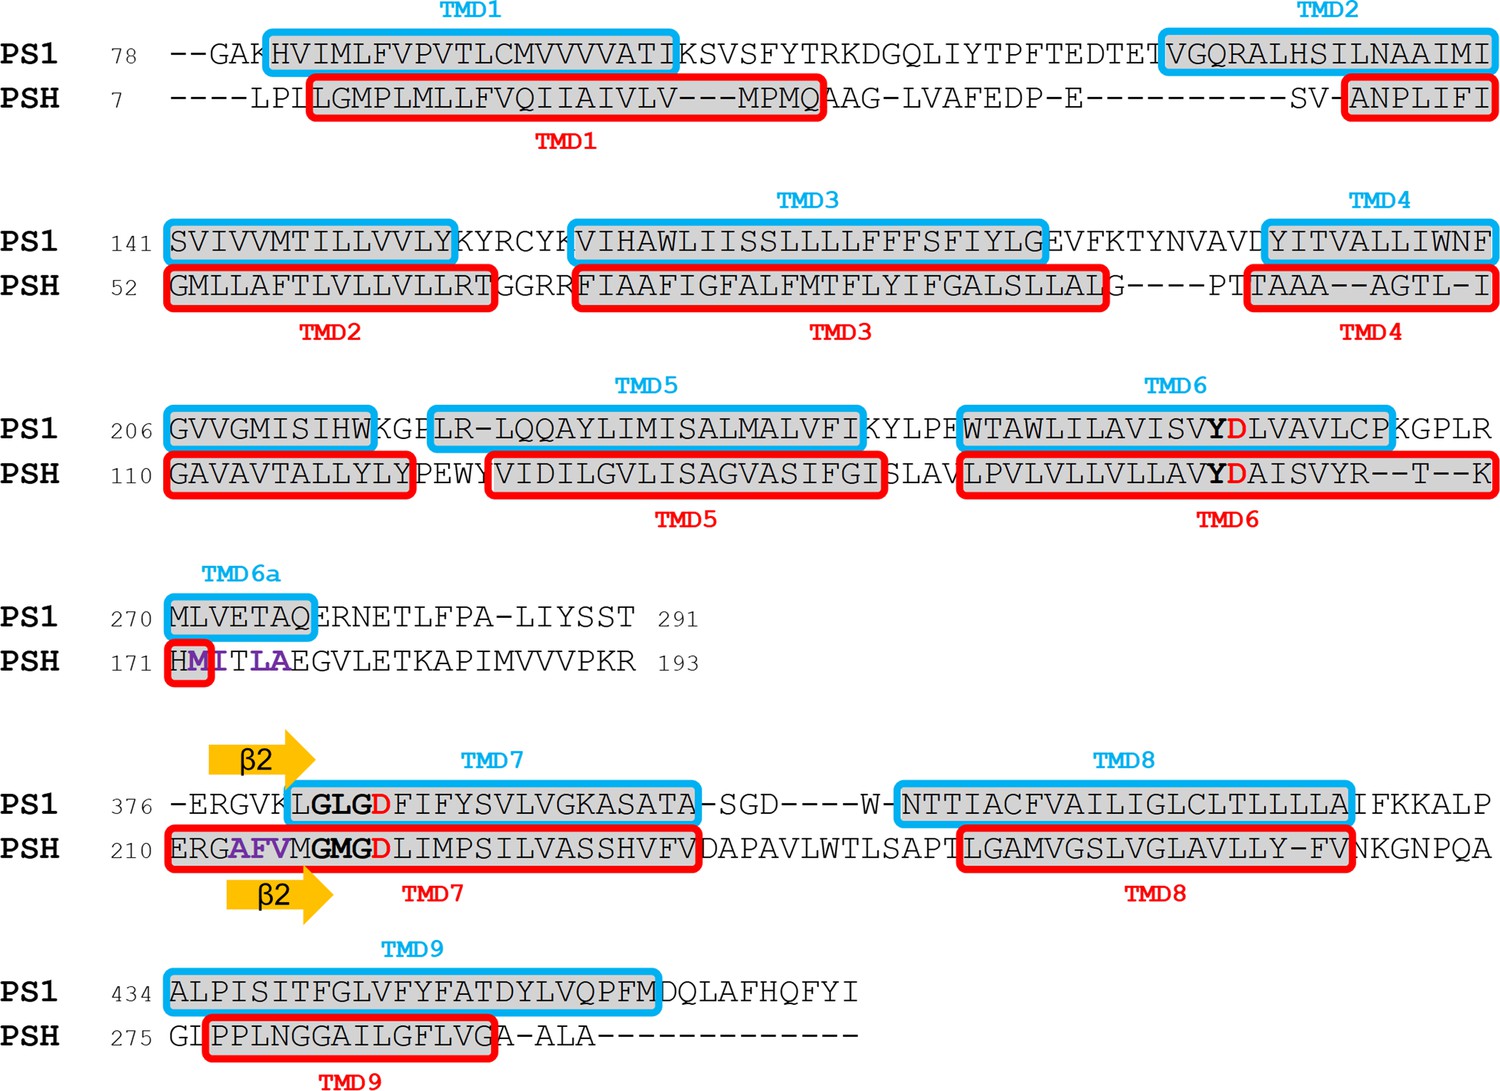
Alignment of PS1 and PSH used for homology modeling based on the TMD annotations of the available cryo-EM or crystal structures, respectively (PDB 6IYC for PS1 and PDB 4HYG for PSH).
Active site motifs including the catalytic aspartate residues (red) are highlighted in bold. The β2-strands of γ-secretase and PSH are indicated as orange arrows and residues that were mutated in this study are highlighted in violet.
Figure 5 with 3 supplements
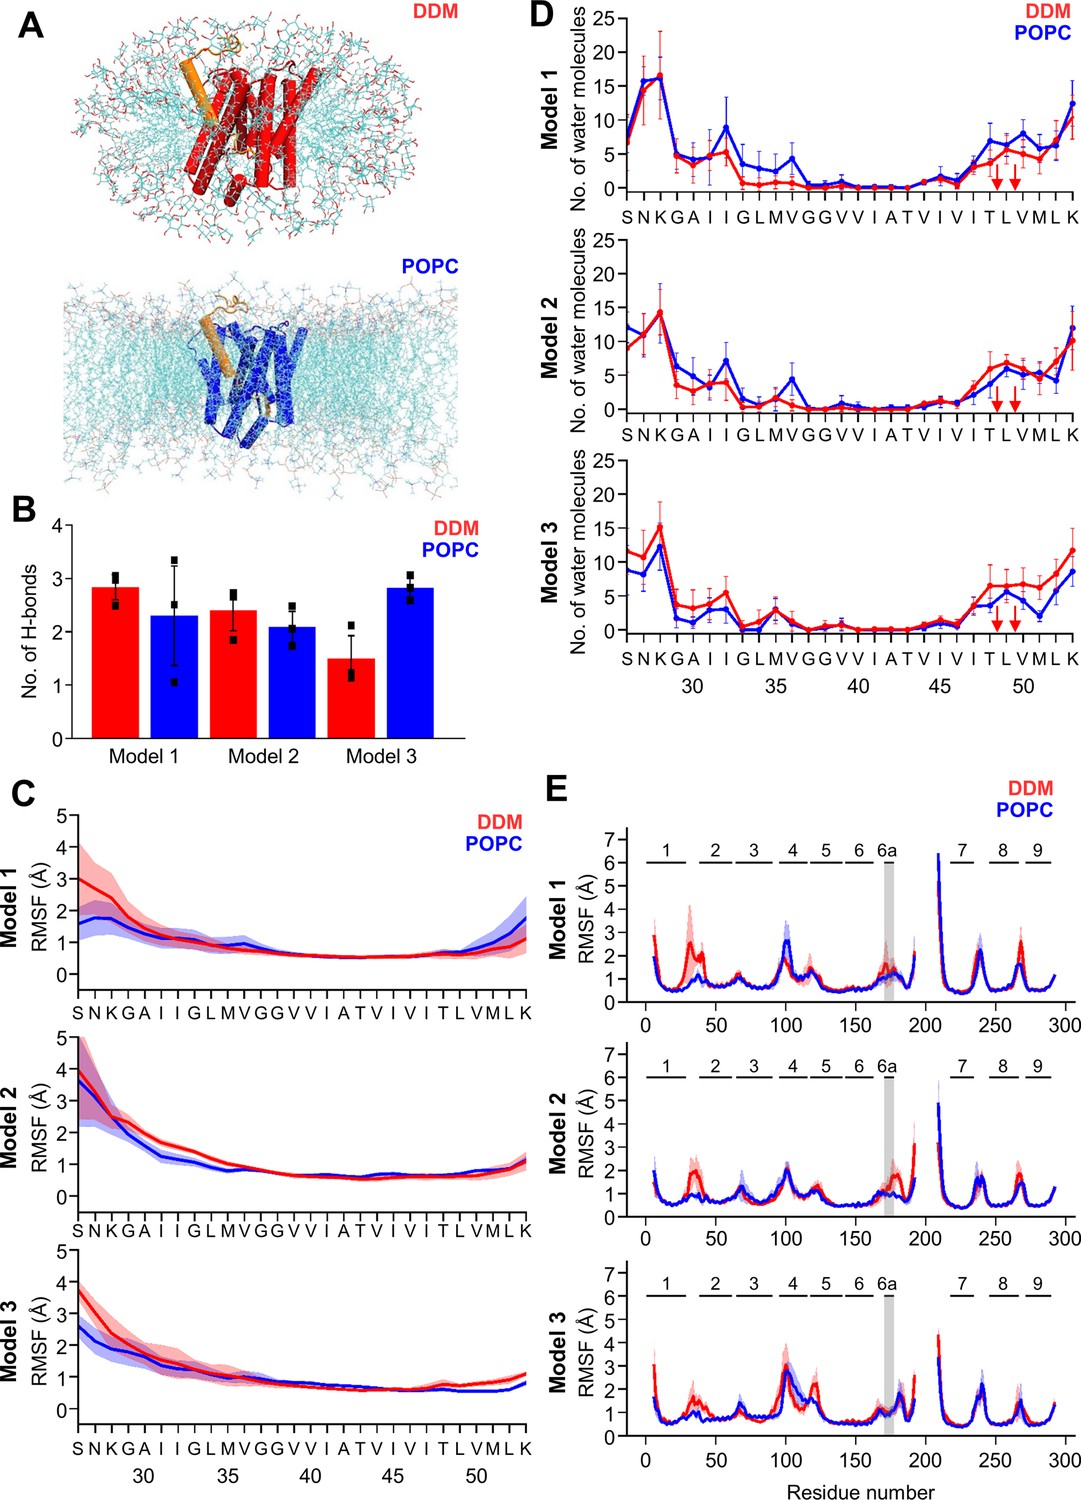
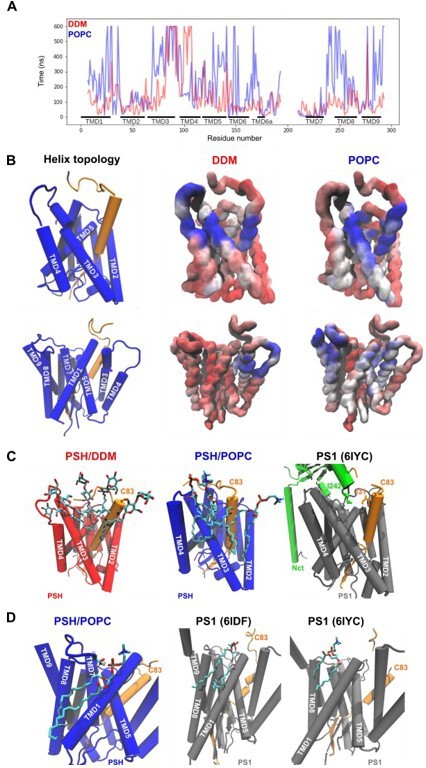
MD simulations of holo PSH forms in DDM micelle or POPC bilayer.
(A) PSH with bound C83 substrate (model 2) embedded in a DDM micelle environment (upper panel) and a POPC bilayer (lower panel). (B) The average number of H-bonds formed between the β3-strand of C83 and the β2-strand of PSH. Each data point stands for the average value throughout one trajectory and the error bars represent the SD of the mean of three data points. (C) The backbone RMSF of C83 of different models in DDM (red) and POPC (blue) environments averaged over three trajectories. The shaded areas represent the SD of the mean. (D) Water accessibility along the substrate TMD residues extracted from the simulations of the holo PSH in DDM (red) and POPC (blue) environments (water accessibility for a residue is obtained as the mean number of water molecules within 5 Å of any atom of the residue). The red arrows indicate the position of the two ε-cleavage sites. The error bars represent the SD of the mean (n=3 trajectories). (E) The backbone RMSF of PSH of different models in DDM (red) and POPC (blue), environments averaged over three trajectories (note that residues 194–209 are not included in our PSH models). The gray boxes highlight TMD6a and the shaded areas represent the SD of the mean. Enlarged views on backbone RMSF of residues K170 to P185 (including TMD6a) are shown in Figure 5—figure supplement 1B.
-
Figure 5—source data 1
Raw values of simulation data analysis (Source data for Figure 5B–E).
- https://cdn.elifesciences.org/articles/76090/elife-76090-fig5-data1-v2.zip
Figure 5—figure supplement 1

Homology modeling of the holo form PSH in complex with C83 in DDM and POPC environments.
(A) The backbone RMSD of PSH of different models in DDM (red) and POPC (blue) averaged over three trajectories. The black dashed line indicates an RMSD of 4 Å. (B) Enlarged representation of backbone RMSF of residues K170 to P185 (including TMD6a [orange]) of different models in DDM (red) and POPC (blue) environments averaged over three trajectories. The shaded areas represent the SD of the mean and the black dashed lines indicate an RMSF of 1 Å.
-
Figure 5—figure supplement 1—source data 1
Raw values of simulation data analysis (Source data for Figure 5—figure supplement 1A, B).
- https://cdn.elifesciences.org/articles/76090/elife-76090-fig5-figsupp1-data1-v2.zip
Figure 5—figure supplement 2
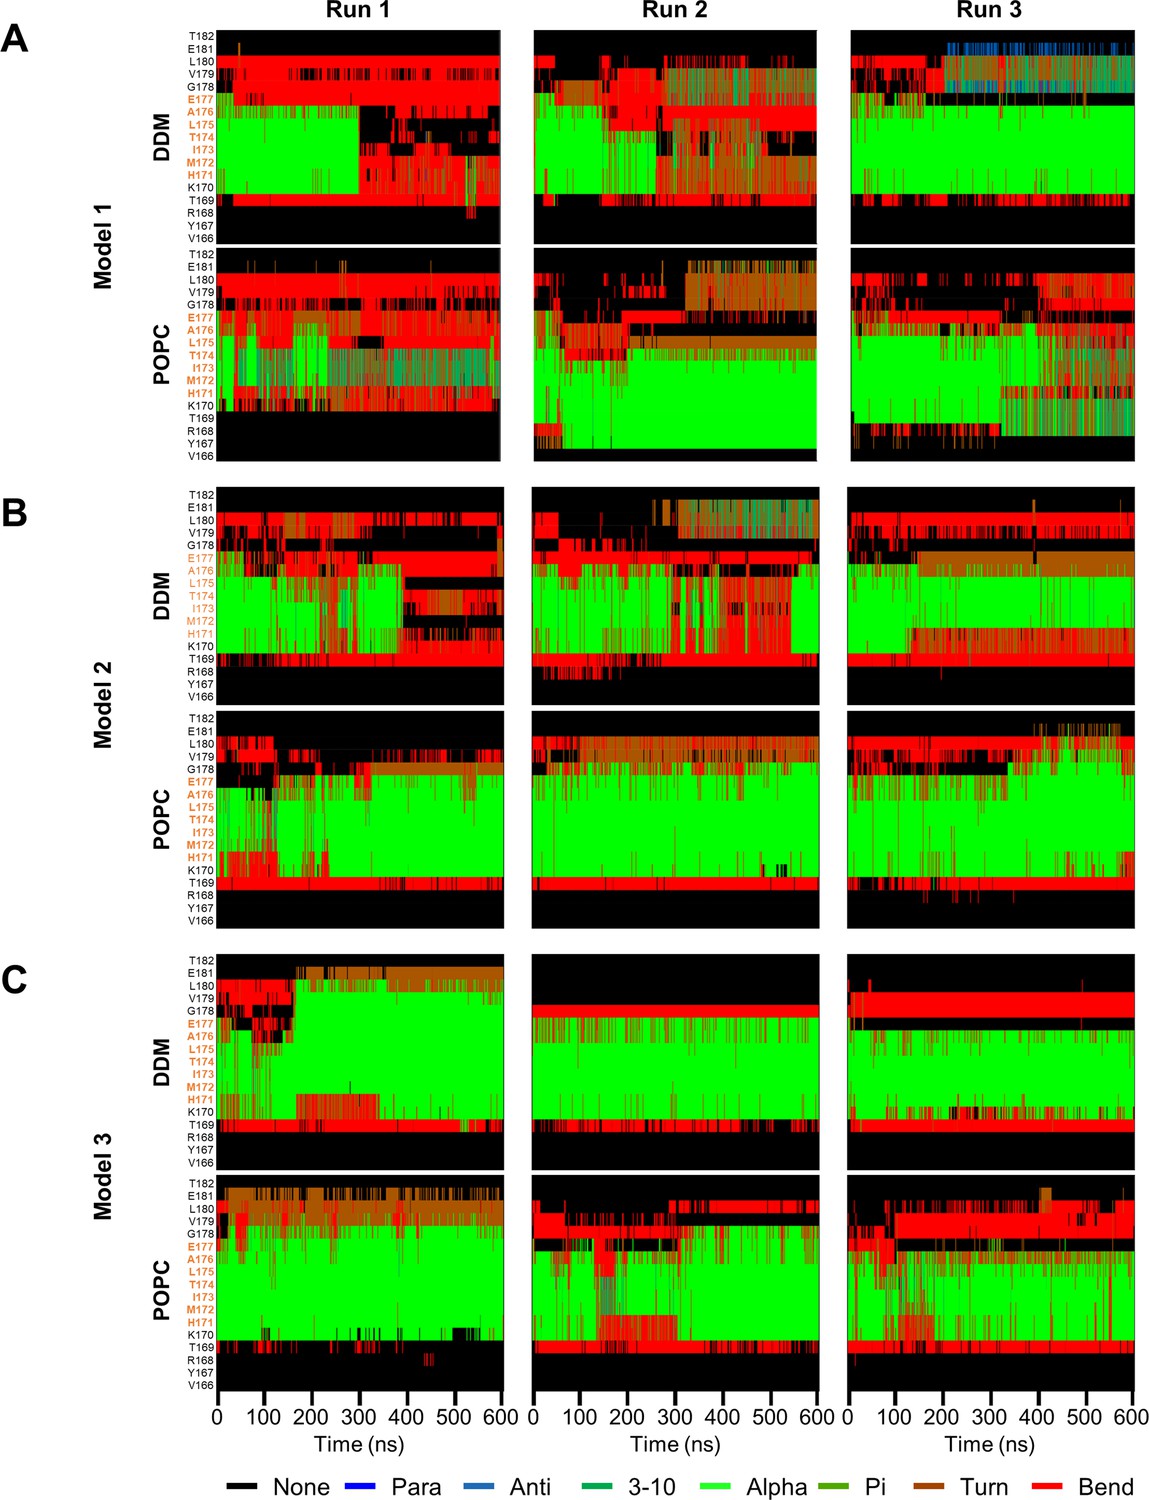
Secondary structure of PSH TMD6a and surrounding residues over simulation time.
(A–C) Secondary structure of PSH TMD6a (orange) and surrounding residues of model 1 (A), model 2 (B), and model 3 (C) in DDM micelle (top) and POPC bilayer (bottom) environments over the simulation time calculated using DSSP algorithm. As indicated, three simulations were performed in both environments for each model.
Figure 5—figure supplement 3
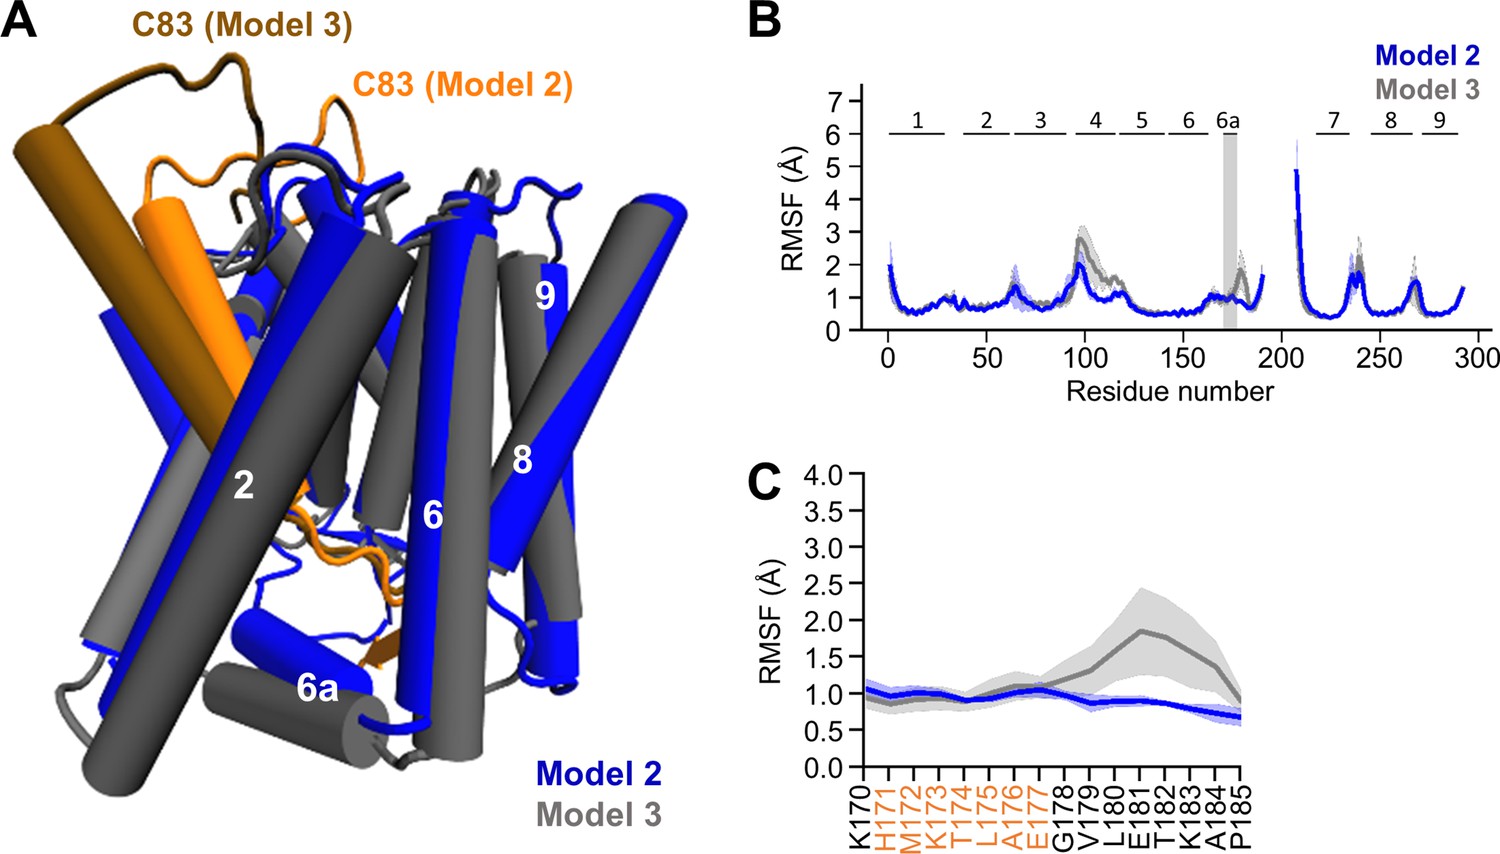
Comparison of models 2 and 3.
(A) Structural comparison of model 2 (blue) and 3 (gray). TMD6a is spatially closer to the C83 substrate in model 2. (B) Comparison of the backbone RMSFs of PSH model 2 (blue) and 3 (gray) in POPC bilayer averaged over three trajectories. The gray box highlights TMD6a and shaded areas represent the SD of the mean. An enlarged view on backbone RMSF of residues K170 to P185 (including TMD6a) is shown in (C). (C) Enlarged representation of backbone RMSF of residues K170 to P185 (including TMD6a [orange]) in POPC environment for model 2 (blue) and model 3 (gray) averaged over three trajectories. The shaded areas represent the SD of the mean. Data in (B) and (C) are taken from Figure 5E and Figure 5—figure supplement 1B respectively, and are used here as an overlay to allow a direct comparison of models 2 and 3 in POPC bilayer.
-
Figure 5—figure supplement 3—source data 1
Raw values of simulation data analysis (Source data for Figure 5—figure supplement 3B, C).
- https://cdn.elifesciences.org/articles/76090/elife-76090-fig5-figsupp3-data1-v2.zip
Figure 6 with 3 supplements

Destabilization of PSH TMD6a in a DDM micelle.
(A) Hydrophobic interactions between PSH regions and the C83 substrate. The right panel shows an enlarged view of the interaction of a hydrophobic patch (gray surface) of TMD6a with V50 and L52 of the substrate in the POPC bilayer. (B, C) Snapshots of the DDM insertion between TMD2 and TMD6 in the first (B) and second (C) run of the simulations in DDM environment at 400 ns. The right panels show an enlarged view of the unspecific hydrogen bonding interactions between the DDM molecule and the TMD6a amino acid backbones. (D) Snapshot of the DDM insertion between TMD3 and TMD4 of the simulation in DDM environment at 430 ns. The right panel shows an enlarged view of the unspecific hydrogen bonding interactions between the DDM molecule and the amino acid backbones of the residues immediately C-terminal of TMD6a.
Figure 6—figure supplement 1
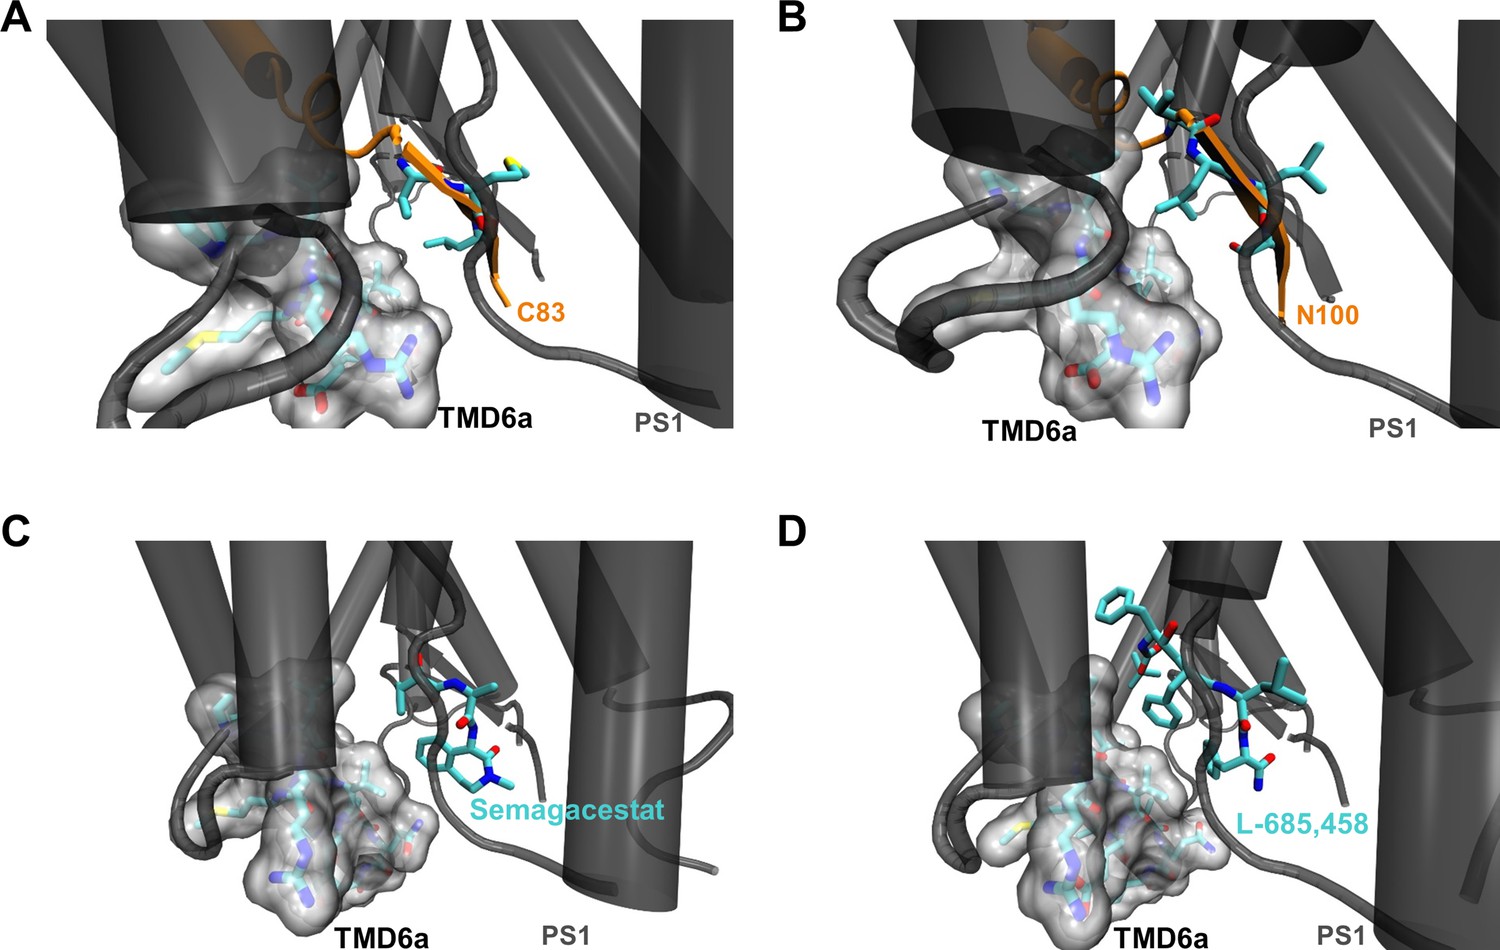
Hydrophobic interactions of PS1 TMD6a in substrate-bound and GSI-bound γ-secretases.
(A, B) Interactions between TMD6a of PS1 and substrate residues near the scissile bond(s) in the C83-bound (A) and Notch1 (N100)-bound (B) γ-secretase cryo-EM structures (PDB 6IYC and PDB 6IDF, respectively). The van der Waals radii of TMD6a and directly surrounding residues (R268 to R278) of PS1 are shown by the gray surface. (C, D) Interactions between TMD6a of PS1 and GSI in the Semagacestat-bound (C) and L-685,458 bound (D) γ-secretase cryo-EM structures (PDB 6LR4 and PDB 7C9I, respectively). The van der Waals radii of TMD6a and directly surrounding residues (R268 to R278) of PS1 are shown by the gray surface.
Figure 6—figure supplement 2
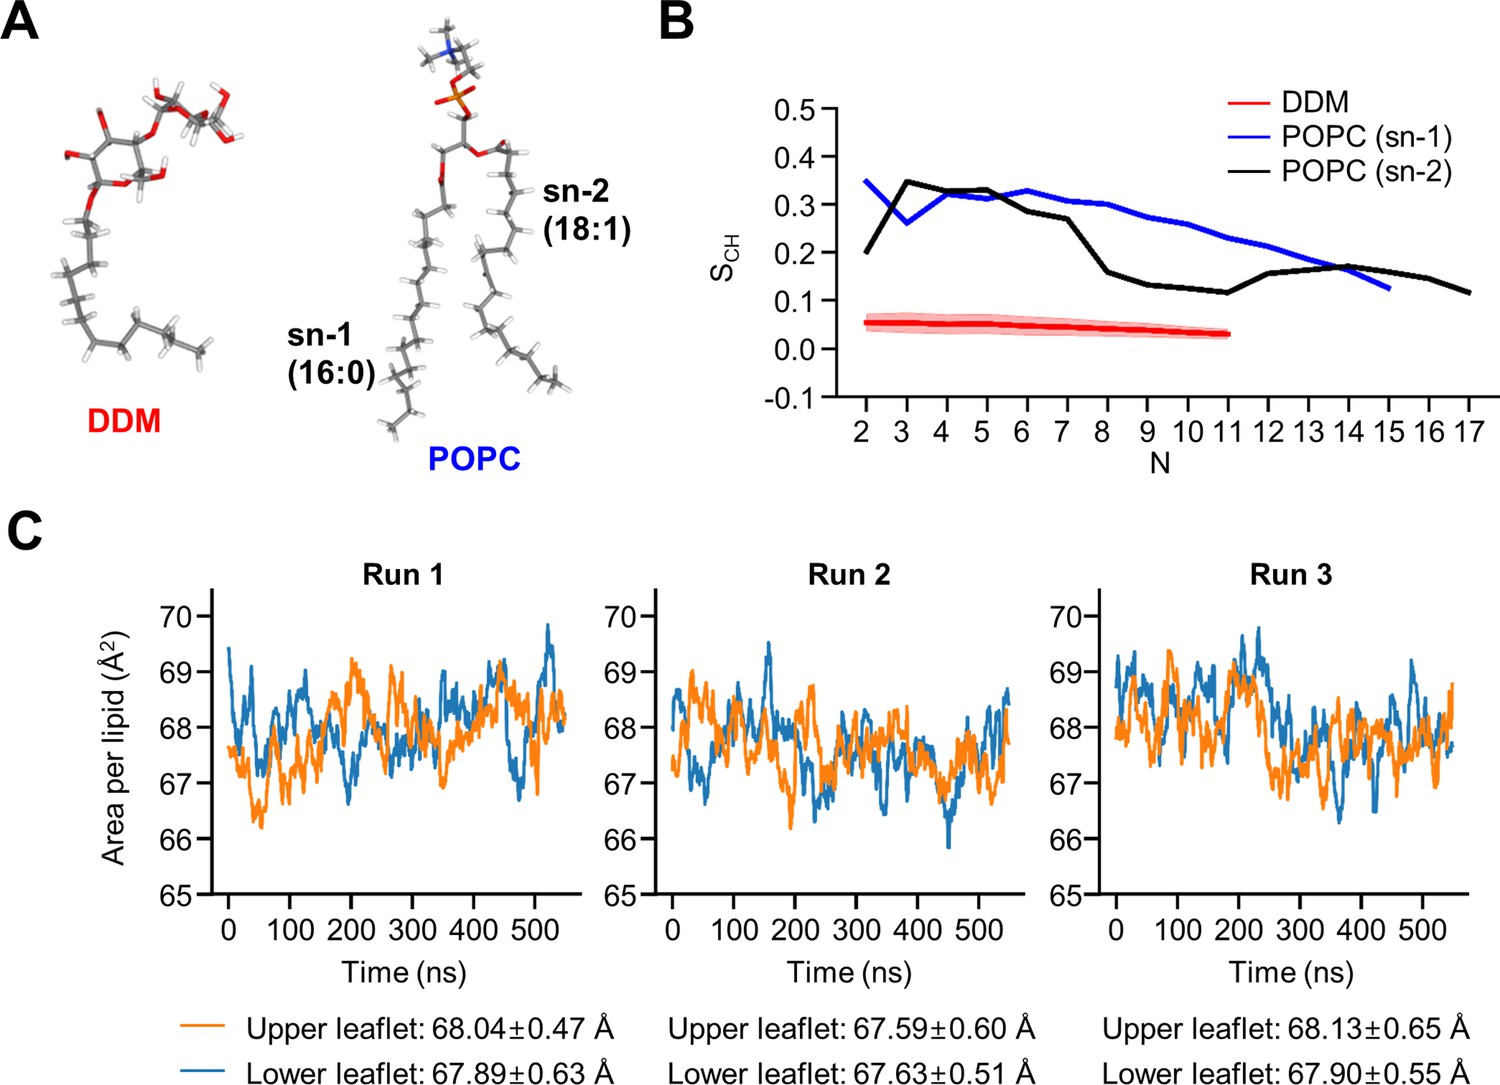
Biophysical properties of DDM and POPC.
(A) Structures of DDM and POPC. (B) Calculated lipid order parameters SCH of the acyl chains of DDM (red) and POPC (sn-1 blue, sn-2 black). Data are represented as mean ± SD (n=3 trajectories). (C) Area per lipid of POPC molecules averaged for every 30 ns in model 2.
-
Figure 6—figure supplement 2—source data 1
Raw values of simulation data analysis (Source data for Figure 6—figure supplement 2B, C).
- https://cdn.elifesciences.org/articles/76090/elife-76090-fig6-figsupp2-data1-v2.zip
Figure 6—figure supplement 3
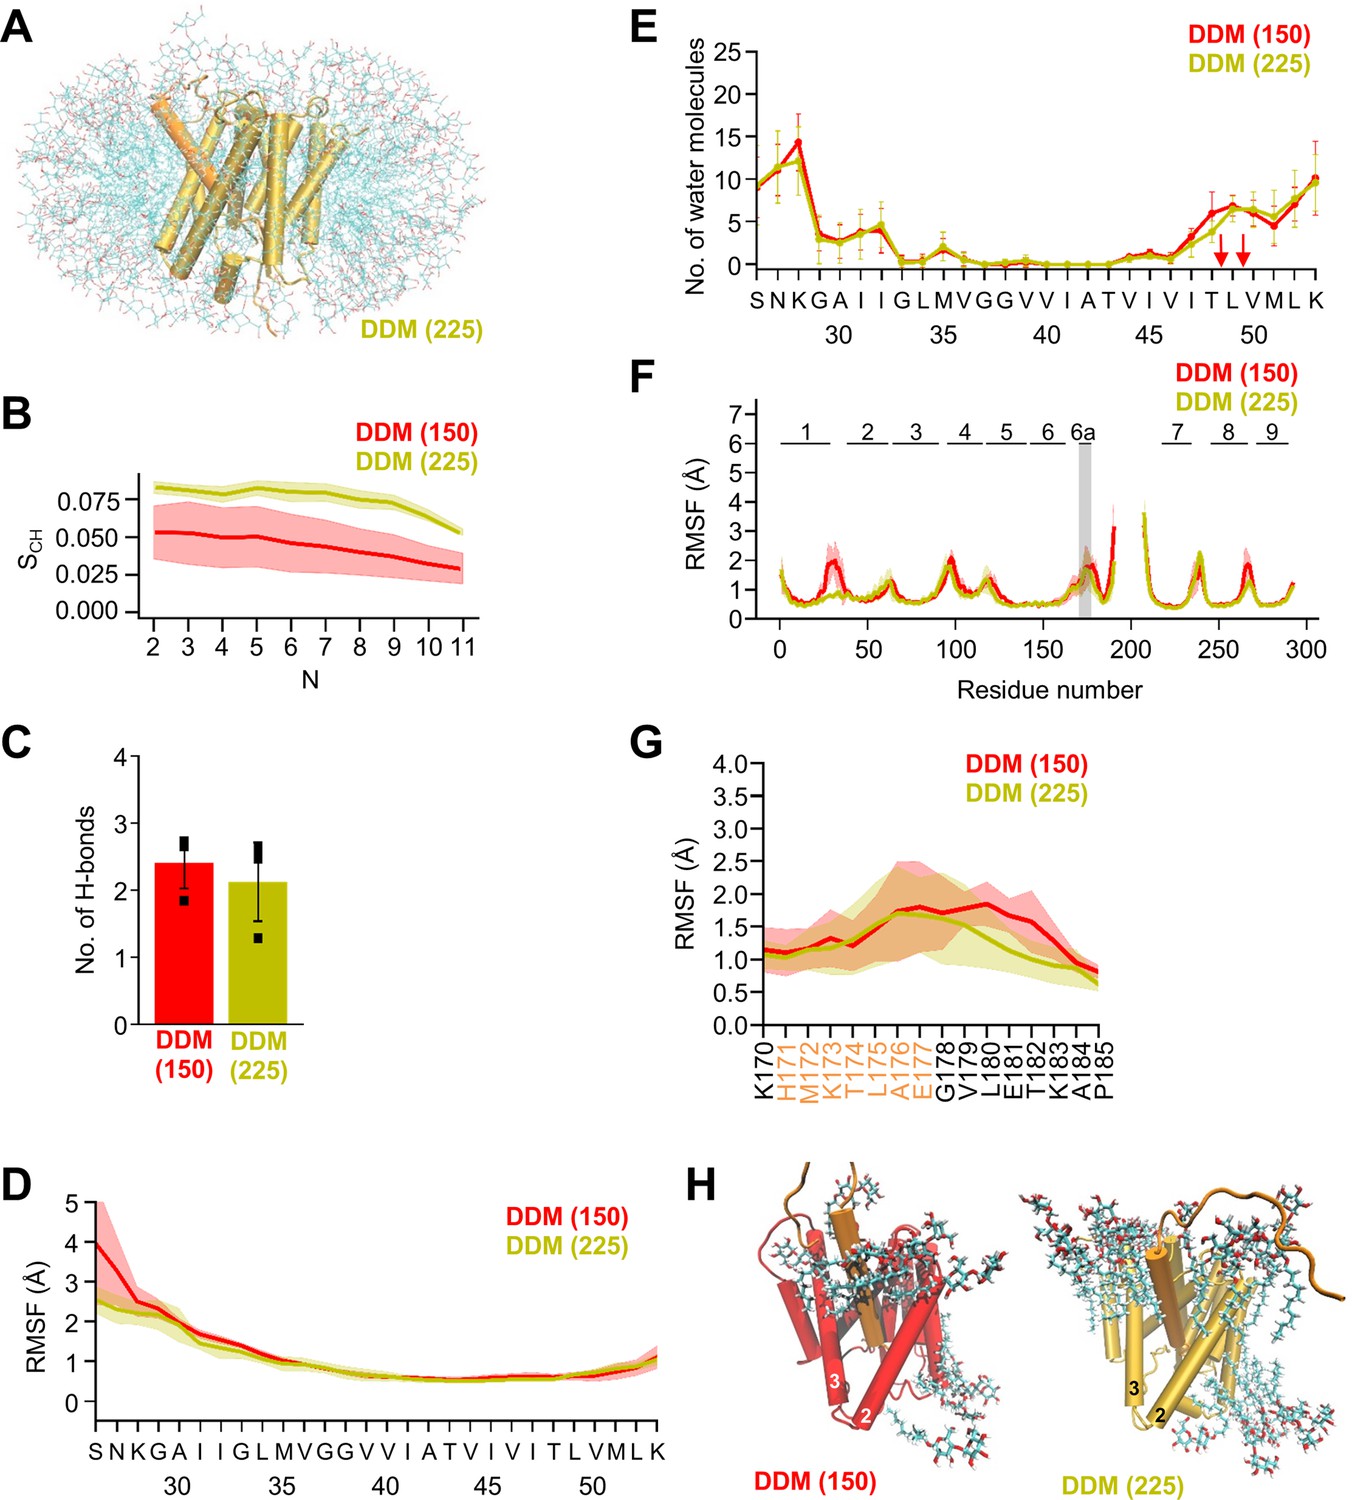
MD simulations in different DDM micelles.
(A) PSH with bound C83 substrate embedded in a DDM micelle environment (225 DDM molecules). (B) Calculated lipid order parameters SCH of the acyl chains of DDM in small (red, 150 molecules) and large (olive, 225 molecules) micelles. Data are represented as mean ± SD (n=3 trajectories). (C) The average number of H-bonds formed between the β3-strand of C83 and the β2-strand of PSH in DDM micelles composed of 150 molecules (red) and 225 molecules (olive). Each data point stands for the average value throughout one trajectory and the error bars represent the SD of the mean of the three data points. (D) The backbone RMSF of C83 in DDM micelles composed of 150 molecules (red) and 225 molecules (olive) averaged over three trajectories. The shaded areas represent the SD of the mean. (E) Water accessibility along the substrate TMD residues extracted from the simulations in DDM micelles composed of 150 molecules (red) or 225 molecules (olive) (water accessibility for a residue is obtained as the mean number of water molecules within 5 Å of any atom of the residue). Red arrows indicate the position of the two ε-cleavage sites. The error bars represent the SD of the mean (n=3 trajectories). (F) The backbone RMSF of PSH in DDM micelles composed of 150 molecules (red) and 225 molecules (olive) averaged over three trajectories. The shaded areas represent the SD of the mean. An enlarged view on backbone RMSF of residues K170 to P185 (including TMD6a) is shown in (G). (G) Enlarged representation of backbone RMSF of residues K170 to P185 (including TMD6a [orange]) in small (red) and large (olive) DDM micelles averaged over three trajectories. The shaded areas represent the SD of the mean. (H) Orientation of DDM molecules around HL1 and TMD6a in DDM micelles composed of 150 molecules (left, red) and 225 molecules (right, olive).
-
Figure 6—figure supplement 3—source data 1
Raw values of simulation data analysis (Source data for Figure 6—figure supplement 3B-G).
- https://cdn.elifesciences.org/articles/76090/elife-76090-fig6-figsupp3-data1-v2.zip
Figure 7 with 1 supplement

Impact of PSH TMD6a mutations on PSH structural dynamics and activity.
(A) RMSD of the WT (blue) and the mutated systems M172K (violet), I173K (green), L175K (gray), and A176K (orange) in the POPC bilayer environment. The solid, dashed, and dotted lines represent three different simulations with random initial velocities. The black dashed line indicates an RMSD of 4 Å. (B) The backbone RMSF of C83 of WT PSH and different TMD6a lysine mutants in POPC environment averaged over three trajectories. The shaded areas represent the SD of the mean. (C) Water accessibility along the substrate TMD residues extracted from the simulations of the four lysine-mutant holo-form PSH systems in the POPC bilayer environments (water accessibility for a residue is obtained as the mean number of water molecules within 5 Å of any atom of the residue). The red arrows indicate the position of the two ε-cleavage sites. The error bars represent the SD of the mean (n=3 trajectories). (D) The average H-bond formed between the β3-strand at the C-terminus of C83 and the β2-strand of WT and lysine-mutated PSH. Each data point stands for the average value throughout one trajectory and the error bars represent the SD of the mean of three data points. (E) The backbone RMSF of WT (blue) and M172K (violet), I173K (green), L175K (gray), and A176K (orange) mutated PSH in POPC. The box highlights TMD6a and the shaded areas represent the SD of the mean (n=3 trajectories). Larger RMSF of the A176K mutant observed in residues 235–243 correspond to a folding-unfolding event in the mobile loop between TMD7 and TMD8 in the third trajectory (see Figure 7—source data 1 and Figure 7—source data 2). (F) Analysis of WT and lysine-mutant PSH activity in DDM and POPC environment after incubation with C100-His6 substrate at 37 °C overnight by immunoblotting for AICD (Y188) and Aβ (2D8). Immunoblotting of PSH (6F4) was performed to control for PSH levels. The asterisks marks substrate degradation bands, which are independent of PSH cleavage.
-
Figure 7—source data 1
Raw values of simulation data analysis (Source data for Figure 7A–E).
- https://cdn.elifesciences.org/articles/76090/elife-76090-fig7-data1-v2.zip
-
Figure 7—source data 2
Immunoblot images (raw and annotated) of cleavage assays (Source data for Figure 7F).
- https://cdn.elifesciences.org/articles/76090/elife-76090-fig7-data2-v2.zip
Figure 7—figure supplement 1
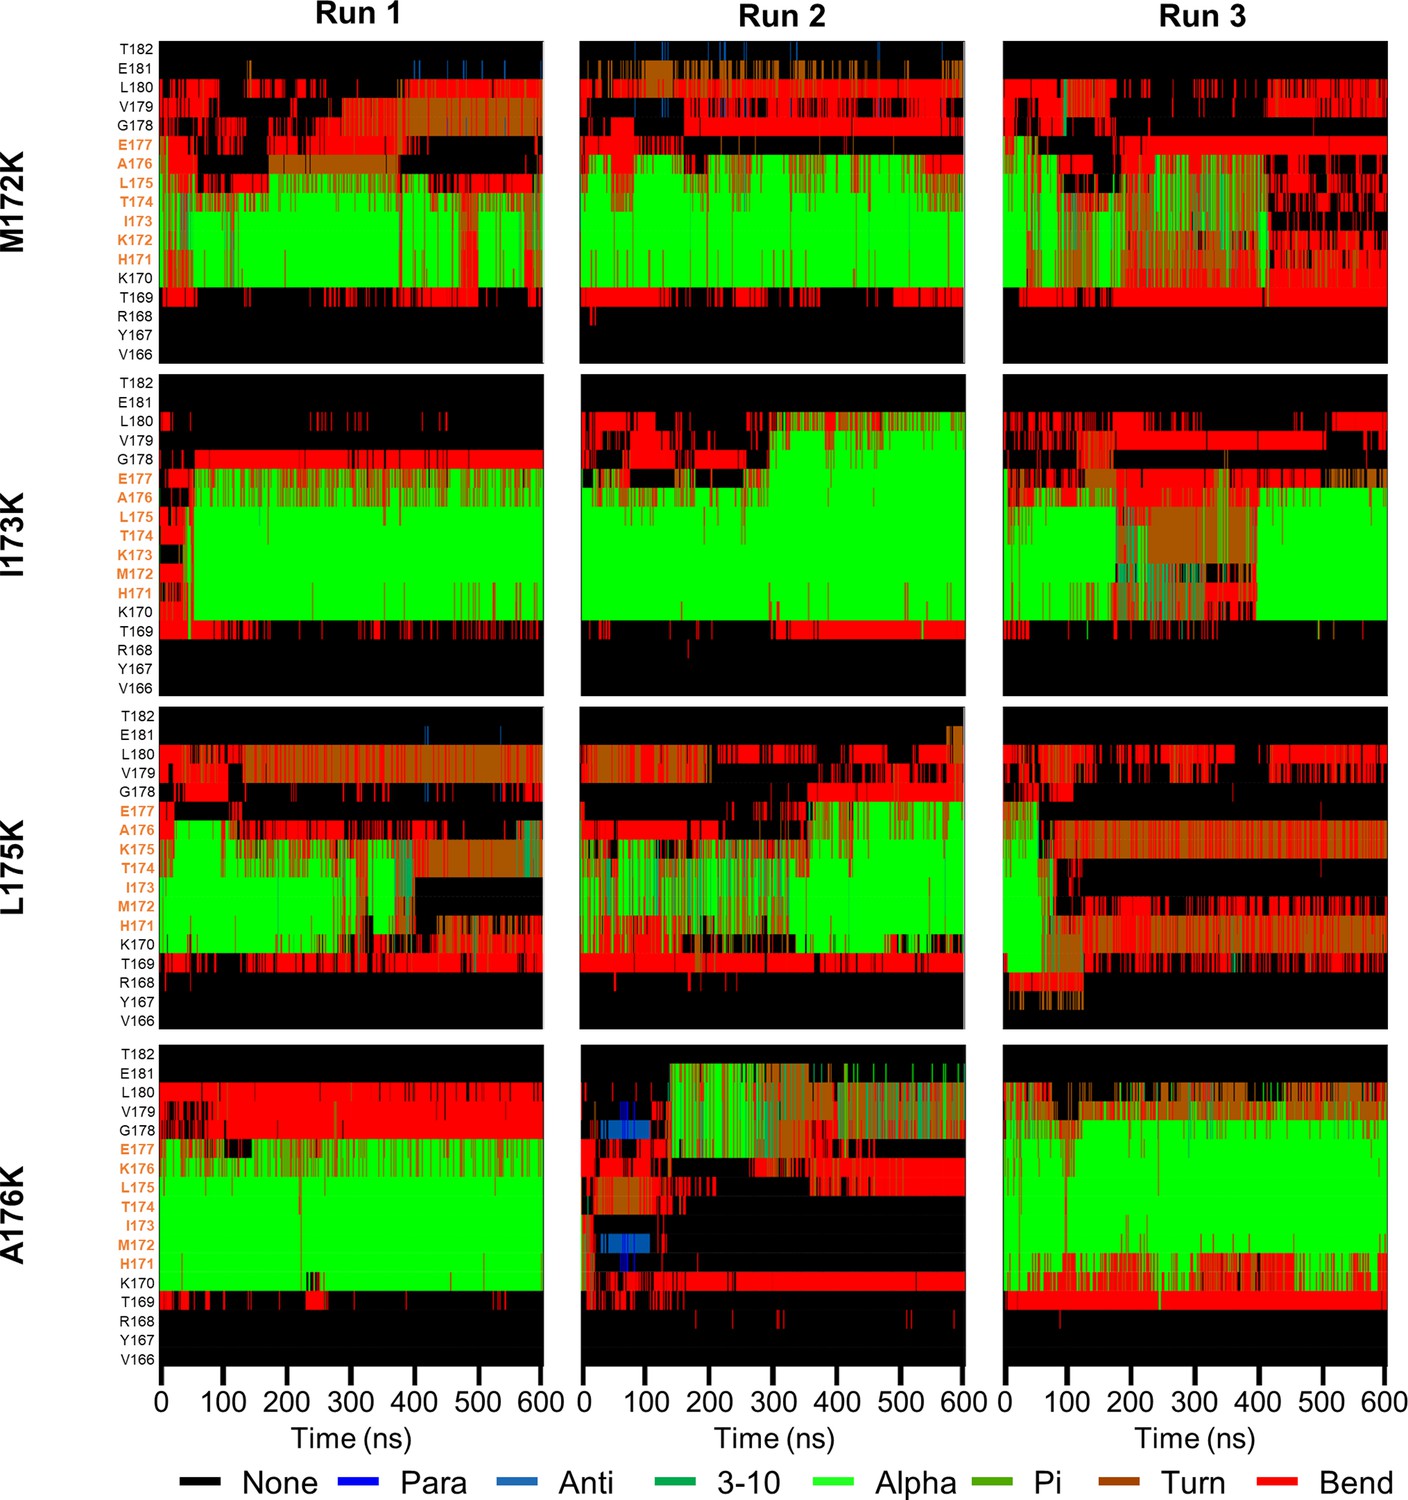
Secondary structure of lysine-mutant PSH TMD6a and surrounding residues over simulation time.
Secondary structure of PSH TMD6a (orange) and surrounding residues bearing lysine mutants in POPC bilayer environments over simulation time calculated using DSSP.
Figure 8 with 3 supplements
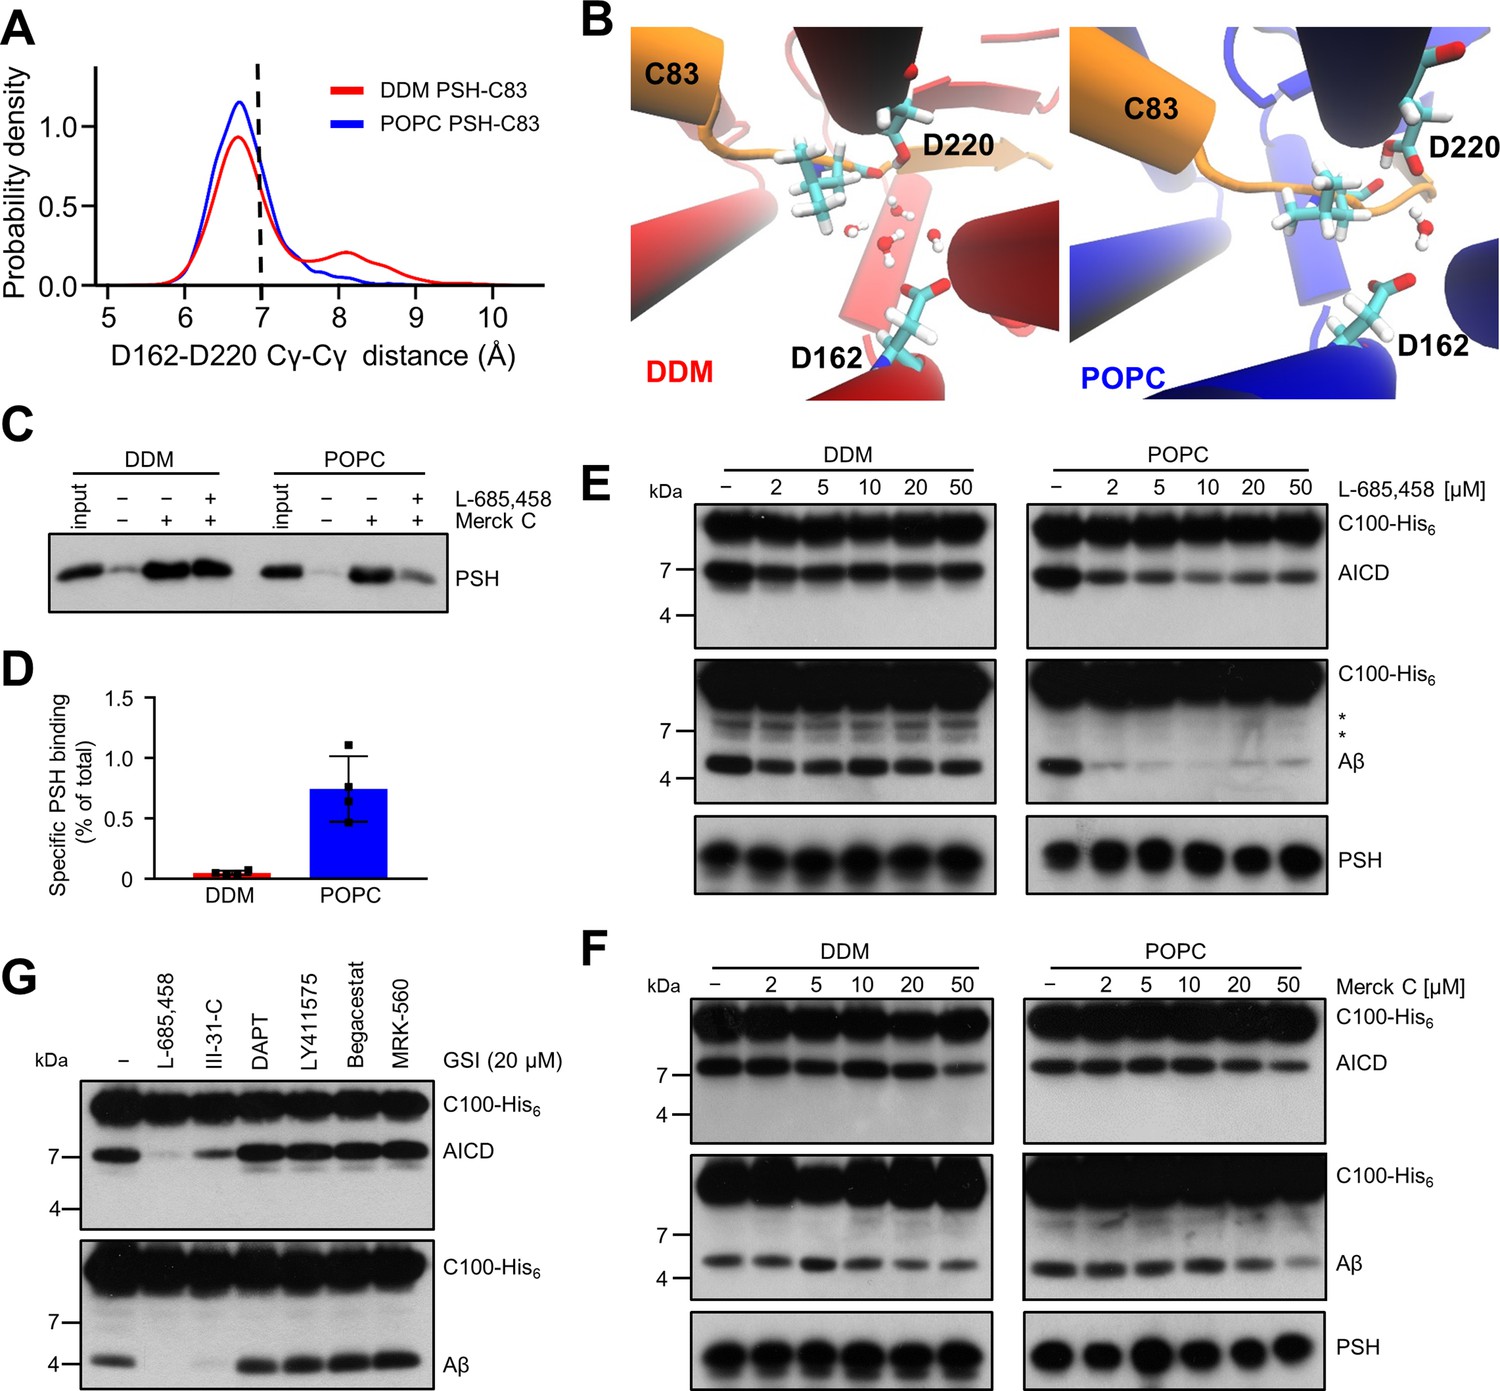
Stabilization of the PSH active site geometry in a POPC bilayer.
(A) Histograms of the Cγ-Cγ distances between the D162 and D220 of PSH measured in DDM micelle (red) and POPC bilayer (blue) environments. The dashed line indicates the distance of 7 Å. The measured distances over time are shown in Figure 8—figure supplement 1C. (B) Snapshot of the catalytic cavity in DDM (left panel) and POPC (right panel) environment. The Cγ-Cγ distance between the two catalytic aspartates D162 and D220 is larger in DDM micelles and more water molecules enter the catalytic cavity between D162 and the substrate. Detailed geometries of these two active site conformations are depicted in Figure 8—figure supplement 2. (C) Immunoblot analysis of TSA-inhibitor binding to PSH in DDM micelles or POPC vesicles. PSH was affinity-precipitated by Merck C (a biotinylated derivative of L-685,458; 20 µM). To control for background binding and binding specificity, the affinity precipitation was assessed in the absence of Merck C as well as in the presence of excess amounts of the parental compound L-685,458 (2 mM) as competitor. The input represents 2.5% of the total sample used for the affinity precipitation. A representative immunoblot from four independent biological replicates is shown. (D) Quantitation of PSH binding by Merck C. Specific binding was defined as difference of PSH signals in the absence or presence of L-685,458 after additional subtraction of unspecific background binding signals. Quantitative data are represented as mean ± SD (n=4 biological replicates). The source data are shown in Figure 8—source data 1. (E, F) Inhibition assay of PSH in DDM micelles and POPC vesicles with increasing concentrations of L-685,458 (E) or Merck C (F), respectively. PSH activity was analyzed by immunoblotting for AICD (Y188) and Aβ (2D8) following incubation with C100-His6 substrate at 37 °C overnight. Representative immunoblots from three independent biological replicates are shown. The asterisks mark two substrate degradation bands, which are independent of PSH cleavage. (G) Inhibition assay of PSH reconstituted in POPC vesicles in the presence of 20 µM TSA and non-TSA γ-secretase inhibitors. PSH activity was analyzed by immunoblotting for AICD (Y188) and Aβ (2D8) following incubation with C100-His6 substrate at 37 °C overnight. Representative immunoblots from three independent biological replicates are shown.
-
Figure 8—source data 1
Raw values of simulation data analysis (Source data for Figure 8A and Figure 8—figure supplement 1A-C).
- https://cdn.elifesciences.org/articles/76090/elife-76090-fig8-data1-v2.xlsx
-
Figure 8—source data 2
Immunoblot images (raw and annotated) of inhibitor precipitation assay and cleavage assays (Source data for Figure 8C, E-G).
- https://cdn.elifesciences.org/articles/76090/elife-76090-fig8-data2-v2.zip
-
Figure 8—source data 3
Raw values of immunoblot quantitation (Source data for Figure 8D).
- https://cdn.elifesciences.org/articles/76090/elife-76090-fig8-data3-v2.xlsx
Figure 8—figure supplement 1

Cγ-Cγ distances in PSH homology model.
(A) The average Cγ-Cγ distances between D162 and D220 of PSH. Each data point stands for the average value throughout one trajectory with the error bar showing the SD of the three independent trajectories. (B) Frequency of the catalysis-compatible Cγ-Cγ distance (below 7 Å) in DDM and POPC environments. (C) Cγ-Cγ distance measured in DDM (red) and POPC (blue) environments throughout different trajectories (solid, dashed, and dotted lines).
Figure 8—figure supplement 2
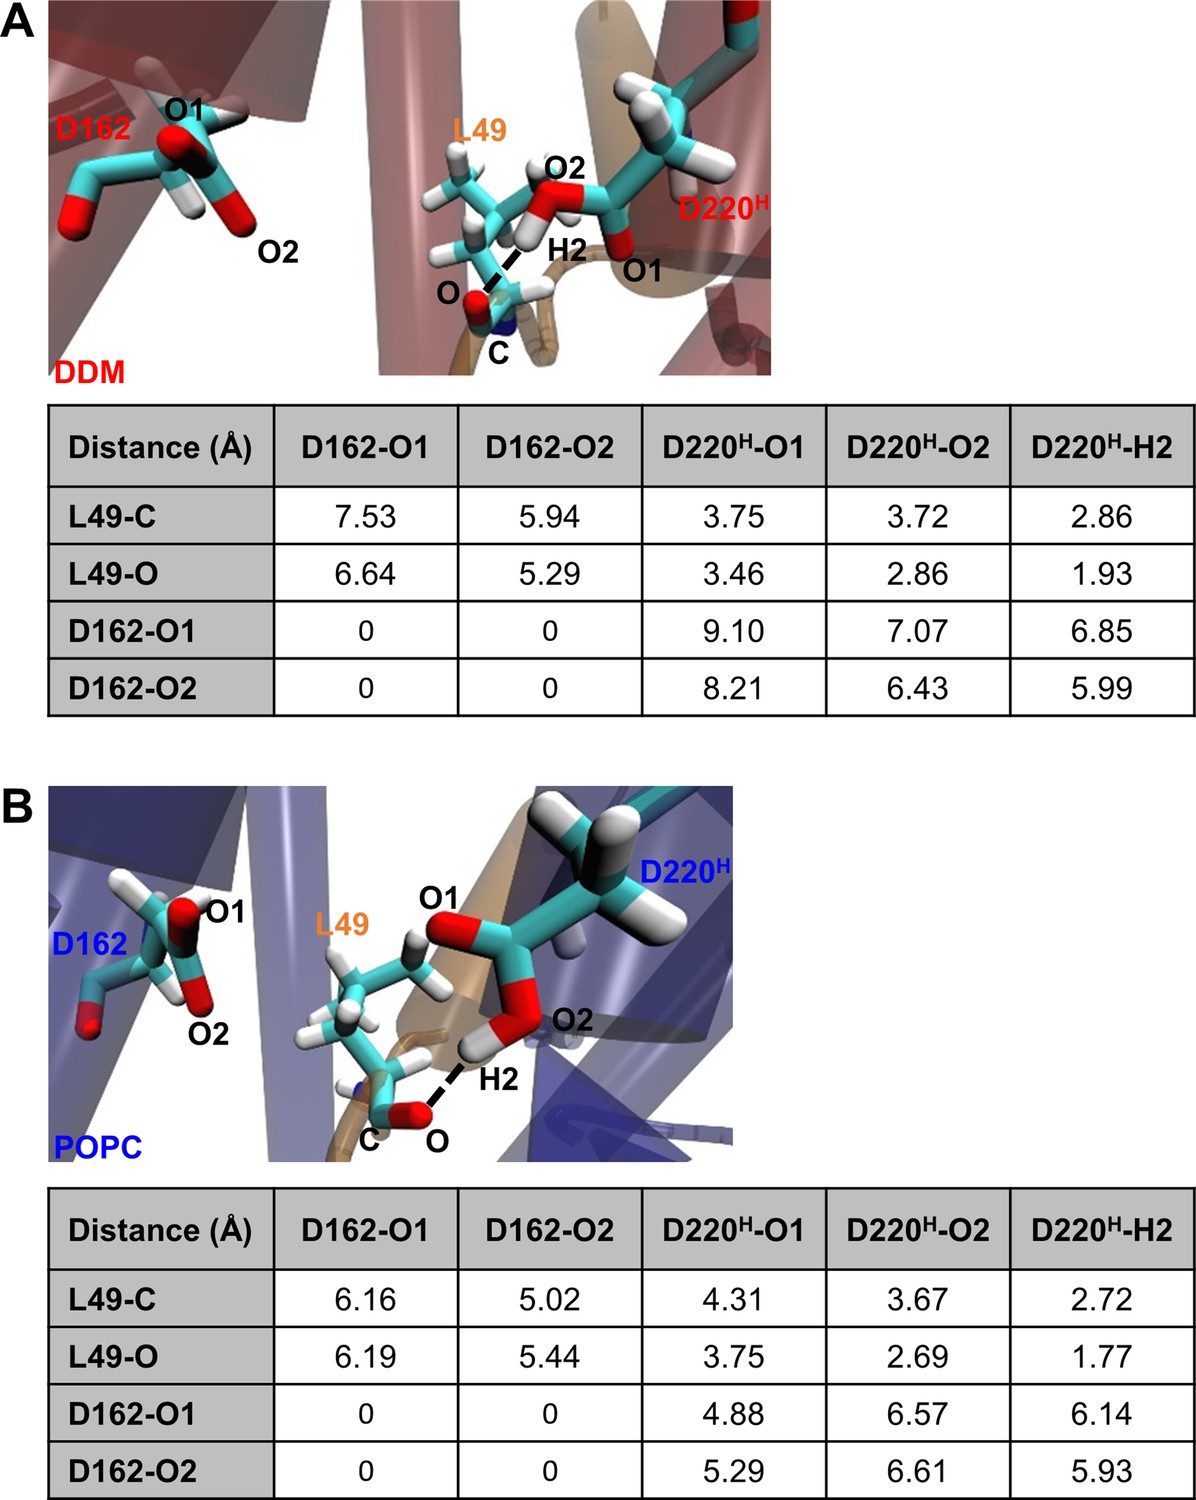
Detailed geometry of the E-S catalytic site.
Detail geometries and distances for the atoms between D162, D220 and C83 L49 at a Cγ-Cγ distance of 8.2 Å in DDM micelles (A) and 6.8 Å in POPC bilayer (B).
Figure 8—figure supplement 3
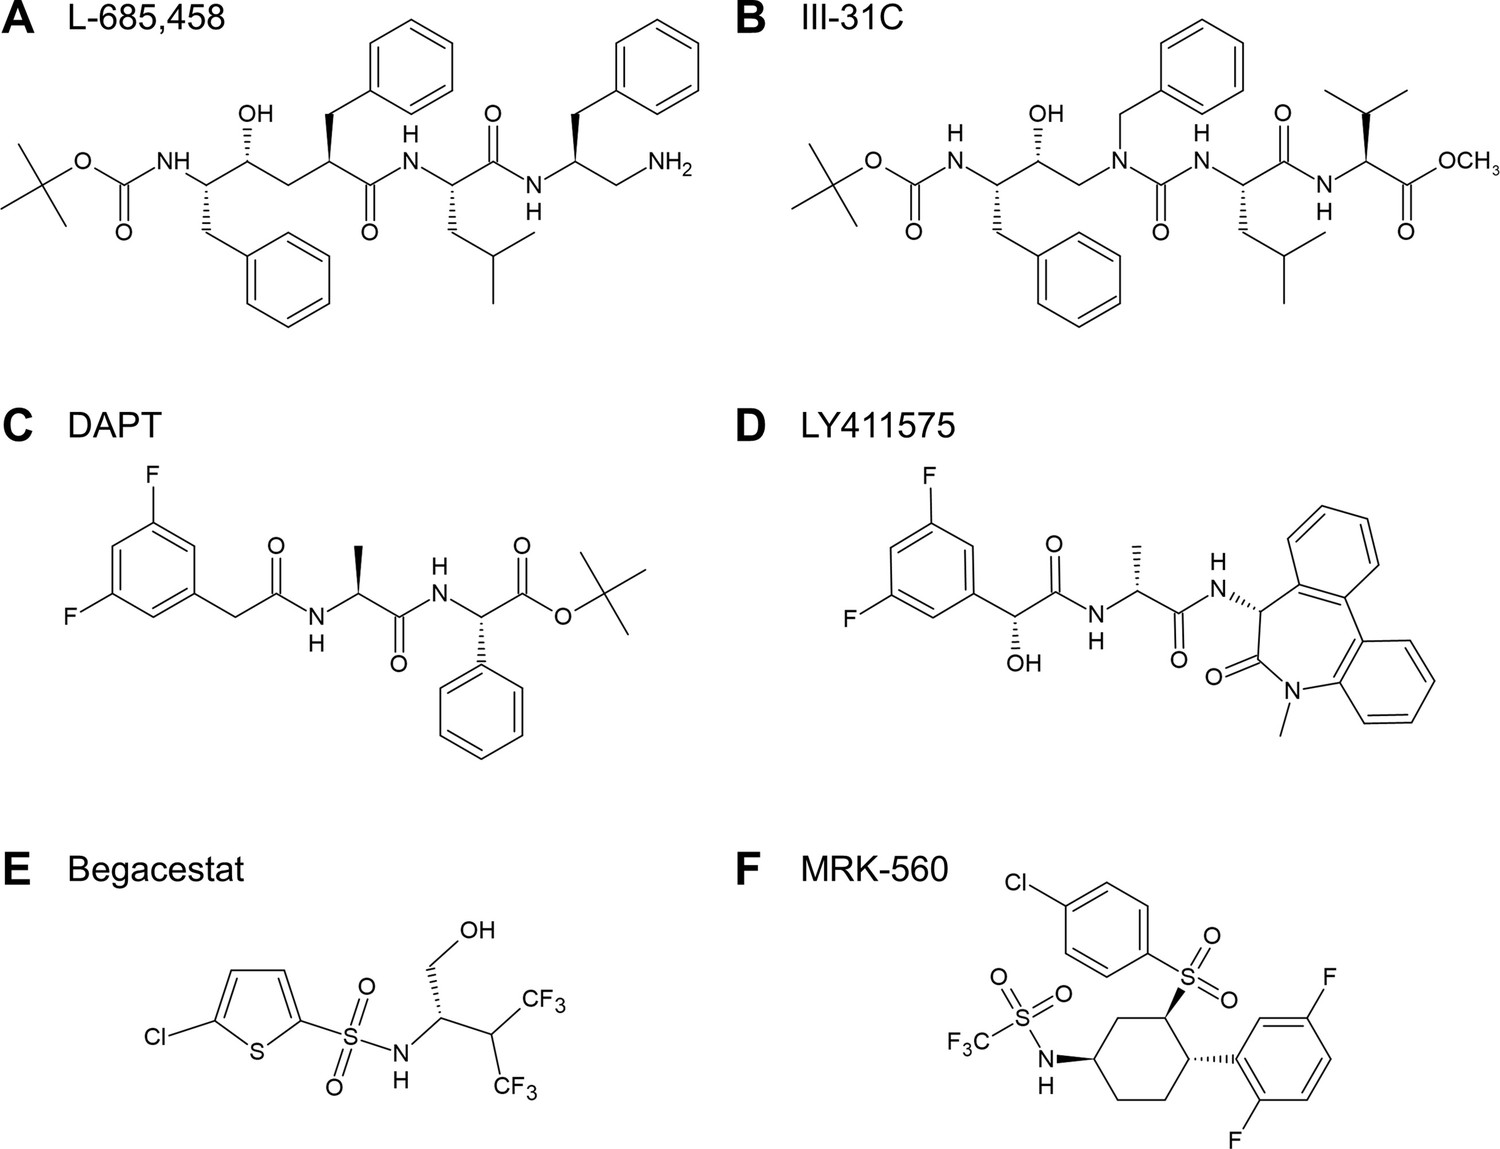
Chemical structures of GSIs.
(A, B) Structures of TSA GSIs L-685,458 (A) and III-31C (B). (C–F) Structures of non-TSA GSIs DAPT (C), LY411575 (D), Begacestat (E) and MRK-560 (F).
Appendix 1—figure 1
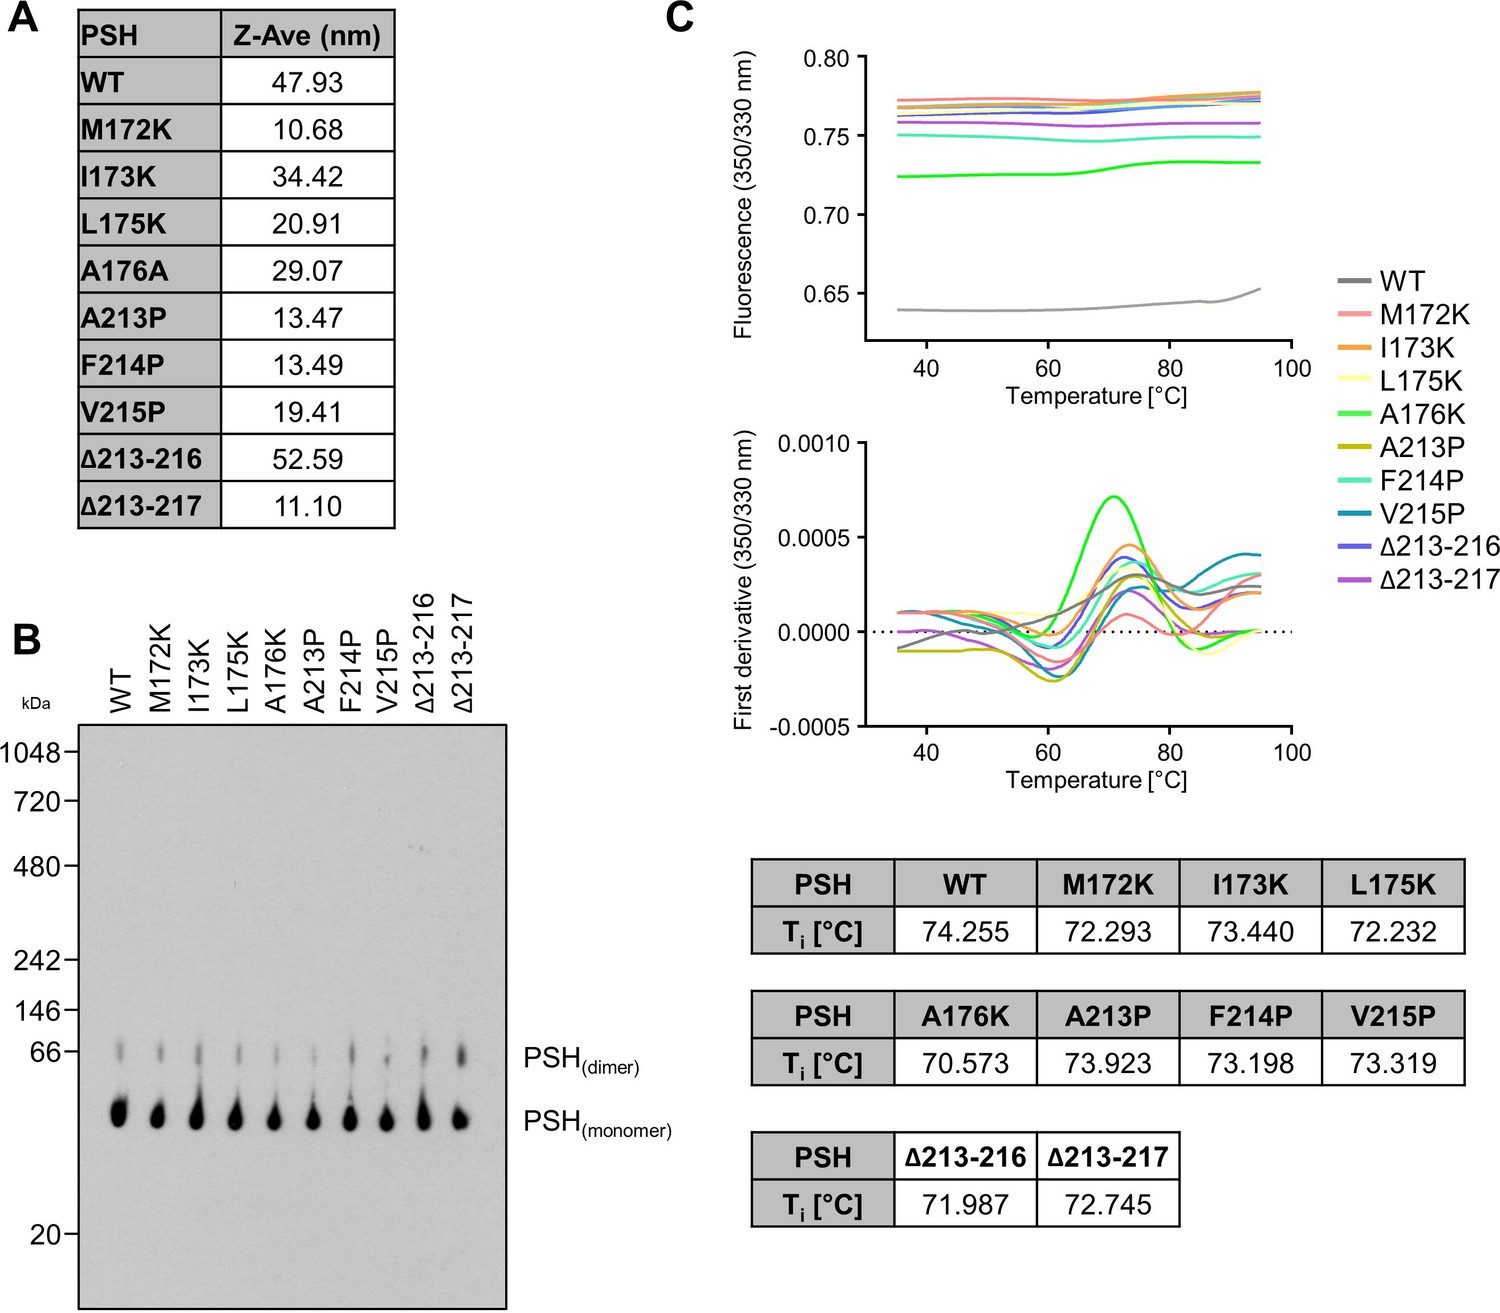
Quality control of WT and mutant PSH.
(A) Analysis of protein aggregation of WT and mutant PSH by DLS. (B) Analysis of protein aggregation of WT and mutant PSH by BN-PAGE followed by immunoblotting for PSH (6F4). (C) Analysis of protein misfolding of WT and mutant PSH by nanoDSF.
Author response image 1
Comparison of PSH activity in the POPC bilayer with and without the addition of DDM.
Analysis of PSH activity in POPC vesicles with and without the addition of 0.008% DDM after incubation with C100-His6 at 37 °C overnight by immunoblotting for AICD (Y188) and Aβ (2D8). The asterisks mark substrate degradation bands, which are independent of PSH cleavage.
Author response image 2
Cleavage of C99 by PSH reconstituted in brain lipid vesicles. (A) Analysis of PSH activity in DDM micelles, POPC vesicles and brain lipid vesicles after incubation with C100-His6 substrate at 37 °C overnight by immunoblotting for AICD (Y188) and Aβ (2D8). The asterisks mark substrate degradation bands, which are independent of PSH cleavage. (B) Separation of Aβ species produced by PSH in DDM micelles, POPC vesicles and brain lipid vesicles by Tris-Bicine urea SDS-PAGE and analysis by immunoblotting for Aβ (2D8). (C) MALDI-TOF MS analysis of Aβ species generated by PSH in brain lipid vesicles at pH 7.0. The intensity of the highest peak was set to 100%.
Author response image 3
Binding of POPC and DDM molecules on the PSH surface.
(A) The residue-wise averaged solvent residence time of POPC (blue) or DDM (red) on PSH surface. (B) Visualization of the DDM (middle) and POPC (right) residence time based on (A) from two different angles. Surfaces with long, medium and short lipid residence time are colored in blue, white, and red, respectively. Residence time is visualized in surface representation. (C) Binding of DDM (left) and POPC (middle) molecules in the gap between C83 and PSH TMD3 in the PSH simulations. In γ-secretase, this gap is blocked by the hydrophobic contact between nicastrin I242 (green) and C83 I31 (orange, right, 6IYC). (D)Binding of a POPC molecule to the PSH–C83 complex from MD simulations (left), Notchbound γ-secretase (middle, 6IDF) and C83-bound γ-secretase (right, 6IYC).
Videos
Video 1
Detergent-enzyme interaction in the DDM environment.
600 ns trajectories of PSH (red) in complex with C83 (orange) and nearby DDM molecules. A DDM molecule enters into the gap between TMD2 and TMD6. TMD6a switches between a helical and a loop conformation with the interference of the disordered DDM molecule.
Video 2
Detergent-enzyme interaction in the DDM environment.
600 ns trajectories of PSH (red) in complex with C83 (orange) and nearby DDM molecules. A DDM molecule enters into the gap between TMD3 and TMD4. TMD6a switches between a helical and a loop conformation with the interference of the disordered DDM molecule.
Video 3
Lipid-enzyme interaction in the POPC environment.
600 ns trajectory of PSH (blue) in complex with C83 (orange) and nearby POPC molecules. POPC molecules do not enter between TMD gaps and TMD6a remains a stable helix throughout the whole trajectory.
Tables
Table 1
Templates used for model building of PSH in complex with C83.
Residues of PSH used for model building are indicated.
| Template | |||
|---|---|---|---|
| 6IYC(PS1, C83) | 4HYG(Chain B) | Model 1 | |
| Model 1 | * | – | – |
| Model 2 | – | L7-D162, D220-L292 | complete |
| Model 3 | – | L7-A176, E210-A293 | complete |
-
*
PSH residues L7-R193 and E210-A293 were modeled based on the template.
Key resources table
| Reagent type (species) or resource | Designation | Source or reference | Identifiers | Additional information |
|---|---|---|---|---|
| Strain, strain background (Escherichia coli) | BL21(DE3)RIL | Agilent Technologies | Cat# 230245 | |
| Recombinant DNA reagent | pQE60-C100-His6 | Edbauer et al., 2003 | N/A | |
| Recombinant DNA reagent | pQE60-C83-His6 | This study | N/A | |
| Recombinant DNA reagent | pET21b-PSH | Li et al., 2012 | N/A | Gift from Yigong Shi |
| Antibody | Anti-APP (C-terminus) Y188 (rabbit monoclonal) | Abcam | Cat# ab32136 | IB (immunoblot) (1:5000) |
| Antibody | Anti-APP (C-terminus) 6687 (rabbit polyclonal) | Steiner et al., 2000 | N/A | IP (immunoprecipitation) (1:100–1:200) |
| Antibody | Anti-APP (Aβ22–35) Aβ (22-35) (rabbit polyclonal) | Sigma-Aldrich | Cat# A3356 | IB (1:1000) |
| Antibody | Anti-APP (Aβ1–16) 2D8 (mouse monoclonal) | Shirotani et al., 2007 | N/A | IB (3 µg/ml) |
| Antibody | Anti-APP (Aβ17–24) 4G8 (mouse monoclonal) | BioLegend | Cat# 800702 | IB (1:500-1:2500) |
| Antibody | Anti-PSH (residues 192–204) 6F4 (rat monoclonal) | This study | N/A | IB (3 µg/ml), generation of antibody described further below |
| Antibody | Anti-Penta-His (mouse monoclonal) | Qiagen | Cat# 34660 | IB (1:1000) |
| Chemical compound, drug | Ni-NTA Agarose | Qiagen | Cat# 30210 | |
| Chemical compound, drug | Calbiosorb Adsorbent beads | Calbiochem | Cat# 206550 | Discontinued |
| Chemical compound, drug | POPC | Avanti Polar Lipids | Cat# 850457P | Powder |
| Chemical compound, drug | Rhodamine-DHPE | Invitrogen | Cat# L1392 | |
| Chemical compound, drug | Sephacryl S-200 HR | GE Healthcare | Cat# 17058410 | |
| Chemical compound, drug | Streptavidin Sepharose | GE Healthcare | Cat# 17511301 | |
| Chemical compound, drug | L-685,458 | Sigma-Aldrich | Cat# 565771 | InSolution γ-Secretase Inhibitor X, used in cleavage assays |
| Chemical compound, drug | L-685,458 | Sigma-Aldrich | Cat# L1790 | Powder, dissolved in DMSO and used in inhibitor affinity precipitation experiments |
| Chemical compound, drug | Merck C | Taros Chemicals | N/A | Biotinylated L-685,458 |
| Chemical compound, drug | n-Dodecyl β-D-maltoside (DDM) | Millipore | Cat# 324355 | |
| Chemical compound, drug | Protein G Sepharose | Cytiva | Cat# 17061801 | |
| Chemical compound, drug | Protein A Sepharose | Cytiva | Cat# 17528001 | |
| Chemical compound, drug | Tropix I-BLOCK | Invitrogen | Cat# T2015 | |
| Chemical compound, drug | III-31C | Sigma-Aldrich | Cat# C0619 | |
| Chemical compound, drug | DAPT | Boehringer Ingelheim Pharma KG | N/A | |
| Chemical compound, drug | LY411575 | Karlheinz Baumann | N/A | |
| Chemical compound, drug | Begacestat | Karlheinz Baumann | N/A | |
| Chemical compound, drug | MRK-560 | Karlheinz Baumann | N/A | |
| Commercial assay or kit | V-PLEX Plus Aβ Peptide Panel 1 (4G8) Kit | Meso Scale Discovery | Cat# K15199G | |
| Commercial assay or kit | NativePAGE 4 to 16%, Bis-Tris, 1.0 mm, Mini Protein Gels, 10 wells | Invitrogen | Cat# BN1002BOX | |
| Software, algorithm | GelAnalyzer 19.1 | Istvan Lazar Jr., PhD Istvan Lazar Sr., PhD, CSc | N/A | http://www.gelanalyzer.com |
| Software, algorithm | AMBER18 | Case et al., 2005 | N/A | |
| Software, algorithm | CHARMM-GUI | Jo et al., 2008 | N/A | |
| Software, algorithm | SWISS-MODEL | Waterhouse et al., 2018 | N/A | |
| Software, algorithm | PROPKA3.1 | Olsson et al., 2011; Sondergaard et al., 2011 | N/A | |
| Software, algorithm | DSSP | Kabsch and Sander, 1983; Touw et al., 2015 | N/A |
Table 2
pKa predictions as calculated by PROPKA3.1 for published PSH and γ-secretase structures.
pKa values of the catalytic aspartate residue which is most likely protonated are indicated in red.
| PDB ID | Enyzme | Ligand | pKa (D162, D220) |
|---|---|---|---|
| 4HYG | PSH | None | 5.04, |
| 4Y6K | PSH | III-31-C | 5.63, |
| PDB ID | Enyzme | Ligand | pKa (D257, D385) |
| 4UIS | PS1 | None | 3.18, |
| 5A63 | PS1 | None | 4.42, |
| 5FN5 | PS1 | None | , 3.63 |
| 5FN4 | PS1 | Unknown helix | 4.70, |
| 5FN3 | PS1 | Unknown helix | 4.90, |
| 5FN2 | PS1 | DAPT | 5.13, |
| 6IYC | PS1 | C83 | 6.39, X* |
| 6IDF | PS1 | Notch1 | 6.21, X* |
| 6LR4 | PS1 | Semagacestat | 6.12, |
| 6LQG | PS1 | Avagacestat | 6.08, |
| 7V9I | PS1 | L-685,458 | 7.11, |
| 7D8X | PS1 | L-685,458 and E2012 | 7.01, |
-
*
For structure determination D385 was mutated to alanine and therefore no pKa value is given.
Additional files
Download links
A two-part list of links to download the article, or parts of the article, in various formats.
Downloads (link to download the article as PDF)
Open citations (links to open the citations from this article in various online reference manager services)
Cite this article (links to download the citations from this article in formats compatible with various reference manager tools)
Active site geometry stabilization of a presenilin homolog by the lipid bilayer promotes intramembrane proteolysis
eLife 11:e76090.
https://doi.org/10.7554/eLife.76090


