Characterization of sequence determinants of enhancer function using natural genetic variation
- Department of Neurobiology, Harvard Medical School, United States
- Program in Neuroscience, Harvard Medical School, United States
- Developmental Biology Program, Sloan Kettering Institute for Cancer Research, United States
- Center for Stem Cell Biology, Sloan Kettering Institute for Cancer Research, United States
Figures
Figure 1 with 2 supplements
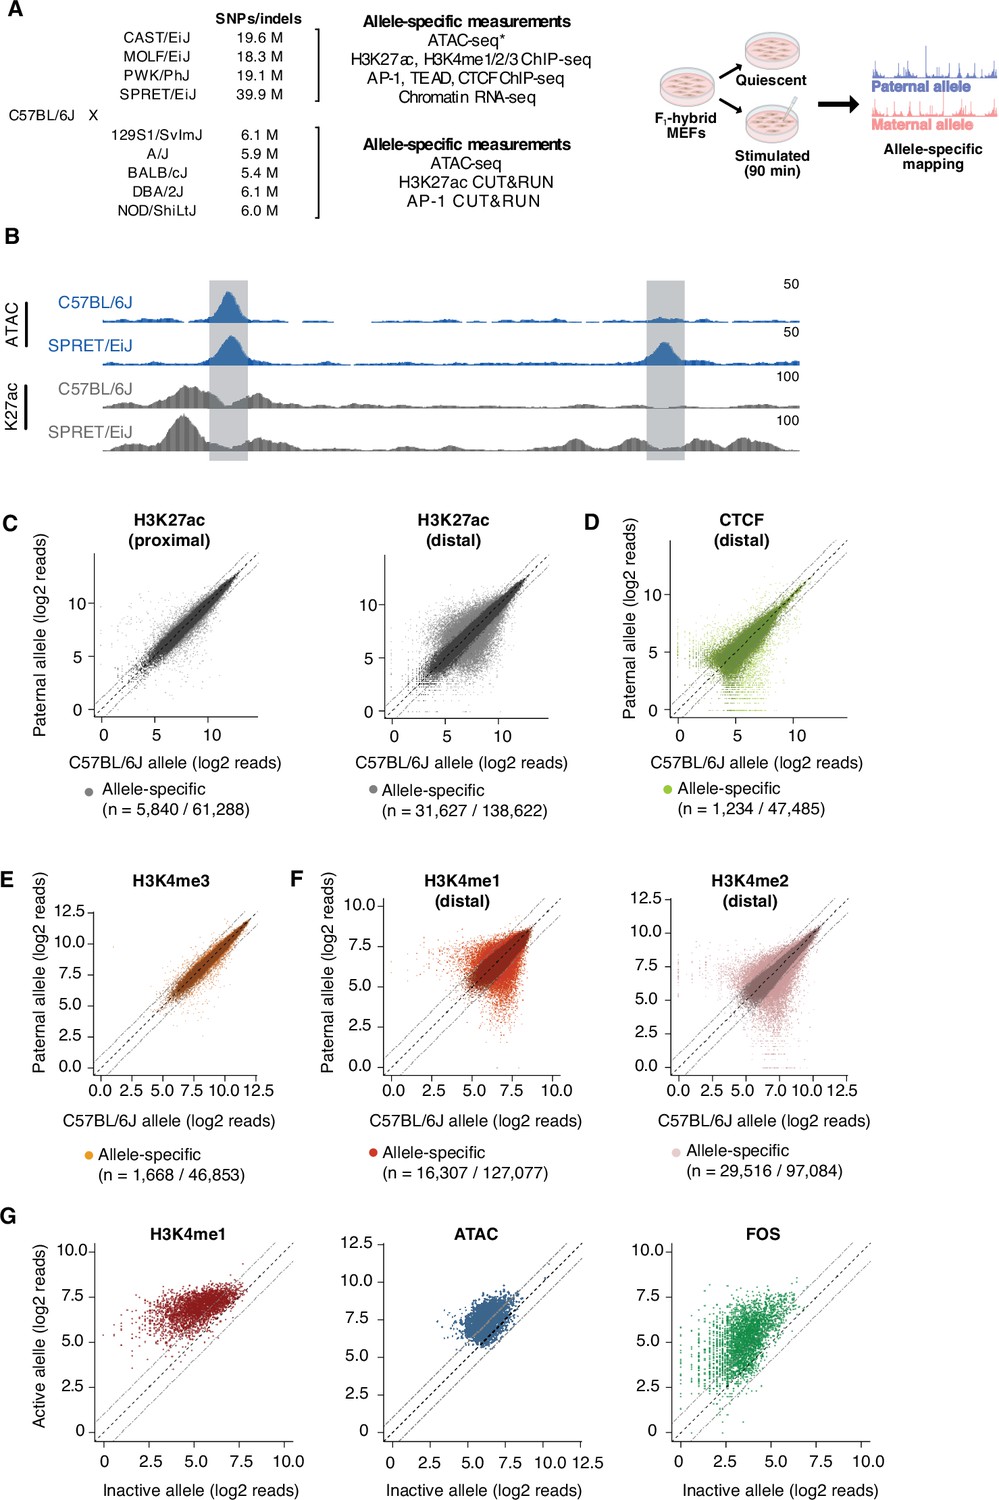
Allele-specific mapping of CREs and TF binding.
(A) F1-hybrid male MEFs were derived from crosses between female C57BL/6 J mice and male mice from a panel of inbred mouse strains. Experiments were performed in quiescent (0 min) and serum-stimulated (90 min) MEFs from at least two independent male embryos as biological replicates for each assay. Reads were mapped to either the maternal or paternal allele to quantify chromatin state and TF binding at CREs in an allele-specific manner. For wild-derived inbred strains, ATAC-seq data was generated using MEFs from corresponding parental lines and compared with chromatin accessibility in C57BL/6 J MEFs. Similarly, H3K27ac Hi-ChIP data was obtained only from starved and serum-stimulated MEFs from C57BL/6 J mice. All other genomic data indicated herein were obtained using MEFs derived from male F1-hybrid embryos. (B) Example genome browser track of a locus (chr5:147,587,473–147,599,697 in mm10 genome) with an allele-specific enhancer (indicated in gray, on the right) in C57BL/6 J x SPRET/EiJ F1-hybrid MEFs. Normalized read densities for ATAC-seq and H3K27ac ChIP-seq for each allele are shown. (C–F) Scatterplots of maternal (C57BL/6 J) and paternal allele-specific signal for histone modifications and CTCF binding (n=61,288 proximal H3K27ac, n=138,662 distal H3K27ac, n=47,485 distal CTCF, n=46,853 proximal H3K4me3, n=127,077 distal H3K4me1, and n=97,084 distal H3K4me2 allele pairs, respectively). Points indicated in light and dark colors represent peaks with and without a significant skew in signal between alleles, respectively (FDR <0.1 with DESeq2). CTCF and H3K4me3 levels were less likely to show an allele-specific skew in signal, in comparison with H3K27ac levels at active enhancers (Fisher’s exact test, p<2.2 x 10⁻¹⁶ for CTCF, p<2.2 x 10⁻¹⁶ for H3K4me3). (G) Scatterplot of allele-specific H3K4me1, ATAC-seq, and Fos binding signal at top decile of allele-specific enhancers, comparing signal from the active and inactive alleles (defined based on relative H3K27ac levels) to one another (n=13,862 allele pairs).
Figure 1—figure supplement 1

Allele-specific quantification of chromatin-associated RNA-seq data.
(A) Volcano plots of chromatin-associated RNA-seq read density at annotated gene bodies. Indicated on the horizontal axis is the ratio of allele-specific signal between paternal and maternal (C57BL/6 J) alleles for each F1-hybrid strain. Transcripts whose expression levels are significantly allele-specific in DEseq2 (FDR <0.1) and edgeR (FDR <0.05) are highlighted in blue. (B) (Left) Number of SNPs/indels annotated in each wild-derived inbred mouse strain, relative to the C57BL/6 J genome. (Right) Number of transcripts per F1-hybrid line with significant allele-specific expression from reads pooled across all timepoints (0, 20, and 90 min).
Figure 1—figure supplement 2
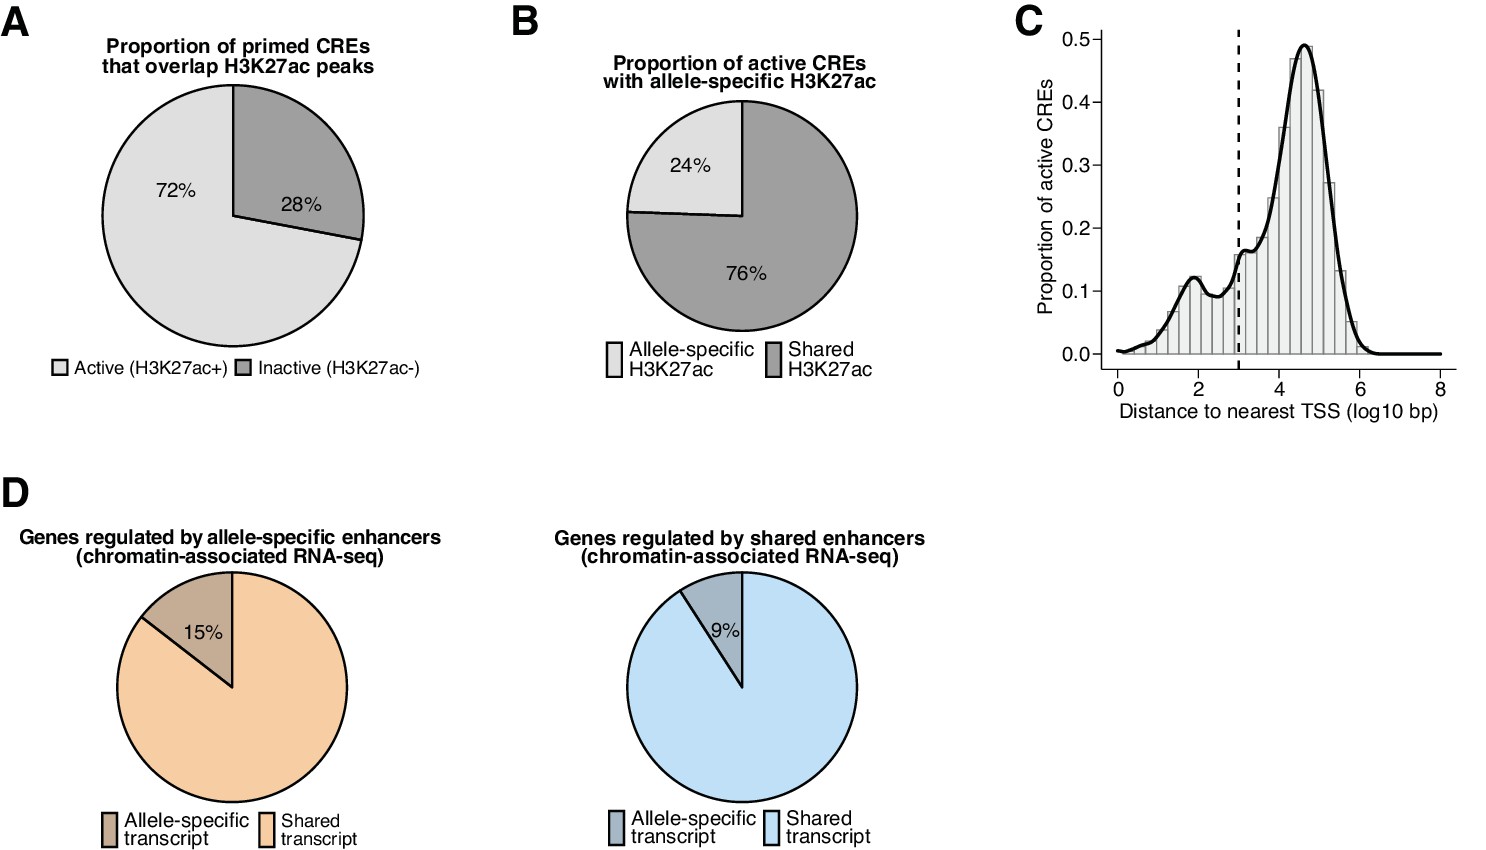
Properties of active CREs and regulated target genes in fibroblasts.
(A) Percentage of primed CREs (ATAC-seq summits overlapping H3K4me1/2 peaks) identified in any F1-hybrid strain that are active regulatory elements (overlap H3K27ac peaks). In total, we found n=283,339 pairs of active CRE alleles across all F1-hybrids in our dataset, including n=142,898 pairs that contained SNP(s) within the central 120 bp relative to their respective ATAC-seq summits, which we considered to be highly mappable sites. (B) Percentage of active CREs with a significant skew in H3K27ac levels between alleles, which we denoted as allele-specific enhancers or promoters (based on distance to their nearest annotated TSS) for subsequent analyses (n=31,627/138,622 allele pairs; FDR <0.1 with DEseq2). (C) Distance to nearest annotated TSS for active CREs identified in any F1-hybrid strain (median = 19,786 bp). CREs were considered gene-distal if they occurred >1 kb from the nearest annotated TSS (cutoff denoted by dashed line). (D) Percentage of active enhancers that exhibit an allele-specific skew in nascent transcription levels for putative target genes, which were identified by statistically significant H3K27ac Hi-ChIP loops formed with active promoters that overlap an annotated TSS. Allele-specific enhancers are more likely than enhancers with shared H3K27ac signal to be linked with allele-specific transcripts (n=1002/6907 and n=3403/37,390 detectable Hi-ChIP loops for allele-specific and shared enhancers, respectively; Fisher’s exact test, p=2.2 x 10⁻¹⁶).
Figure 2 with 2 supplements
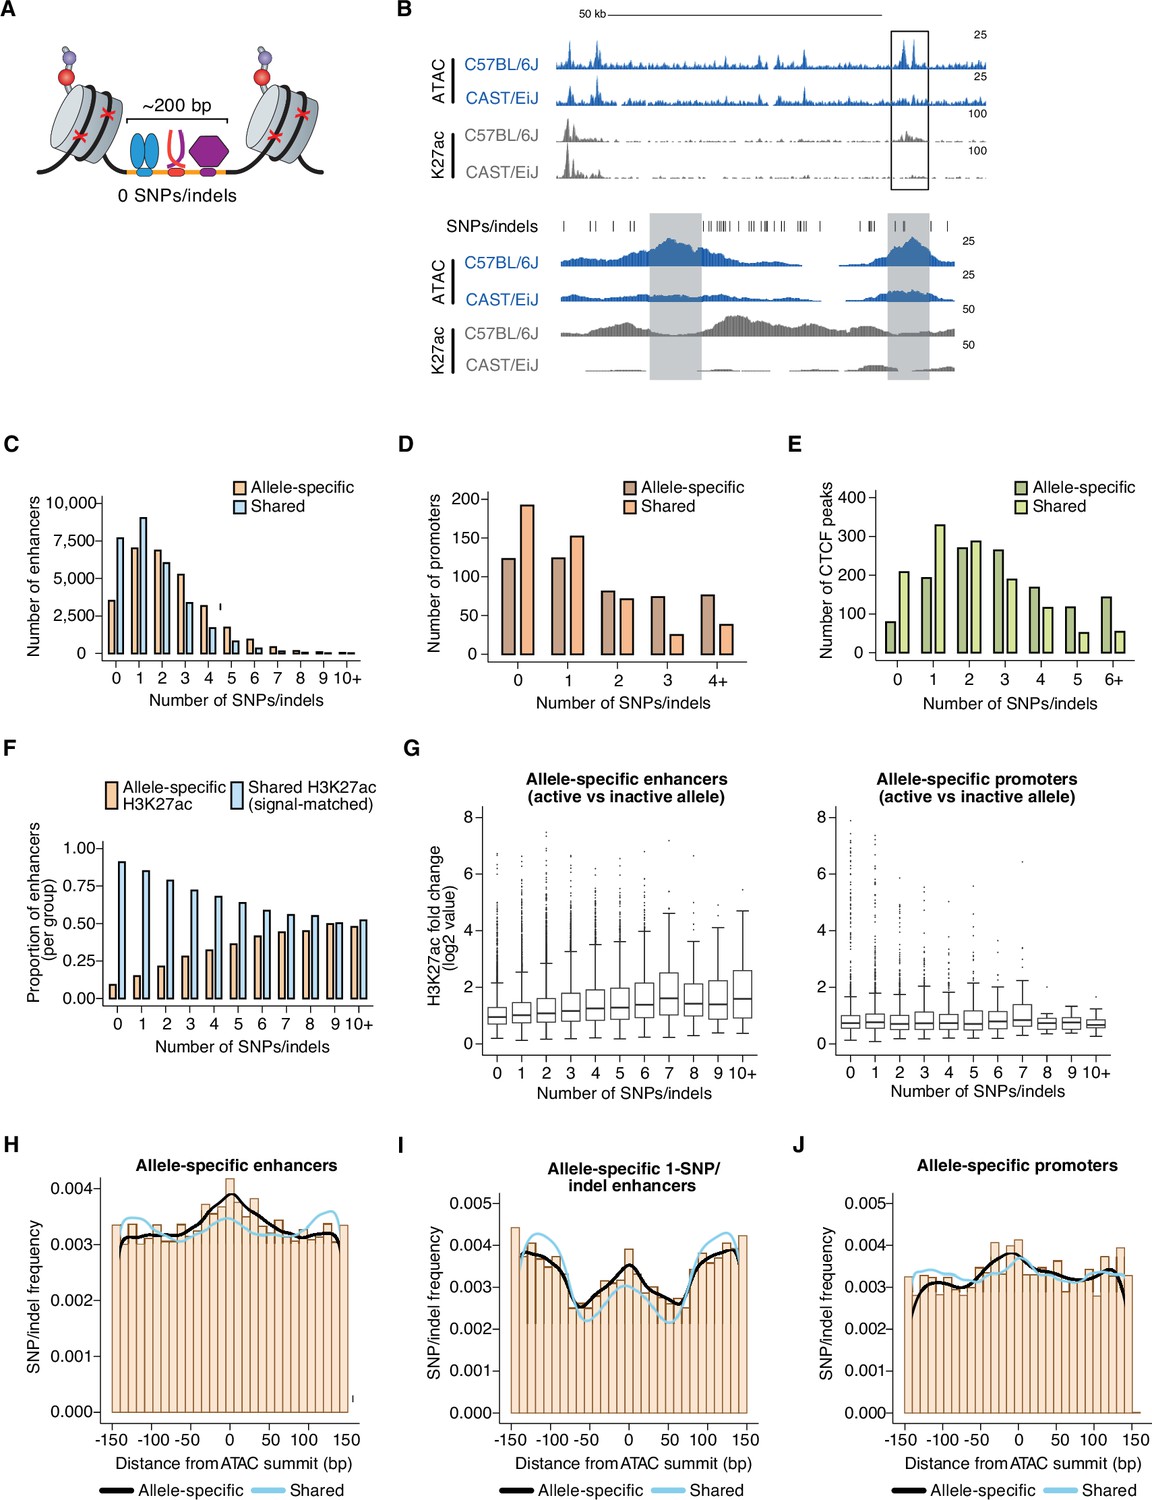
Number and position of genetic variants at allele-specific CREs.
(A) Schematic depicting TF-bound enhancer with zero SNPs/indels (denoted by red X’s) in the transposase-accessible CRE region (indicated in orange). Nucleosomes flanking both ends of the accessible region at active enhancers are marked by histone post-translational modifications, which are used as proxies for the transcriptional state of each enhancer. DNA sequences in these flanking regions tend to also be less conserved that sequences within enhancers themselves, thus often allowing sequencing reads to be correctly assigned to one of two genomes in F1-hybrid cells in the absence of SNPs/indels within enhancer sequences. (B) Example genome browser track of a locus (chr11:113,290,106–113,416,149 (top) and chr11:113,350,775–113,356,042 (bottom) in mm10 genome) with an allele-specific 0-SNP/indel enhancer (indicated in gray, on the left) within an enhancer “cluster” in C57BL/6 J x CAST/EiJ F1-hybrid MEFs. The 0-SNP enhancer is situated <2 kb from a SNP/indel-containing enhancer (indicated in green) within the same cluster. Normalized read densities for ATAC-seq and H3K27ac ChIP-seq for each allele are shown. Tick marks indicate positions of annotated SNPs/indels that distinguish the C57BL/6 J and CAST/EiJ genomes. (C–E) Histogram of number of SNPs/indels present within the central 150 bp of allele-specific and signal-matched, shared active enhancers, promoters, and putative insulators (mean = 2.36 and 1.57 SNPs/indels for enhancers, respectively, two-tailed unpaired t-test, P<2.2 x 10⁻¹⁶ for enhancers; mean = 1.84 and 1.09 SNPs/indels for promoters, respectively; two-tailed unpaired t-test, P=7.9 x 10⁻⁴ for promoters; mean = 2.95 and 2.03 SNPs/indels for insulators, respectively; two-tailed unpaired t-test, p<2.2 x 10⁻¹⁶ for insulators). Shared enhancers were randomly subsampled such that they were signal-matched to the active allele signal from the total set of allele-specific enhancers. (F) Proportion of enhancers that show allele-specific and >2 fold difference in signal, plotted as a function of the number of SNPs/indels present within their central 150 bp. Shared enhancers were randomly subsampled such that they were signal-matched to the active allele signal from the total set of allele-specific enhancers. (G) Box and whisker plot of H3K27ac fold changes between active and inactive alleles for allele-specific enhancers and promoters, plotted as a function of the number of SNPs/indels present within their central 150 bp. (H–J) Frequency of SNPs/indels at positions relative to ATAC-seq summits for allele-specific (and >2-fold) versus signal-matched, shared active enhancers, 1-SNP active enhancers, and H3K4me3-marked promoters (Pearson’s Chi-squared test, p<2.2 x 10⁻¹⁶ for enhancers, p=5.4 x 10⁻⁵ for 1-SNP enhancers, p=2.6 x 10⁻⁹ for promoters). Mean number of SNPs within central 150 bp of enhancers: 4.468 for enhancers with allele-specific H3K27ac levels, 3.203 for signal-matched enhancers with shared H3K27ac levels.
Figure 2—figure supplement 1
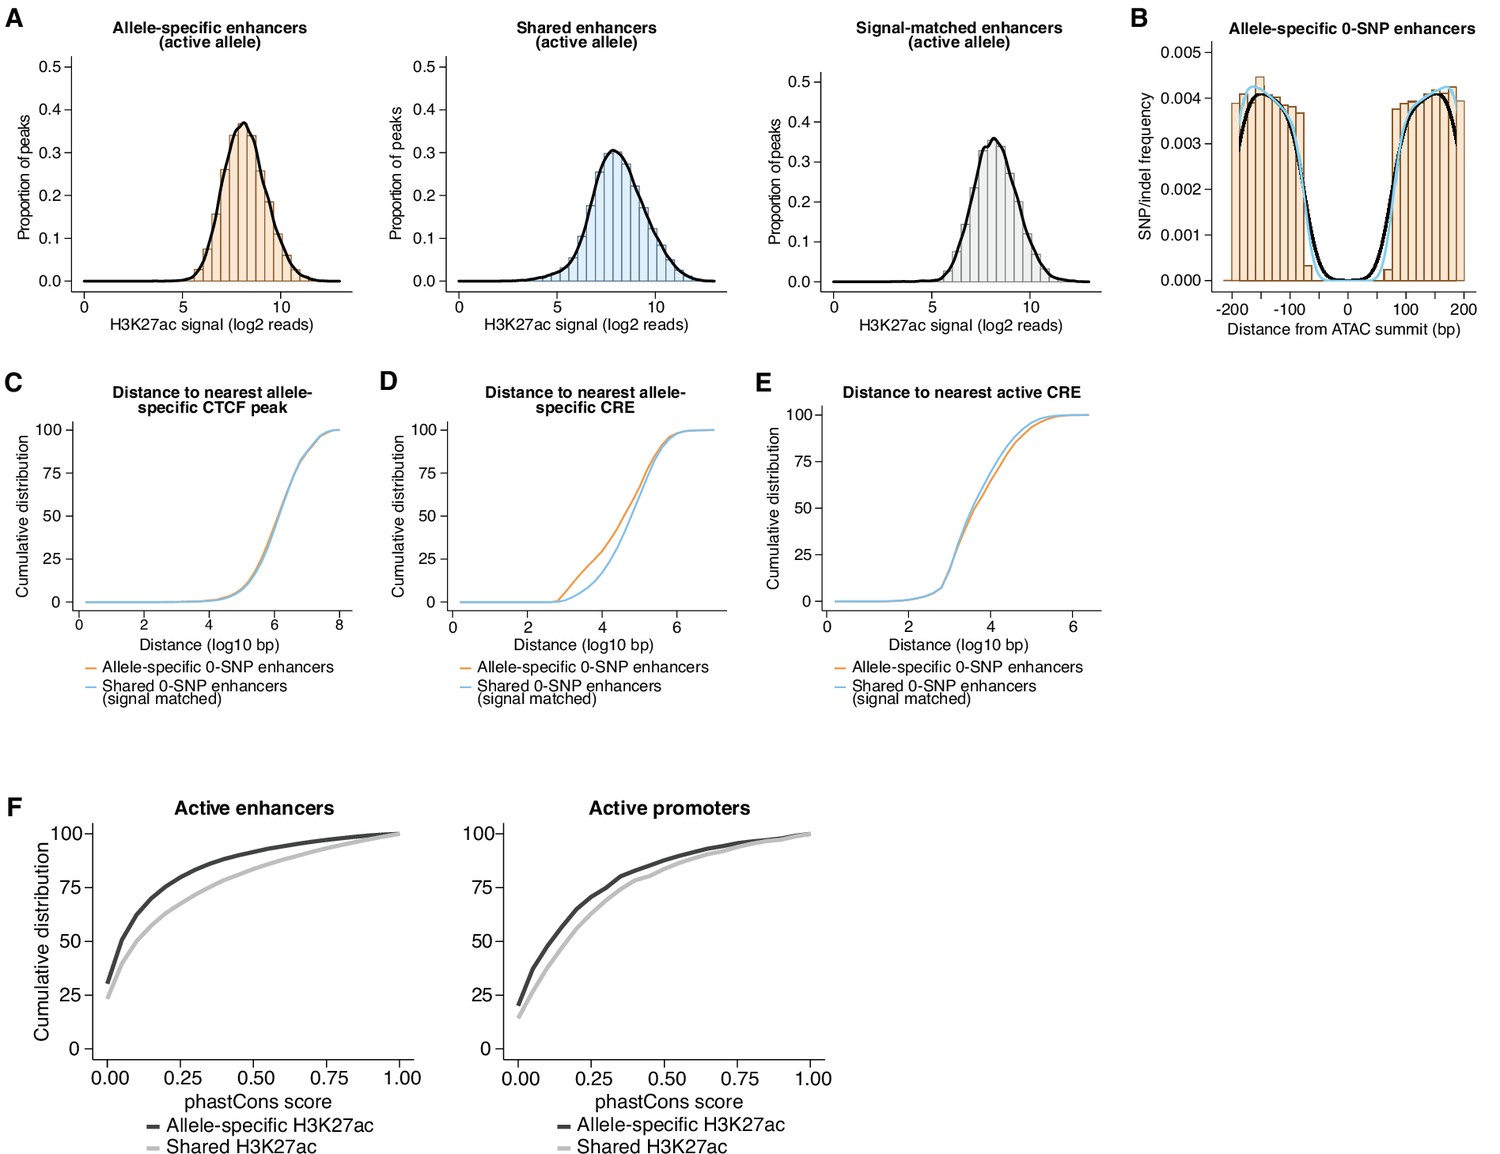
Features of 0-SNP enhancers and evolutionary conservation of fibroblast CREs.
(A) Distribution of H3K27ac signal from the active allele at (1) allele-specific enhancers, (2) all shared enhancers, and (3) a randomly subsampled set of shared enhancers that were signal-matched to the active allele of allele-specific sites. (B) Frequency of SNPs/indels for enhancers in our dataset assigned as 0-SNP/indel enhancers, which we defined as those having no annotated genetic variants within 75 bp of the ATAC-seq summit. No notable differences in the pattern of SNPs/indels were observed between allele-specific (black trace) and shared (blue trace) 0-SNP enhancers in regions flanking the central 150 bp window that contains no genetic variants. (C–E) Cumulative distribution of distances to nearest allele-specific CTCF peak, nearest allele-specific CRE, and nearest active CRE. Shown is a comparison between allele-specific and signal-matched, shared enhancers, and both sets of sites contain zero SNPs/indels in their central 150 bp (Kolmogorov-Smirnov, p=0.0142 for nearest allele-specific CTCF peak; Kolmogorov-Smirnov D=0.02788 for nearest allele-specific CTCF peak; p<0.0001 for nearest allele-specific CRE; Kolmogorov-Smirnov D=0.1313 for nearest allele-specific CRE; p<0.0001 for nearest active CRE; Kolmogorov-Smirnov D=0.05563, for nearest active CRE). (F) Cumulative distribution of phastCons scores for allele-specific and signal-matched, shared active enhancers and promoters (Kolmogorov-Smirnov, p<0.0001 and Kolmogorov-Smirnov D=0.1274 for enhancers; Kolmogorov-Smirnov, p<0.0001 and Kolmogorov-Smirnov D=0.1137 for promoters).
Figure 2—figure supplement 2
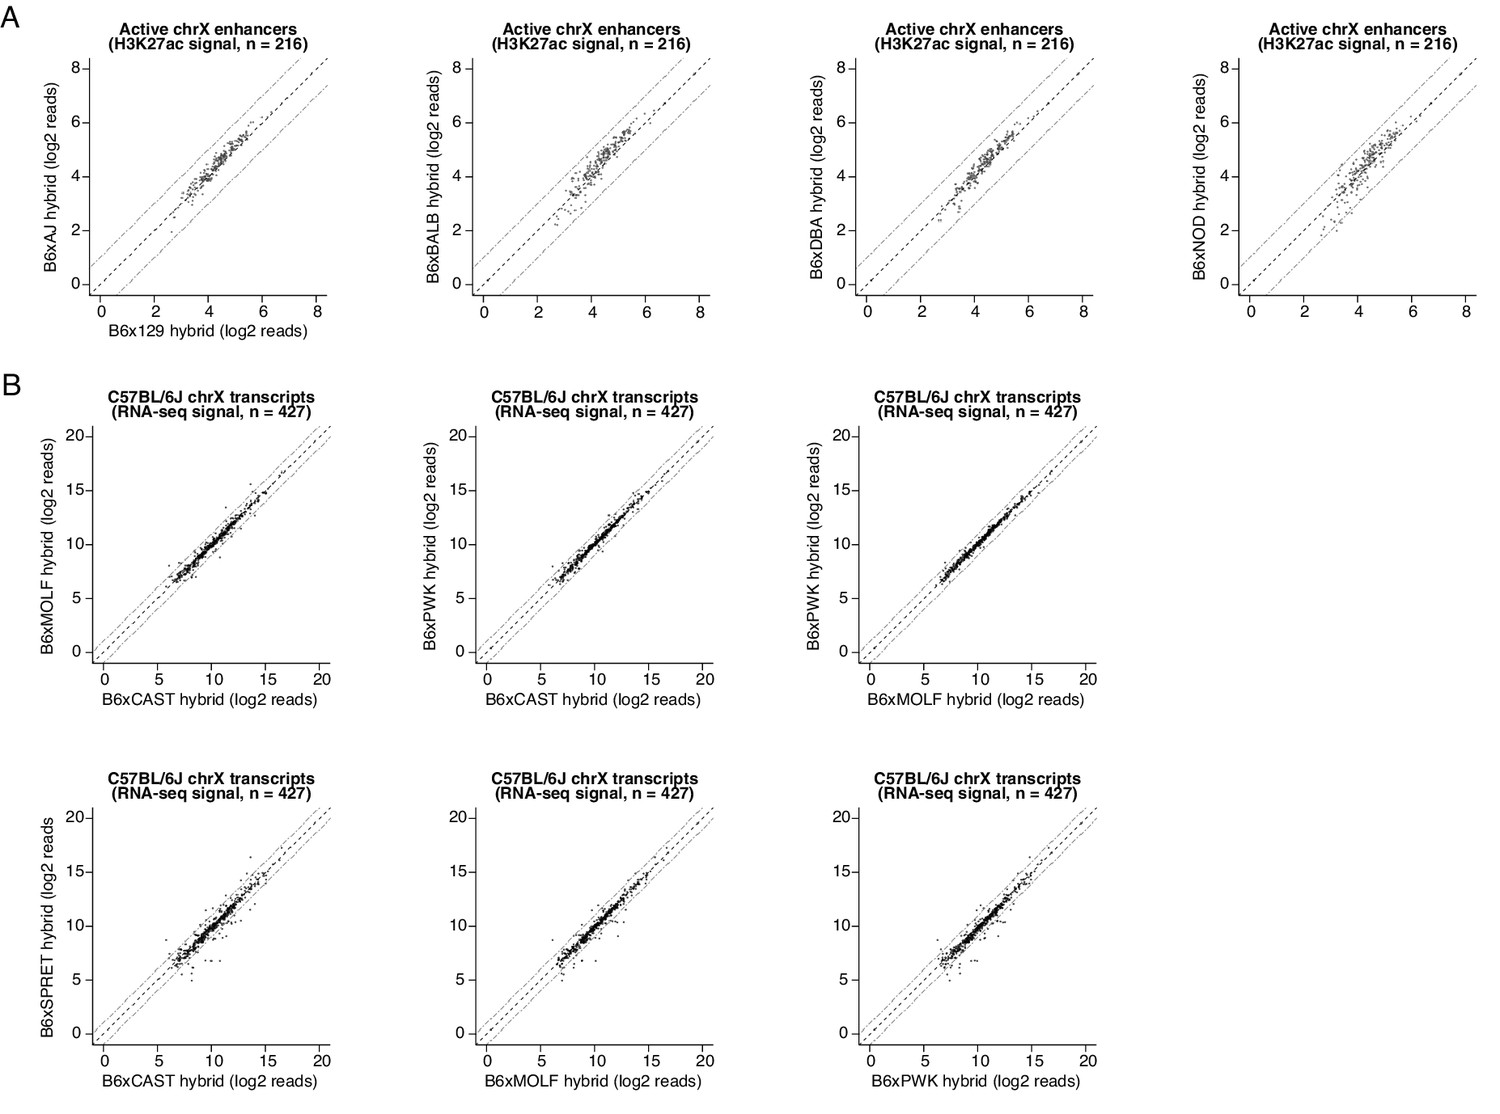
Quantification of trans-acting effects on enhancer H3K27ac levels and chromatin-associated RNA-seq values.
(A) Scatterplot of H3K27ac CUT&RUN signal at active CREs identified on the X-chromosome of the C57BL/6Jx129/SvImJ F1 hybrid (n=216 peaks). Shown are pairwise comparisons of H3K27ac read densities from the C57BL/6Jx129/SvImJ line and normalized H3K27ac CUT&RUN signal from other F1-hybrid lines. Since we set up our breeding scheme such that each F1-hybrid MEF line was derived only from male embryos that contain a single X-chromosome inherited from their C57BL/6 J mother, this enabled us to quantify chromatin state without the need for allele-specific mapping at this particular set of CREs. (B) Scatterplot of nascent RNA-seq read counts overlapping gene bodies of expressed transcripts on the C57BL/6 J X-chromosome (with an average of at least 100 reads per F1-hybrid line). For example, amongst 427 expressed genes on the X-chromosome, we found that n=39 (9.3%) were expressed with >2 fold difference in signal between alleles, when comparing the C57BL/6 J x CAST/EiJ and the C57BL/6 J x SPRET/EiJ F1 hybrids.
Figure 3 with 2 supplements
Sequence motifs and changes in chromatin state at allele-specific TF-bound sites.
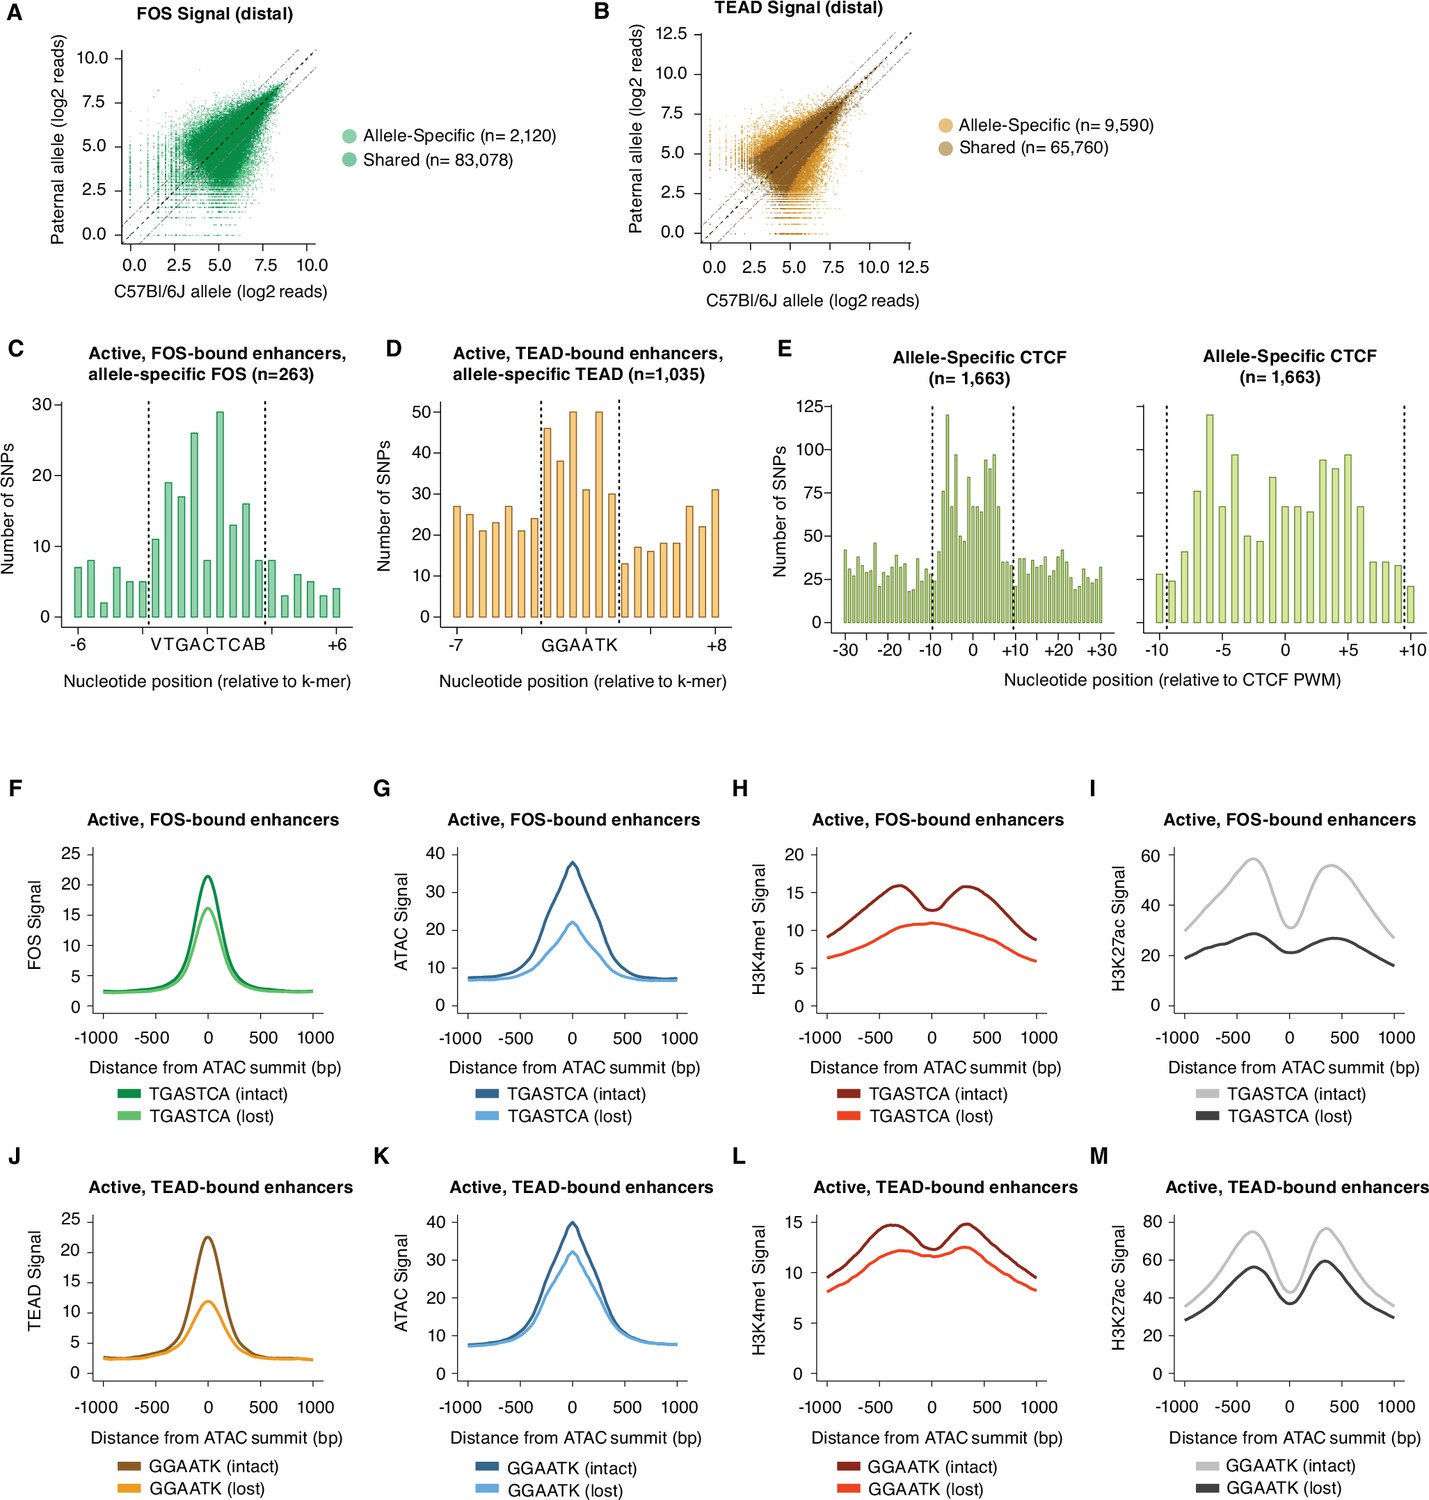
(A–B) Scatterplots of maternal (C57BL/6 J) and paternal allele-specific signal for AP-1 and TEAD binding (n=85,198 distal Fos, and 75,350 distal Tead1 allele pairs, respectively). Points indicated in light and dark colors represent peaks with and without a significant skew in signal between alleles, respectively (FDR <0.1 with DESeq2). (C–D) Distribution of SNPs centered on respective k-mers (denoted by dashed lines) at allele-specific, active, and gene-distal Fos and Tead1 peaks with >2-fold difference in binding signal across alleles (n=263 and n=1035 allele pairs, respectively). (E) Distribution of SNPs centered on CTCF PWM (JASPAR matrix ID MA0139.1; denoted by dashed lines) at allele-specific, gene-distal CTCF peaks with >2-fold difference in binding signal across alleles (n=1,663 allele pairs). (F–I) Aggregate plot of allele-specific Fos, ATAC-seq, H3K4me1, and H3K27ac reads centered on ATAC-seq summits at active Fos peaks. These sites have been selected because they contain a single SNP/indel-containing AP-1 site and no shared AP-1 sites within 75 bp of the ATAC-seq summit. Signal is compared between alleles with intact versus mutated core AP-1 motifs (TGASTCA; n=1307 allele pairs). (J–M) Aggregate plot of allele-specific Tead1, ATAC-seq, H3K4me1, and H3K27ac reads centered on ATAC-seq summits at active Tead1 peaks. These sites have been selected because they contain a single SNP/indel-containing TEAD site and no shared TEAD sites within 75 bp of the ATAC-seq summit. Signal is compared between alleles with intact versus mutated core TEAD motifs (GGAATK; n=1132 allele pairs).
Figure 3—figure supplement 1
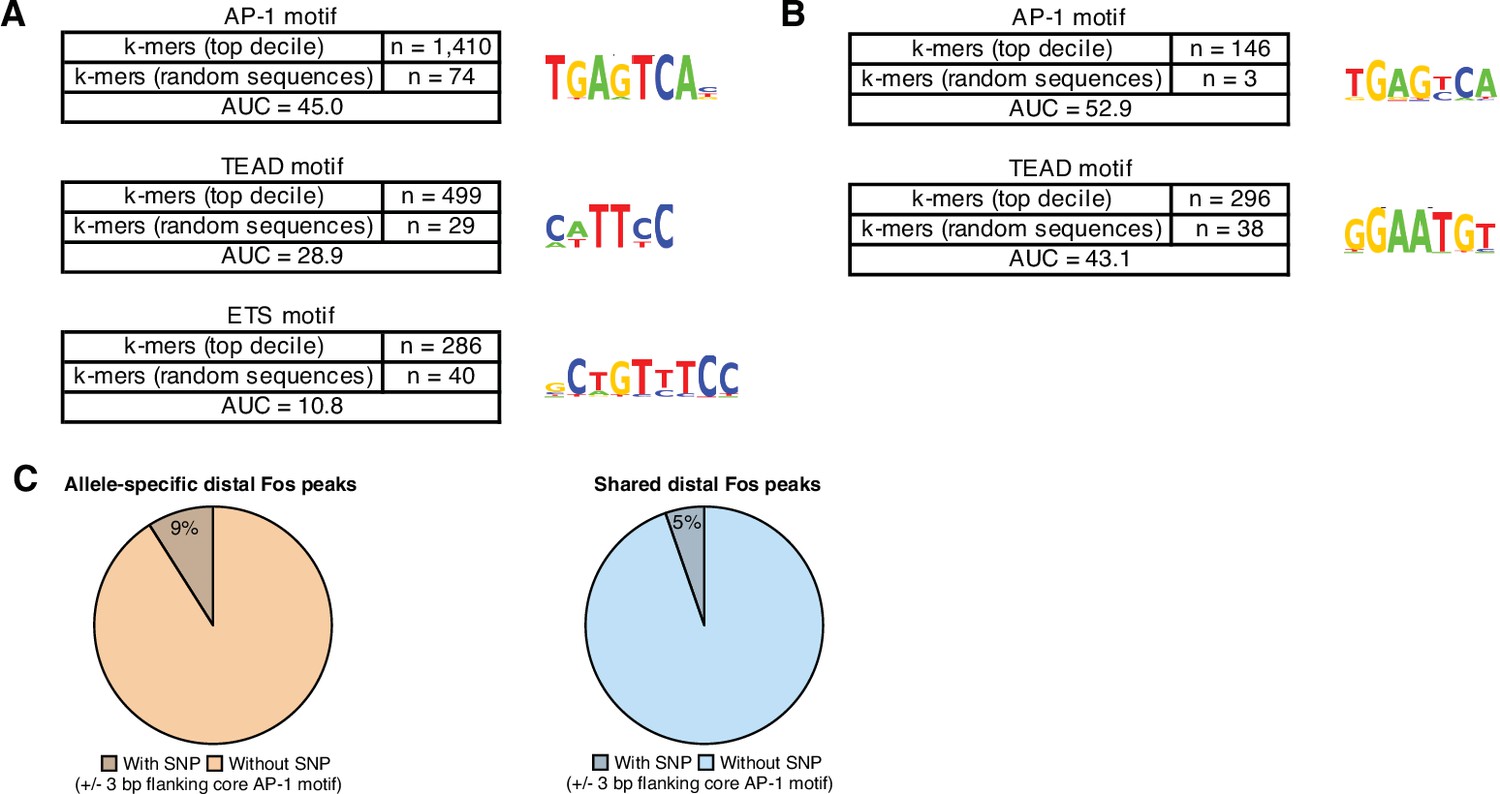
Enriched DNA-binding motifs at active and constitutive enhancers.
(A) Top enriched k-mer clusters identified with the KMAC algorithm present in the top decile of active C57BL/6 J enhancers (Guo et al., 2018). DNA sequence from central 60 bp of enhancer regions were compared with random GC- and length-matched regions in the C57BL/6 J genome. AP-1 k-mers were present in n=1410/4579 active enhancers and n=74/4579 control regions, respectively. TEAD k-mers were present in n=499/4579 active enhancers and n=29/4579 control regions, respectively. (B) Top enriched k-mer clusters identified with the KMAC algorithm present in late-response gene enhancers in the C57BL/6 J genome. Control regions used for comparison were constitutively active enhancers in the C57BL/6 J genome. (C) Percentage of allele-specific versus shared Fos peaks that contain an extended AP-1 motif (VTGACTCAB) with a SNP in the 3 bp flanking the core motif (TGACTCA; Fisher’s exact test, p=5.2 x 10⁻³).
Figure 3—figure supplement 2

Validation of Fos and H3K27ac CUT&RUN experiments.
(A) Scatterplot of Fos ChIP-seq read density at Fos peaks originally identified in C57BL/6 J MEFs, comparing signal from commercial (Santa Cruz Biotechnology sc-7202X) and in-house generated Fos (1096AE) antibodies. (B) Scatterplot of read density at Fos peaks originally identified in C57BL/6 J MEFs, comparing signal from Fos and HA ChIP-seq experiments performed in MEFs expressing an epitope-tagged form of Fos (Fos-FLAG-HA). (C) Scatterplot of HA ChIP-seq read density at Fos peaks originally identified in C57BL/6 J MEFs, comparing signal in wild-type C57BL/6 J MEFs and Fos-FLAG-HA MEFs. (D) Fraction of mapped reads in C57BL/6 J MEFs that fall within Fos and H3K27ac peaks (500 bp and 1 kb windows, respectively). Identical antibodies were used for ChIP-seq and CUT&RUN experiments. (E) Fragment lengths for mappable paired-end Fos and H3K27ac CUT&RUN reads (median = 139 and 163 bp, respectively). (F) Aggregate plot of Fos CUT&RUN reads mapped to the C57BL/6 J genome, pooled from data across five F1-hybrid lines, and centered on ATAC-seq summits at Fos peaks originally identified in C57BL/6 J MEFs. Paired-end reads are categorized based on fragment size as either sub-nucleosomal (<120 bp) or nucleosomal (>150 bp). (G) MNase cut site probability for Fos CUT&RUN reads defined using CUT&RUNTools (Zhu et al., 2019) identifies a TF footprint centered on MTGAGTCA k-mer at Fos peaks, suggesting that our CUT&RUN data can reliably identify instances of direct AP-1 binding.
Figure 4
Mechanisms of hierarchical binding for AP-1 and TEAD TFs.
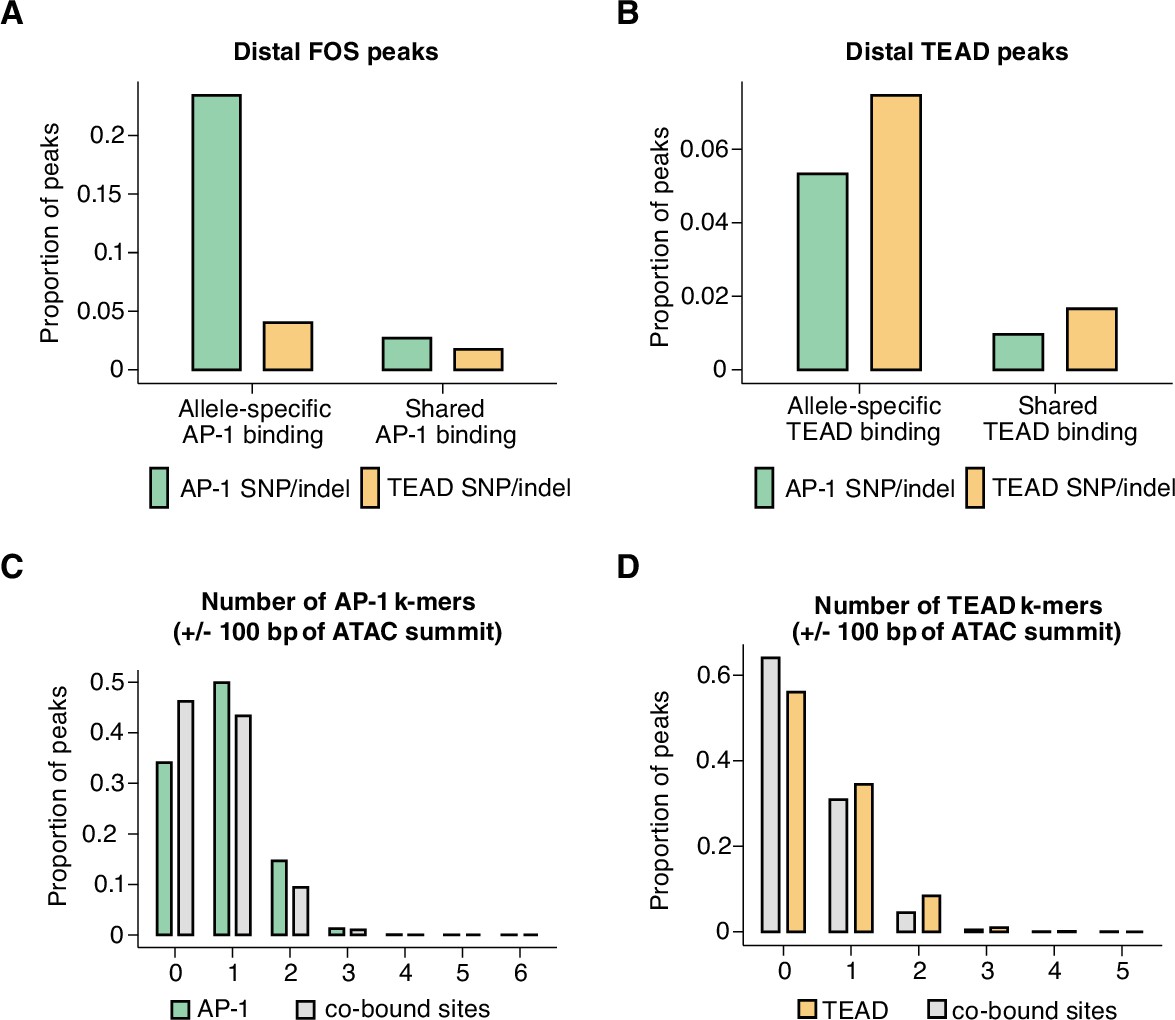
(A) Percentage of allele-specific (n=1635 allele pairs) versus shared (n=142,778 allele pairs) gene-distal Fos peaks that contain strain-specific core AP-1 (TGASTCA; Fisher’s exact test, p<2.2 x 10⁻¹⁶) or extended TEAD (GGAATK; Fisher’s exact test, p=2.123 x 10⁻⁹) k-mer(s) within 75 bp of their respective ATAC-seq summits. (B) Percentage of allele-specific (n=9416 allele pairs) versus shared (n=65,934 allele pairs) gene-distal Tead1 peaks that contain strain-specific core AP-1 (TGASTCA; Fisher’s exact test, p<2.2 x 10⁻¹⁶) or extended TEAD (GGAATK; Fisher’s exact test, p<2.2 x 10⁻¹⁶) k-mer(s) within 75 bp of their respective ATAC-seq summits. (C) Percentage of AP-1-only (n=15,709 loci) peaks versus AP-1/TEAD co-bound peaks (n=2797 loci) in the C57BL/6 J genome with at least one bindable AP-1 k-mer (VTGACTCB, VTGAATCAB, or VTTAGTCAY) present within 50 bp of their respective ATAC-seq summits (Fisher’s exact test, p<2.2 x 10⁻¹⁶). (D) Percentage of TEAD-only (n=2541 loci) peaks versus AP-1/TEAD co-bound peaks in the C57BL/6 J genome with at least one extended TEAD k-mer (GGAATK) present within 50 bp of their respective ATAC-seq summits (Fisher’s exact test, p=2.406 x 10⁻⁹).
Figure 5
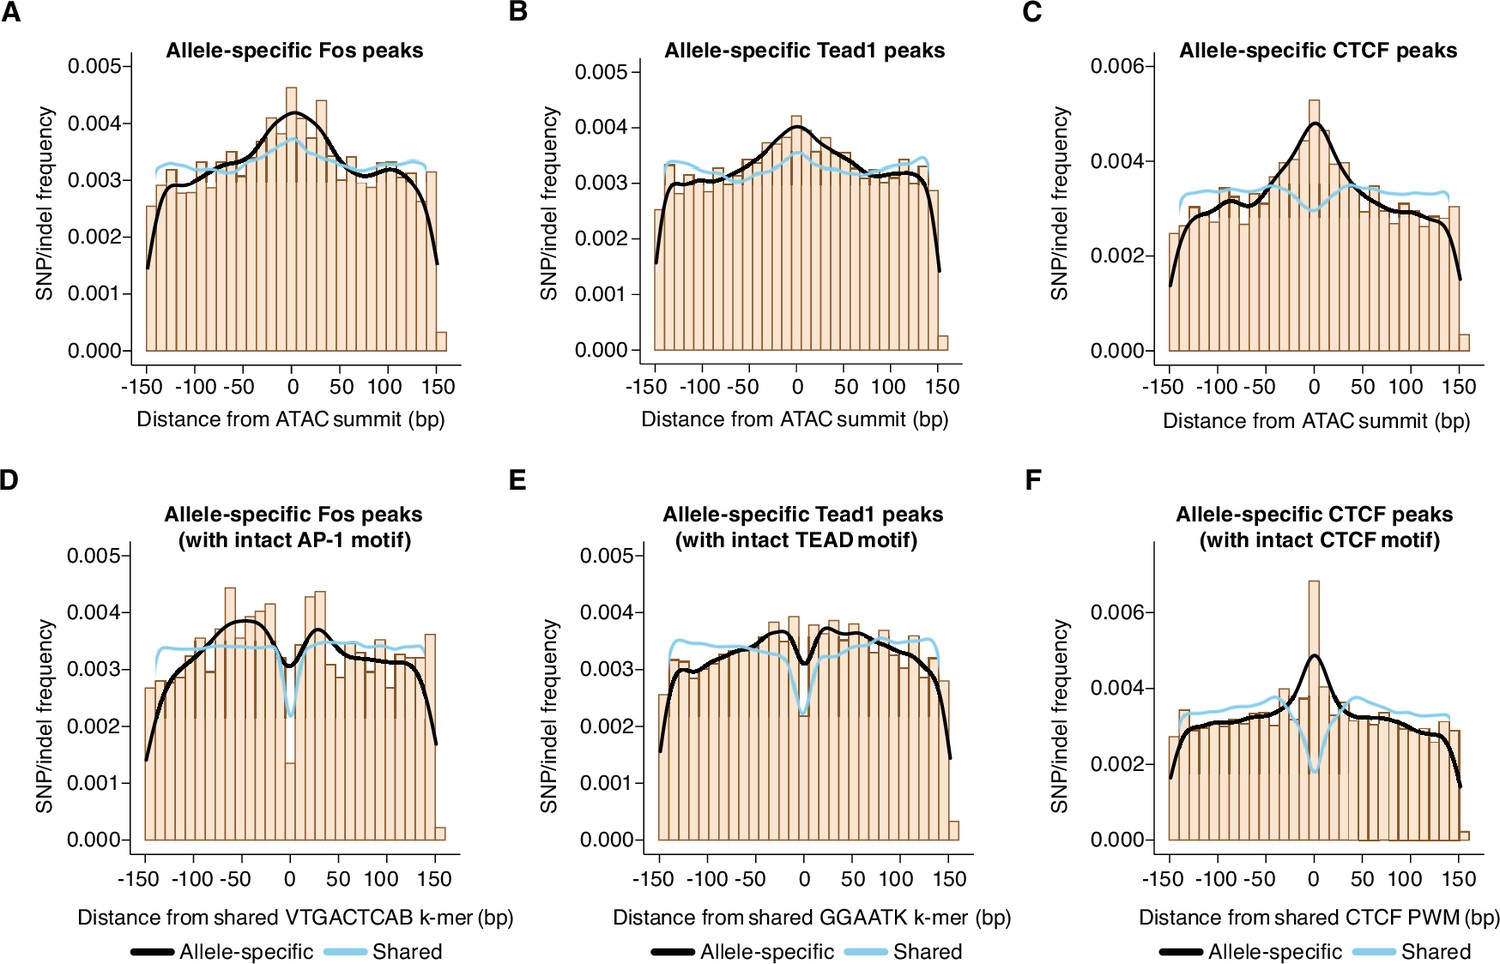
Distribution of genetic variants that influence AP-1, TEAD, and CTCF binding.
(A–C) Frequency of SNPs/indels at positions relative to ATAC-seq summits at allele-specific (with >2-fold difference in signal between alleles) versus shared gene-distal Fos, Tead1, and CTCF peaks (Pearson’s Chi-squared test, p=9.7 x 10⁻⁸ for AP-1, p<2.2 x 10⁻¹⁶ for TEAD, p<2.2 x 10⁻¹⁶ for CTCF, 100 bp window centered on ATAC-seq summit in all cases). (D–E) Frequency of SNPs/indels at positions relative to shared VTGACTCAB and GGAATK k-mers within 75 bp of the ATAC-seq summit at allele-specific (with >2-fold difference in signal between alleles) versus shared gene-distal Fos and Tead1 peaks, respectively. Sites have been filtered to exclude any peaks that include SNPs/indels that overlap their cognate k-mers. (F) Frequency of SNPs/indels at positions relative to shared CTCF PWM (MA0139.1) within 75 bp of the ATAC-seq summit at allele-specific (with >2-fold difference in signal between alleles) versus shared gene-distal CTCF peaks. Sites have been filtered to exclude any peaks that include SNPs/indels at disrupt the CTCF PWM in a strain-specific manner.
Figure 6 with 1 supplement
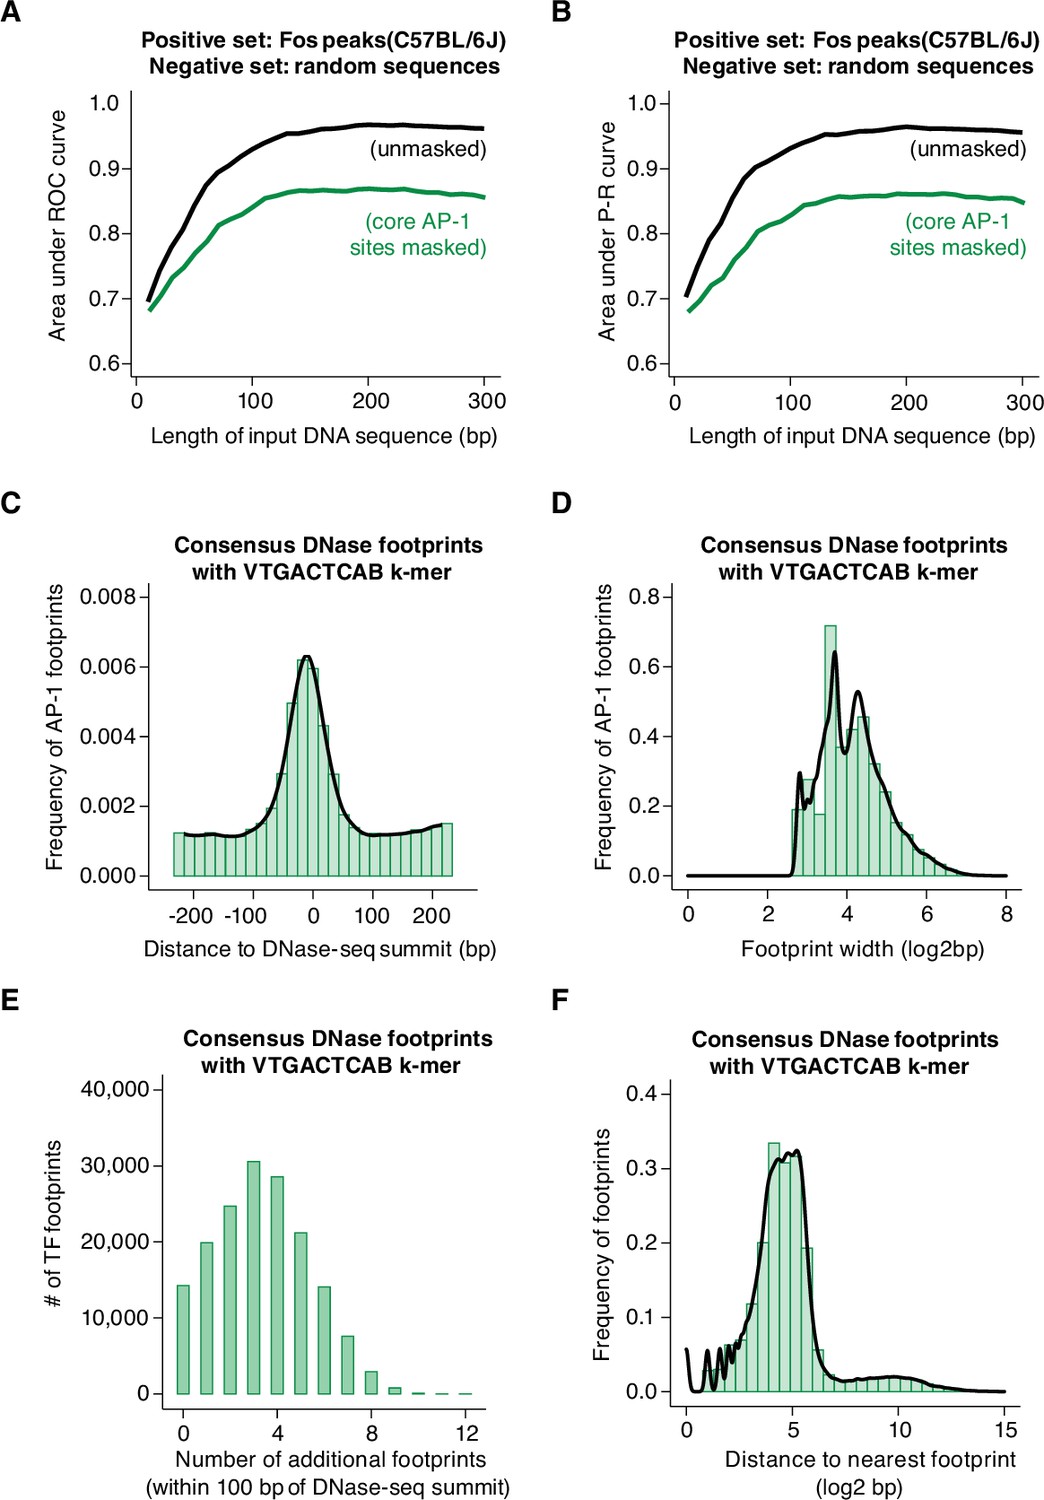
Machine learning prediction of AP-1 binding sites genome-wide.
(A–B) Area under ROC and P-R curves for gkm-SVM comparison of Fos peaks in the C57BL/6 J genome (positive set) and length-matched, random genomic regions (negative set). Shown are AUC values for different lengths of input DNA sequence, ranging from 10 to 300 bp, indicated in black. The same analysis was repeated after masking all instances of core AP-1 motifs (TGASTCA; n=4000 randomly selected loci), indicated in green. (C) Frequency of consensus, human DNase footprints (from Vierstra et al., 2020) containing an extended AP-1 k-mer (VTGACTCAB) at positions relative to DNase-seq summits (n=164,705 footprints). (D) Width of DNase footprints that contain an extended AP-1 k-mer (VTGACTCAB). (E) Number of additional DNase footprints within 100 bp of DNase-seq summits at DNase peaks with a VTGACTCAB-containing footprint. (F) Distance between VTGACTCAB-containing footprints and nearest neighboring DNase footprint.
Figure 6—figure supplement 1
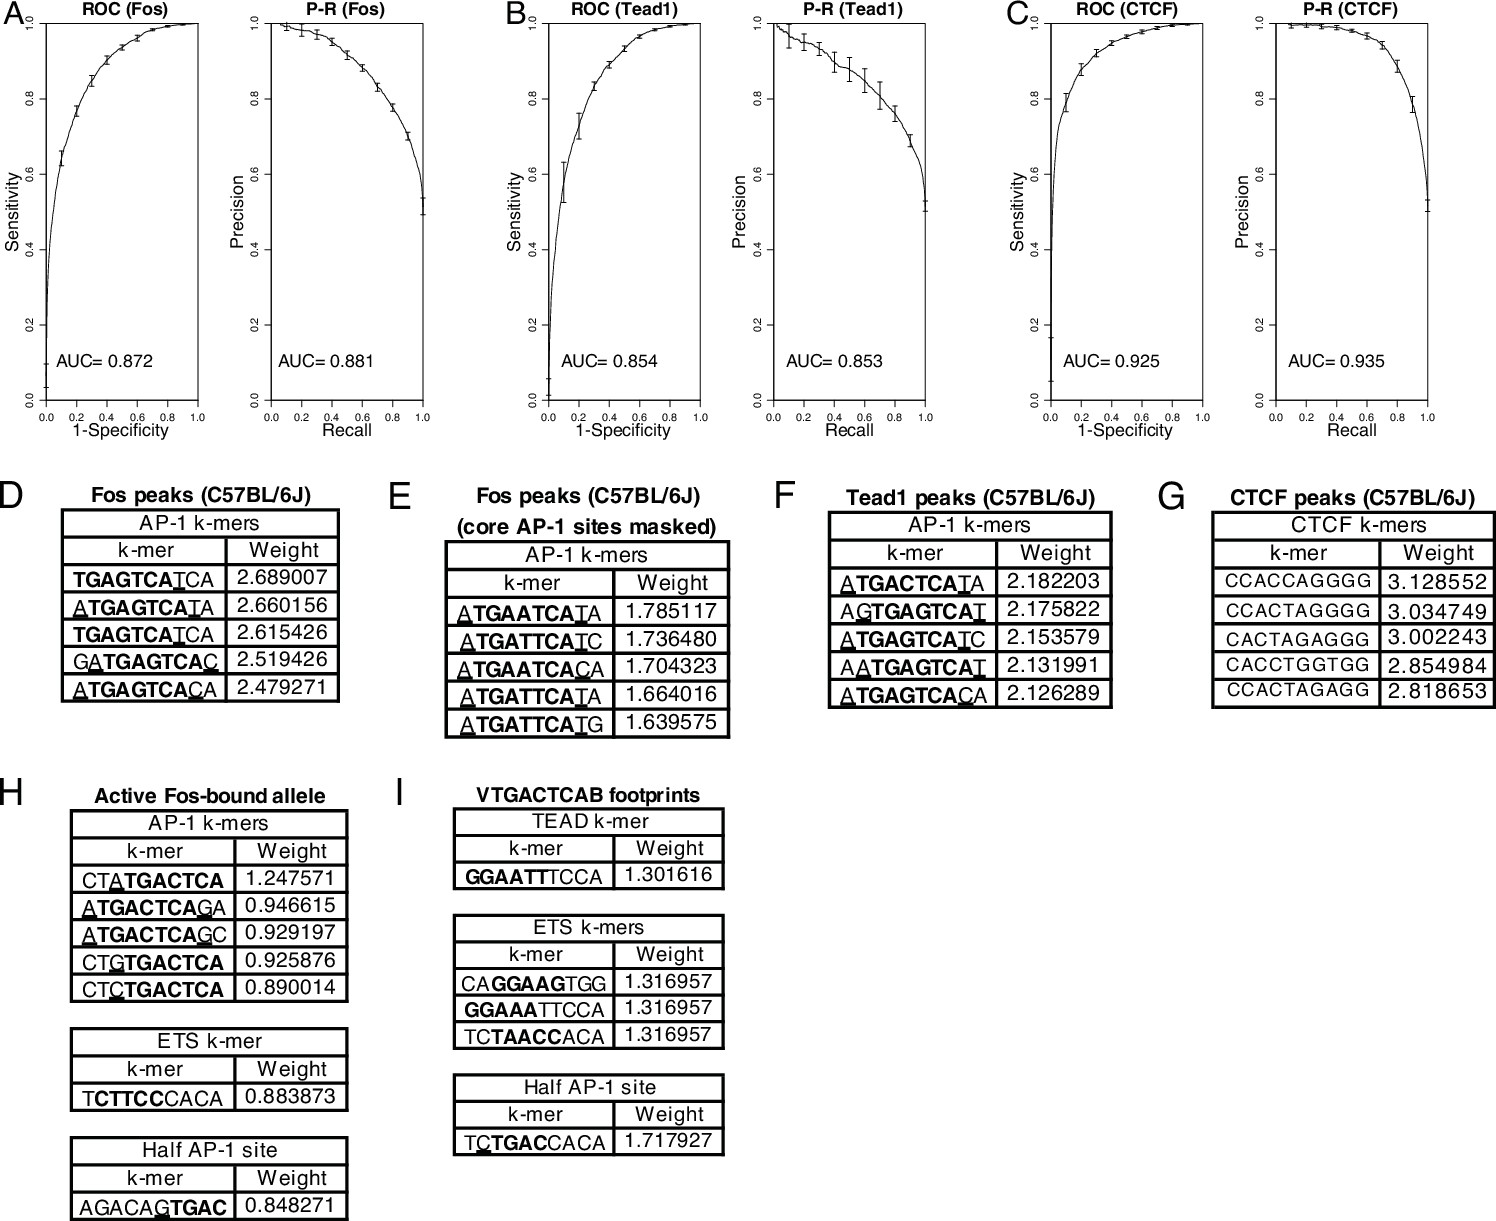
gkm-SVM analysis of Fos, Tead1, and CTCF peaks.
(A–C) ROC and P-R curves for gkm-SVM comparison of Fos, Tead1, and CTCF peaks compared to randomly sampled regions in the C57BL/6 J genome. (D–G) Top enriched 10-mers from gkm-SVM comparing the central 60 bp from n=4,000 randomly selected Fos (with and without masking TGASTCA k-mers), Tead1, and CTCF peaks in C57BL/6 J MEFs (positive set) with n=4000 randomly sampled 60 bp windows across the C57BL/6 J genome (negative set). (H) Top enriched 10-mers from gkm-SVM comparing the central 60 bp from active (positive set) and inactive allele (negative set) at Fos peaks with significantly allele-specific H3K27ac levels. (I) Top enriched 10-mers from gkm-SVM comparing the central 60 bp from n=4000 DNase footprints containing VTGACTCAB k-mers (positive set) and n=4000 random gene-distal genomic windows in the human genome (hg38) centered on VTGACTCAB k-mers (negative set).
Additional files
-
Supplementary file 1
Total numbers of SNPs/indels per inbred mouse strain relative to the C57BL/6 J reference strain.
ATAC-seq peaks were considered highly mappable if they contained a SNP/indel within a 120 bp window centered on their respective ATAC-seq summits.
- https://cdn.elifesciences.org/articles/76500/elife-76500-supp1-v2.xlsx
-
Supplementary file 2
Experimental condition, replicate number, number of sequencing reads, and percentage of non-duplicated reads for all genomic assays performed in this study.
- https://cdn.elifesciences.org/articles/76500/elife-76500-supp2-v2.xlsx
-
Supplementary file 3
List of all significant H3K27ac Hi-ChIP loops at 0 or 90 min serum stimulation in wild-type C57BL/6 J MEFs (P<1e-4).
Only intra-chromosomal loops with at least 10 paired-end reads connecting them per bioreplicate were retained for analysis.
- https://cdn.elifesciences.org/articles/76500/elife-76500-supp3-v2.xlsx
-
Supplementary file 4
Number of allele pairs with allele-specific and shared signal for each transcription factor or histone modification surveyed in our dataset.
For Fos and H3K27ac experiments, the data from ChIP-seq (wild-derived inbred strains; CAST/EiJ, MOLF/EiJ, PWK/PhJ, SPRET/EiJ) and CUT&RUN (less divergent inbred strains; 129S1/SvImJ, A/J, BALB/cJ, DBA/2 J, NOD/ShiLtJ) were merged in all rows designated "all strains". Only CUT&RUN peaks with a SNP/indel present within 60 bp of the ATAC-seq summit were included for allele-specific analyses for non-wild-derived (i.e. less genetically divergent) strains.
- https://cdn.elifesciences.org/articles/76500/elife-76500-supp4-v2.xlsx
-
Supplementary file 5
Significant allele-specific transcripts from chromatin-associated RNA-seq data using reads pooled from 0, 20, and 90 min timepoints.
Positive and negative fold-changes indicate genes expressed at higher levels on the paternal, wild-derived allele and maternal, C57BL/6 J allele, respectively.
- https://cdn.elifesciences.org/articles/76500/elife-76500-supp5-v2.xlsx
-
Supplementary file 6
Location, allele-specific H3K27ac values, and DNA sequences for top decile of allele-specific enhancers, with greatest fold-change in H3K27ac signal between active and inactive alleles.
- https://cdn.elifesciences.org/articles/76500/elife-76500-supp6-v2.xlsx
-
Transparent reporting form
- https://cdn.elifesciences.org/articles/76500/elife-76500-transrepform1-v2.pdf
Download links
A two-part list of links to download the article, or parts of the article, in various formats.
Downloads (link to download the article as PDF)
Open citations (links to open the citations from this article in various online reference manager services)
Cite this article (links to download the citations from this article in formats compatible with various reference manager tools)
Characterization of sequence determinants of enhancer function using natural genetic variation
eLife 11:e76500.
https://doi.org/10.7554/eLife.76500


