Longitudinal analysis of invariant natural killer T cell activation reveals a cMAF-associated transcriptional state of NKT10 cells
- Trinity Biomedical Science Institute, Trinity College Dublin, Ireland
- Division of Rheumatology, Inflammation, and Immunity, Brigham and Women's Hospital, Harvard Medical School, United States
- Division of Endocrinology, Diabetes, and Hypertension, Brigham and Women's Hospital, Harvard Medical School, United States
- Department of Microbiology and Immunology, Peter Doherty Institute for Infection and Immunity, University of Melbourne, Australia
Figures
Figure 1 with 3 supplements
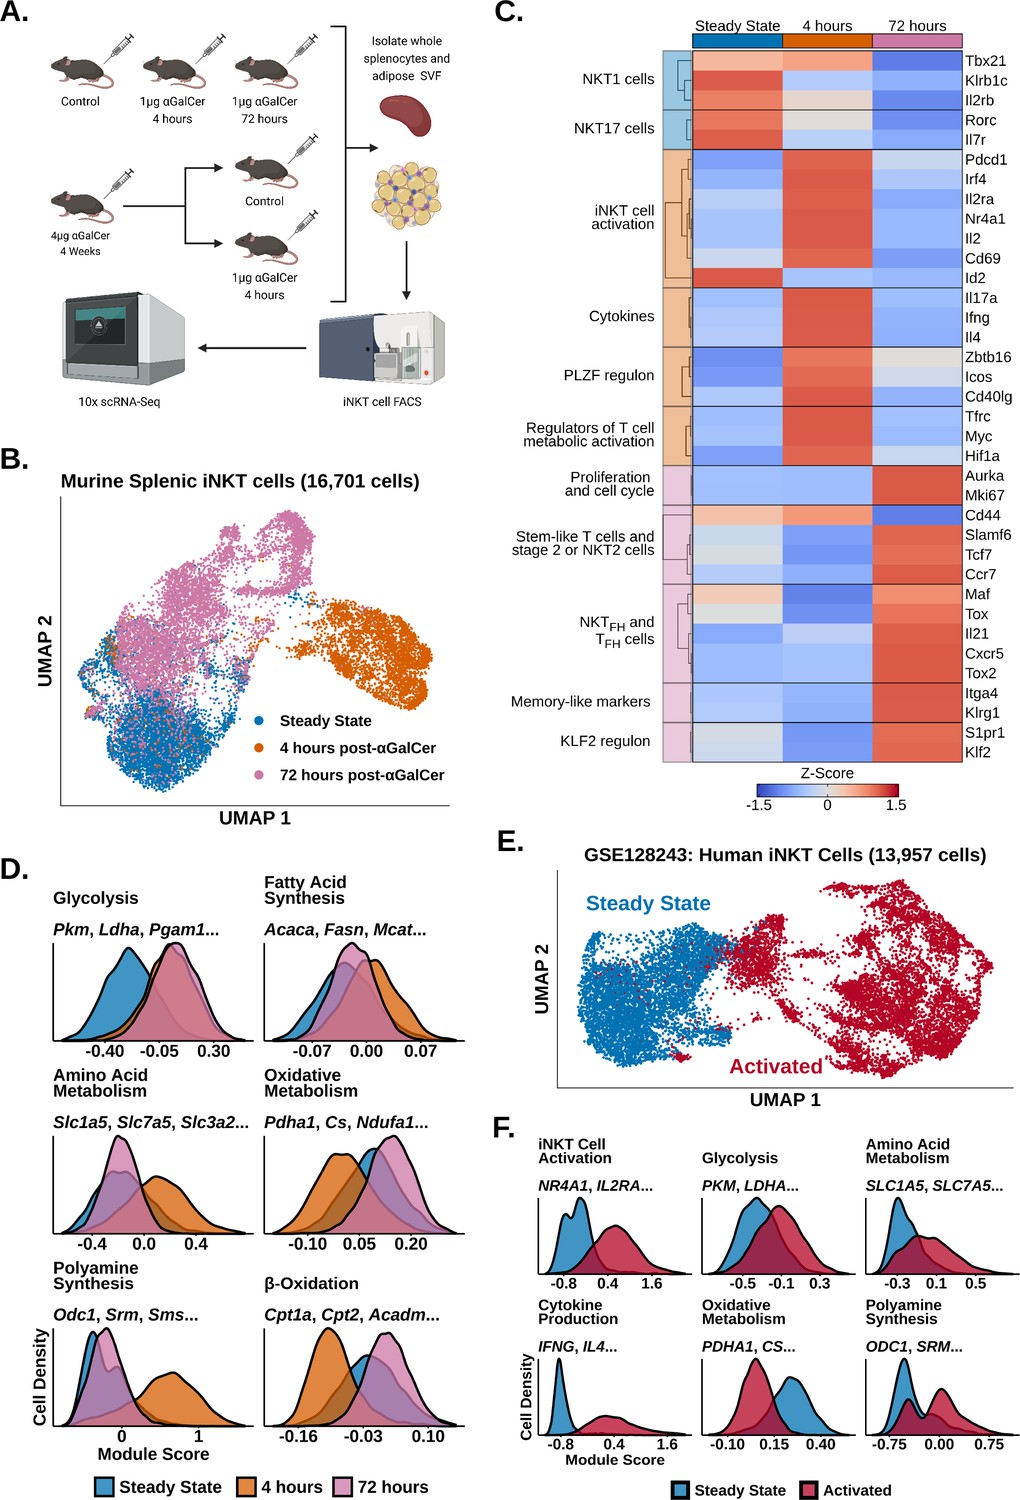
Invariant natural killer T (iNKT) cells undergo rapid and extensive transcriptional remodeling in response to α-galalctosylceramide (αGalCer).
(A) Cartoon illustrating the experimental design for the generation of all scRNA-seq data. (B) Uniform manifold approximation and projection (UMAP) of murine splenic iNKT cells with cell cycle regression. (C) Heatmap of scaled averaged gene expression with hierarchical clustering in the data from (B). (D) Histograms showing expression of metabolic gene module scores in the data from (B). (E) UMAP of human peripheral blood mononuclear cell (PBMC) iNKT cells reanalyzed from GSE128243. (F) Histograms showing expression of functional and metabolic gene module scores in the data from (E).
Figure 1—figure supplement 1
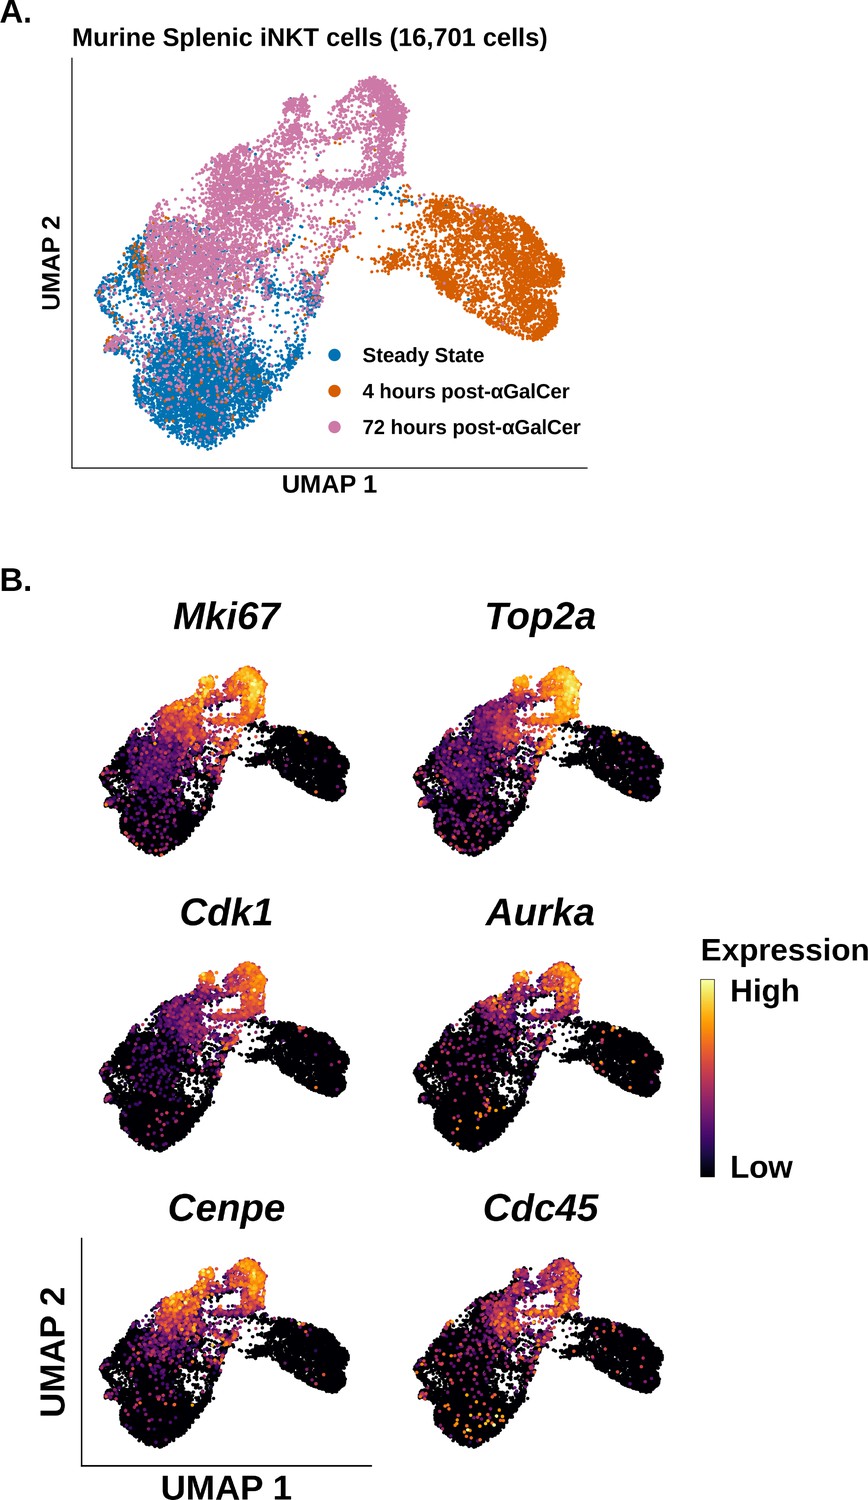
Single cell gene expression of splenic iNKT cells at steady state, and 4 and 72 hours post activation.
(A) Uniform manifold approximation and projection (UMAP) of murine splenic invariant natural killer T (iNKT) cells with cell cycle regression applied. (B) Density plots of cell cycle and proliferation marker gene expression in the data from (A).
Figure 1—figure supplement 2
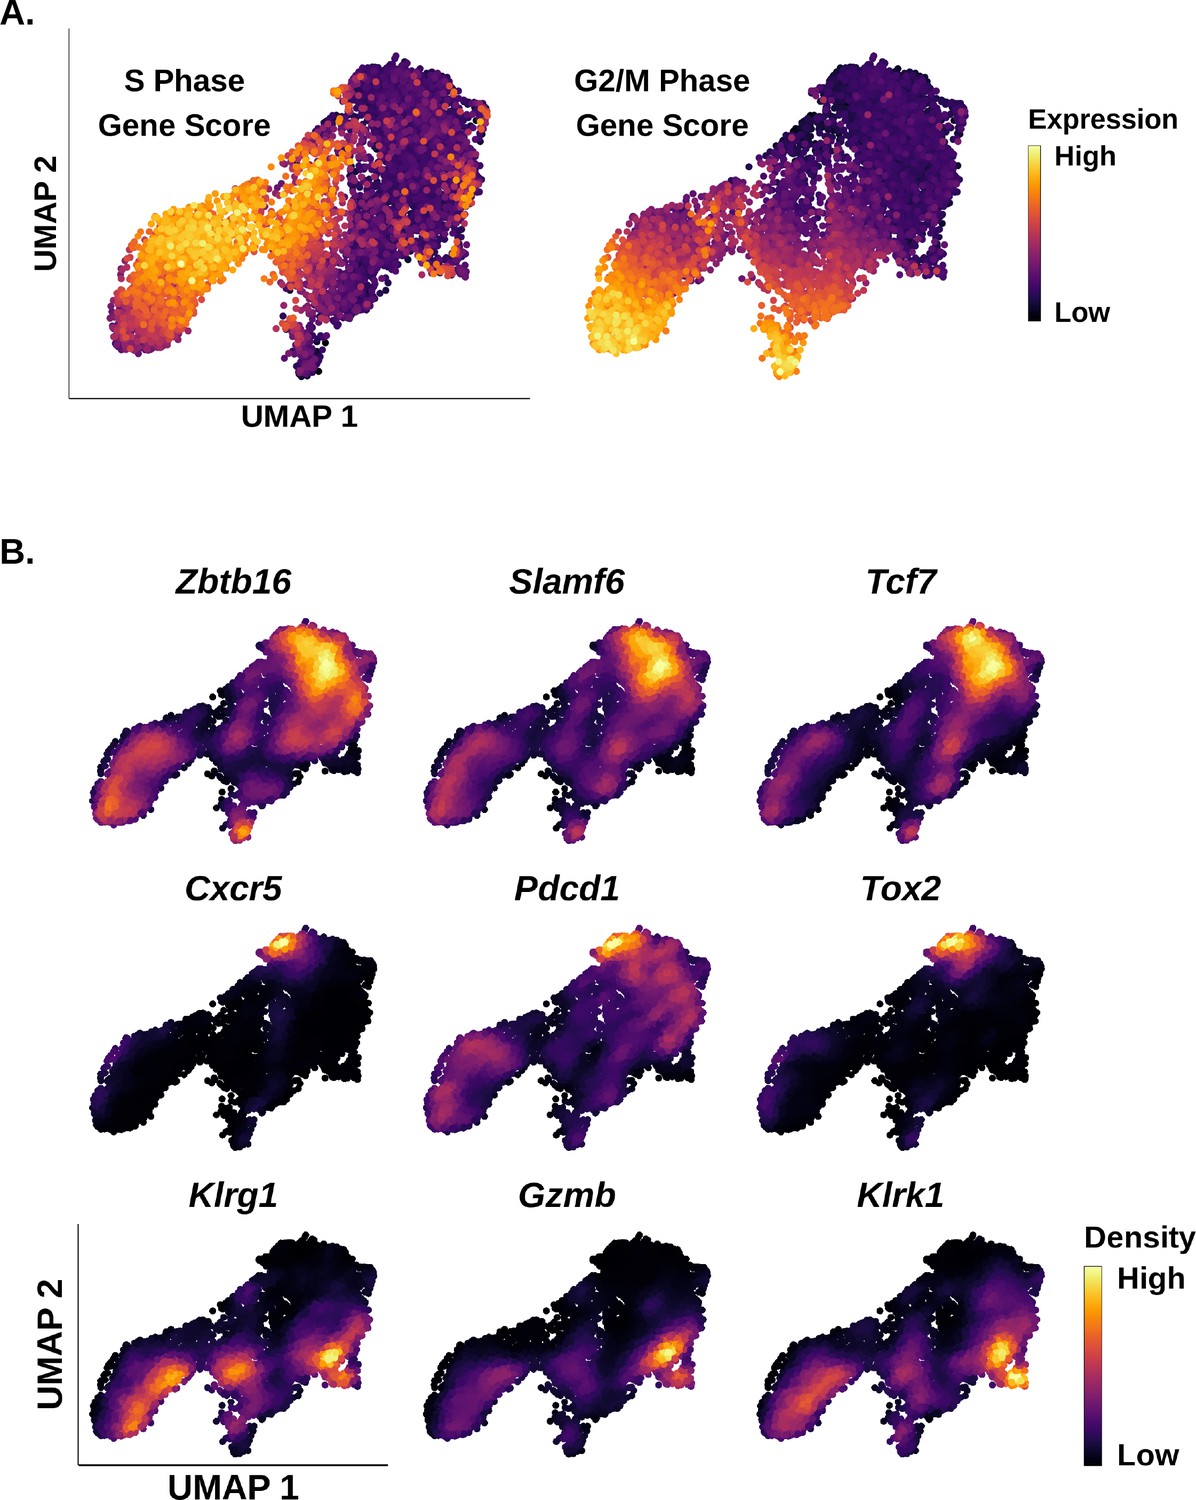
Expression plots of proliferation gene scores and select genes in splenic iNKT cells at 72 hours post activation.
(A) Expression plots of S phase and G2/M phase proliferation gene scores in murine splenic invariant natural killer T (iNKT) cells at 72 hr post-α-galalctosylceramide (post-αGalCer). (B) Density plots of gene expression in murine splenic iNKT cells 72 hr post-αGalCer.
Figure 1—figure supplement 3
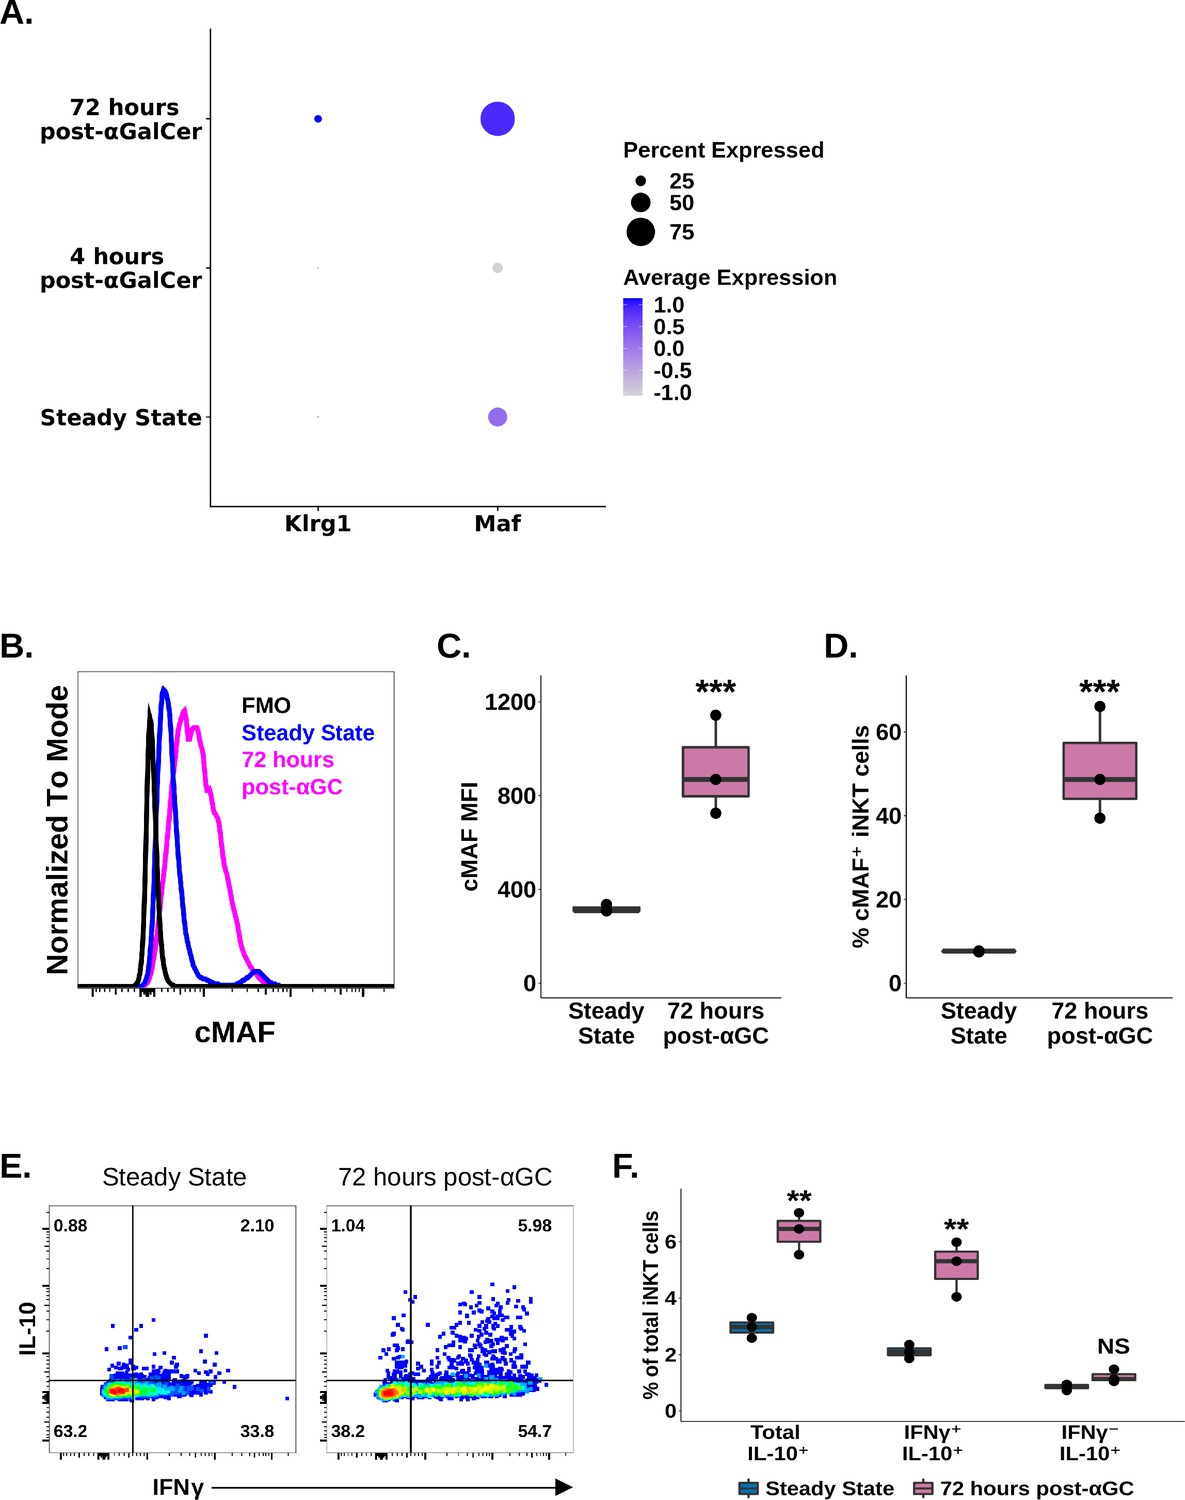
Enrichment of cMAF in activated iNKT cells.
(A) Dot plot of Klrg1 and Maf expression in murine splenic invariant natural killer T (iNKT) cells at steady state, 4 hr, and 72 hr post-α-galalctosylceramide (post-αGalCer). (B) Representative histogram of cMAF expression in murine splenic iNKT cells at steady state or 72 hr post-αGalCer (⍺GC). iNKT cells were defined as live, single CD19- CD8- CD3low CD1d-PBS57 tetramer+ cells. Histograms were normalized to the mode. (C) Box plot quantifying cMAF median fluorescence intensity (MFI) in the data from (B). N = 3 biological replicates from one experiment. Experiment performed twice. Student’s unpaired t-test. Asterisks denote significance, *p<0.05; **p<0.01; ***p<0.001. The central box plot horizontal line denotes the median value. (D) Box plot quantifying the percentage data from (B), as performed for MFI data in (C). (E) Representative pseudocolor plots showing expression of IFNγ versus IL-10 in murine splenic iNKT cells at steady state or 72 hr post-αGalCer after restimulation for 4 hr with 50 ng phorbol 12-myristate 13-acetate (PMA) and 1 µg ionomycin (ex vivo). iNKT cells were defined as live, single CD19- CD8- CD3low CD1d-PBS57 tetramer+ cells. (F) Box plot quantifying the percentage data in (E). N = 3 biological replicates from one experiment. Experiment performed once. Student’s unpaired t-test. Asterisks denote significance, *p<0.05; **p<0.01; ***p<0.001. The central box plot horizontal line denotes the median value.
Figure 2 with 5 supplements
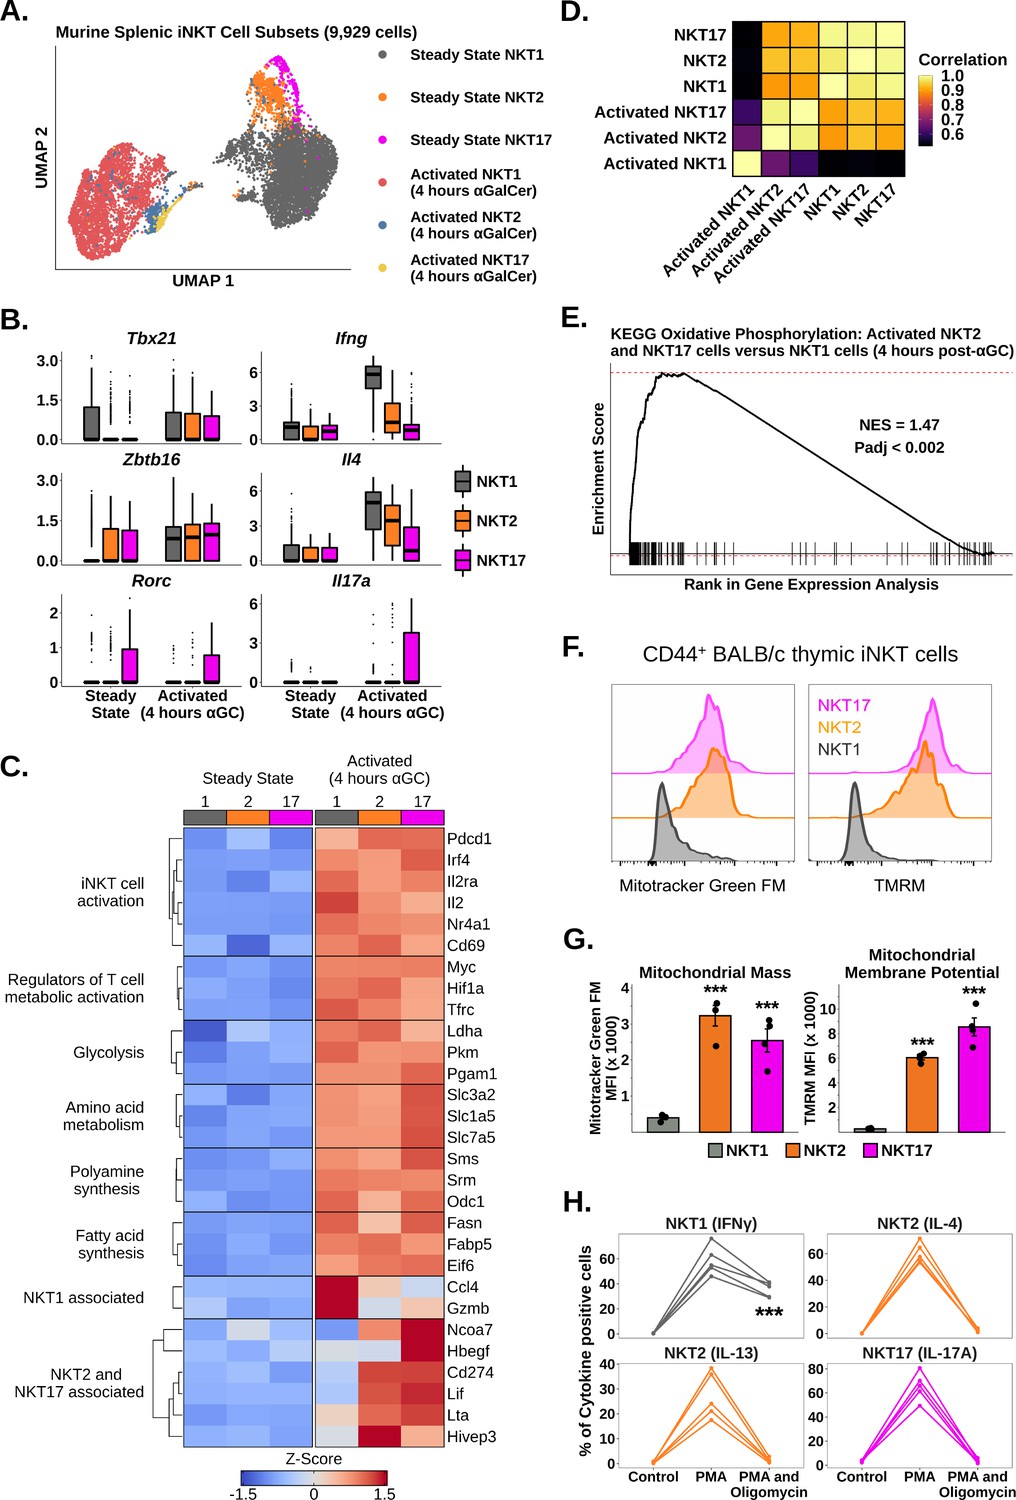
Oxidative phosphorylation differentiates functional responses to α-galalctosylceramide (αGalCer) in NKT2 and NKT17 cells versus NKT1 cells.
(A) Uniform manifold approximation and projection (UMAP) of murine splenic invariant natural killer T (iNKT) cells. (B) Box plots showing gene expression in the data from (A). ⍺GC denotes αGalCer. The central box plot horizontal line denotes the median value. (C) Heatmap of scaled averaged gene expression with hierarchical clustering in NKT1 (1), NKT2 (2), and NKT17 cells (17) from the data in (A). (D) Correlation plot of total normalized RNA counts for all genes across steady state and activated NKT1, NKT2, and NKT17 cell subsets. (E) Gene set enrichment analysis (GSEA) plot of KEGG oxidative phosphorylation comparing activated NKT2 cells and NKT17 cells versus activated NKT1 cells. NES, normalized enrichment score; Padj, adjusted p-value for the enrichment. (F) Histograms showing staining of MitoTracker Green FM and TMRM in CD44+ NKT1, NKT2, and NKT17 cells from BALB/c mouse thymus. iNKT cells were defined as live, single CD19- CD8- CD3low CD1d-PBS57 tetramer+ cells. Histograms were normalized to the mode. (G) Bar plots quantifying the mean fluorescence intensity (MFI) data from (F). N = 4 biological replicates from one experiment. Experiment performed at least twice. Student’s unpaired t-test. Asterisks denote significance, * Padj<0.05; ** Padj<0.01; *** Padj<0.001. Source data provided in Figure 2—source data 1. (H) Line plots showing production of flagship cytokines by CD44+ BALB/c mouse thymic iNKT cells: NKT1 (IFNγ), NKT2 (IL-4 and IL-13), and NKT17 cells (IL-17A) without stimulation and after 50 ng phorbol 12-myristate 13-acetate (PMA) and 1 µg ionomycin in the absence or presence of 40 nM oligomycin (all 4 hr ex vivo). N = 5 biological replicates from one experiment. Experiment performed at least twice. One-way ANOVA and Tukey’s post hoc test. Asterisks denote significance, * Padj<0.05; ** Padj<0.01; *** Padj<0.001. Source data provided in Figure 2—source data 2.
-
Figure 2—source data 1
MFI expression levels of mitotracker and TMRM in iNKT cell subsets by flow cytometry.
- https://cdn.elifesciences.org/articles/76586/elife-76586-fig2-data1-v3.xlsx
-
Figure 2—source data 2
Amount of cytokines produced in each iNKT cell subset with or without metabolic inhibitors.
- https://cdn.elifesciences.org/articles/76586/elife-76586-fig2-data2-v3.xlsx
Figure 2—figure supplement 1
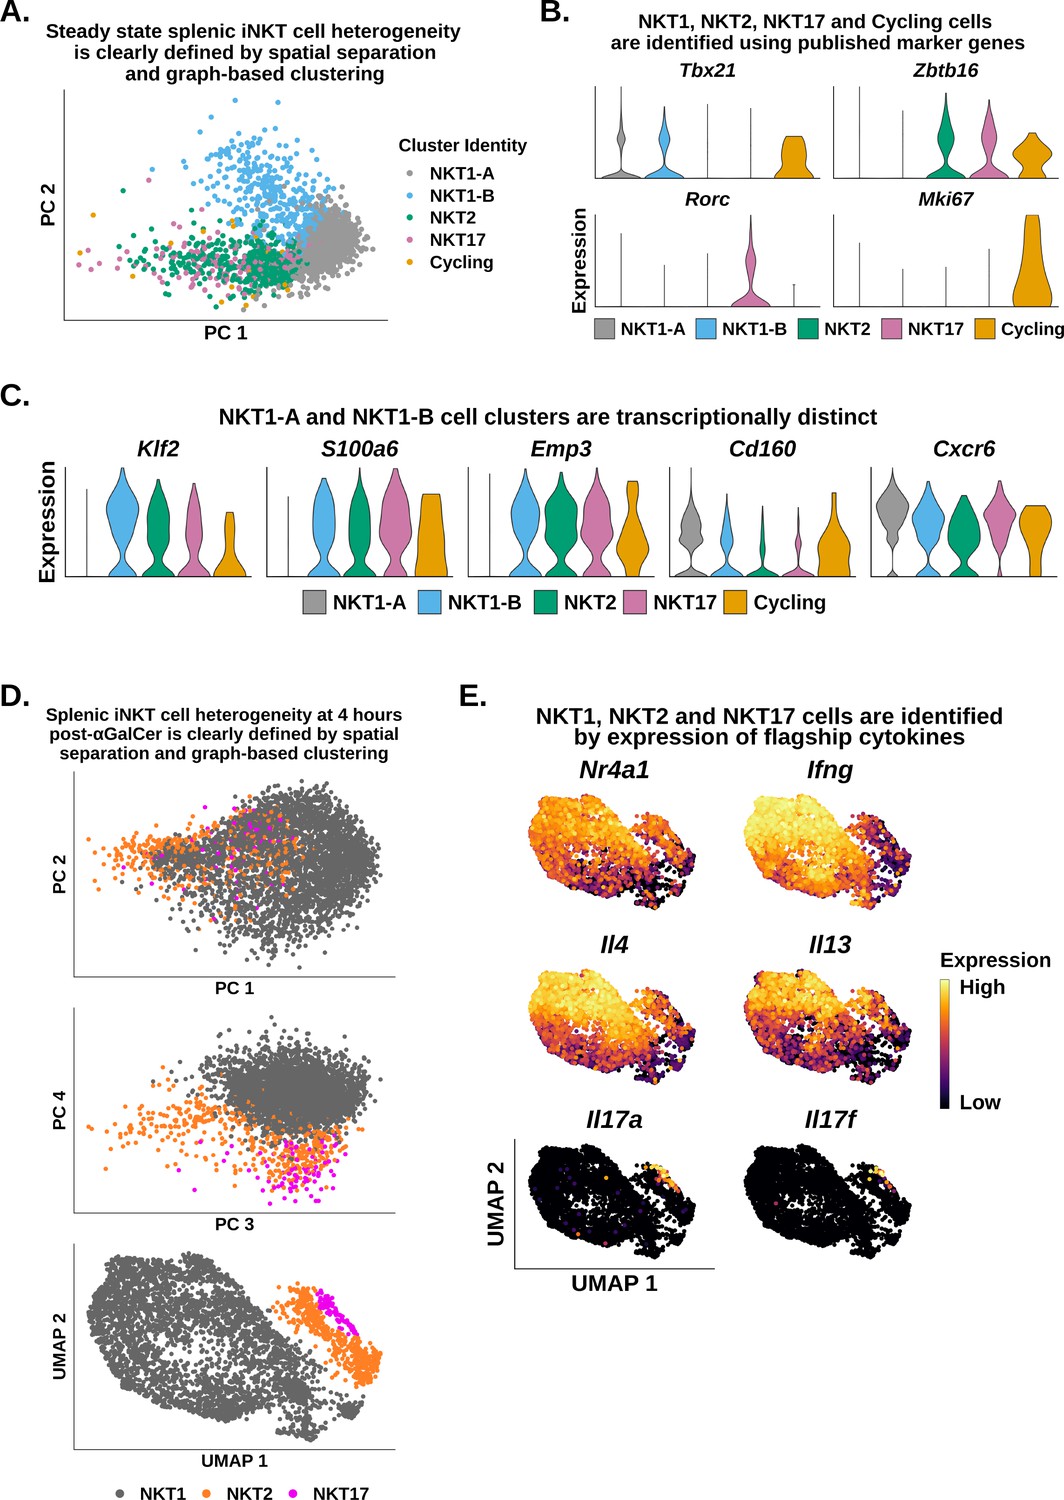
Distinct gene expression differences in iNKT cell subsets.
(A) Principal component analysis (PCA) plot of murine splenic invariant natural killer T (iNKT) cells at steady state. (B) Violin plots of iNKT cell subset marker gene expression in the data from (A). (C) Violin plots of NKT1-A versus NKT1-B marker gene expression in the data from (A). (D) PCA plots and uniform manifold approximation and projection (UMAP) plot of murine splenic iNKT cells at 4 hr post-α-galalctosylceramide (post-αGalCer). (E) Feature plots of cytokine gene expression in the data from (D).
Figure 2—figure supplement 2
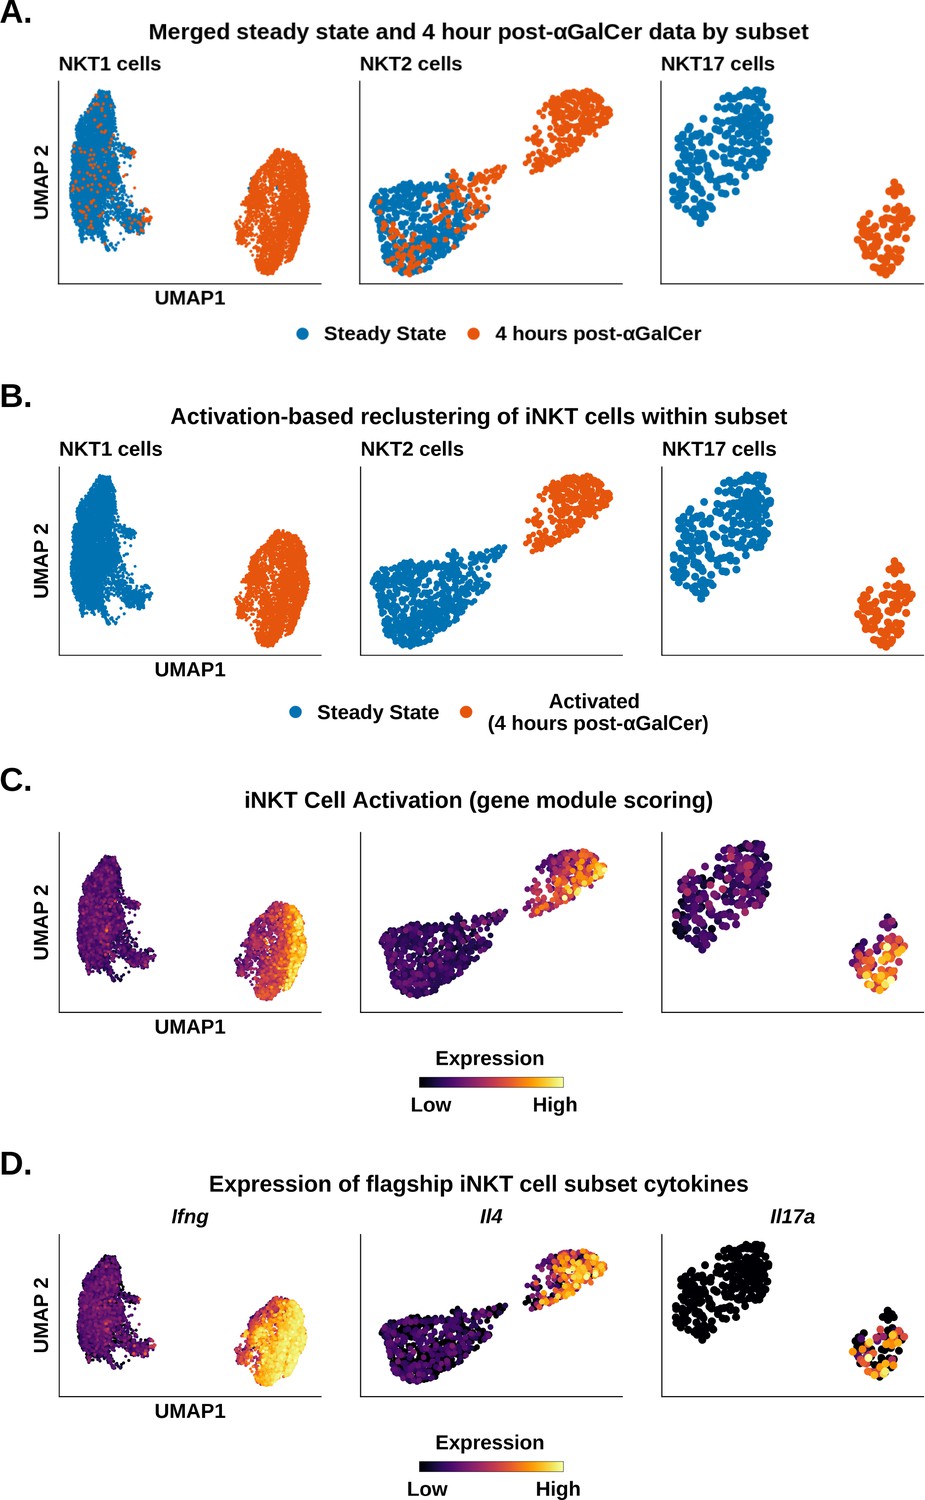
UMAP plots of NKT subsets, resting and post-activation.
(A) Uniform manifold approximation and projection (UMAP) plots of murine splenic NKT1, NKT2, and NKT17 cells at steady state or 4 hr post-α-galalctosylceramide (post-αGalCer). (B) UMAP plots of reclustered murine splenic NKT1, NKT2, and NKT17 cells into ‘true’ steady state or activated (4 hr post-αGalCer) clusters. (C) Feature plots of expression of invariant natural killer T (iNKT cell activation gene module scoring in the data from A, B). (D) Feature plots of expression of the flagship iNKT cell subset cytokines Ifng, Il4, and Il17a in the data from (A, B).
Figure 2—figure supplement 3
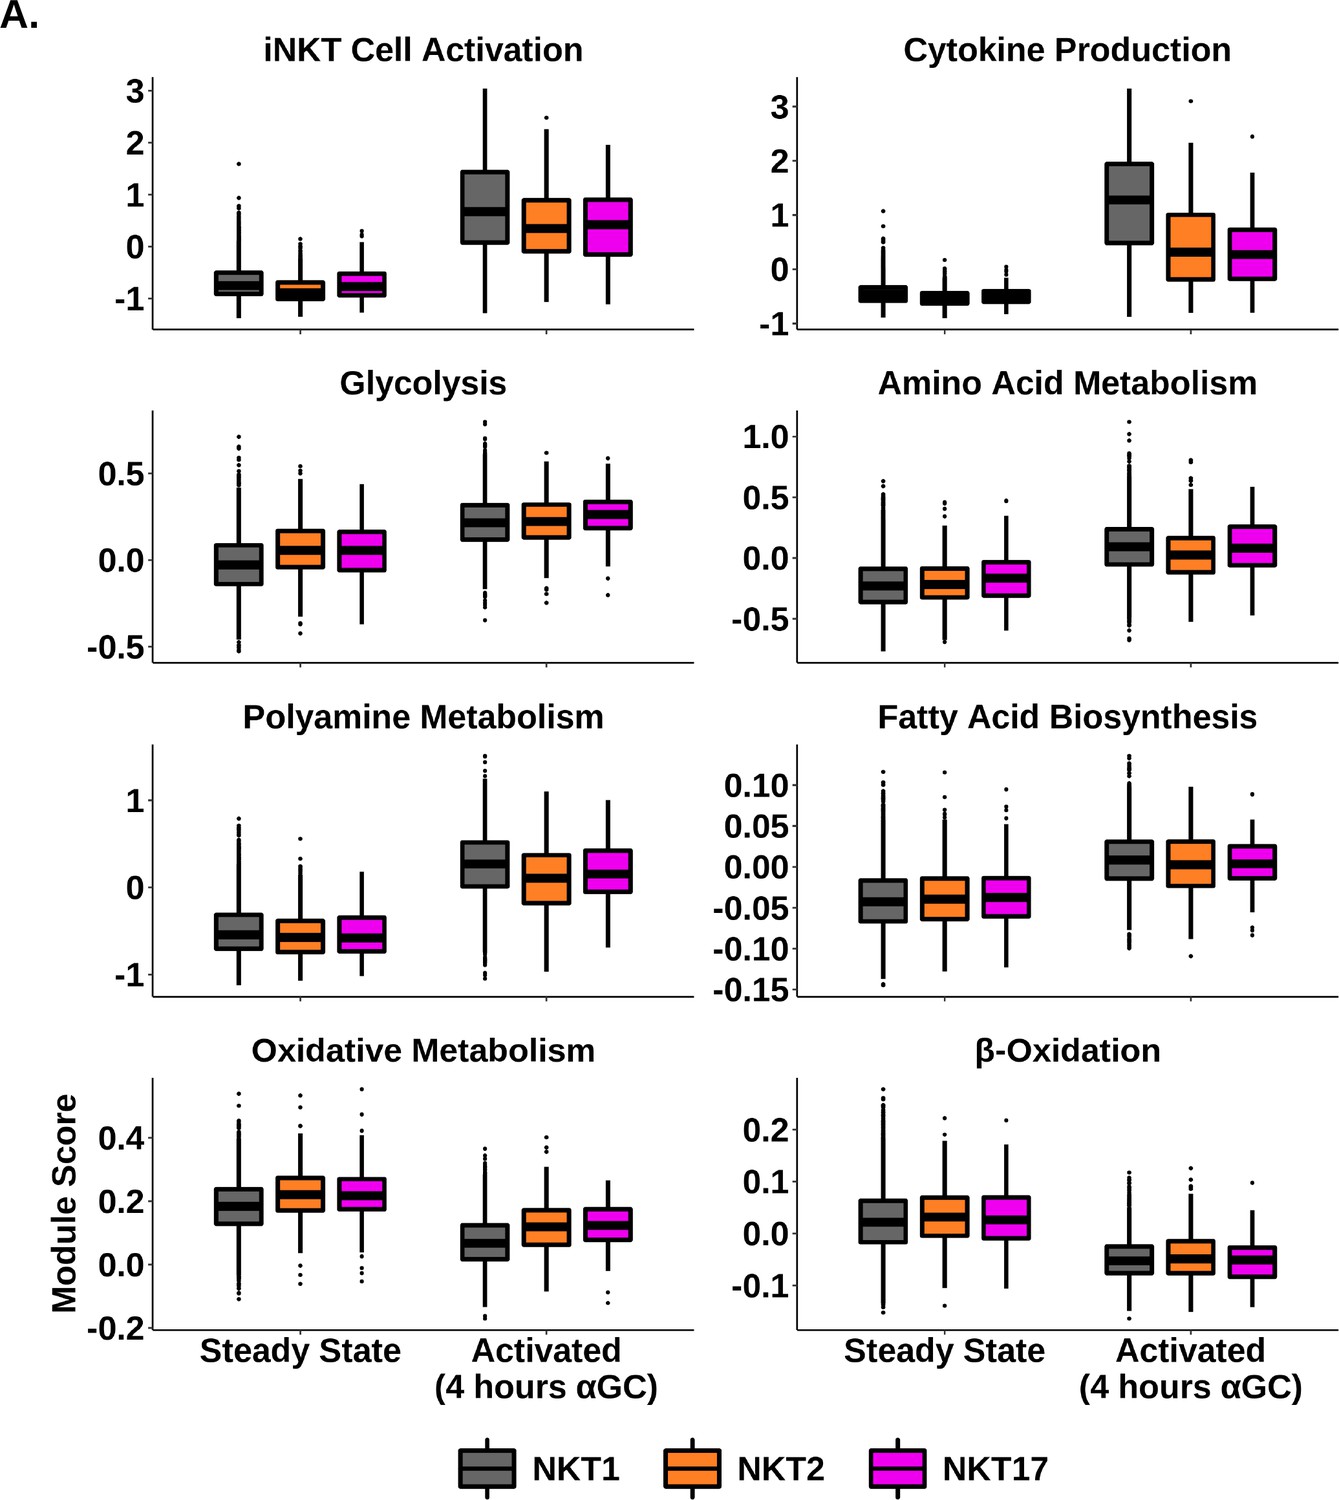
Module score analysis of scRNA-Seq data reveals changes in metabolic pathway gene expression following iNKT cell activation.
(A) Box plots of metabolic pathway gene module score expression in murine steady state and activated NKT1, NKT2 and NKT17 cells.
Figure 2—figure supplement 4
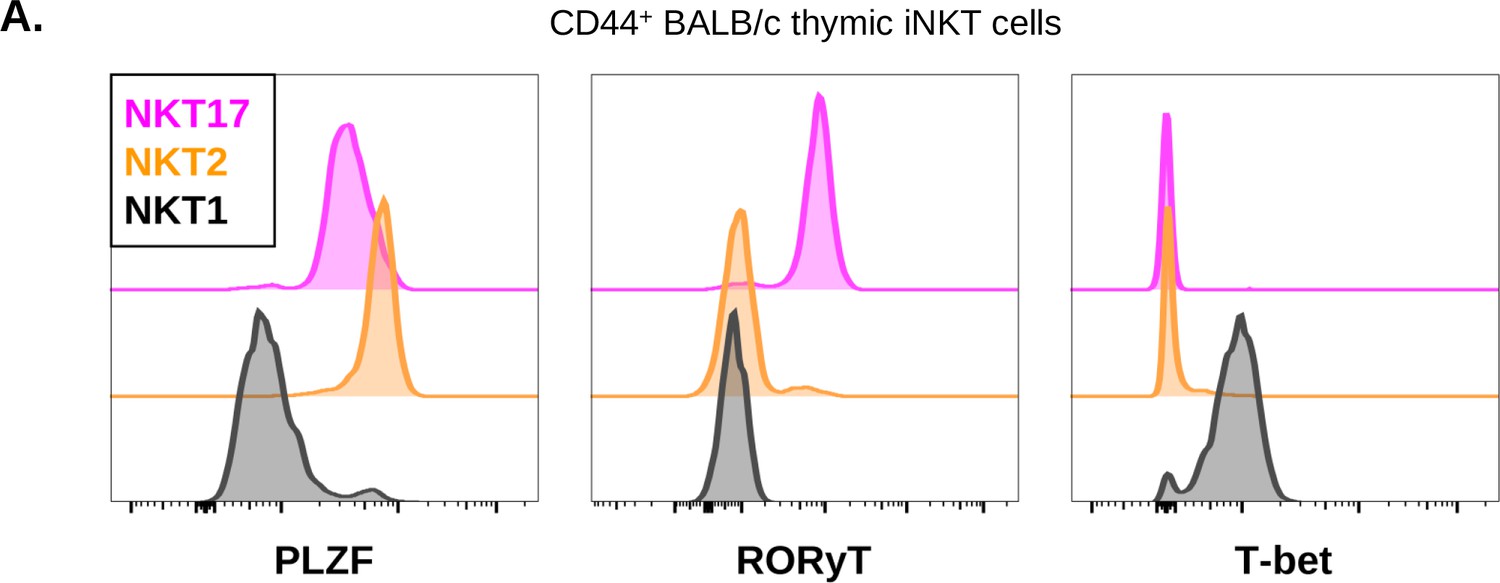
Flow cytometry validation of iNKT cell subset identity in the BALB/c CD43-HG/ICOS model using expression of flagship NKT2, NKT17 and NKT1 cell transcription factors.
(A) Representative histograms of flagship invariant natural killer T (iNKT) cell subset transcription factor staining in CD44+ NKT1, NKT2, and NKT17 cells from BALB/c mouse thymus. iNKT cells were defined as live, single CD45+ CD19- CD8- CD3low CD1d-PBS57 tetramer+ cells. NKT1 cells were defined as CD43-HG- ICOS- iNKT cells, NKT2 cells were defined as CD43-HG- ICOS+ iNKT cells, and NKT17 cells were defined as CD43-HG+ iNKT cells. Histograms were normalized to the mode. Experiment performed once with N = 4 biological replicates.
Figure 2—figure supplement 5
Correlation of mitochondrial marker expression with NKT subsets.
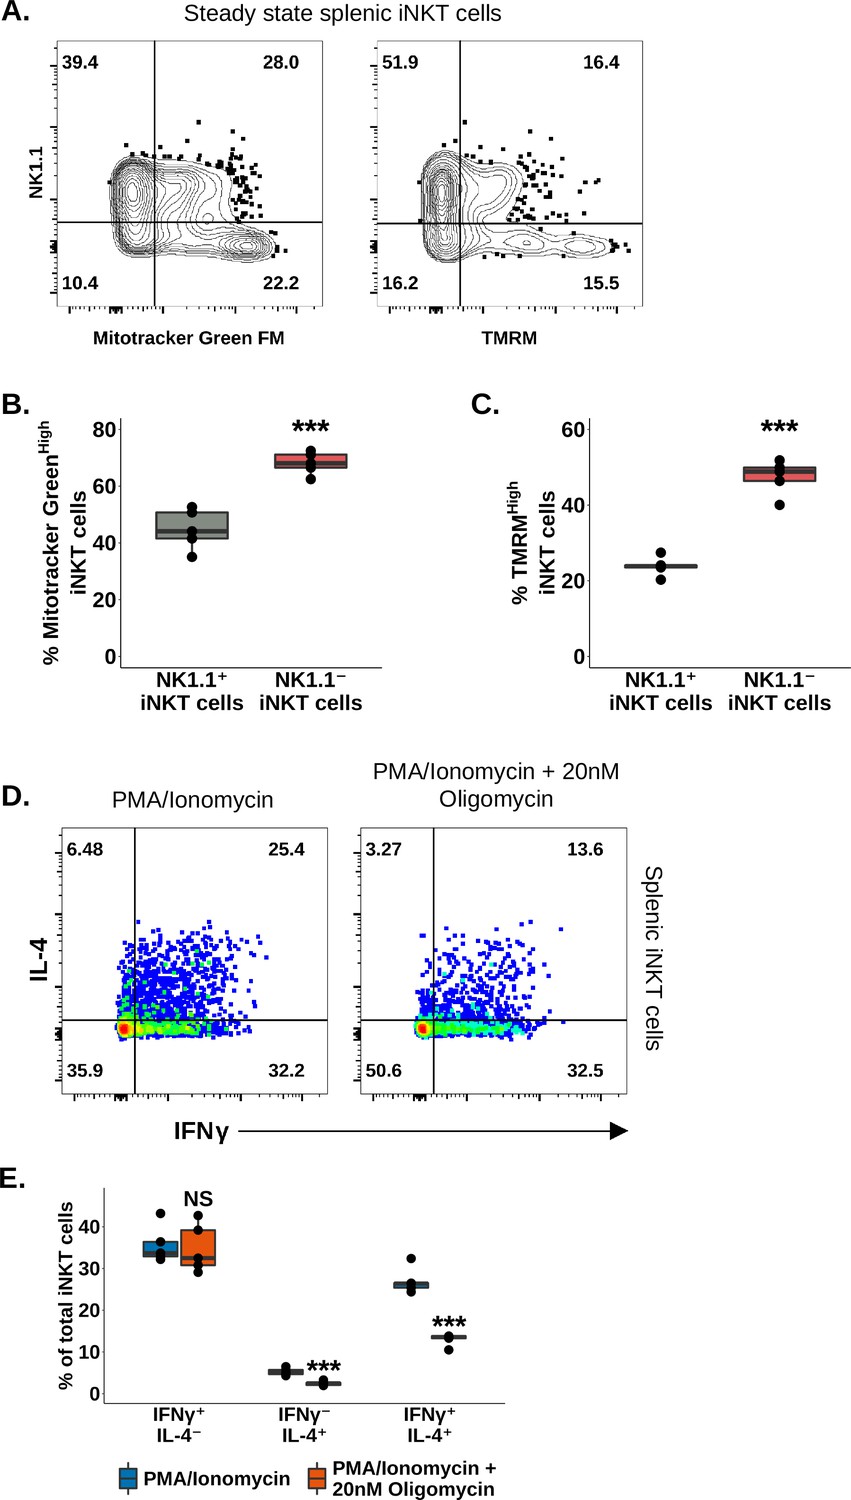
(A) Representative contour plots of MitoTracker Green FM and TMRM staining versus NK1.1 expression in murine steady-state splenic invariant natural killer T (iNKT) cells. iNKT cells were defined as live, single CD45+ CD19- CD3low CD1d-PBS57 tetramer+ cells. (B) Quantification of the data in the left panel (MitoTracker Green FM) of (A). Percentages were calculated by taking the absolute number of cells in the NK1.1+ or NK1.1- MitoTracker GreenHigh gate as percentage of the total number of NK1.1+ or NK1.1- iNKT cells, respectively. N = 5 biological replicates from one experiment. Experiment performed at least three times. Student’s unpaired t-test. Asterisks denote significance, *p<0.05; **p<0.01; ***p<0.001. The central box plot horizontal line denotes the median value. (C) Quantification of the data in the right panel (TMRM) of (A), as performed for MitoTracker Green FM data in (B). (D) Representative pseudocolor plots showing expression of IFNγ versus IL-4 in murine splenic iNKT cells at steady state after stimulation for 4 hr ex vivo with 50 ng phorbol 12-myristate 13-acetate (PMA) and 1 µg ionomycin in the absence (left panel) or presence (right panel) of 20 nM oligomycin. iNKT cells were defined as live, single CD45+ CD8- CD19- F4/80- CD3low CD1d-PBS57 tetramer+ cells. (E) Box plot quantifying the percentage data in (D). N = 5 biological replicates from one experiment. Experiment performed once. Student’s unpaired t-test. Asterisks denote significance, * Padj<0.05; ** Padj<0.01; *** Padj<0.001. NS denotes not significant (p>0.05). The central box plot horizontal line denotes the median value.
Figure 3 with 1 supplement
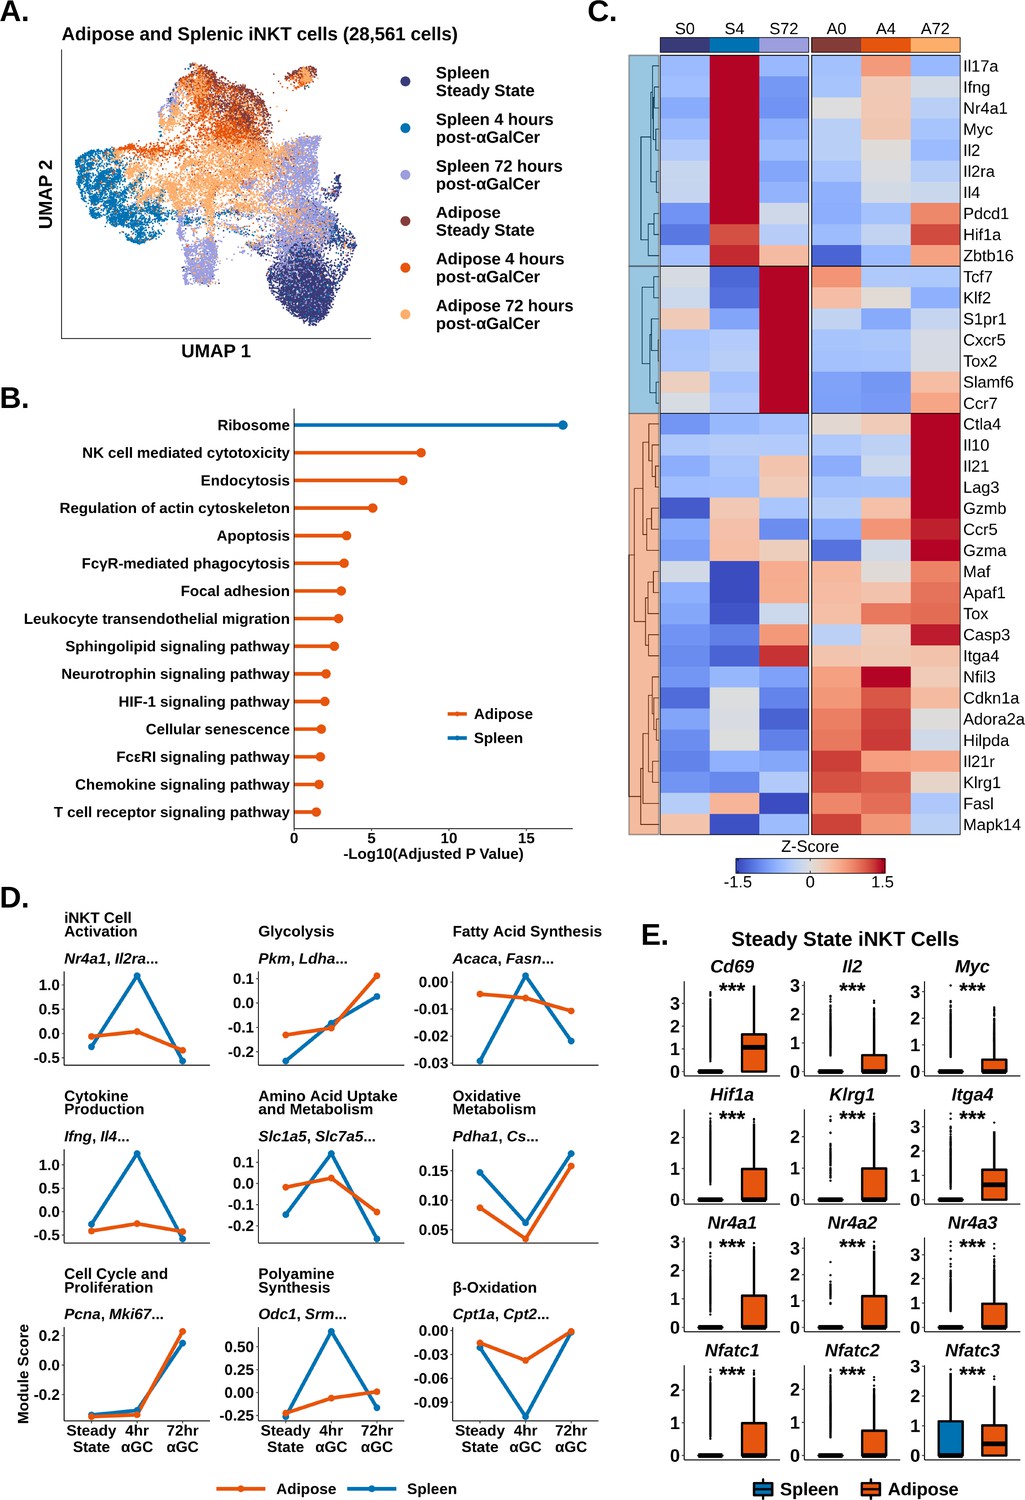
Adipose invariant natural killer T (iNKT) cells display blunted and delayed activation after α-galalctosylceramide (αGalCer), enrichment of Tr1 Cell markers, and hallmarks of chronic endogenous activation.
(A) Uniform manifold approximation and projection (UMAP) of murine adipose and splenic iNKT cells with cell cycle regression. (B) Lollipop plot showing enrichment of nondisease KEGG pathways based on conserved enrichment 971 genes in murine adipose iNKT cells and 65 genes in murine splenic iNKT cells. Source data provided in Figure 3—source data 1. (C) Heatmap of scaled averaged gene expression with hierarchical clustering in the data from (A). (D) Line plots showing median expression of functional and metabolic gene module scores in the data from (A). (E) Box plots showing gene expression in murine steady-state splenic or adipose iNKT cells. The central box plot horizontal line denotes the median value.
-
Figure 3—source data 1
Comparison of splenic and adipose iNKT cells at 72hr post-activation.
- https://cdn.elifesciences.org/articles/76586/elife-76586-fig3-data1-v3.xlsx
Figure 3—figure supplement 1
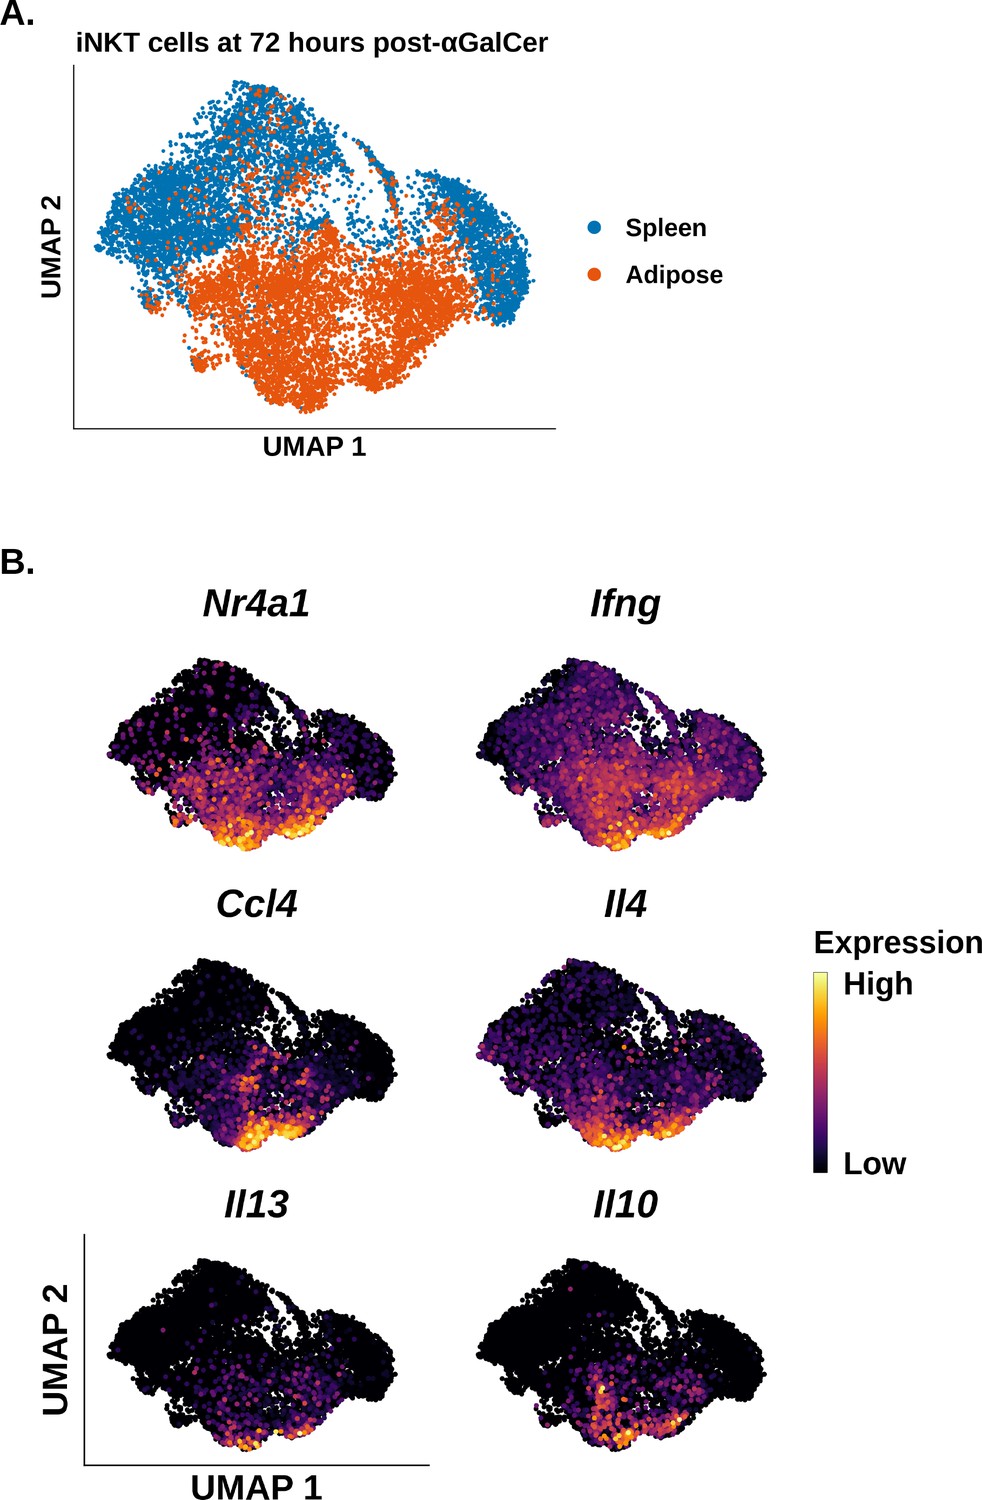
Comparison of splenic and adipose iNKT cells at 72hr post-activation.
(A) Uniform manifold approximation and projection (UMAP) plot of murine splenic and adipose invariant natural killer T (iNKT) cells at 72 hr post-α-galalctosylceramide (post-αGalCer). (B) Feature plots of Nr4a1 and cytokine gene expression in the data from (A).
Figure 4 with 1 supplement
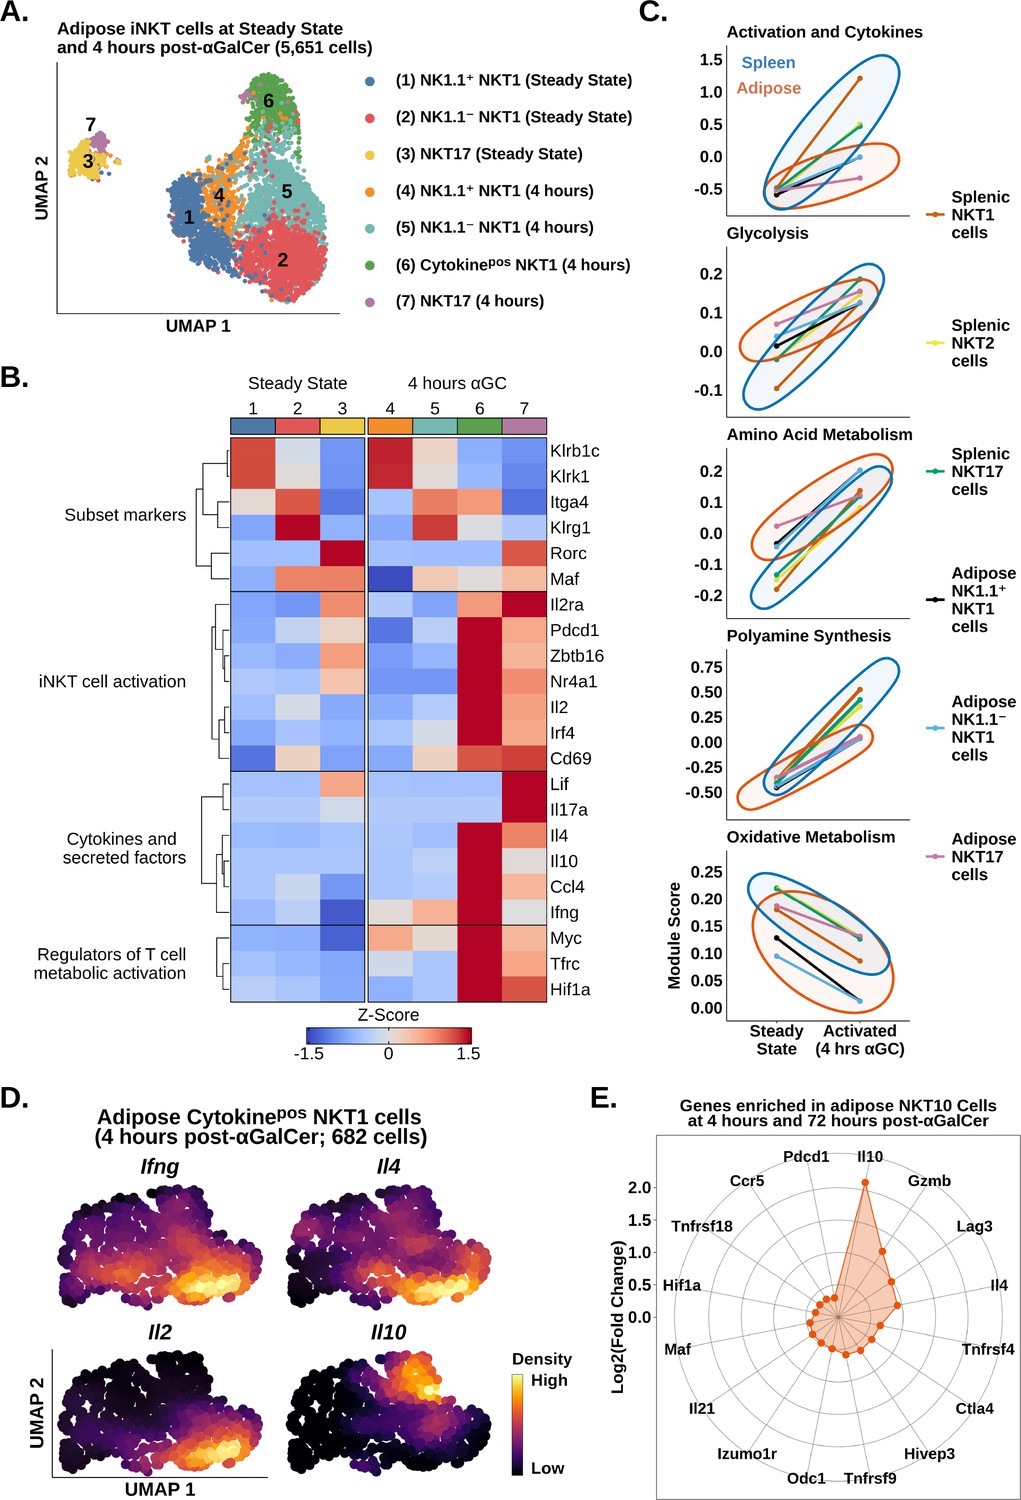
scRNA-seq identifies transcriptional signatures of adipose invariant natural killer T (iNKT) cell subset activation.
(A) Uniform manifold approximation and projection (UMAP) of murine adipose iNKT cells. (B) Heatmap of scaled averaged gene expression with hierarchical clustering in the data from (A). (C) Line plots showing median expression of functional and metabolic gene module scores in murine adipose and splenic NKT1, NKT2, and NKT17 cell subsets. (D) Density plots of gene expression in murine adipose cytokinepos NKT1 cells at 4 hr post-αGalCer (cluster 6, A). (E) Radar chart showing Log2(Fold Change) values of genes enriched in Il10pos adipose iNKT cells versus Il10neg adipose iNKT cells at 4 hr and 72 hr post-α-galalctosylceramide (post-αGalCer).
Figure 4—figure supplement 1
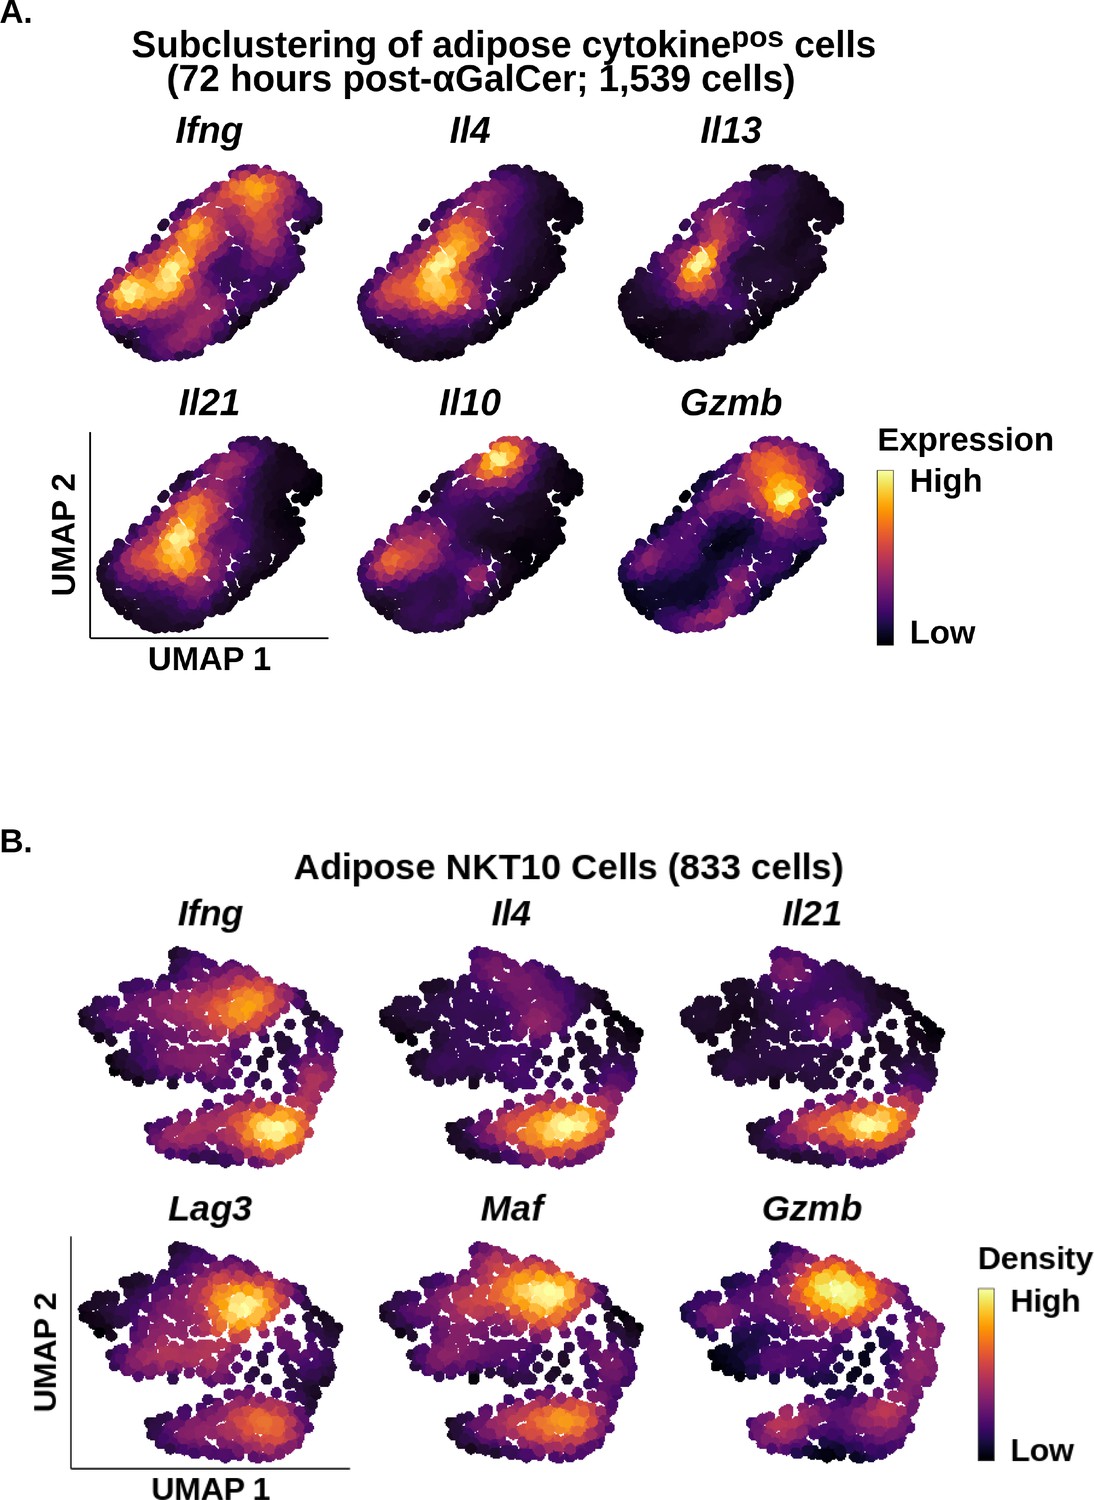
Adipose iNKT cell heterogeneity at 72hr post aGalCer activation.
(A) Density plots of cytokine gene expression in murine adipose cytokinepos invariant natural killer T (iNKT) cells 72 hr post-α-galalctosylceramide (post-αGalCer) with cell cycle regression applied. (B) Density plots of cytokine and secreted factor gene expression in murine adipose Il10pos iNKT cells at 4 hr and 72 hr post-αGalCer with cell cycle regression applied.
Figure 5 with 4 supplements
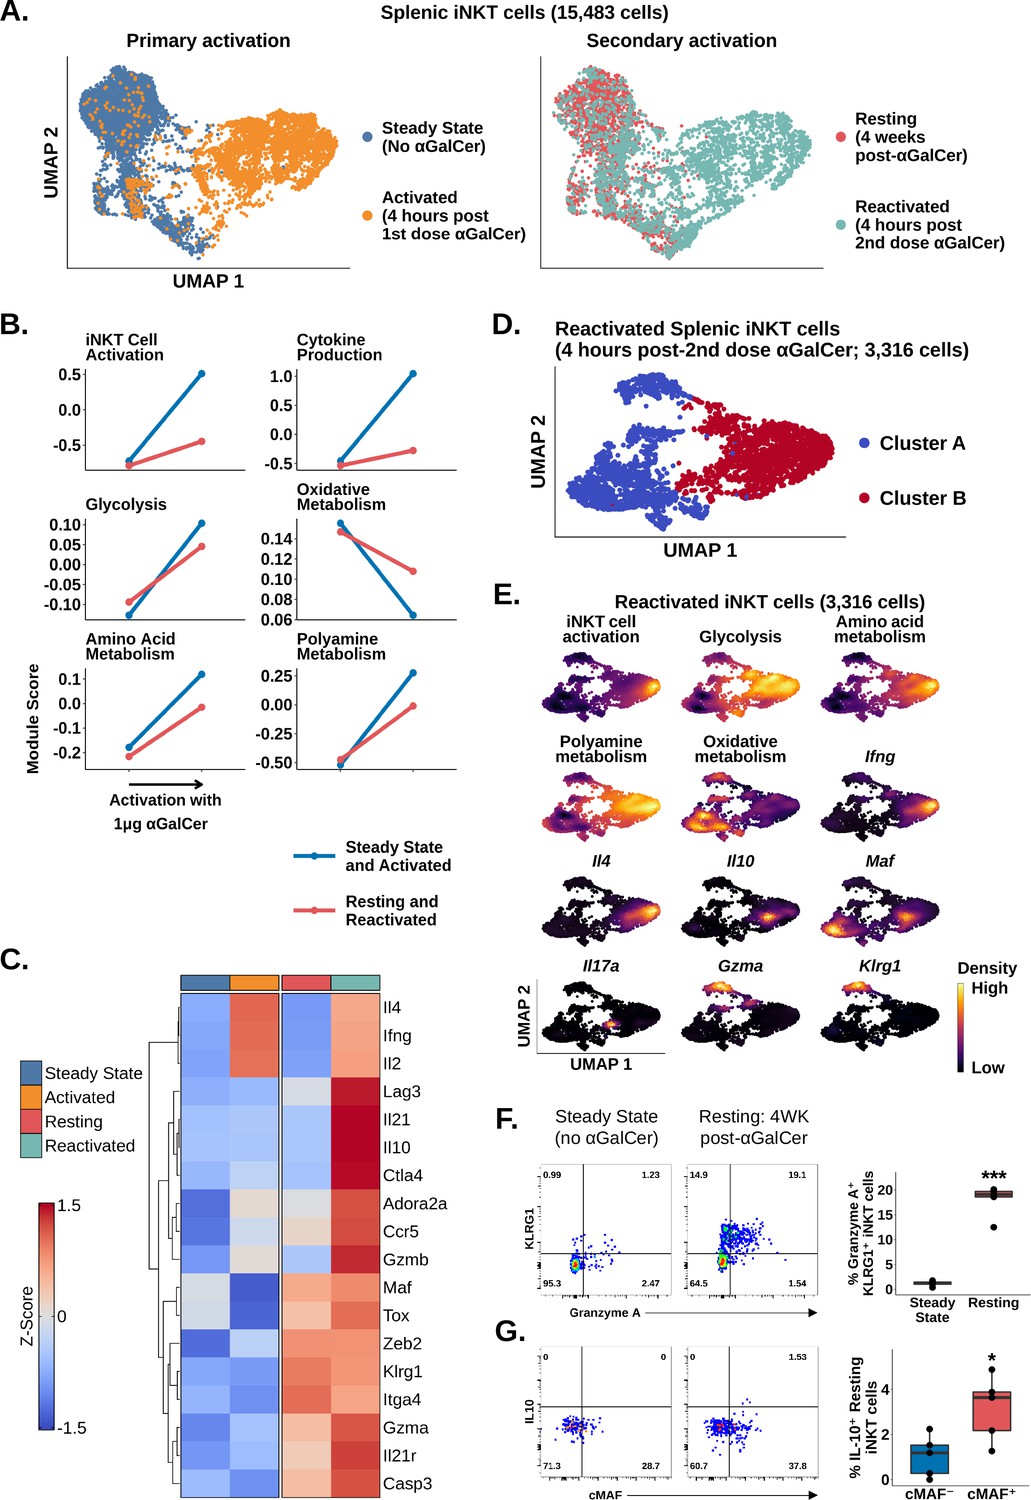
Chronic activation of splenic invariant natural killer T (iNKT) cells induces an adipose-like phenotype and the appearance of populations expressing Tr1 cell markers.
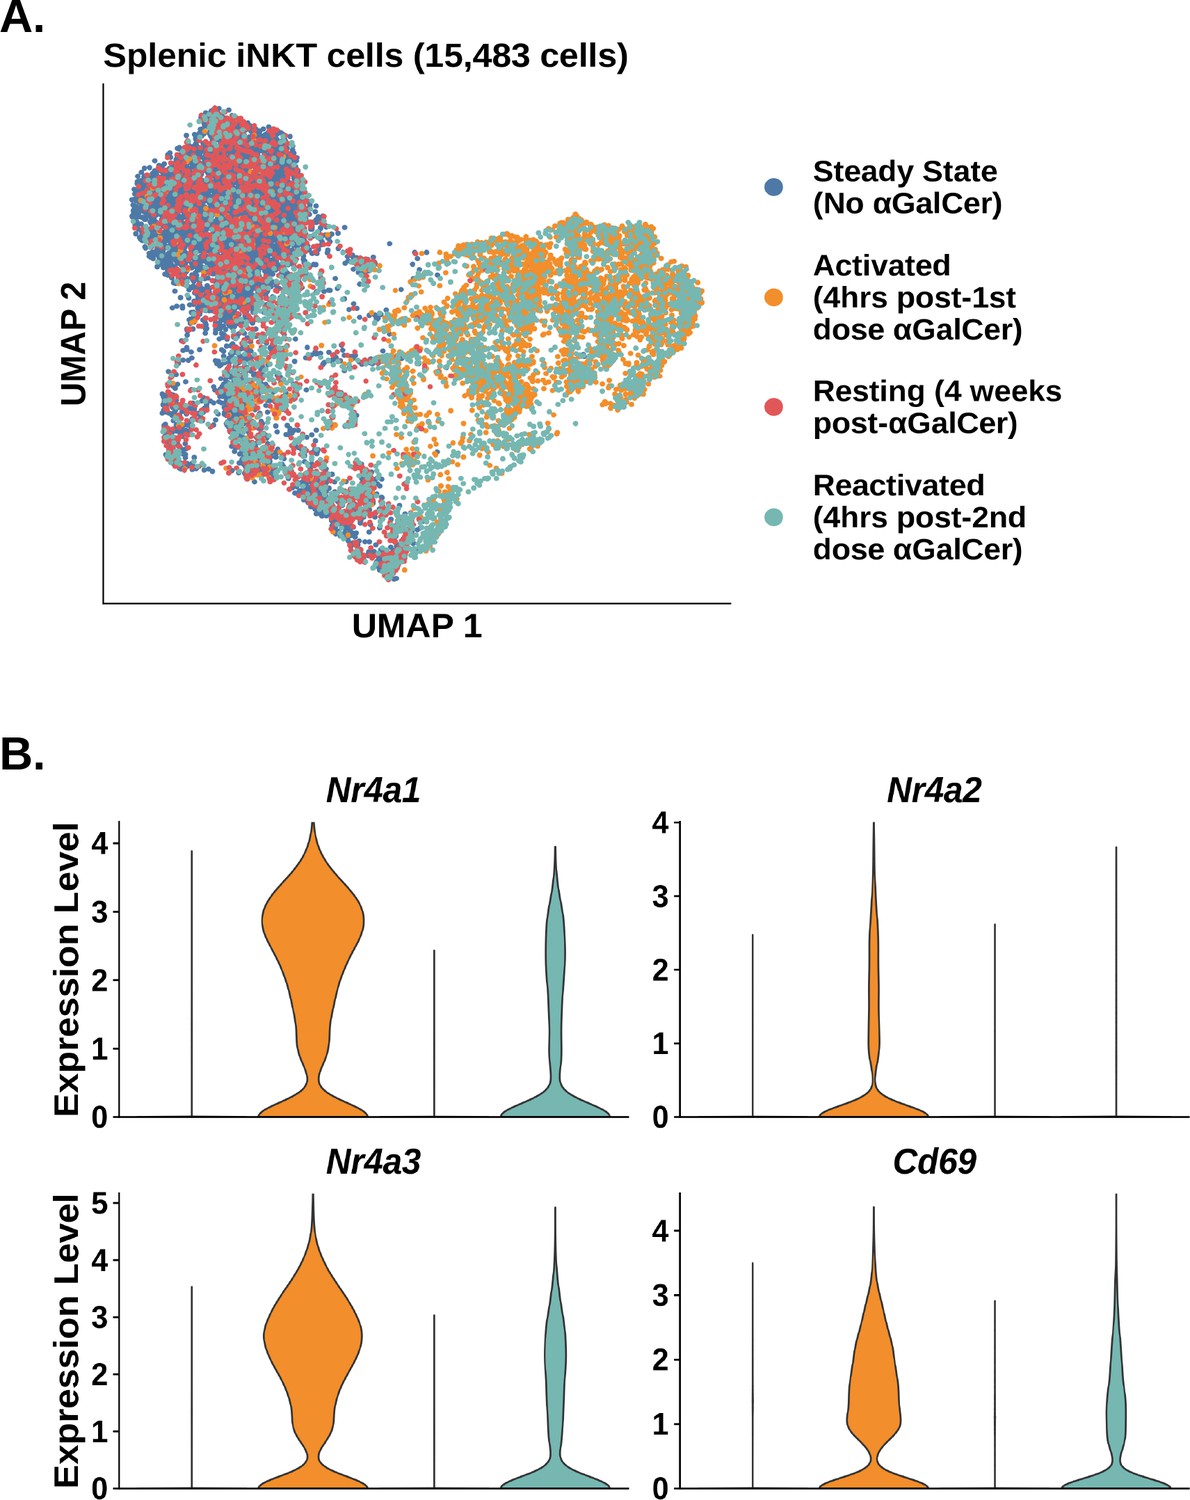
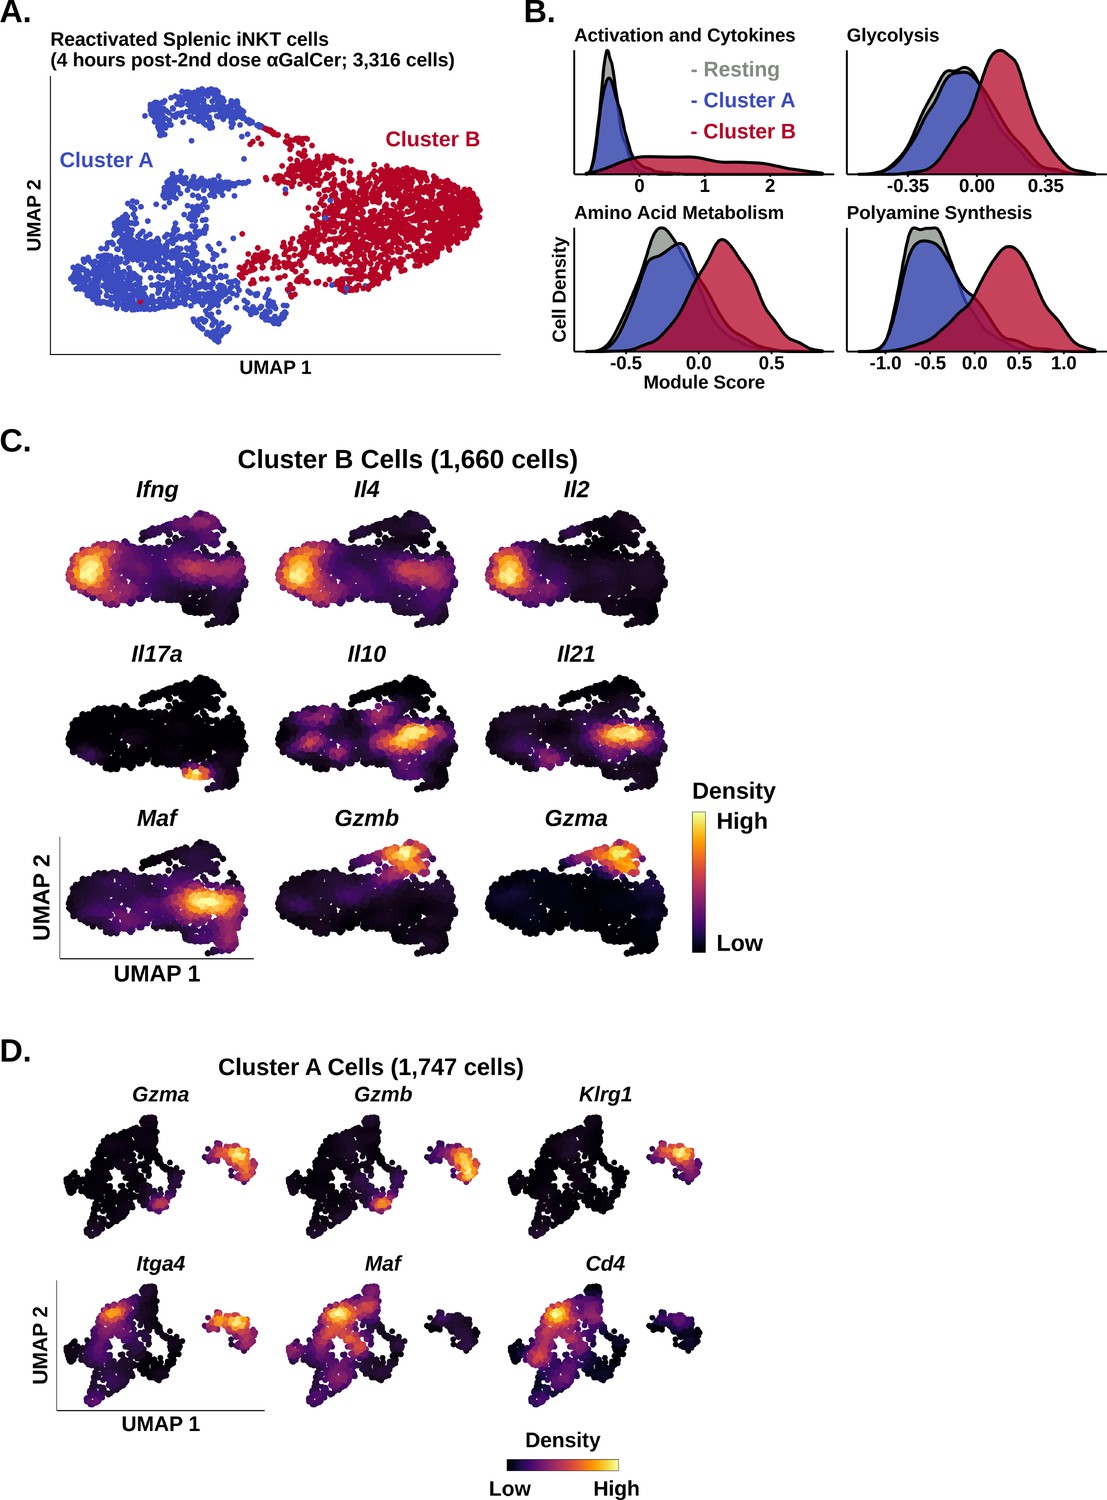
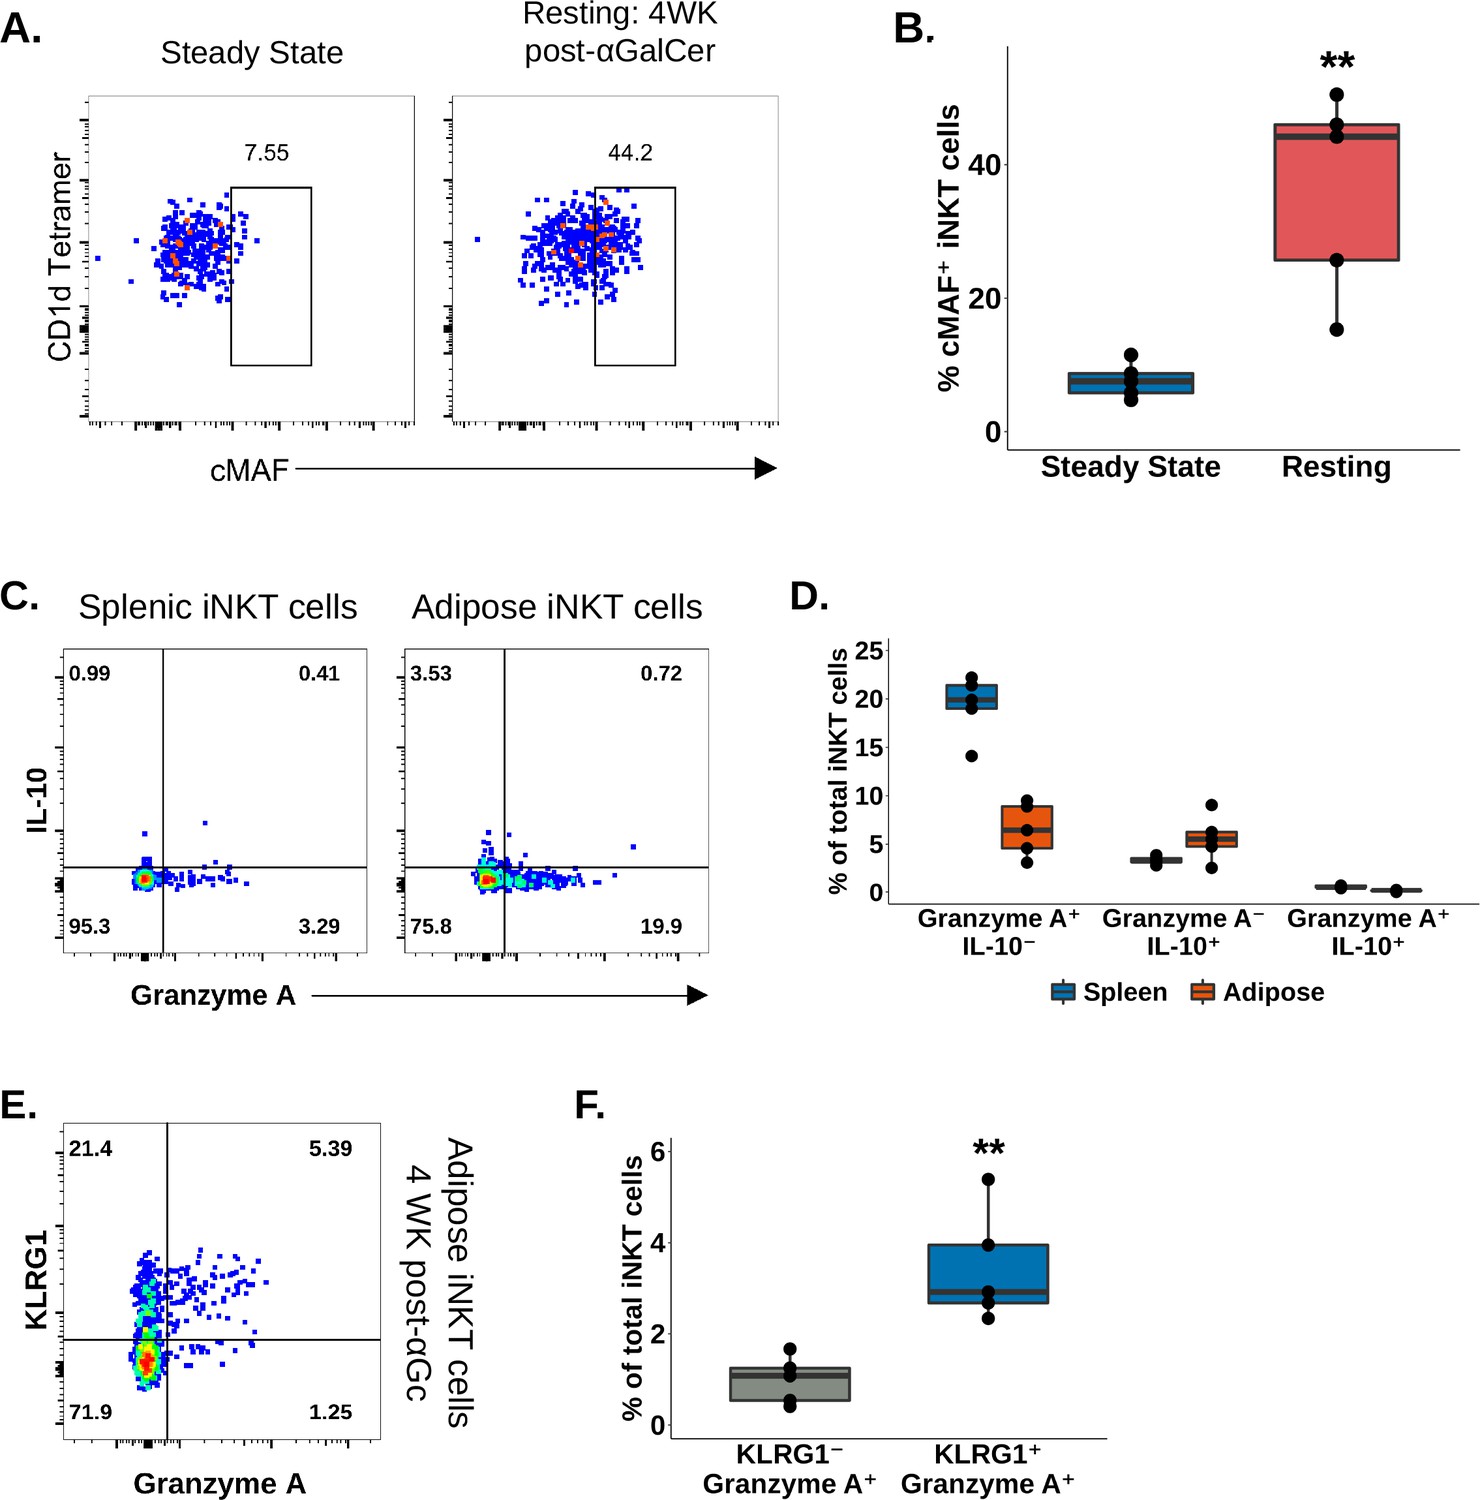
(A) Uniform manifold approximation and projection (UMAP) of murine splenic iNKT cells. (B) Line plots showing median expression of functional and metabolic gene module scores in the data from (A). (C) Heatmap of scaled averaged gene expression with hierarchical clustering in the data from (A). (D) UMAP of subclustered murine splenic reactivated iNKT cells from (A). (E) Density plots of functional and metabolic gene module score and gene expression in the reactivated iNKT cells from the data in (D). (F) Representative pseudocolor plots of Granzyme A versus KLRG1 expression in steady state and resting splenic iNKT cells at 4 weeks post-α-galalctosylceramide (post-αGalCer) and after restimulation with 50 ng phorbol 12-myristate 13-acetate (PMA) and 1 µg ionomycin for 4 hr ex vivo (left), and box plot quantification of the pseudocolor plot data (right). iNKT cells were defined as live, single CD45+ CD8- CD19- F4/80- CD3low CD1d-PBS57 tetramer+ cells. N = 5 biological replicates from one experiment. Experiment performed at least twice. Student’s unpaired t-test. Asterisks denote significance, *p<0.05; **p<0.01; ***p<0.001. Source data provided in Figure 5—source data 1. The central box plot horizontal line denotes the median value. (G) Representative pseudocolor plots of cMAF versus IL-10 expression in steady state and resting splenic iNKT cells at 4 weeks post-αGalCer and after restimulation with 50 ng PMA and 1 µg Ionomycin for 4 hr ex vivo (left), and box plot quantification of the resting iNKT cell data from the pseudocolor plot data (right). iNKT cells were defined as live, single CD45+ CD8- CD19- F4/80- CD3low CD1d-PBS57 tetramer+ cells. N = 5 biological replicates from one experiment. Experiment performed at least twice. Student’s unpaired t-test. Asterisks denote significance, *p<0.05; **p<0.01; ***p<0.001. Source data provided in Figure 5—source data 2. The central box plot horizontal line denotes the median value.
-
Figure 5—source data 1
% IL-10 production by flow cytometry in cmaf postive or negative iNKT cells.
- https://cdn.elifesciences.org/articles/76586/elife-76586-fig5-data1-v3.xlsx
-
Figure 5—source data 2
% KLRG1 Granzyme A expression by flow cytometry by iNKT without or without treatment.
- https://cdn.elifesciences.org/articles/76586/elife-76586-fig5-data2-v3.xlsx
Figure 5—figure supplement 1
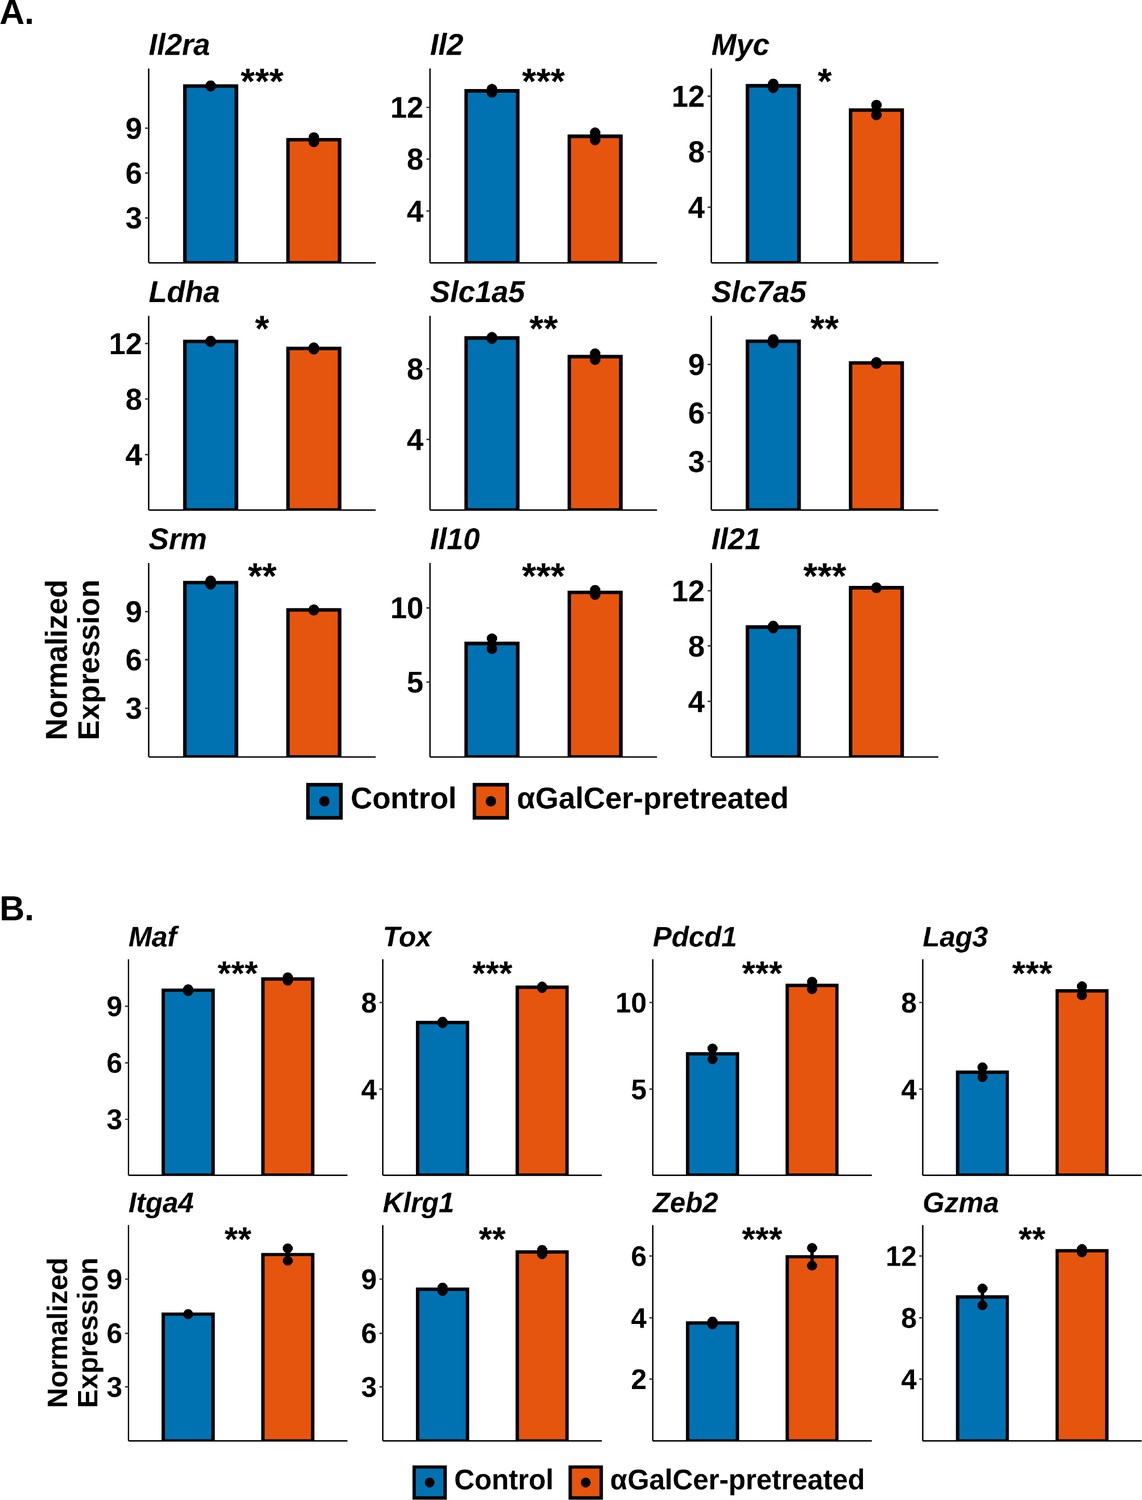
Reanalysis from GSE47959 showing gene expression differences between splenic iNKT with and outout a previous aGalCer activation.
(A) Robust Multichip Average (RMA)-normalized microarray gene expression in control and α-galalctosylceramide (αGalCer)-pretreated murine splenic invariant natural killer T (iNKT) cells after activation with 1 μg αGalCer for 90 min in vivo prior to isolation. Reanalyzed from GSE47959. Values below 0.25 units of expression were set to 0.25 for plotting. (B) RMA-normalized microarray gene expression in control and αGalCer-pretreated murine splenic iNKT cells at rest. Reanalyzed from GSE47959. Values below 0.25 units of expression were set to 0.25 for plotting.
Figure 5—figure supplement 2
Activation markers in iNKT cells at different activation states.
(A) Uniform manifold approximation and projection (UMAP) of murine splenic invariant natural killer T (iNKT) cells at steady state (Steady State), activated iNKT cells at 4 hr post-α-galalctosylceramide (post-αGalCer) (1 μg; Activated), resting iNKT cells at 4 weeks post-αGalCer (4 μg; Resting), and reactivated iNKT cells at 4 weeks post-αGalCer (4 μg) and 4 hr post-reactivation with αGalCer (1 μg; Reactivated). (B) Violin plots showing gene expression of iNKT cell activation markers in the data from (A).
Figure 5—figure supplement 3
Functional and metabolic gene module scores in different iNKT cell clusters.
(A) Uniform manifold approximation and projection (UMAP) plot of subclustered murine splenic reactivated invariant natural killer T (iNKT) cells. (B) Histograms showing expression of functional and metabolic gene module scores in the data from (A). (C) Density plots of cytokine and secreted factor gene expression in subclustered cluster B cells from the data in (A). (D) Density plots of surface marker, transcription factor, and secreted factor gene expression in subclustered cluster A cells from the data in (A).
Figure 5—figure supplement 4
Distinct expression patterns of MAF, IL10, Granzyme and KLRG1 associated with different iNKT cell states.
(A) Representative pseudocolor plots of cMAF expression versus CD1d-PBS57 tetramer staining in murine splenic invariant natural killer T (iNKT) cells at steady state (left panel) versus resting murine splenic iNKT cells at 4 weeks (WK) post-α-galalctosylceramide (post-αGalCer) (⍺GC; right panel). iNKT cells were defined as live, single CD45+ F4/80- CD19- CD3low CD1d-PBS57 tetramer+ cells. (B) Box plot quantifying the percentage data in (A). N = 5 biological replicates from one experiment. Experiment performed at least three times. Student’s unpaired t-test. Asterisks denote significance, *p<0.05; **p<0.01; ***p<0.001. The central box plot horizontal line denotes the median value. (C) Representative pseudocolor plots of Granzyme A versus IL-10 expression in murine splenic (left) or adipose (right) iNKT cells at 4 weeks post-αGalCer and after restimulation for 4 hr ex vivo with 50 ng phorbol 12-myristate 13-acetate (PMA) and 1 µg ionomycin. iNKT cells were defined as live, single CD45+ CD8- F4/80- CD19- CD3low CD1d-PBS57 tetramer+ cells. (D) Box plot quantifying the percentage data in(C). N = 5 biological replicates from one experiment. Experiment performed once. The central box plot horizontal line denotes the median value. (E) Representative pseudocolor plots of Granzyme A versus KLRG1 expression in murine adipose iNKT cells at 4 weeks post-αGalCer and after restimulation for 4 hr ex vivo with 50 ng PMA and 1 µg ionomycin. iNKT cells were defined as live, single CD45+ CD8- F4/80- CD19- CD3low CD1d-PBS57 tetramer+ cells. (F) Box plot quantifying the percentage data in (E). N = 5 biological replicates from one experiment. Experiment performed once. Student’s unpaired t-test. Asterisks denote significance, *p<0.05; **p<0.01; ***p<0.001. The central box plot horizontal line denotes the median value.
Figure 6 with 5 supplements
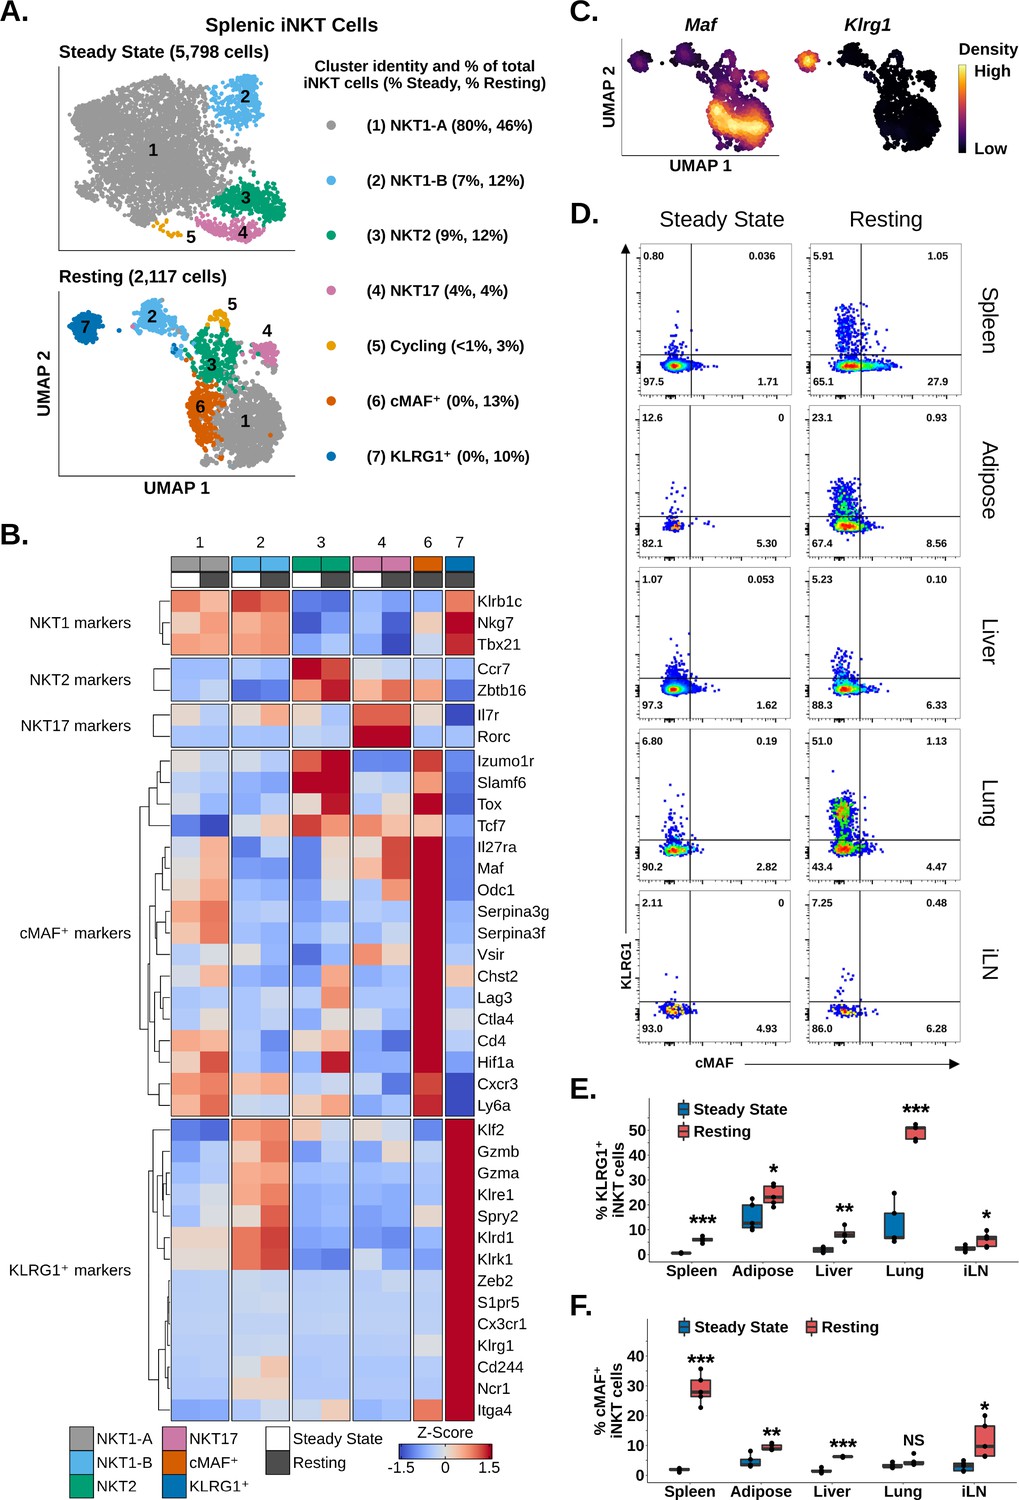
Memory-like cMAF+ and KLRG1+ invariant natural killer T (iNKT) cells are induced in the spleen following α-galalctosylceramide (αGalCer) challenge, and similar populations are constitutively present in adipose tissue.
(A) Uniform manifold approximation and projection (UMAP) of murine splenic iNKT cells. (B) Heatmap of scaled averaged gene expression with hierarchical clustering in the data from (A). Both datasets were merged and normalized together, and cycling cells were excluded from the analysis. (C) Density plots showing mutually expression of Maf and Klrg1 in the data from (A) (bottom UMAP). (D) Representative pseudocolor plots of RORγT- (spleen, adipose tissue, lung, and inguinal lymph nodes) or total (liver) murine splenic iNKT cells at steady-state or resting iNKT cells at 4 weeks post-αGalCer. iNKT cells were defined as live, single CD19- CD8- F4/80- CD3low CD1d-PBS57 tetramer+ cells. iLN, inguinal lymph node. (E) Box plots quantifying the KLRG1 percentage data from (D). N = 4 biological replicates for hepatic iNKT cells at 4 weeks post-αGalCer and N = 5 biological replicates for all other data from one experiment. Experiment performed at least twice in the spleen and once for other tissues. Student’s unpaired t-test. Asterisks denote significance, * Padj<0.05; ** Padj<0.01; *** Padj<0.001. Source data provided in Figure 6—source data 1. The central box plot horizontal line denotes the median value. (F) Box plots quantifying the cMAF percentage data from (D). N = 4 biological replicates for hepatic iNKT cells at 4 weeks post-αGalCer and N = 5 biological replicates for all other data from one experiment. Experiment performed at least twice in the spleen and once for other tissues. Student’s unpaired t-test. Asterisks denote significance, * Padj<0.05; ** Padj<0.01; *** Padj<0.001. Source data provided in Figure 6—source data 1. The central box plot horizontal line denotes the median value.
-
Figure 6—source data 1
Gene expression patterns in resting iNKT, 4 weeks post stimulation.
- https://cdn.elifesciences.org/articles/76586/elife-76586-fig6-data1-v3.xlsx
Figure 6—figure supplement 1
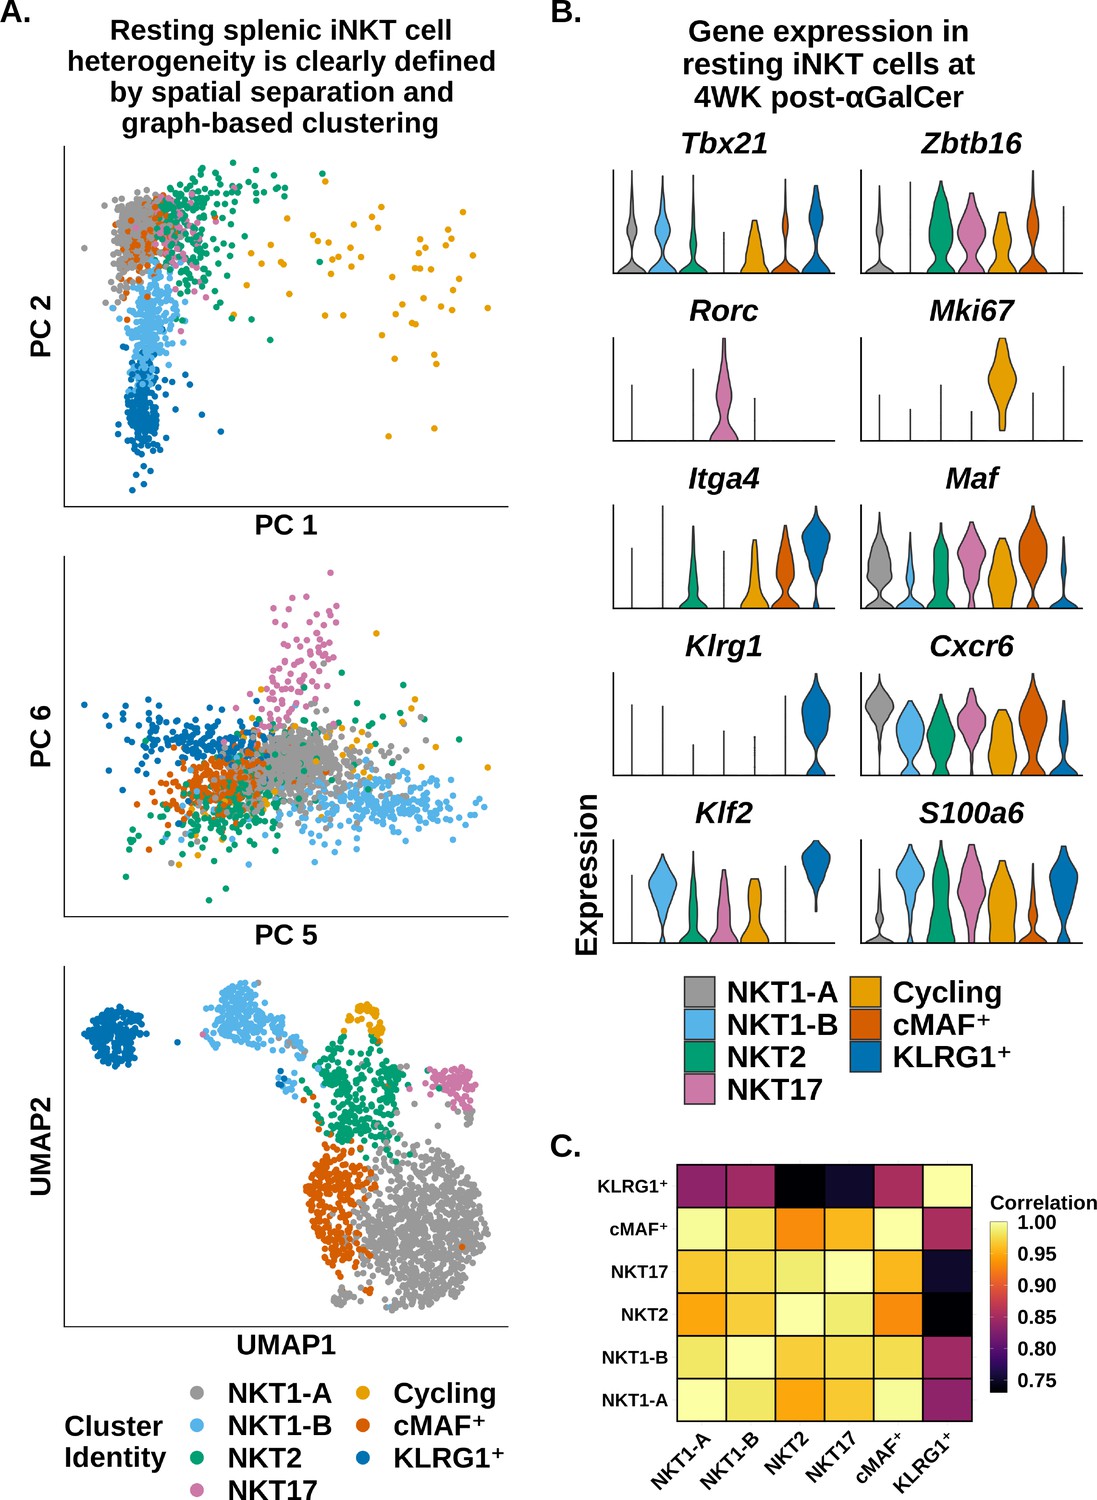
Gene expression of spenic iNKT cells resting 4 weeks post activation.
(A) Principal component analysis (PCA) plots and uniform manifold approximation and projection (UMAP) plot of murine resting splenic invariant natural killer T (iNKT) cells at 4 weeks post-α-galalctosylceramide (post-αGalCer). (B) Violin plots of marker gene expression in the clusters from (A). (C) Correlation plot of total normalized RNA counts for all genes for the clusters from (A) (cycling cells were excluded).
Figure 6—figure supplement 2
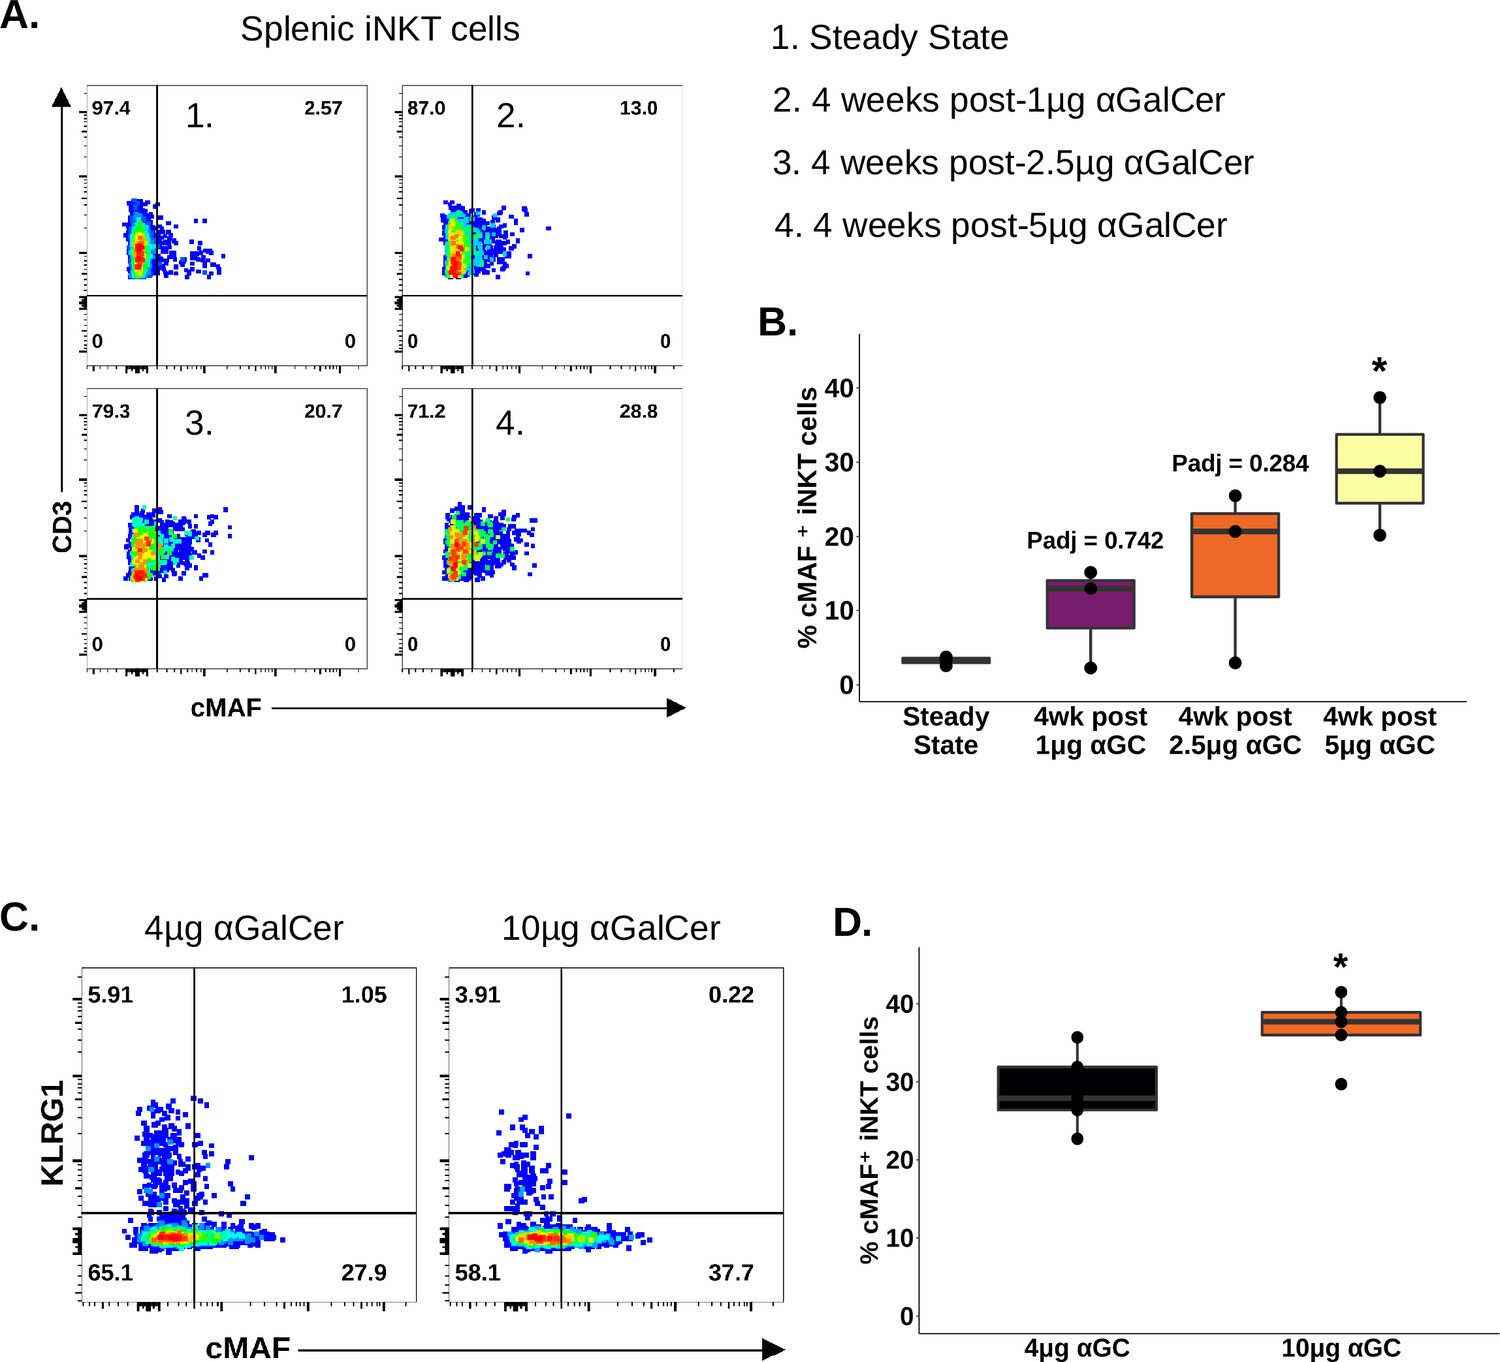
Strength of TCR signal is associated with strength of MAF expression.
(A) Representative pseudocolor plots of cMAF versus CD3 expression in murine splenic invariant natural killer T (iNKT) cells at steady state (panel 1) or 4 weeks (WK) post-activation with 1 μg α-galalctosylceramide (αGalCer) (panel 2), 2.5 μg αGalCer (panel 3), or 5 μg αGalCer (panel 4). iNKT cells were defined as live, single CD45+ CD8- CD11b- CD19- CD3low CD1d-PBS57 tetramer+ cells. (B) Box plot quantifying the percentage data in (A). N = 3 biological replicates from one experiment. Experiment performed once. One-way ANOVA and Tukey’s post hoc test. Asterisks denote significance, * Padj<0.05; ** Padj<0.01; *** Padj<0.001. The central box plot horizontal line denotes the median value. (C) Representative pseudocolor plots of cMAF versus KLRG1 expression in RORγT- murine splenic iNKT cells at 4 weeks post-activation with 4 μg αGalCer (left) or 10 μg αGalCer (right). iNKT cells were defined as live, single CD45+ CD8- F4/80- CD19- CD3low CD1d-PBS57 tetramer+ cells. (D) Box plot quantifying the percentage data in (C). N = 5 biological replicates. Experiment performed once. Student’s unpaired t-test. Asterisks denote significance, *p<0.05; **p<0.01; ***p<0.001. The central box plot horizontal line denotes the median value.
Figure 6—figure supplement 3
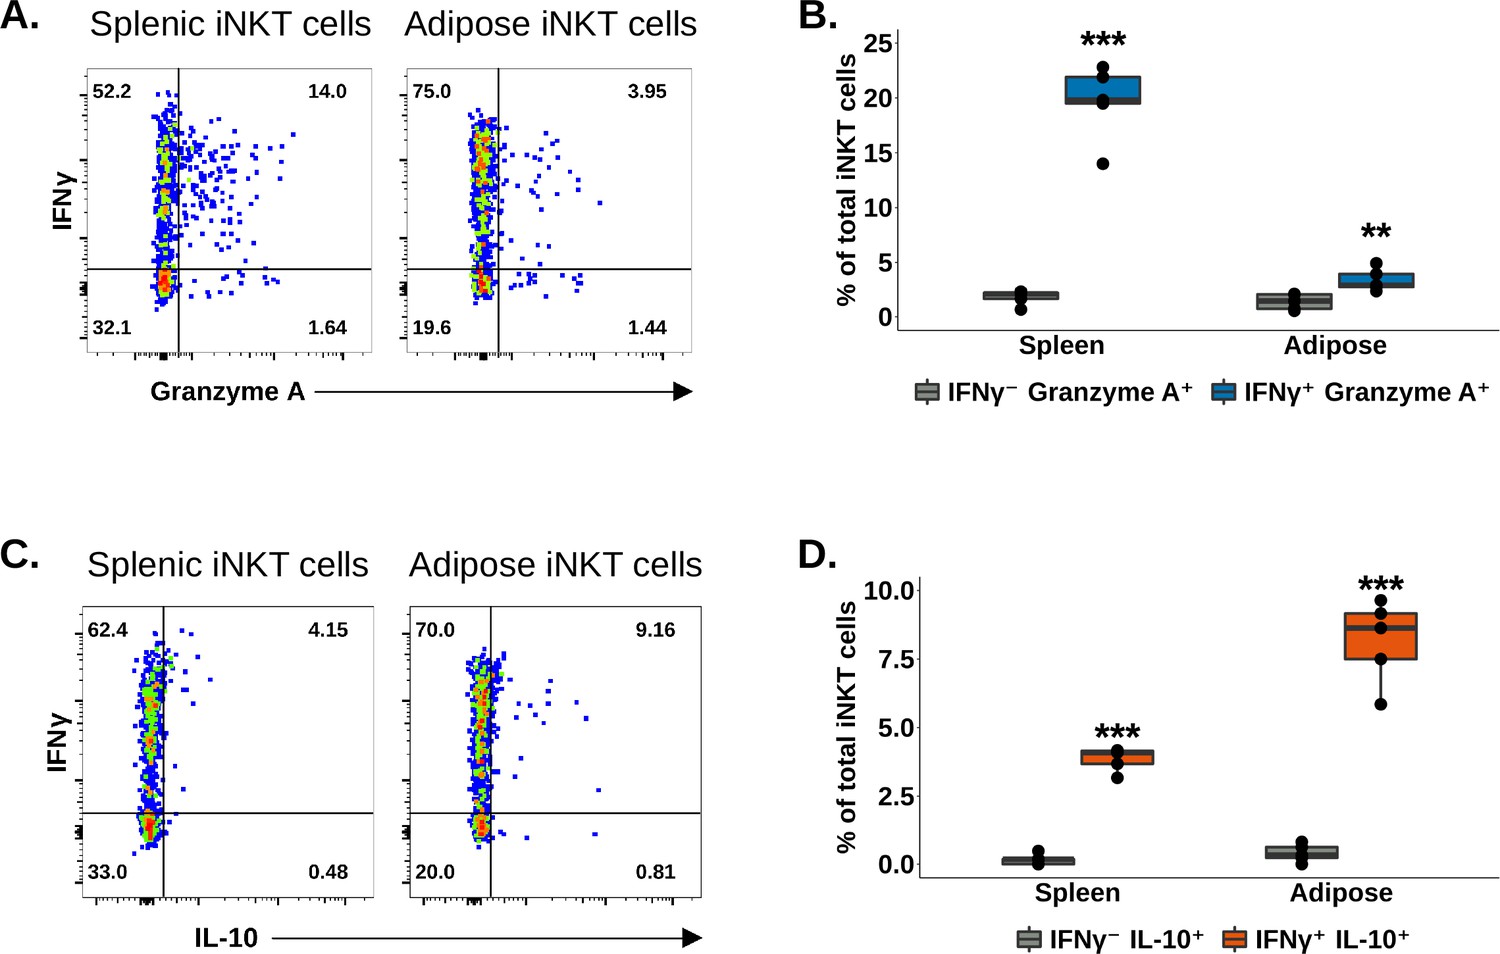
Comparison of splenic and adipose iNKT cells expression of functional markers.
(A) Representative pseudocolor plots of Granzyme A versus IFNγ expression in murine splenic (left) or adipose (right) invariant natural killer T (iNKT) cells at 4 weeks post-α-galalctosylceramide (post-αGalCer) and after restimulation for 4 hr ex vivo with 50 ng phorbol 12-myristate 13-acetate (PMA) and 1 µg ionomycin. iNKT cells were defined as live, single CD45+ CD8- F4/80- CD19- CD3low CD1d-PBS57 tetramer+ cells. (B) Box plot quantifying the percentage data in (A). N = 5 biological replicates from one experiment. Experiment performed once. Student’s unpaired t-test. Asterisks denote significance, * Padj<0.05; ** Padj<0.01; *** Padj<0.001. The central box plot horizontal line denotes the median value. Padj denotes the adjusted p-value. (C) Representative pseudocolor plots of IL-10 versus IFNγ expression in murine splenic (left) or adipose (right) iNKT cells at 4 weeks (wk) post-αGalCer (⍺GC) and after restimulation for 4 hr ex vivo with 50 ng PMA and 1 µg ionomycin. iNKT cells were defined as live, single CD45+ CD8- F4/80- CD19- CD3low CD1d-PBS57 tetramer+ cells. (D) Box plot quantifying the percentage data in (C). N = 5 biological replicates from one experiment. Experiment performed once. Student’s unpaired t-test. Asterisks denote significance, * Padj<0.05; ** Padj<0.01; *** Padj<0.001. The central box plot horizontal line denotes the median value.
Figure 6—figure supplement 4
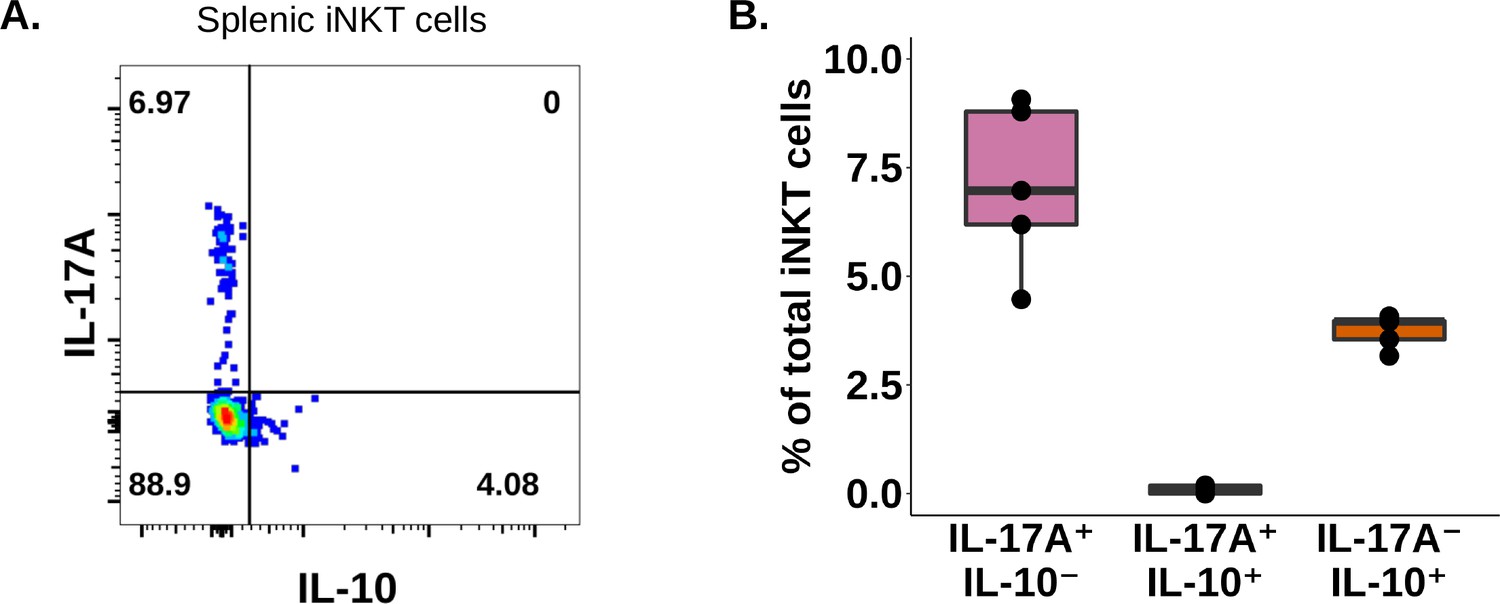
IL17 and IL10 expression is mutually exclusive on iNKT cells.
(A) Representative pseudocolor plot of IL-10 versus IL-17A expression in murine splenic invariant natural killer T (iNKT) cells at 4 weeks post-α-galalctosylceramide (post-αGalCer) and after restimulation for 4 hr ex vivo with 50 ng phorbol 12-myristate 13-acetate (PMA) and 1 µg ionomycin. iNKT cells were defined as live, single CD45+ CD8- F4/80- CD19- CD3low CD1d-PBS57 tetramer+ cells. (B) Box plot quantifying the percentage data in (A). N = 5 biological replicates from one experiment. Experiment performed once. The central box plot horizontal line denotes the median value.
Figure 6—figure supplement 5
Resting adipose iNKT cells 4 weeks post aGalCer activation.
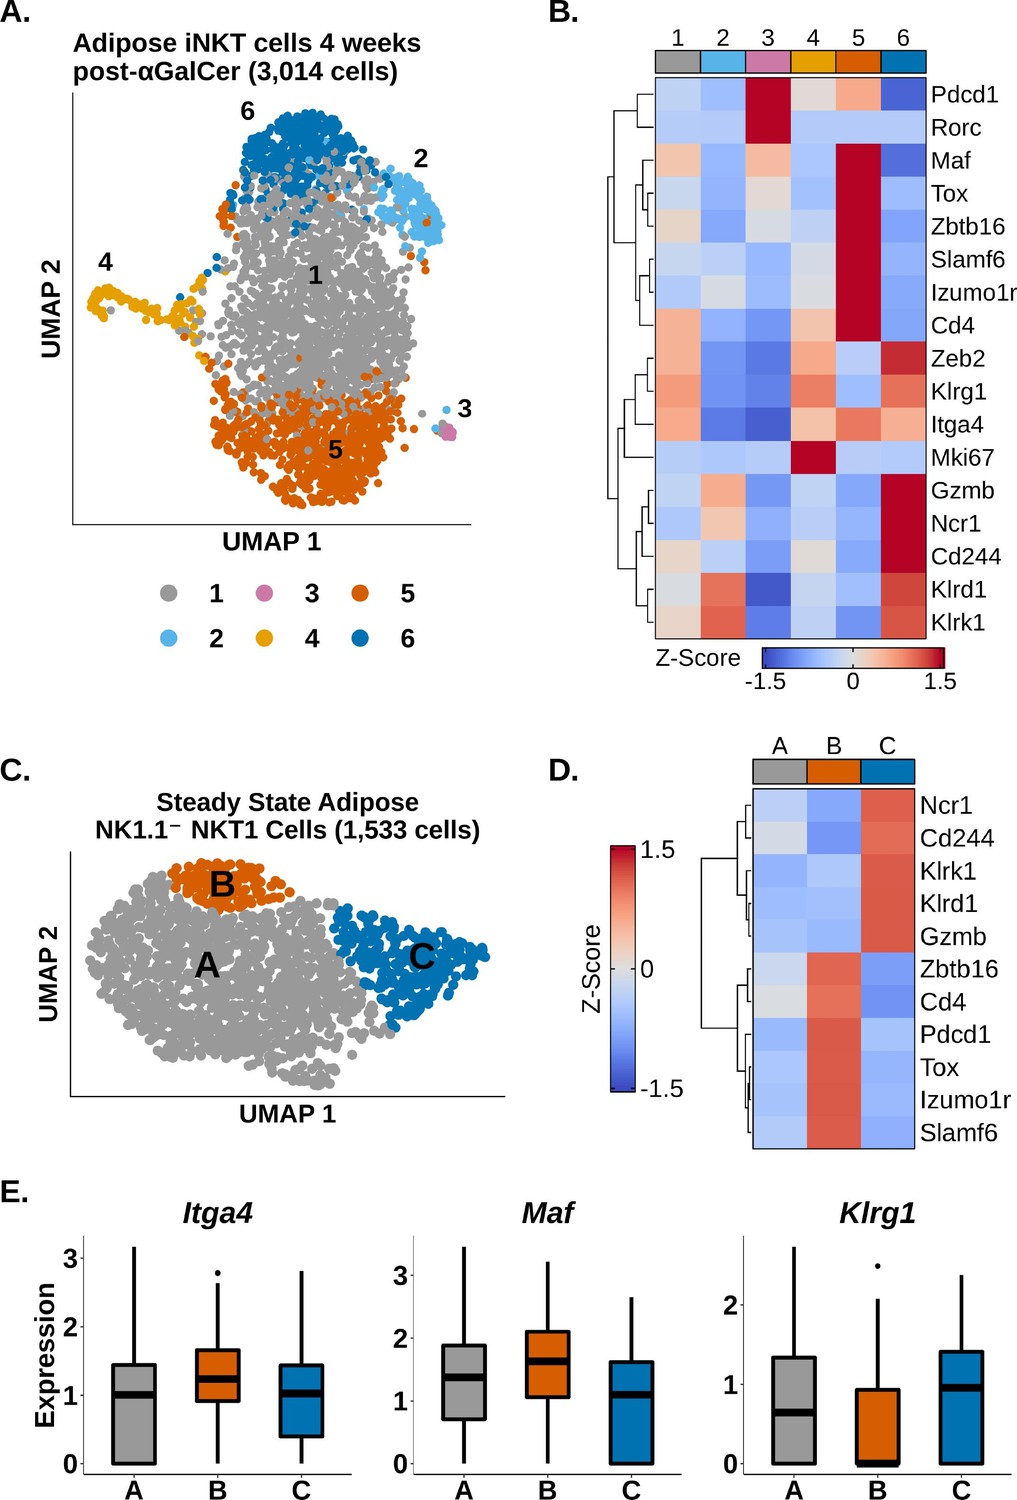
(A) Uniform manifold approximation and projection (UMAP) of murine resting adipose invariant natural killer T (iNKT) cells at 4 weeks post-α-galalctosylceramide (post-αGalCer). (B) Heatmap of scaled averaged gene expression with hierarchical clustering in the data in the data from (A). (C) UMAP of subclustered murine steady-state adipose NK1.1- NKT1 cells. (D) Heatmap of scaled averaged gene expression with hierarchical clustering in the data in the data from (C). (E) Box plots of gene expression in the data from (C). The central box plot horizontal line denotes the median value.
Figure 7 with 1 supplement
Identification of a conserved cMAF-associated and NKTFH-like transcriptional state in NKT10 cells.
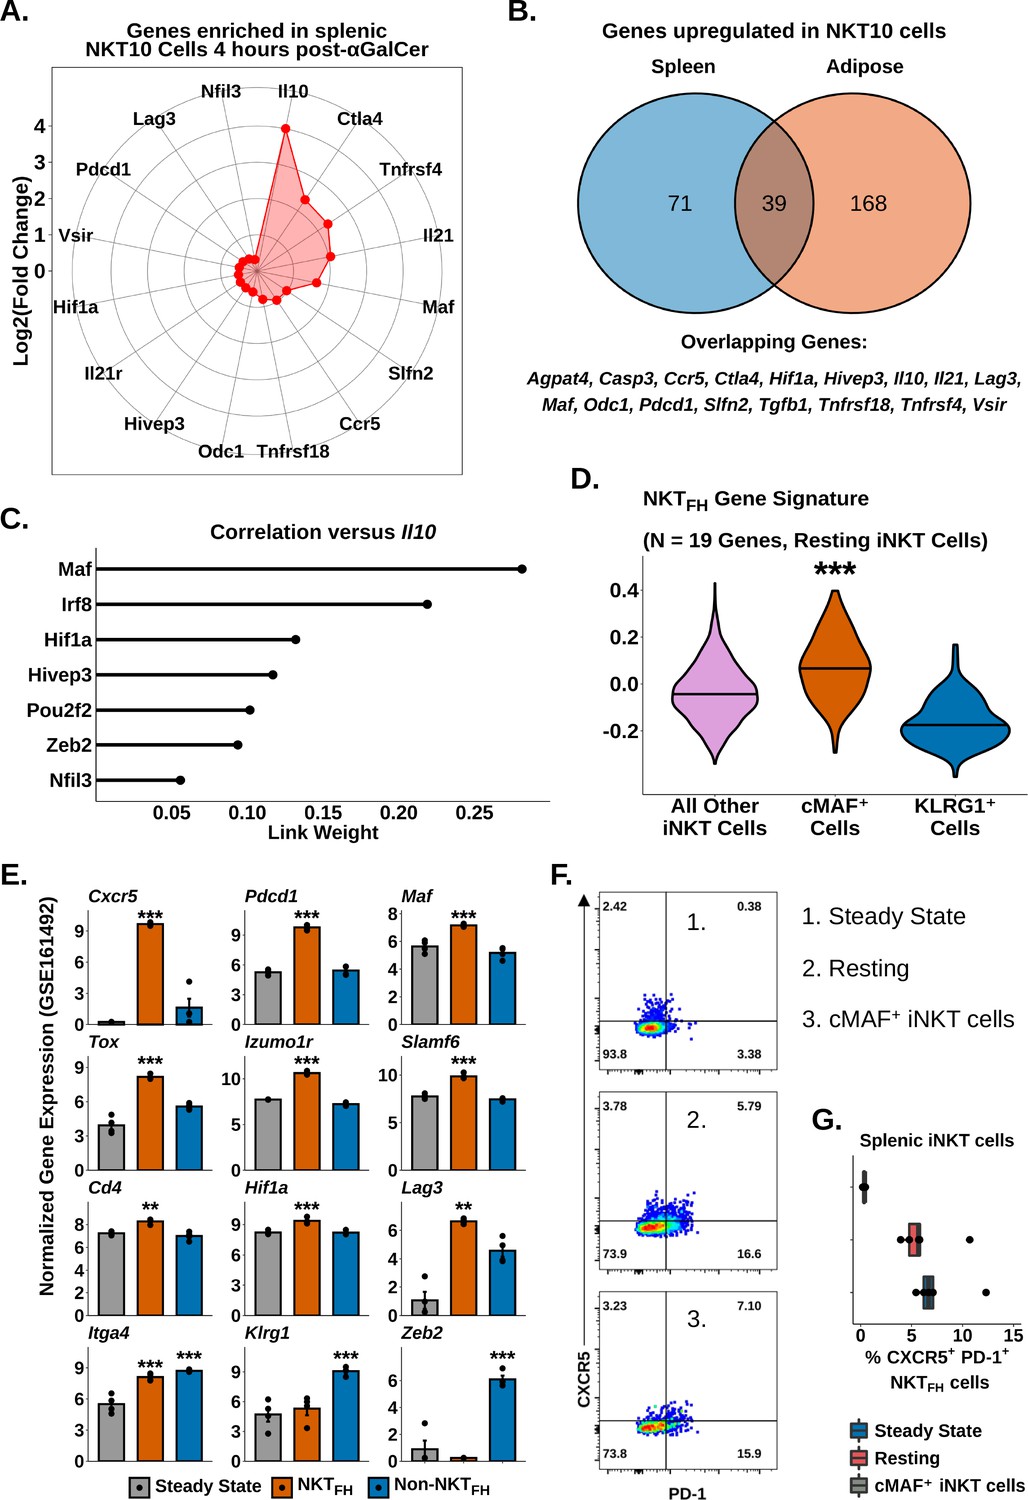
(A) Radar chart showing Log2(Fold Change) values of genes enriched in murine splenic activated Il10pos invariant natural killer T (iNKT) cells versus activated Il10neg iNKT cells at 4 hr post-α-galalctosylceramide (post-αGalCer). (B) Venn diagram showing overlap of genes enriched in murine splenic (left) and adipose (right) Il10pos iNKT cells after αGalCer (activated 4 hr post-αGalCer splenic iNKT cells, and 4 hr and 72 hr post-αGalCer for adipose iNKT cells). (C) Lollipop plot showing correlation (Link Weight) values of different transcription factors versus Il10 from GENIE3 analysis of total splenic and adipose NKT10 cells. Source data provided in Figure 7—source data 1. (D) Violin plots showing expression and enrichment of NKTFH signature gene module scoring in resting splenic iNKT cells, with NKT1-A, NKT1-B, NKT2, NKT17 and cycling cell clusters pooled together (all other iNKT cells) and compared versus cMAF+ and KLRG1+ iNKT cell clusters. The central violin plot horizontal line denotes the median value. Asterisks denote significance, * Padj<0.05; ** Padj<0.01; *** Padj<0.001. (E) Bar plots showing bulk RNA-seq gene expression values in untreated total murine splenic iNKT cells (steady state) and murine splenic NKTFH or non-NKTFH cells (6 days post-αGalCer). Reanalyzed from GSE161492. Asterisks indicate significantly increased expression versus all other populations or versus steady state alone (Itga4 only). * Padj<0.05; ** Padj<0.01; *** Padj<0.001. (F) Representative pseudocolor plots of CXCR5 versus PD-1 expression in murine total steady-state splenic iNKT cells (1), total resting splenic iNKT cells at 4 weeks post-αGalCer (2) or splenic RORyT- cMAF+ iNKT cells at 4 weeks post-αGalCer (3). iNKT cells were defined as live, single CD19- CD8- F4/80- CD3low CD1d-PBS57 tetramer+ cells. (G) Box plots quantifying the data from (F). N = 5 biological replicates from one experiment. Experiment performed once. Source data provided in Figure 7—source data 2. The central box plot horizontal line denotes the median value.
-
Figure 7—source data 1
Gene expression in iNKT cell clusters.
- https://cdn.elifesciences.org/articles/76586/elife-76586-fig7-data1-v3.xlsx
-
Figure 7—source data 2
NKT follicular helper cell associated gene expression in iNKT cell subsets.
- https://cdn.elifesciences.org/articles/76586/elife-76586-fig7-data2-v3.xlsx
Figure 7—figure supplement 1
NKTFH signature gene expression in control and αGalCer-pretreated splenic iNKT cells at rest.
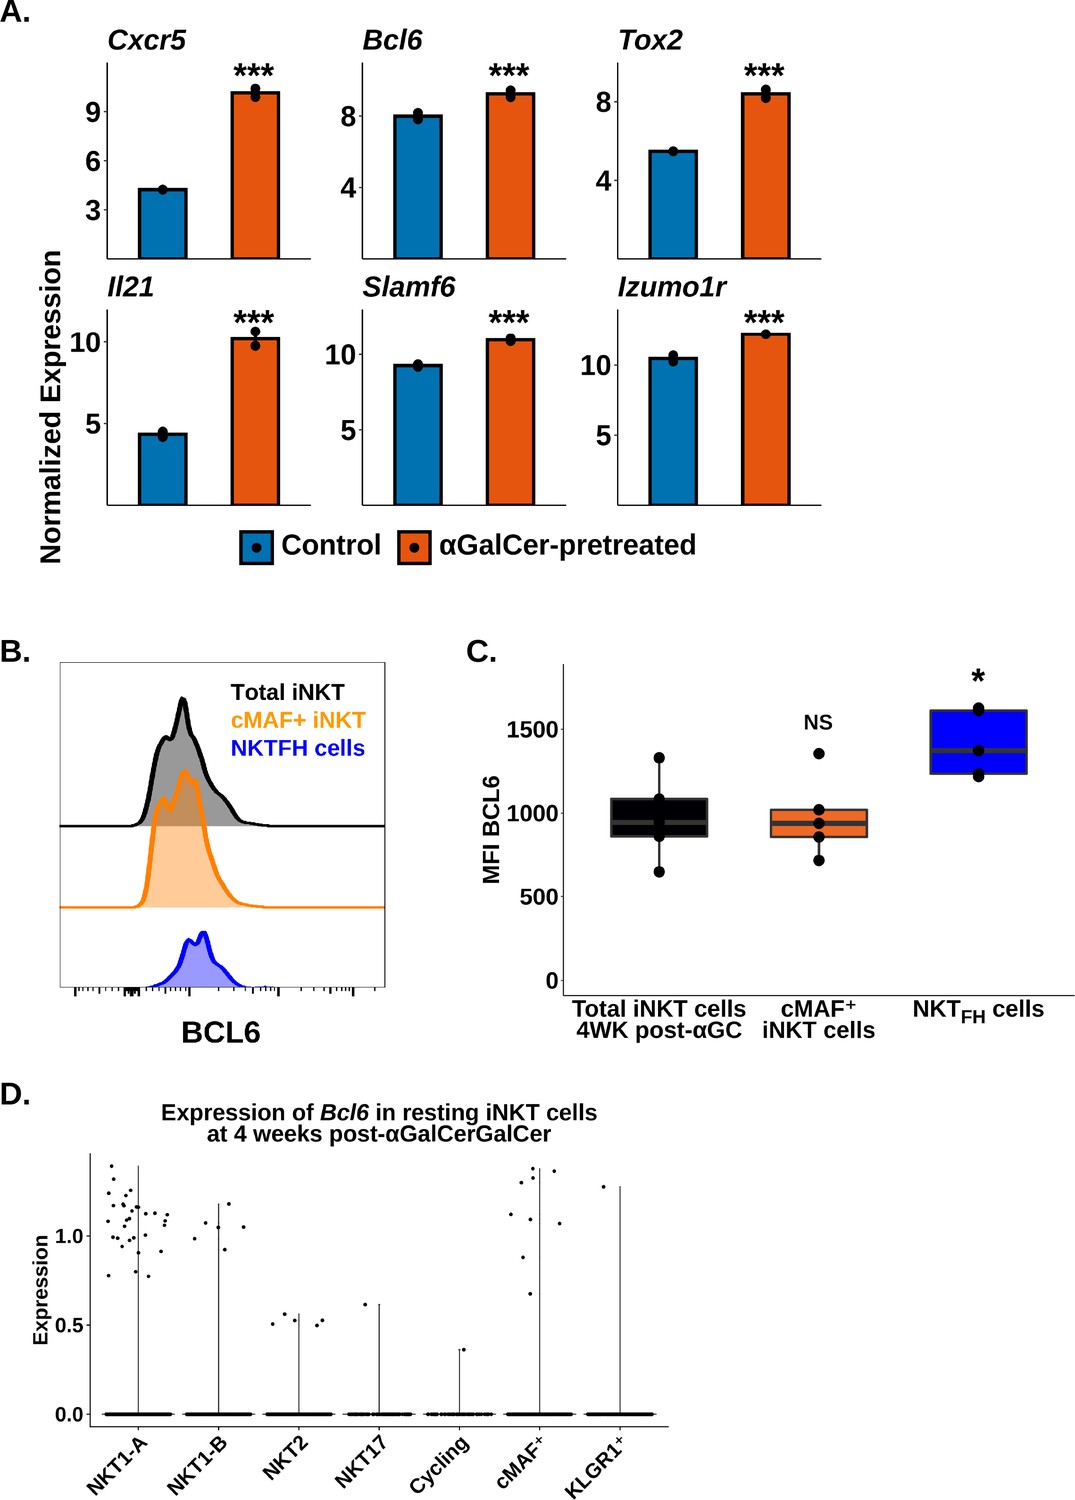
(A) Robust Multichip Average (RMA)-normalized microarray NKTFH signature gene expression in control and α-galalctosylceramide (αGalCer)-pretreated murine splenic invariant natural killer T (iNKT) cells at rest. Reanalyzed from GSE47959. Values below 0.25 units of expression were set to 0.25 for plotting. (B) Representative histogram of BCL6 expression in total murine splenic iNKT cells at 4 weeks post-αGalCer, RORγT- cMAF+ murine splenic iNKT cells and murine CXCR5+ PD-1+ (NKTFH) cells. iNKT cells were defined as live, single CD19- CD8- CD3low CD1d-PBS57 tetramer+ cells. Histograms were normalized to the mode. (C) Box plot quantifying BCL6 median fluorescence intensity (MFI) in the populations from (B). N = 5 biological replicates from one experiment. Experiment performed once. Student’s unpaired t-test. Asterisks denote significance, * Padj<0.05; ** Padj<0.01; *** Padj<0.001. The central box plot horizontal line denotes the median value. (D) Violin plot of Bcl6 expression in murine resting splenic iNKT cell clusters at 4 weeks post-αGalCer.
Additional files
-
Supplementary file 1
Gene expression data associated with the scRNA-seq data in Figure 1B.
- https://cdn.elifesciences.org/articles/76586/elife-76586-supp1-v3.xlsx
-
Supplementary file 2
Lists of genes used for module scoring of scRNA-seq data, starting with Figure 1D.
- https://cdn.elifesciences.org/articles/76586/elife-76586-supp2-v3.xlsx
-
Supplementary file 3
Gene expression data associated with the scRNA-seq data in Figure 2A.
- https://cdn.elifesciences.org/articles/76586/elife-76586-supp3-v3.xlsx
-
Supplementary file 4
Lists of conserved gene expressed in adipose or splenic invariant natural killer T (iNKT) cells, associated with Figure 3B.
- https://cdn.elifesciences.org/articles/76586/elife-76586-supp4-v3.xlsx
-
Supplementary file 5
Lists of conserved gene expressed in adipose NKT10 cells, associated with Figure 4E.
- https://cdn.elifesciences.org/articles/76586/elife-76586-supp5-v3.xlsx
-
Supplementary file 6
Lists of conserved gene expressed in adipose NKT10 cells, associated with Figure 7A.
- https://cdn.elifesciences.org/articles/76586/elife-76586-supp6-v3.xlsx
-
Supplementary file 7
Gene expression data associated with reanalysis of bulk RNA-seq data from GSE161492 in Figure 7E.
- https://cdn.elifesciences.org/articles/76586/elife-76586-supp7-v3.xlsx
-
Supplementary file 8
Gene expression data associated with reanalysis of bulk microarray data from GSE47959, first referenced in Figure 5—figure supplement 1.
- https://cdn.elifesciences.org/articles/76586/elife-76586-supp8-v3.xlsx
-
Supplementary file 9
Information about scRNA-seq data batch processing and sample information, associated with the ‘Methods’ section.
- https://cdn.elifesciences.org/articles/76586/elife-76586-supp9-v3.xlsx
-
Transparent reporting form
- https://cdn.elifesciences.org/articles/76586/elife-76586-transrepform1-v3.docx
Download links
A two-part list of links to download the article, or parts of the article, in various formats.
Downloads (link to download the article as PDF)
Open citations (links to open the citations from this article in various online reference manager services)
Cite this article (links to download the citations from this article in formats compatible with various reference manager tools)
Longitudinal analysis of invariant natural killer T cell activation reveals a cMAF-associated transcriptional state of NKT10 cells
eLife 11:e76586.
https://doi.org/10.7554/eLife.76586


