The interferon-inducible GTPase MxB promotes capsid disassembly and genome release of herpesviruses
- Institute of Virology, Hannover Medical School, Germany
- RESIST - Cluster of Excellence, Hannover Medical School, Germany
- Institute of Virology, Technical University Munich, Germany
- Institute of Virology, Freiburg University Medical Center, University of Freiburg, Germany
- Department of Molecular Biology, Princeton University, United States
- MRC Human Immunology Unit, MRC Weatherall Institute of Molecular Medicine, Radcliffe Department of Medicine, University of Oxford, United Kingdom
- German Center for Infection Research (DZIF), Hannover-Braunschweig Partner Site, Germany
- Research Core Unit Laser Microscopy, Hannover Medical School, Germany
- German Center for Infection Research (DZIF), Munich Partner site, Germany
Figures
Figure 1
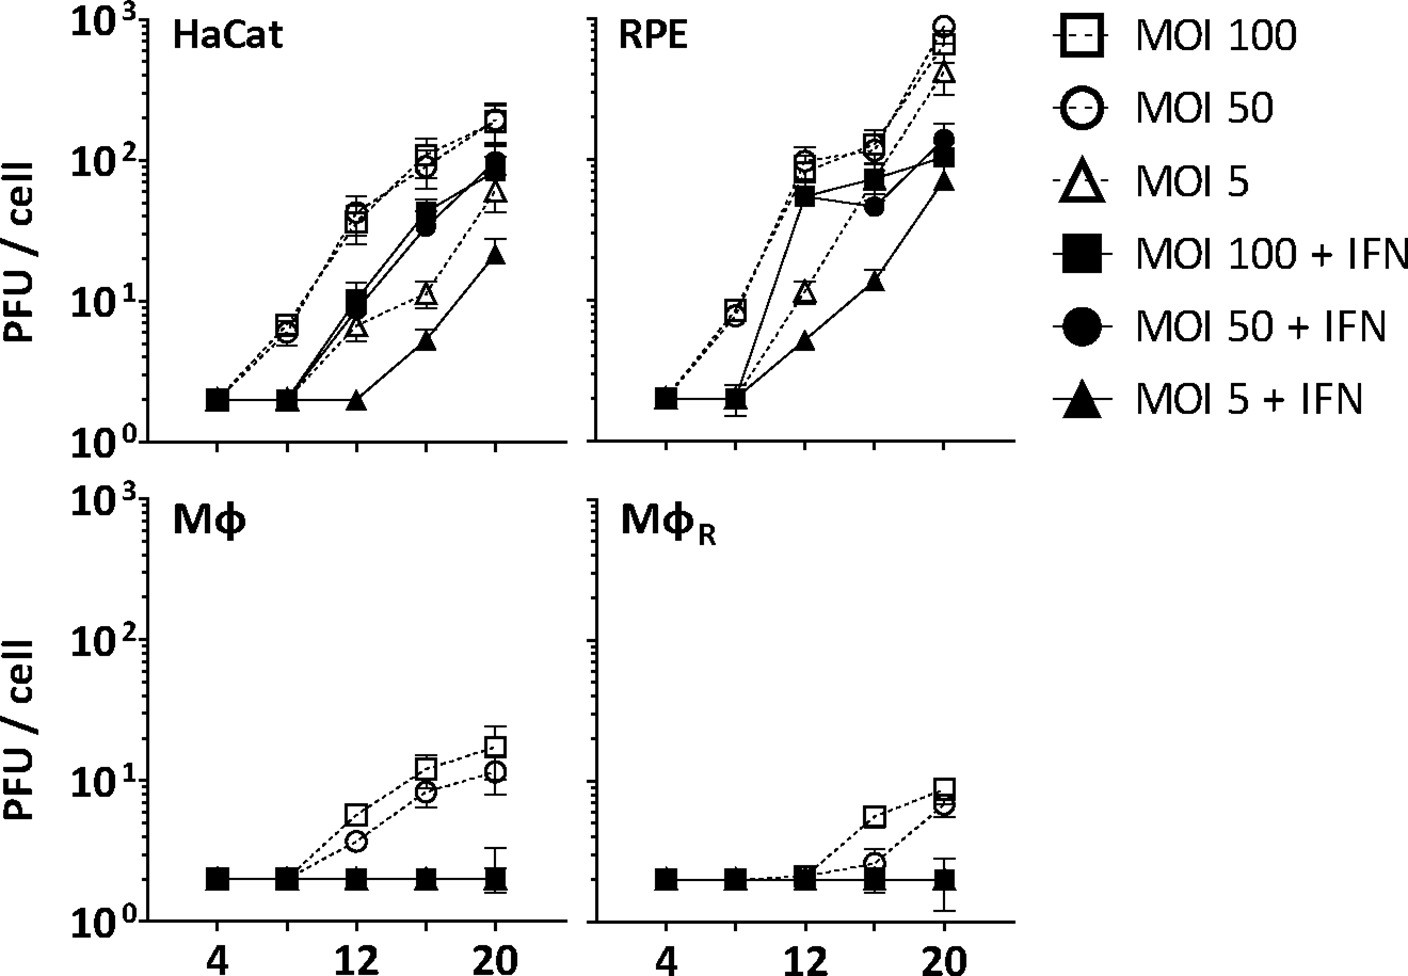
IFN restricts HSV-1 infection in keratinocytes, epithelial cells, and macrophages.
HaCat, RPE, Mφ, or MφR cells were mock-treated or treated with human IFN-α (1000 U/mL) for 16 hr and were infected with HSV-1(17+)Lox at 2.5 × 10⁶ (MOI 5), 2.5 × 10⁷ (MOI 50), or 5 × 10⁷ PFU/mL (MOI 100), and the amount of cell-associated and extracellular virions was titrated on Vero cells. Each data point represents the mean of the three technical replicates of the combined cell-associated and extracellular titers. The error bars represent the standard deviation.
Figure 2 with 4 supplements
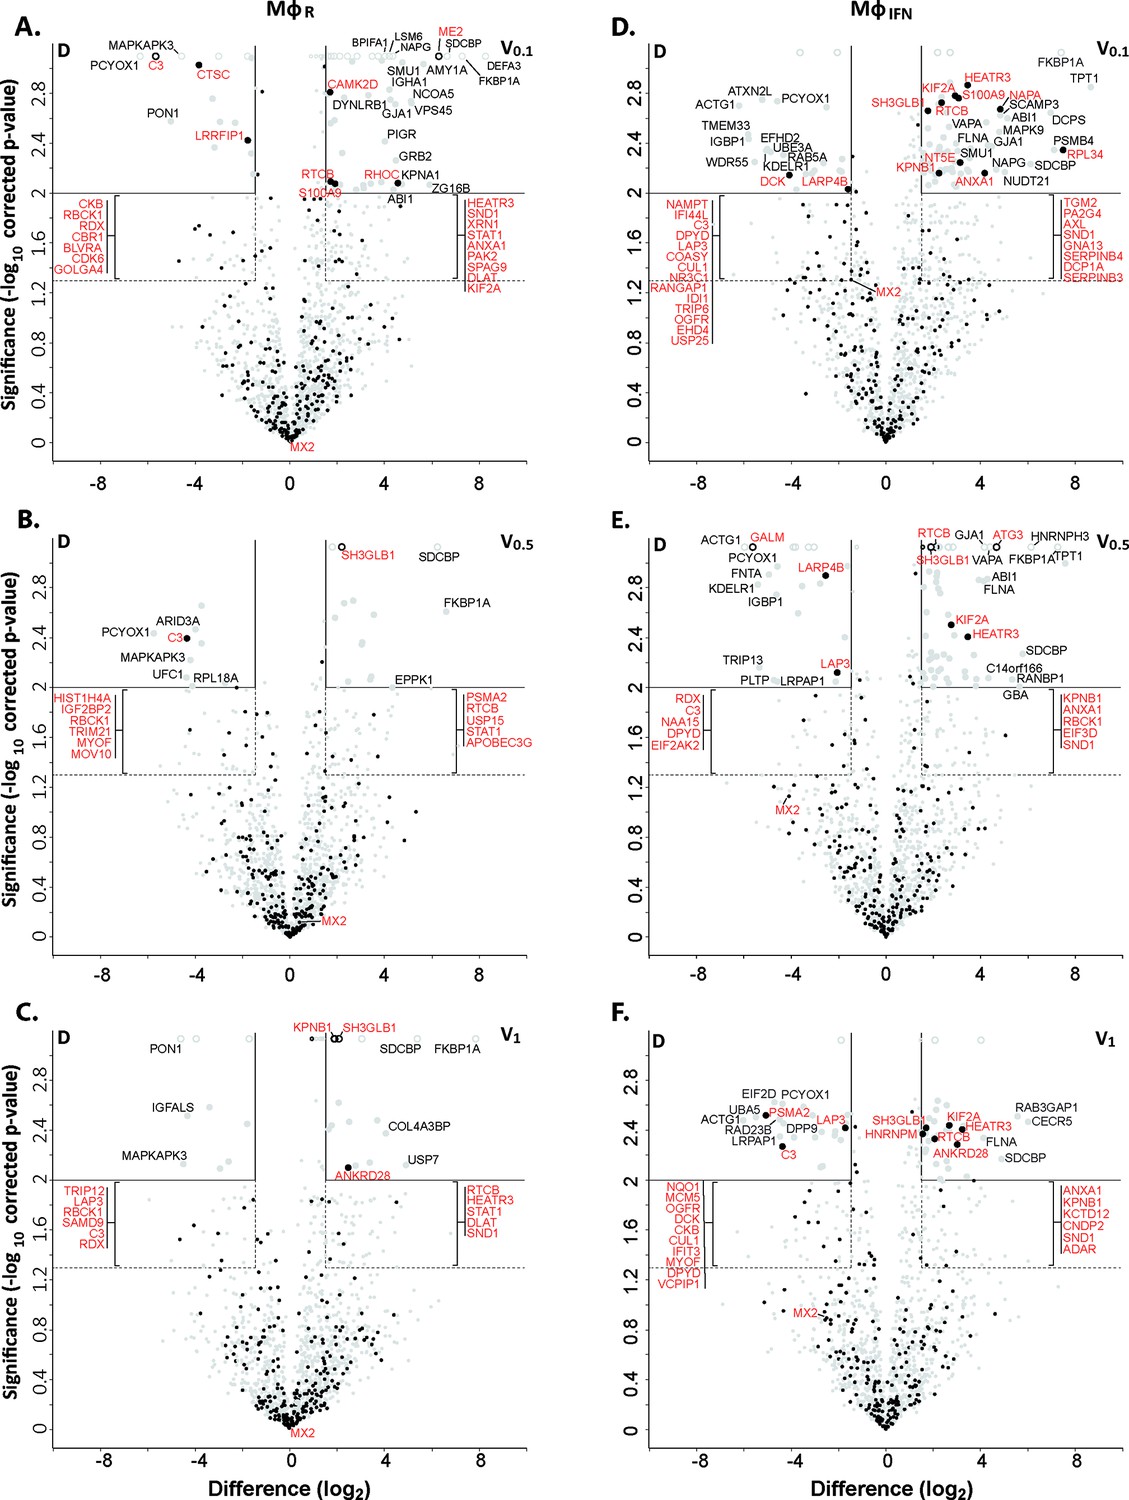
Cytosolic IFN-induced macrophage proteins binding to HSV-1 capsids.
Volcano plots of iBAQs counts of proteins identified in capsid-host protein complexes assembled in cytosol from resting THP-1 φ cells (A - C) or treated with interferon-α (D - F) using V0.1 (A, D), V0.5 (B, E), or V1 (C, F) capsids in comparison to D capsids. Proteins identified as highly specific interactions are indicated with larger symbols (log2 difference ≥1.5; Welch’s t-test, two-tailed, permutation-based FDR ≤ 0.01); those with a log2 difference ≥4 are annotated. ISGs (interferome.org) are indicated by filled black circles, and are annotated in red if significantly enriched (permutation-based FDR ≤ 0.05, and log2 difference ≥1.5). Proteins with a q-value = 0 were imputed to - log10 q-value = 3.1 (maximum of the graph), and were indicated with empty circles.
Figure 2—figure supplement 1
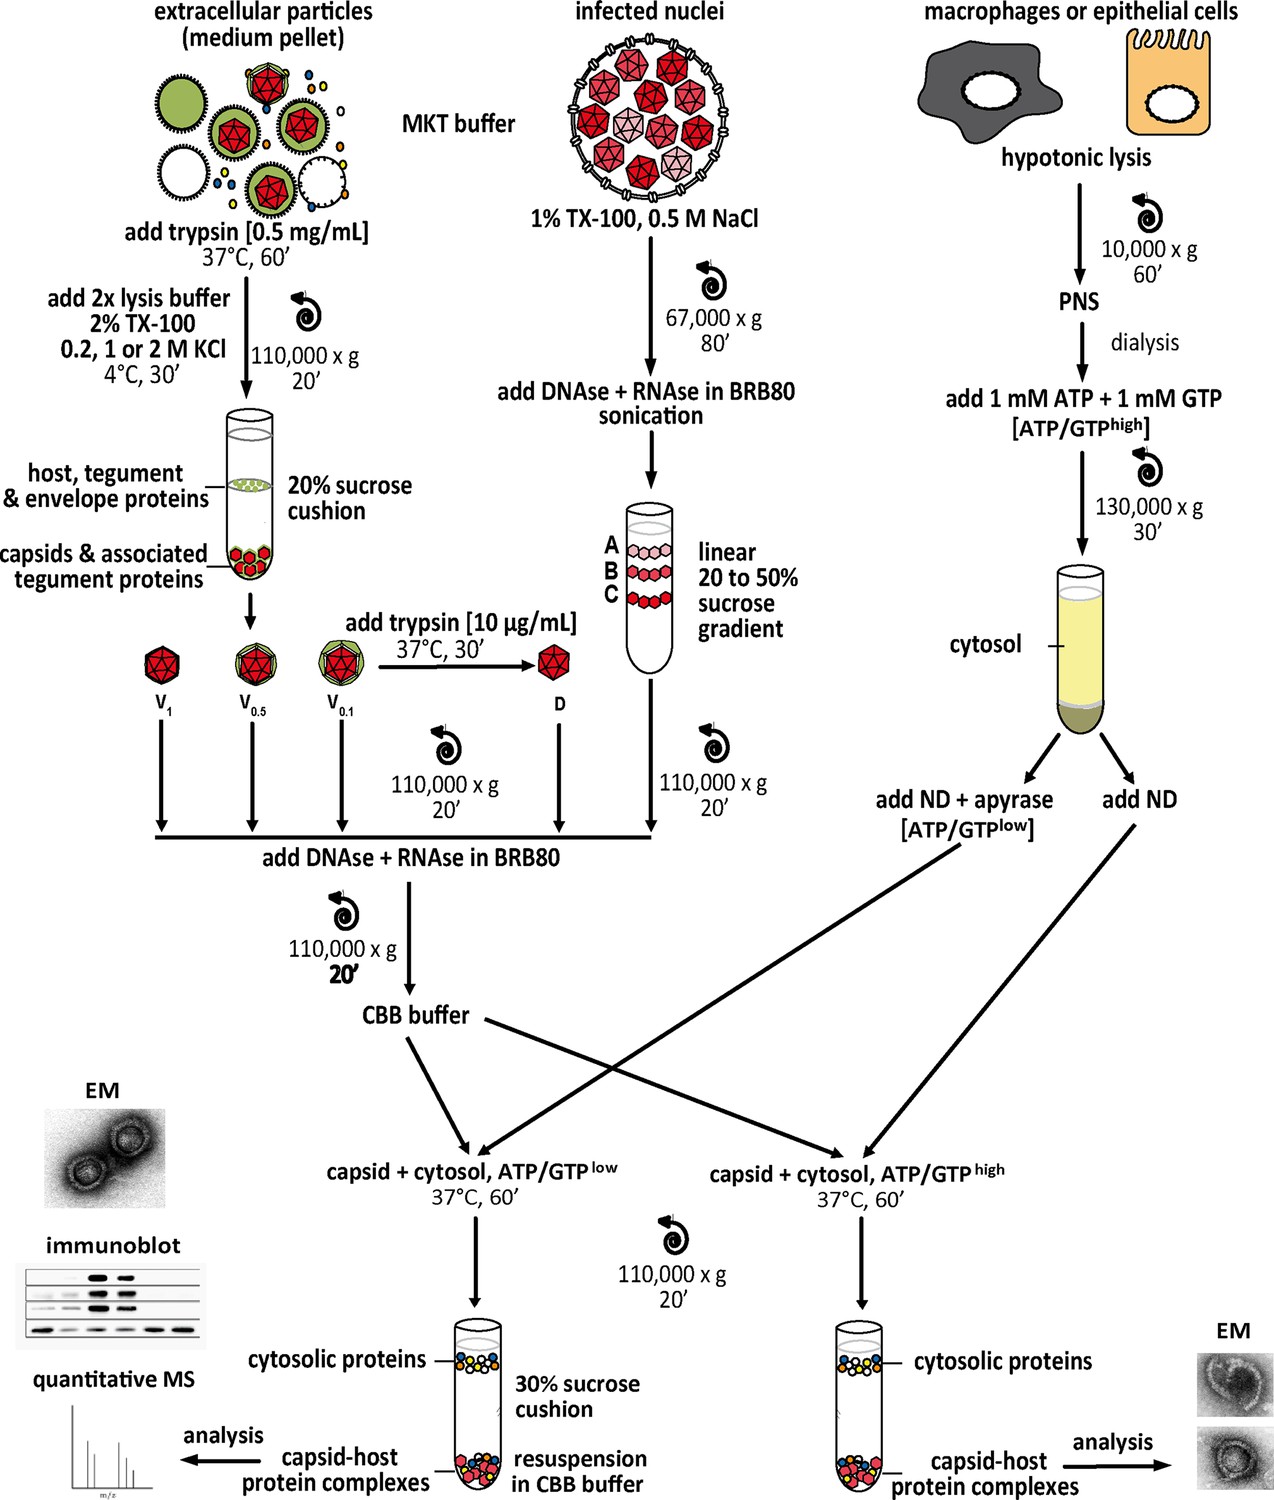
Experimental strategy to generate host protein-capsid complexes.
Tegumented viral V0.1, V0.5, or V1 capsids (red) were isolated from extracellular particles released from BHK-21 cells infected with HSV-1(17+)Lox. They were lysed in 1% Triton X-100 to solubilize the viral envelope, and to extract different amounts of tegument (green) in the presence of 0.1 M, 0.5 M, or 1 M KCl. D capsids were generated from V0.1 capsids by mild trypsin digestion. These different capsid types were purified through sucrose cushions. Tegument-free nuclear A, B, and C capsids were isolated from the nuclei of BHK cells infected with HSV-1(17+)Lox by gradient sedimentation. The capsids were resuspended in BRB80 buffer, treated with benzonase to degrade DNA and RNA, sedimented again, and incubated with cytosol fractions (yellow) from control or IFN-induced macrophages (THP-1 φ) or epithelial A549 cells. After sedimentation through sucrose cushions, the capsid-host protein complexes were analyzed by mass spectrometry (MS), immunoblot, or electron microscopy (EM). PNS, post-nuclear-supernatant; ND, nocodazole.
-
Figure 2—figure supplement 1—source data 1
Characterization of macrophage subcellular fractionation.
- https://cdn.elifesciences.org/articles/76804/elife-76804-fig2-figsupp1-data1-v2.zip
Figure 2—figure supplement 2
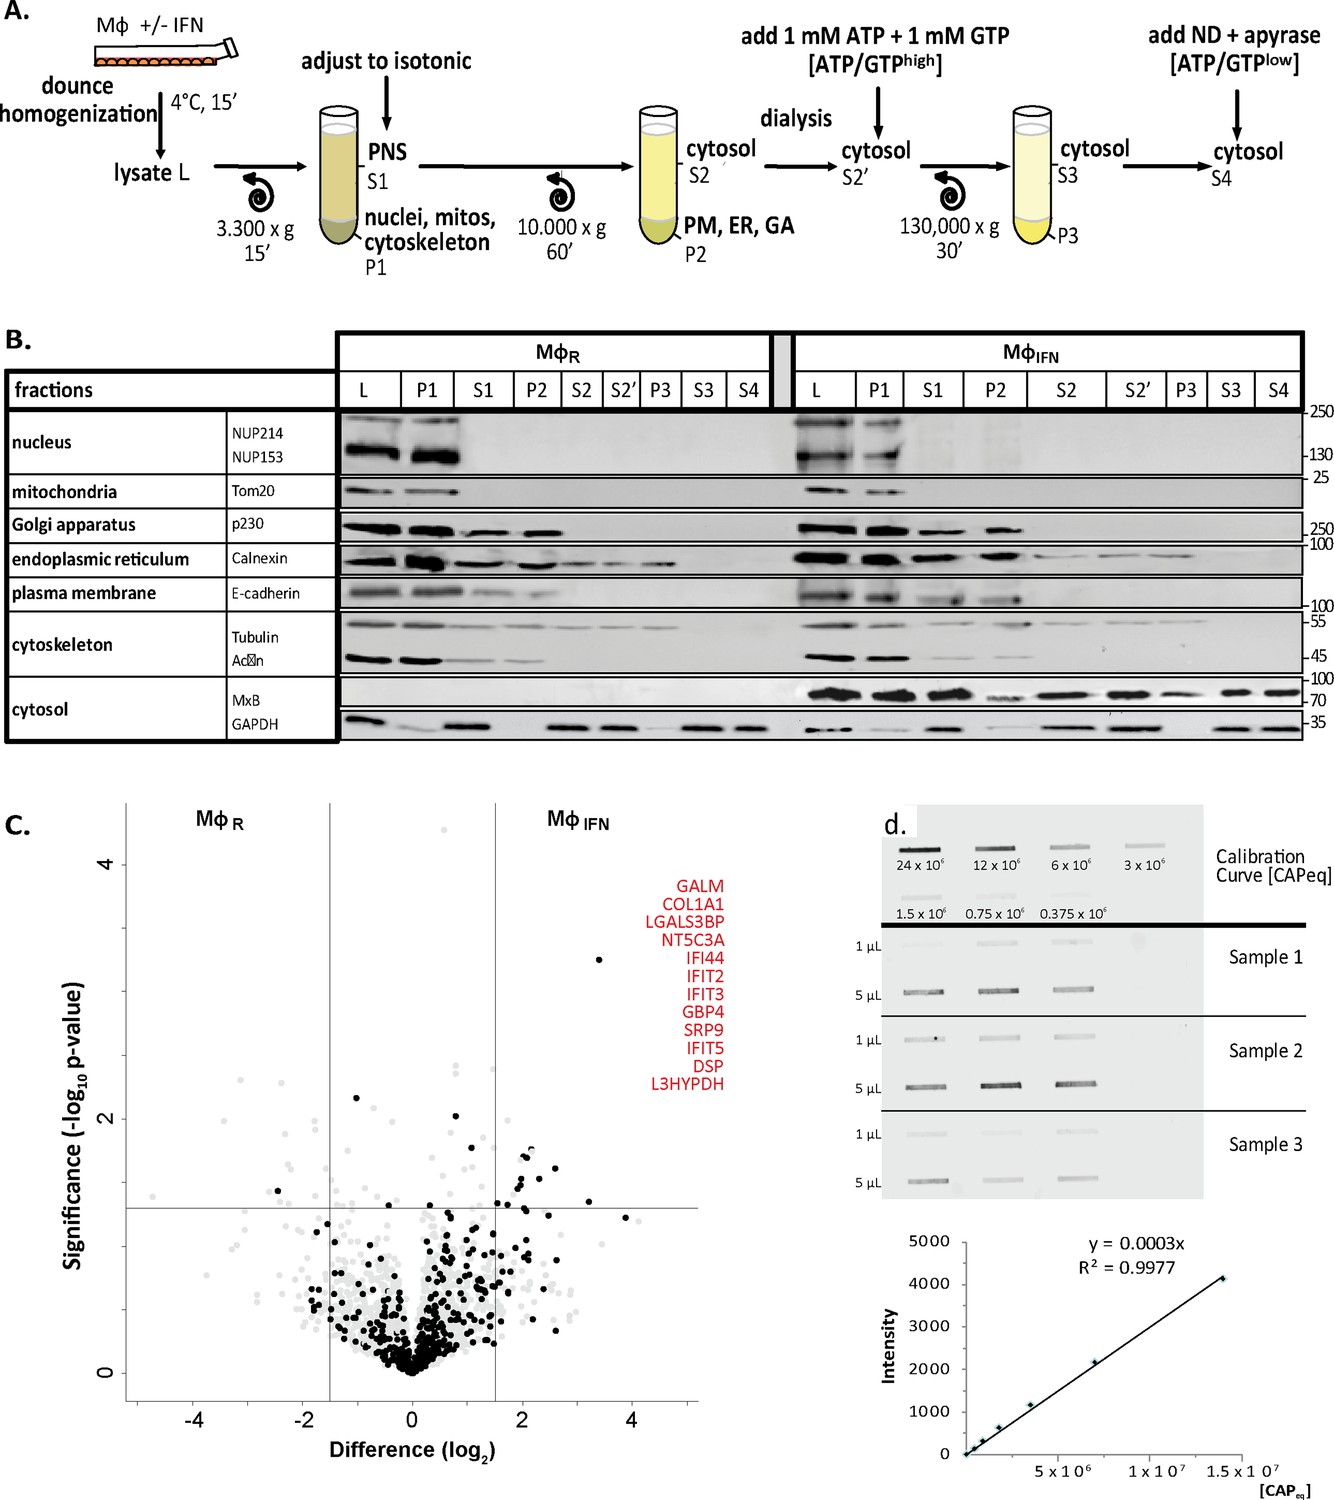
Characterization of cytosolic extracts and calibration of capsids.
(A) Cytosols were prepared from rested MφR or IFN-induced MφIFN macrophage cells. After swelling in hypotonic buffer, the cells were homogenized (L), and nuclei and mitochondria were sedimented (P1). The post-nuclear supernatant (S1) was adjusted to isotonic salt concentration, and centrifuged to sediment membrane compartments (P2), like the PM, ER and GA. To control the nucleotide concentration, the cytosols (S2) were dialyzed against a 7 kDa membrane prior to the addition of an ATP regeneration system (S2’). The remaining actin filaments and microtubules were sedimented in P3 to obtain a soluble cytosol fraction (S3). To reduce ATP and GTP levels, some cytosols were treated with 10 U/mL of apyrase (S4). Nocodazole (ND) was added to prevent polymerization and sedimentation of microtubules. (B) All fractions generated were analyzed by immunoblot for the respective compartment marker proteins as indicated. Nup, nucleoporins. MW, Molecular Weight (kDa). (C) Volcano plot summarizing the effect of IFN induction on the cytosol proteome. ISGs associated with the interferomeDB were enriched in cytosol from MφIFN as compared to MφR with an FDR of 7.96 × 10⁻⁷ and an FC ≥2 in at least 1 experiment (Fisher’s exact test). IFN-inducible proteins are indicated by black circles, and those with an abundance log2 difference ≥1.5 (vertical lines), and an uncorrected p-value < 0.05 (horizontal line) are labeled in red. (D) The slot blot used for the estimation of capsid concentrations (capsids equivalent; CAPeq) of all preparations was labeled with anti-capsid antibodies (rabbit pAb SY4563) and adjusted to a calibration curve of a standard preparation.
Figure 2—figure supplement 3
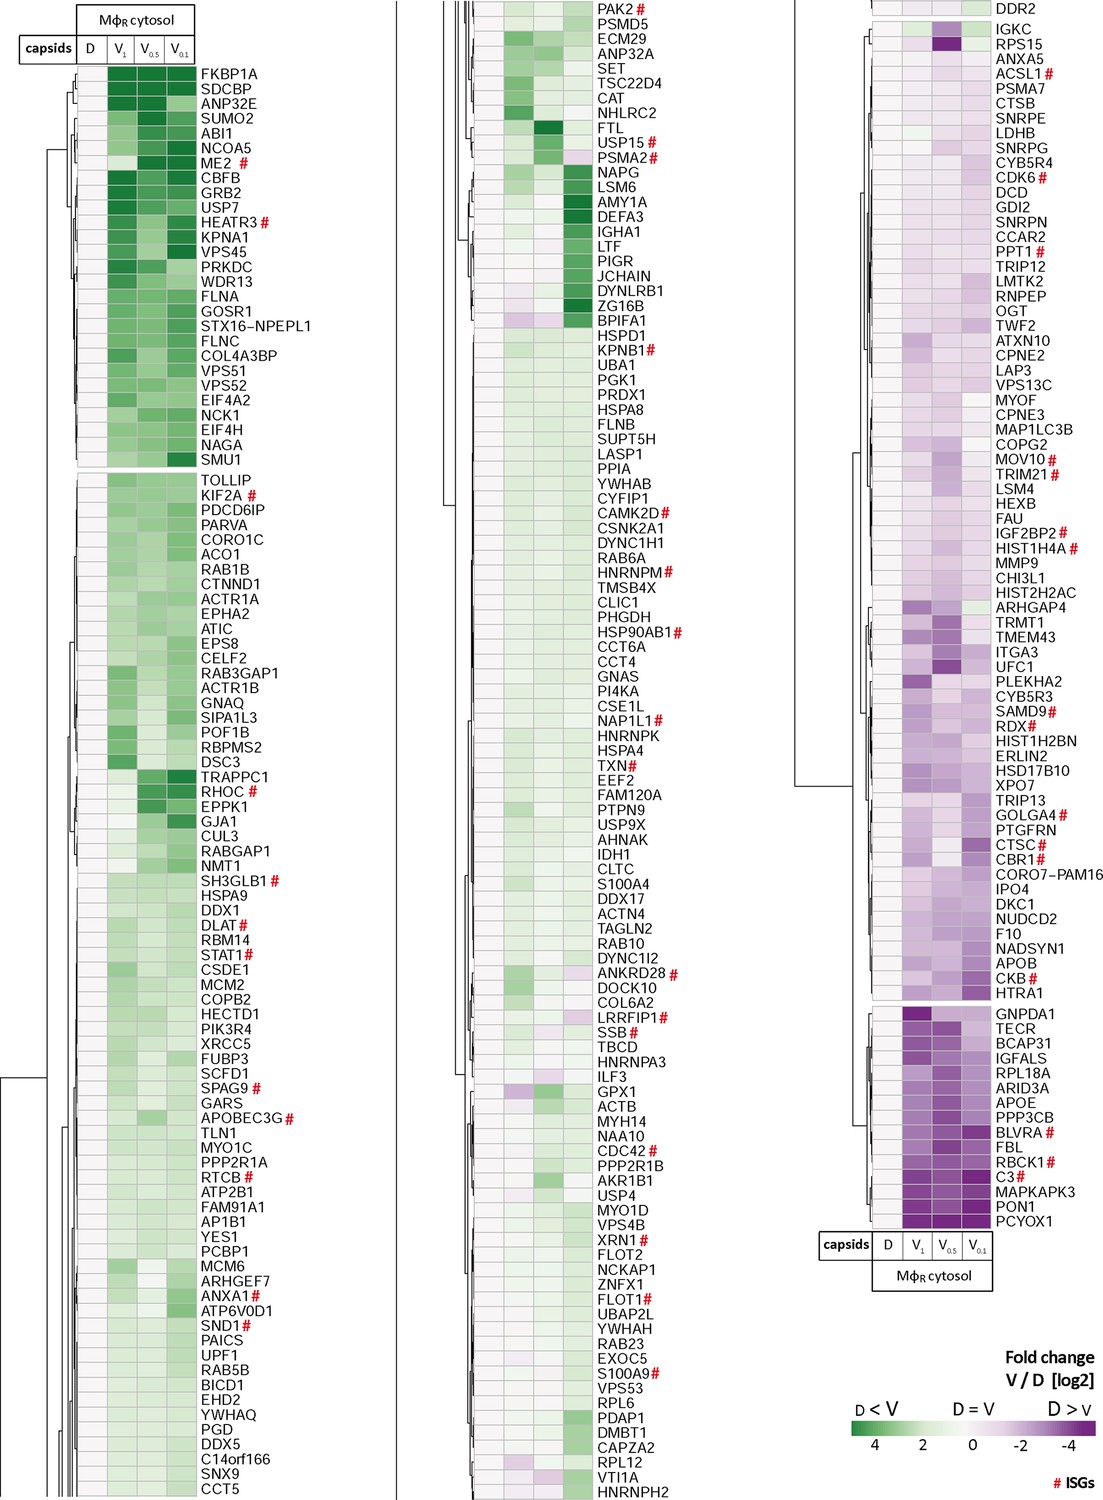
HSV-1 capsids interactomes.
Unbiased hierarchical clustered heat map showing the log2 fold changes of host proteins identified from capsids-host protein sediments (c.f. Figure 2; abundance log2 difference larger than 1; significance permutation-based FDR smaller than 0.05) from (A) cytosol of resting Mφ, or (B) IFN-induced MφIFN macrophages. For each protein, the fold change was calculated based on their abundance (iBAQs) in V1, V0.5, or V0.1 capsids compared to D capsids using a linear scale from violet being the lowest to dark green being the highest.
Figure 2—figure supplement 4
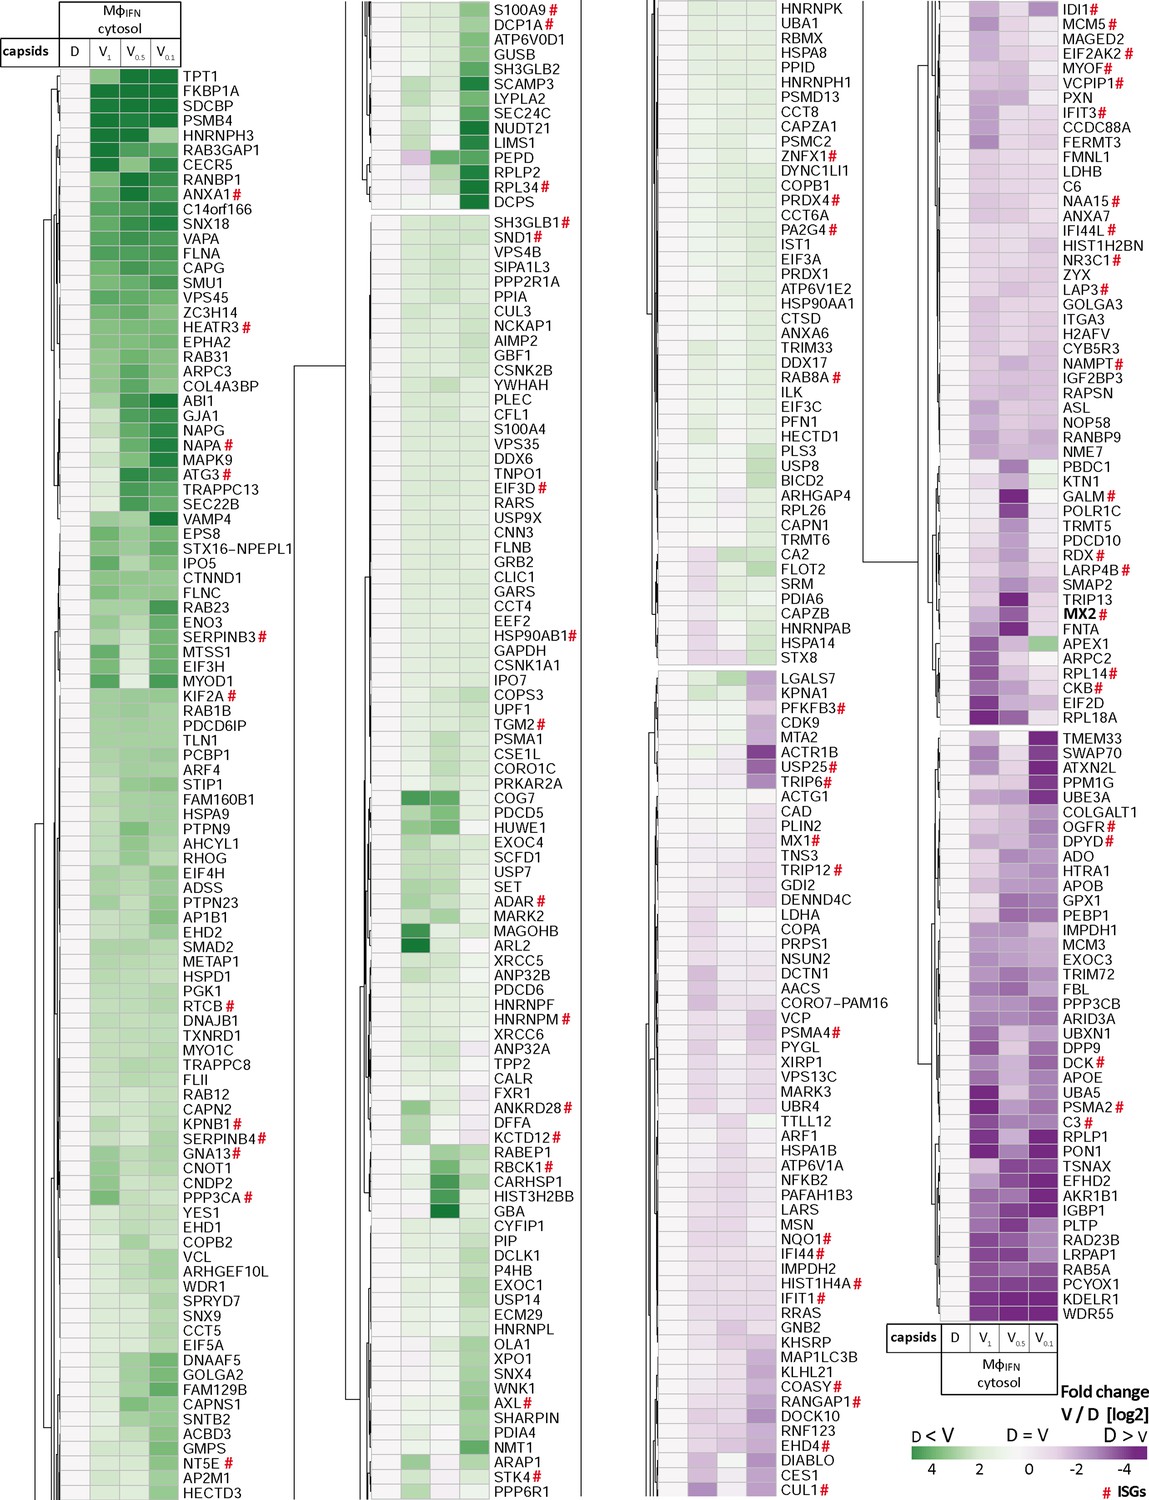
HSV-1 capsids interactomes.
Unbiased hierarchical clustered heat map showing the log2 fold changes of host proteins identified from capsids-host protein sediments (c.f. Figure 2; abundance log2 difference larger than 1; significance permutation-based FDR smaller than 0.05) from (A) cytosol of resting macrophages (Mφ), or (B) IFN-induced macrophages (MφIFN). For each protein, the fold change was calculated based on their abundance (iBAQs) in V1, V0.5, or V0.1 capsids compared to D capsids using a linear scale from violet being the lowest to dark green being the highest.
Figure 3 with 1 supplement
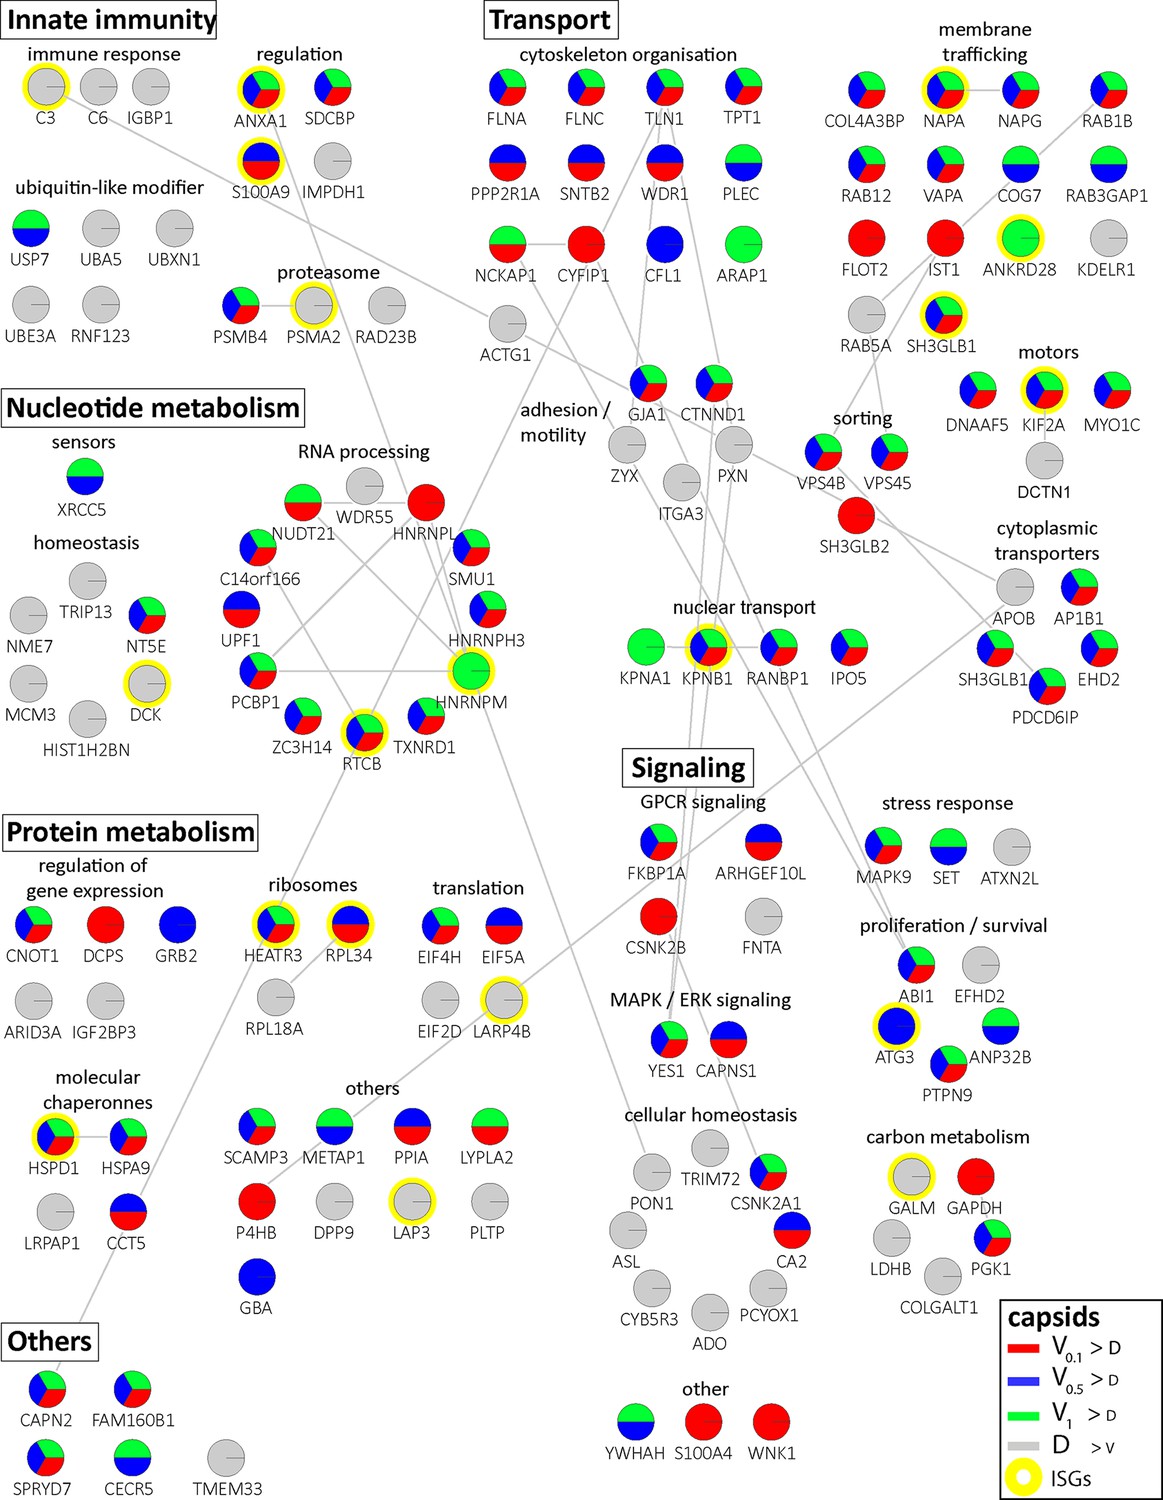
Cytosolic proteins of IFN-induced macrophages binding to HSV-1 capsids.
Host proteins from cytosol of IFN-stimulated MφIFN (c.f. D, E, F; abundance log2 difference larger than 1.5; significance permutation-based FDR smaller than 0.01) interacting with V0.1, V0.5, V1, or D capsids were assembled into a functional interaction network of known protein-protein-interactions (gray lines; STRING database, confidence score of 0.7), and grouped according to their known functions (Gene Ontology, Pathway analysis). The Pie chart for each protein indicates its relative enrichment on V0.1 (red), V0.5 (blue), V1 (green), or D capsids (gray).
Figure 3—figure supplement 1
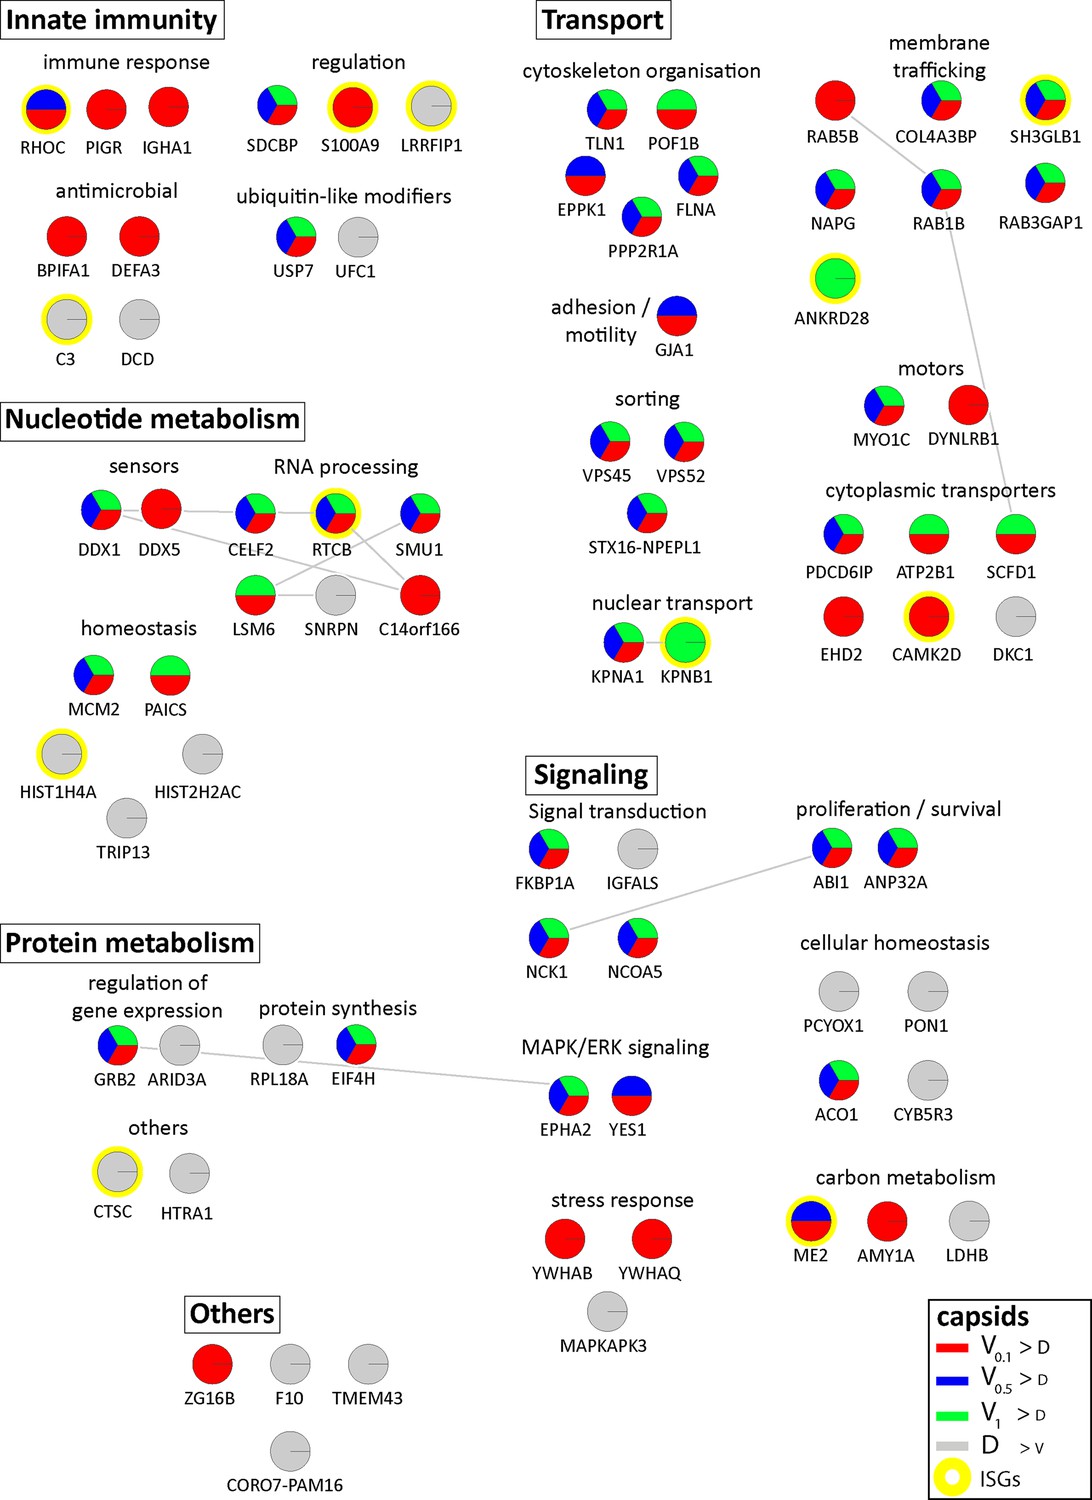
Cytosolic proteins of resting macrophage binding to HSV-1 capsids.
Host proteins from cytosol of resting Mφ (c.f. Figure 3A, B and C; abundance log2 difference larger than 1.5; significance permutation-based FDR smaller than 0.01) interacting with V0.1, V0.5, V1, or D capsids were assembled into a functional interaction network of known protein-protein-interactions (grey lines; STRING database, confidence score of 0.7), and grouped according to their known functions (Gene Ontology, Pathway analysis). The Pie chart for each protein indicates its relative enrichment on V0.1 (red), V0.5 (blue), V1 (green), or D capsids (grey).
Figure 4 with 1 supplement
HSV-1 capsids associate with proteins involved in type I IFN response.
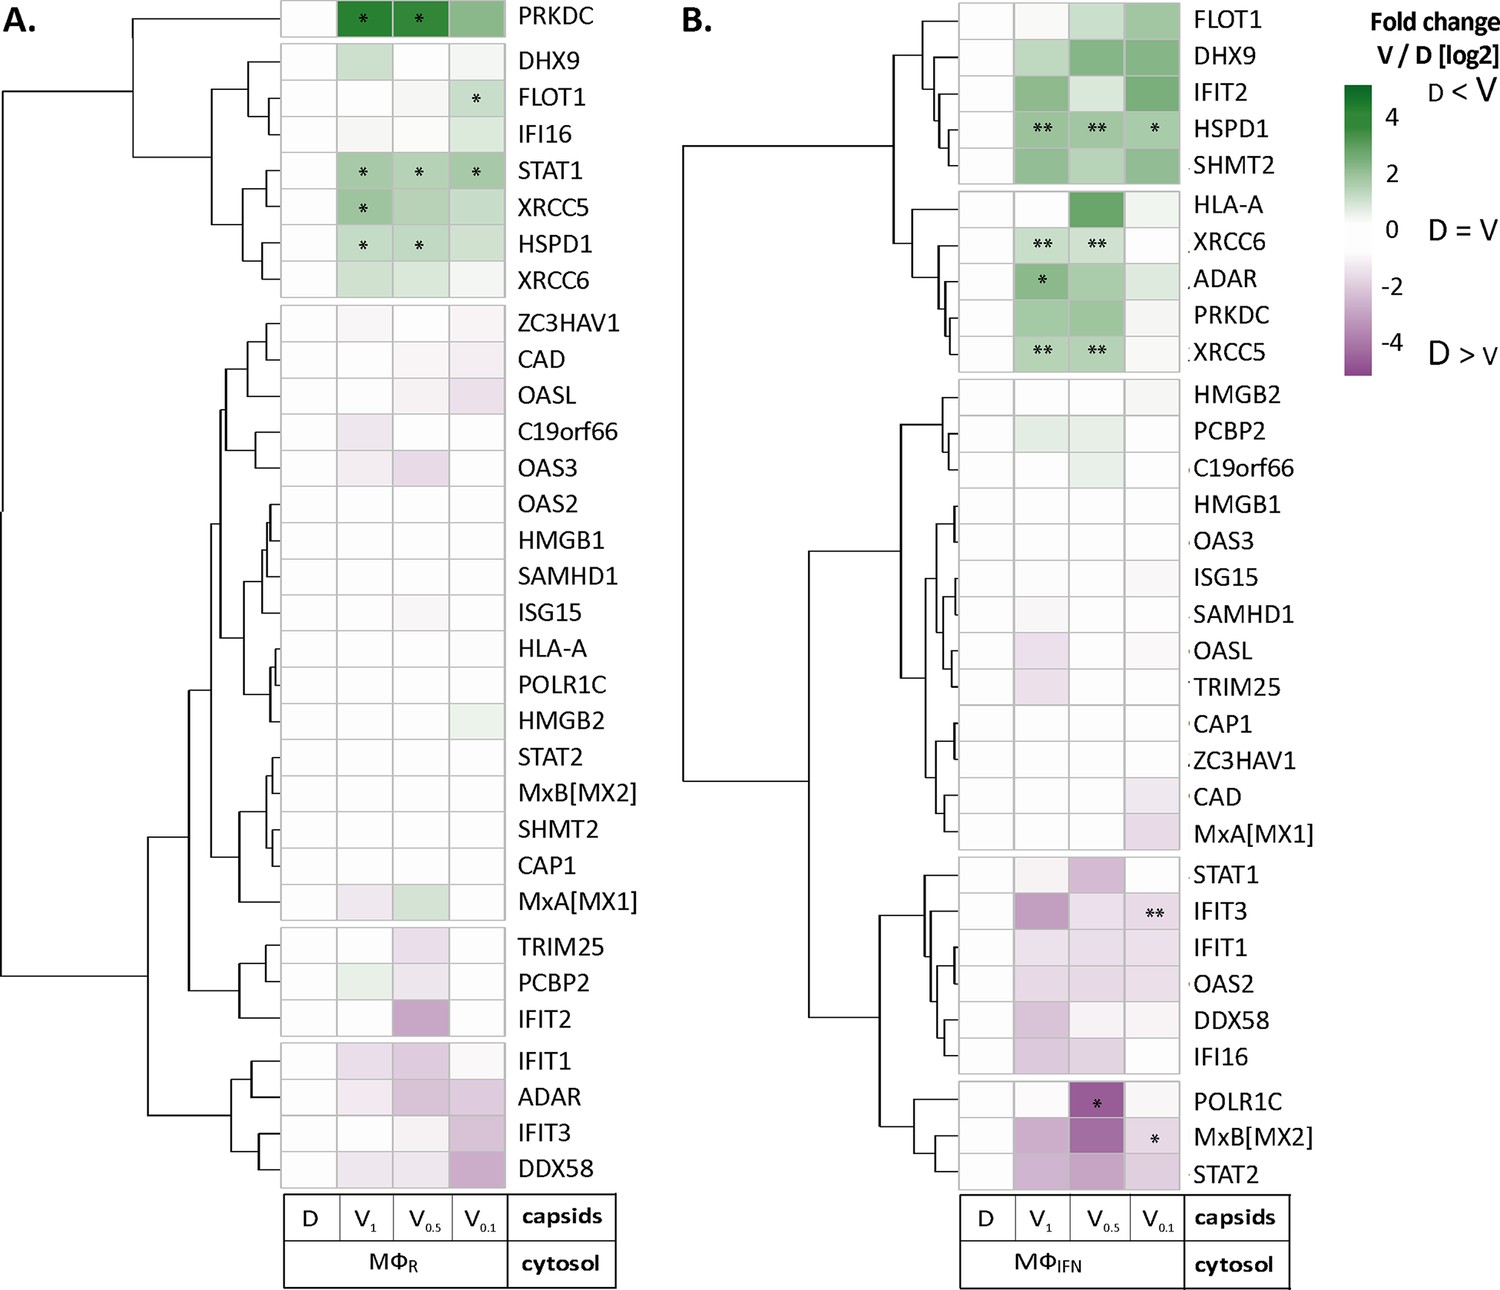
Unbiased hierarchical clustered heat map showing the log2 fold changes of IFN-induced proteins (GO type-I IFN) identified from capsids-host protein sediments from cytosol of resting Mφ, or IFN-induced MφIFN macrophages. For each protein, the fold change was calculated based on their abundance (iBAQs) in V1, V0.5, and V0.1 capsids as compared to their abundance in D capsids, using a linear scale from violet being the lowest to dark green being the highest. (*) and (**) design the proteins with an FDR corrected p-value ≤ 0.05 and ≤ 0.01, respectively.
Figure 4—figure supplement 1
HSV-1 capsids binds to a few ISG proteins.
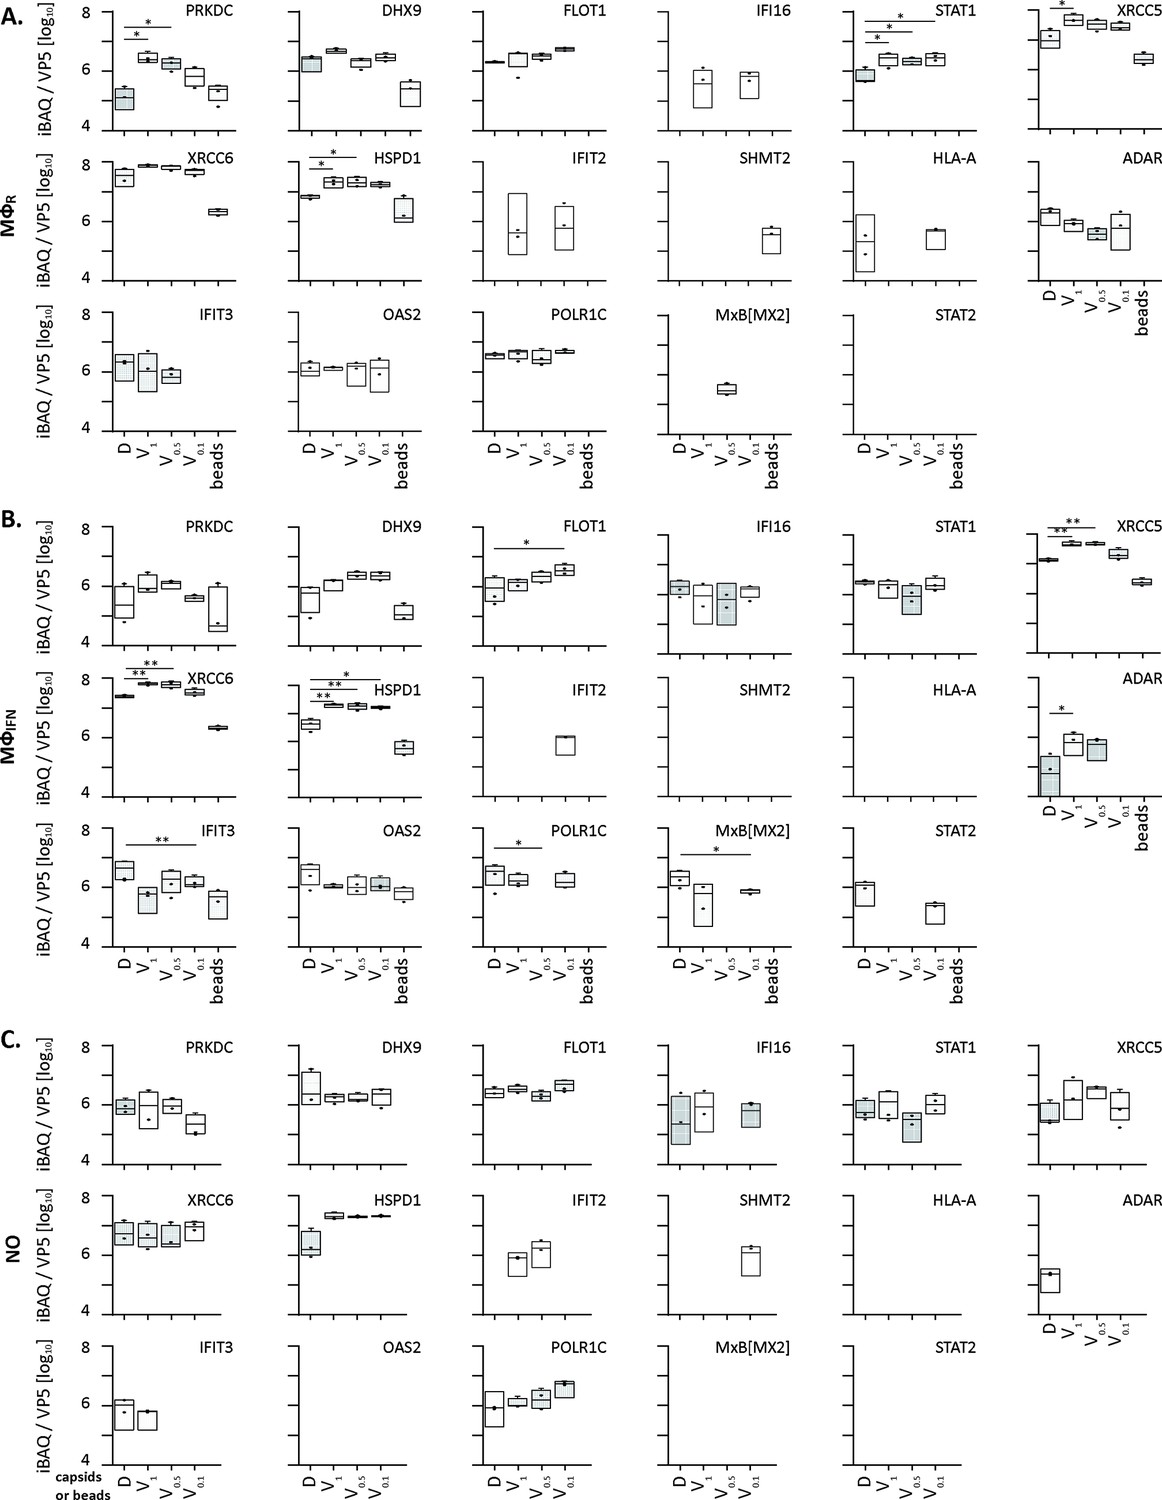
Box and whisker plot of iBAQs showing the differential detection of PRKDC, DHX9, FLOT1, IFI16, STAT1, XRCC5, XRCC6, HSPD1, IFIT2, SHMT2, HLA-A, ADAR, IFIT3, OAS2, POLR1C and MxB[MX2] in D, V1, V0.5, and V0.1 capsids-host protein sediments after incubation in (A) cytosol of resting MφR macrophages, (B) IFN-induced MφIFN macrophages or (C) no cytosol. (*) design the significant binding to D or V0.1, V0.5, and V1 capsids as assessed by Welch’s t-test (two-tailed, permutation-based FDR ≤ 0.05) comparing D vs V0.1, V0.5, or V1 capsids in each cytosol separately.
Figure 5
Tegumentation reduces MxB binding to HSV-1 capsids.
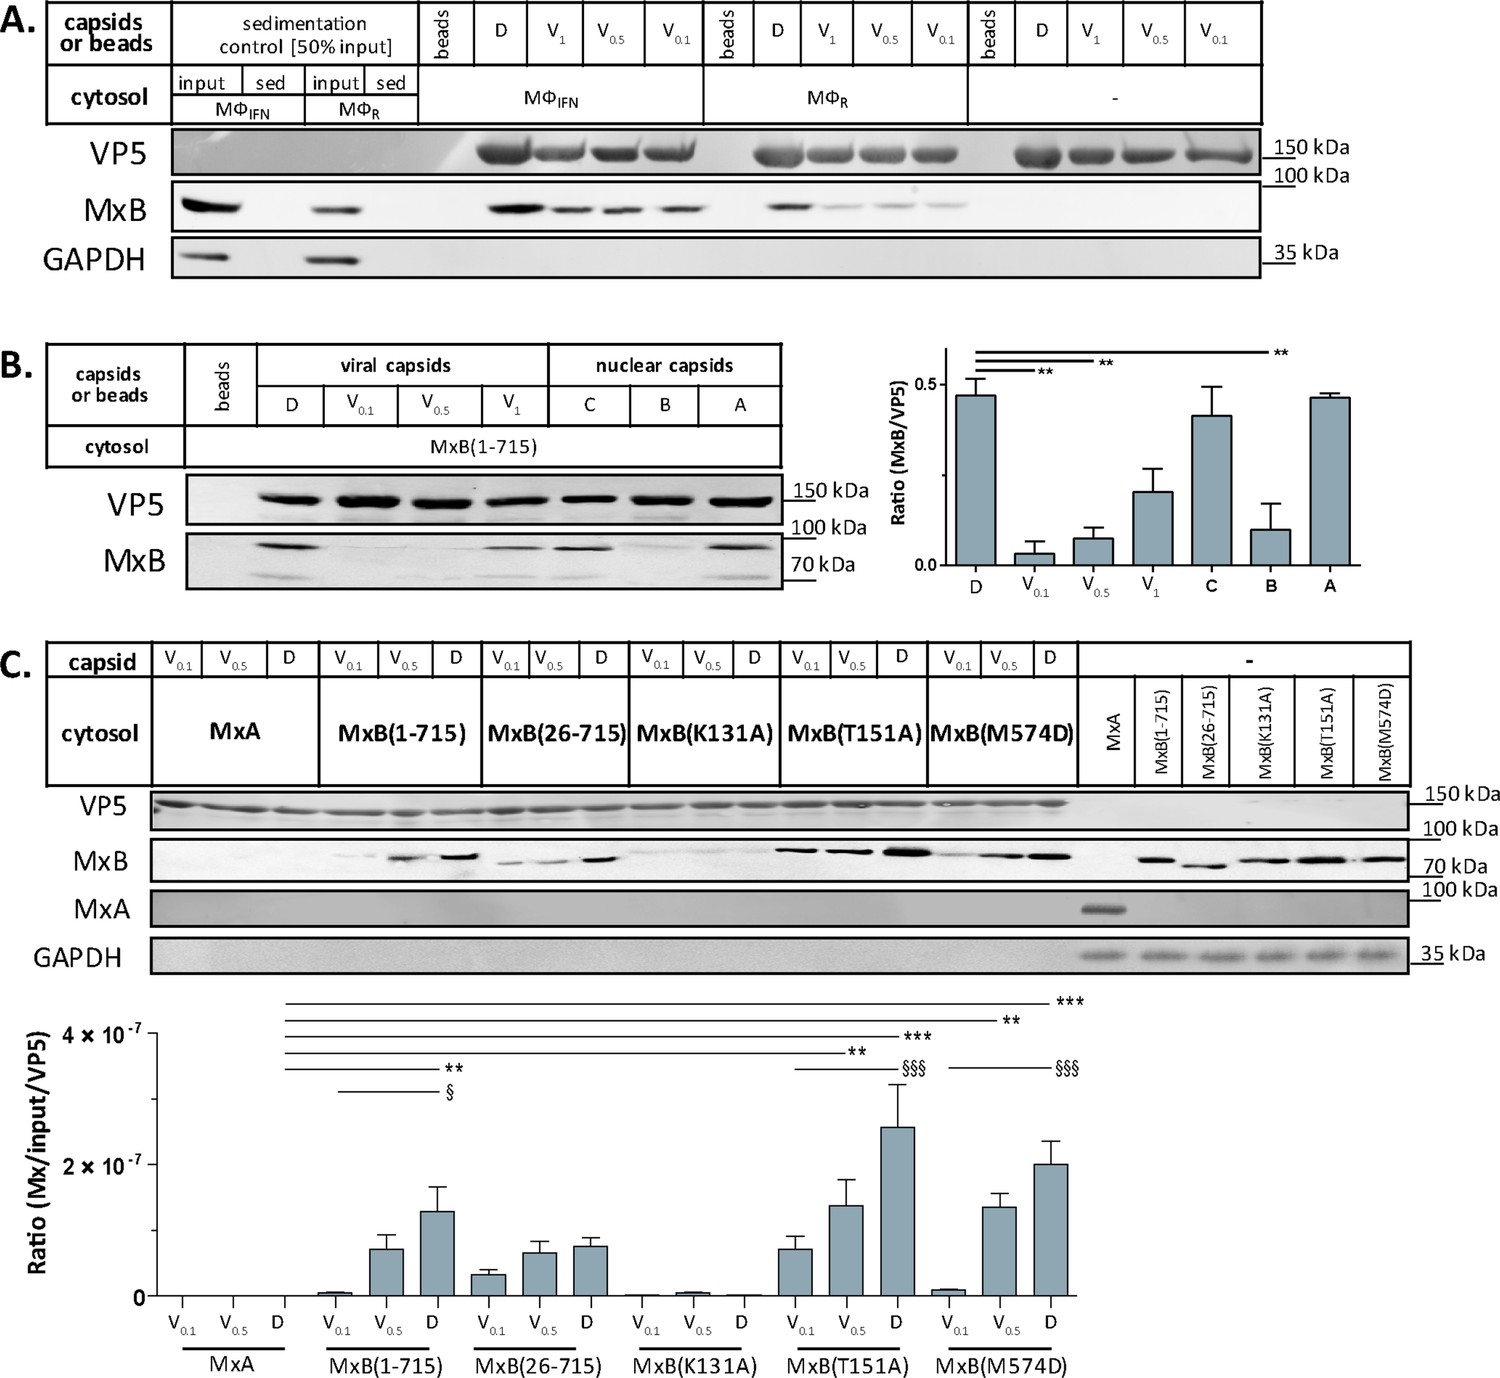
The binding of MxB to viral V0.1, V0.5, V1, or D, or to nuclear A, B, or C capsids was analyzed after incubation in 0.2 mg/mL cytosol prepared from (A; Figure 5—source data 1) THP-1 φ stimulated or not with IFN, or (B-C; Figure 5—source data 1; Figure 5—source data 1) A549 cells stably expressing MxA, MxB(1-715) full length, the short MxB(26-715), or MxB mutants defective in GTP-hydrolysis MxB(T151A), GTP-binding and hydrolysis MxB(K131A), or dimerization MxB(M574D). Sedimented capsid-host protein complexes were then analyzed by immunoblot for VP5 (capsid), MxB, MxA, and GAPDH as a loading control. As control cytosols were sedimented without capsids (A: sed), or with uncoated agarose beads (A, B: beads). The amounts of MxA/MxB found in the capsid-host protein complexes were quantified, and normalized to their respective VP5 levels. Error bars: SEM. summarized from three experiments. One asterisk denotes p < 0.05, two asterisks indicate p < 0.01 and three asterisks represent p < 0.001 as determined by Welch’s t-tests comparisons.
-
Figure 5—source data 1
Cytosolic MxB from THP-1 cells co-sediments with capsids in Figure 5A.
- https://cdn.elifesciences.org/articles/76804/elife-76804-fig5-data1-v2.zip
Figure 6 with 1 supplement
MxB induces disassembly of herpesviral capsids.
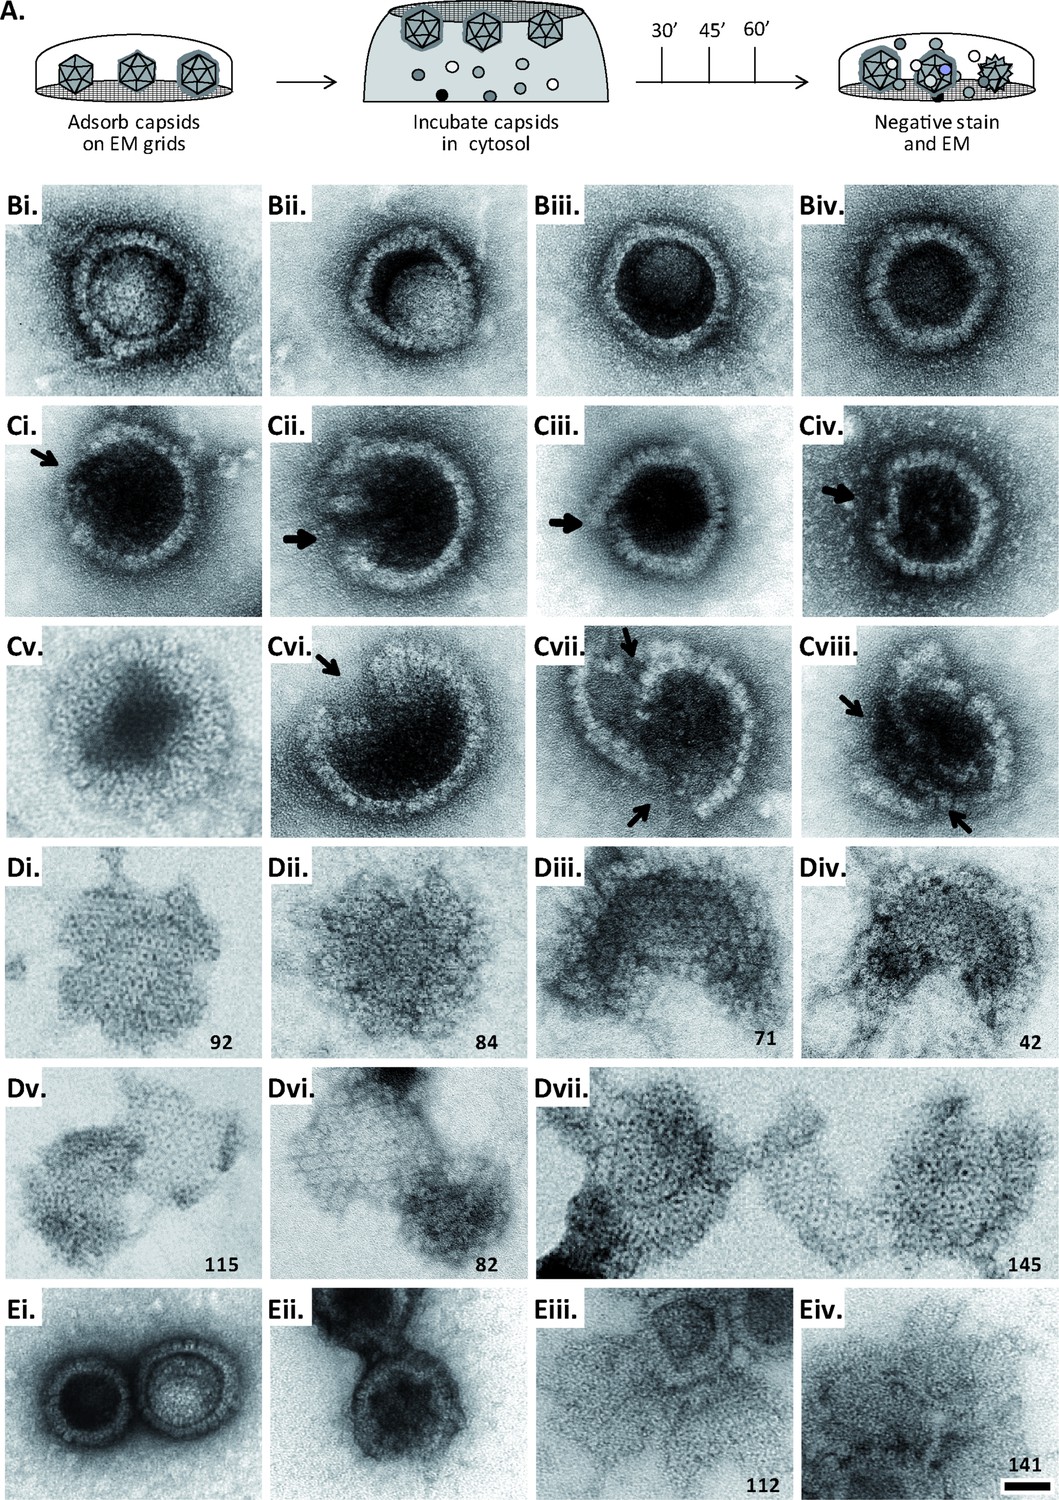
(A) Experimental design: Capsids were adsorbed onto hydrophilic enhanced carbon-coated EM grids for 20 min at RT. The capsids were incubated in cytosol with ATP/GTPhigh, and the incubation was stopped at different times by extensive washing. The samples were analyzed by EM after negative staining with uranyl acetate. (B–D) Capsids after incubation in cytosol derived from rested Mφ or IFN-induced MφIFN macrophages, or control or MxB(1-715) A549 expressing cells for 1 hr at 37 °C, and classified as (B) intact, (C) punched or (D) disassembled flat phenotypes. The number of capsomers per flat particle was counted, and is displayed at the bottom of each figures. (E) Nuclear VZV capsids remain intact (Ei) after incubation in the cytosol of A549 control cells, or but appear punched (Eii) or as flat shells (Eiii, Eiv) after incubation in the cytosol of A549 cells expressing MxB. Scale bar: 50 nm.
Figure 6—figure supplement 1
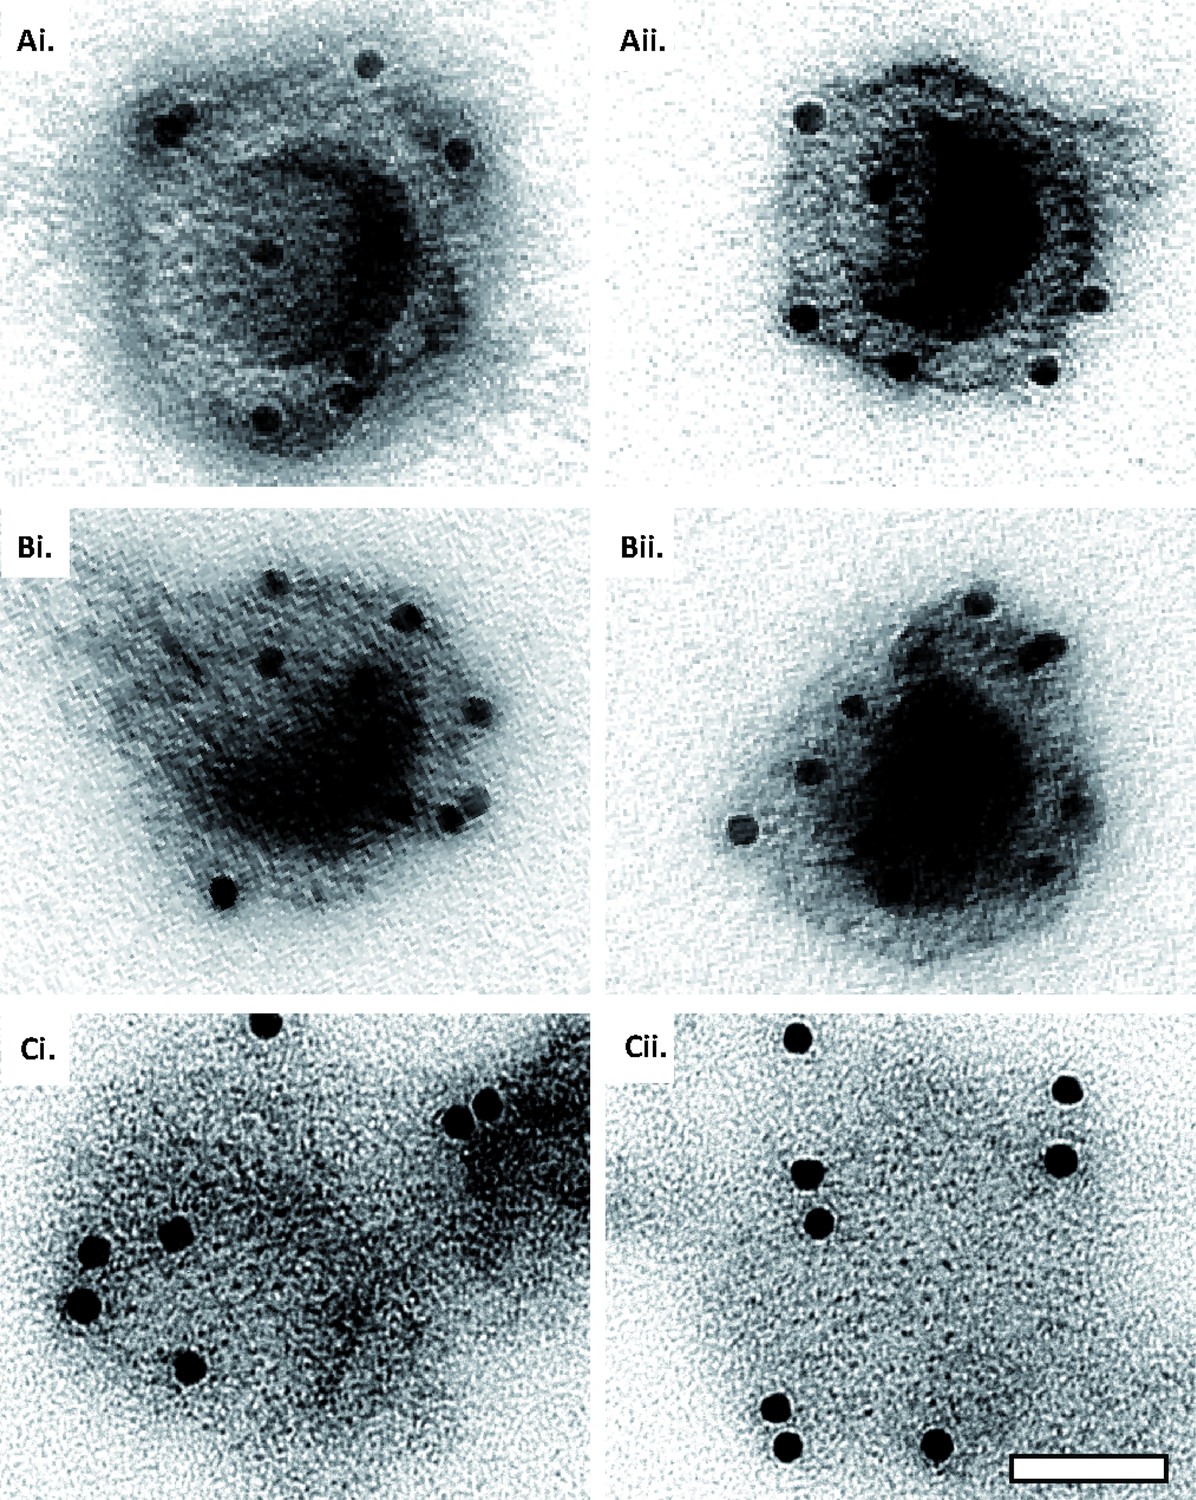
Capsid disassembly intermediates by anti-capsid immunoEM.
Images of capsids after negative staining and labeling with antibodies raised against the major capsid protein VP5 (NC-1), after incubation in ATP-complemented cytosol from A549 control or MxB(1-715) expressing cells for 60 min at 37 °C, and classified as (A) intact, (B) punched, or (C) flattened shells. Scale bar: 50 nm.
Figure 7 with 1 supplement

MxB GTP hydrolysis and dimerization required for capsid disassembly and vDNA release of viral genomes.
HSV-1 (A–H), HSV-2 (G) or VZV capsids (G) were incubated with cytosol at ATP/GTPhigh for 1 hr or the indicated time (E,F) at 37 °C, and classified into intact, punched and flat capsids by electron microscopy (A–G), or the amount of released viral DNA was measured by qPCR (H). (A) Quantification of punched and flat D capsid shells in cytosol prepared from rested Mφ or IFN-induced MφIFN macrophages, or from control A549 (mock) or A549-MxB(1-715) cells. (B) Increasing amounts of MxB(1-715) [%] were added to control A549 cytosol, and the amounts of punched and flat capsids were quantified after incubation in these mixtures. (C) Cytosols of A549 cells expressing MxB(1-715) and Mx(25-715) or MxB(1-715)-FLAG and MxB(26-715)-FLAG were incubated with anti-FLAG antibodies coupled to magnetic beads, the flow-through fractions (FT) were harvested, capsids were treated with anti-FLAG treated or control cytosols, and the amount of punched and flat capsids were quantified. (D) Capsids were incubated in cytosols prepared from A549 cells expressing full-length (FL) MxB(1-715), MxB(26-715), MxB(K131A), MxB(T151A), or MxB(M574D) at ATP/GTPlow or ATP/GTPhigh levels. (E) Time-course of MxB-induced disassembly of capsids pre-adsorbed onto EM grids, incubated with cytosol from A549-MxB(1-715). (F) Analysis of D, V0.5, or V0.1 capsids treated with MxB(1-175) cytosol for broken (punched +flat) capsids after negative stain and EM as described for panel E. (G) Quantification of MxB cytosol disassembly of D capsids of HSV-1(17+)Lox, HSV-1(KOS), or HSV-2(333), or nuclear C capsids of VZV, after incubation in cytosol from A549-MxB(1-715) cells. (H) D capsids were incubated with different cytosols for 1 hr at 37 °C or treated with 1% SDS and 10% Tx-100 only, and the released DNA not protected by capsid shells was quantified by qPCR. Error bars: SEM from 100 capsids in three biological replicates. One symbol of *or § denotes p < 0.05, two p < 0.01, and three p < 0.001 as determined in One-way analysis of variance with a Bonferroni post-test, and comparing the relative amounts of (*) punched and (§) flat capsids, or indicating the differences with the mock-treated samples (*).
Figure 7—figure supplement 1
Cytosol immunodepleted for MxB.
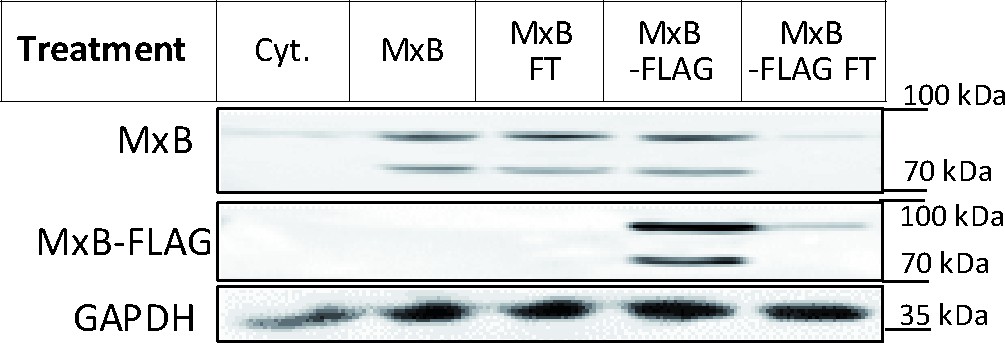
Cytosols prepared from A549-MxB(1-715) and MxB(26-715) expressing MxB(1-715) and MxB(26-715), or A549-MxB-FLAG cells expressing MxB(1-715)-FLAG and MxB(26-715)-FLAG, respectively, were incubated with agarose beads coupled to anti-FLAG antibodies. After immunodepletion with anti-FLAG beads to deplete MxB(1-715)-FLAG and MxB(26-715)-FLAG, the flow through (FT) was harvested. To determine to what extend the FLAG-tagged MxB proteins had been depleted, the starting cytosols (MxB, Mxb-FLAG) as well as the respective FT fractions were probed by immunoblot using antibodies directed against MxB, FLAG, or GAPDH as a loading control. Figure 7—figure supplement 1—source data 1.
-
Figure 7—figure supplement 1—source data 1
Western blot of MxB immunodepletion.
- https://cdn.elifesciences.org/articles/76804/elife-76804-fig7-figsupp1-data1-v2.zip
Figure 8 with 1 supplement
Structural and tegument characterization of V0.1, V0.5, V1, and D capsids.
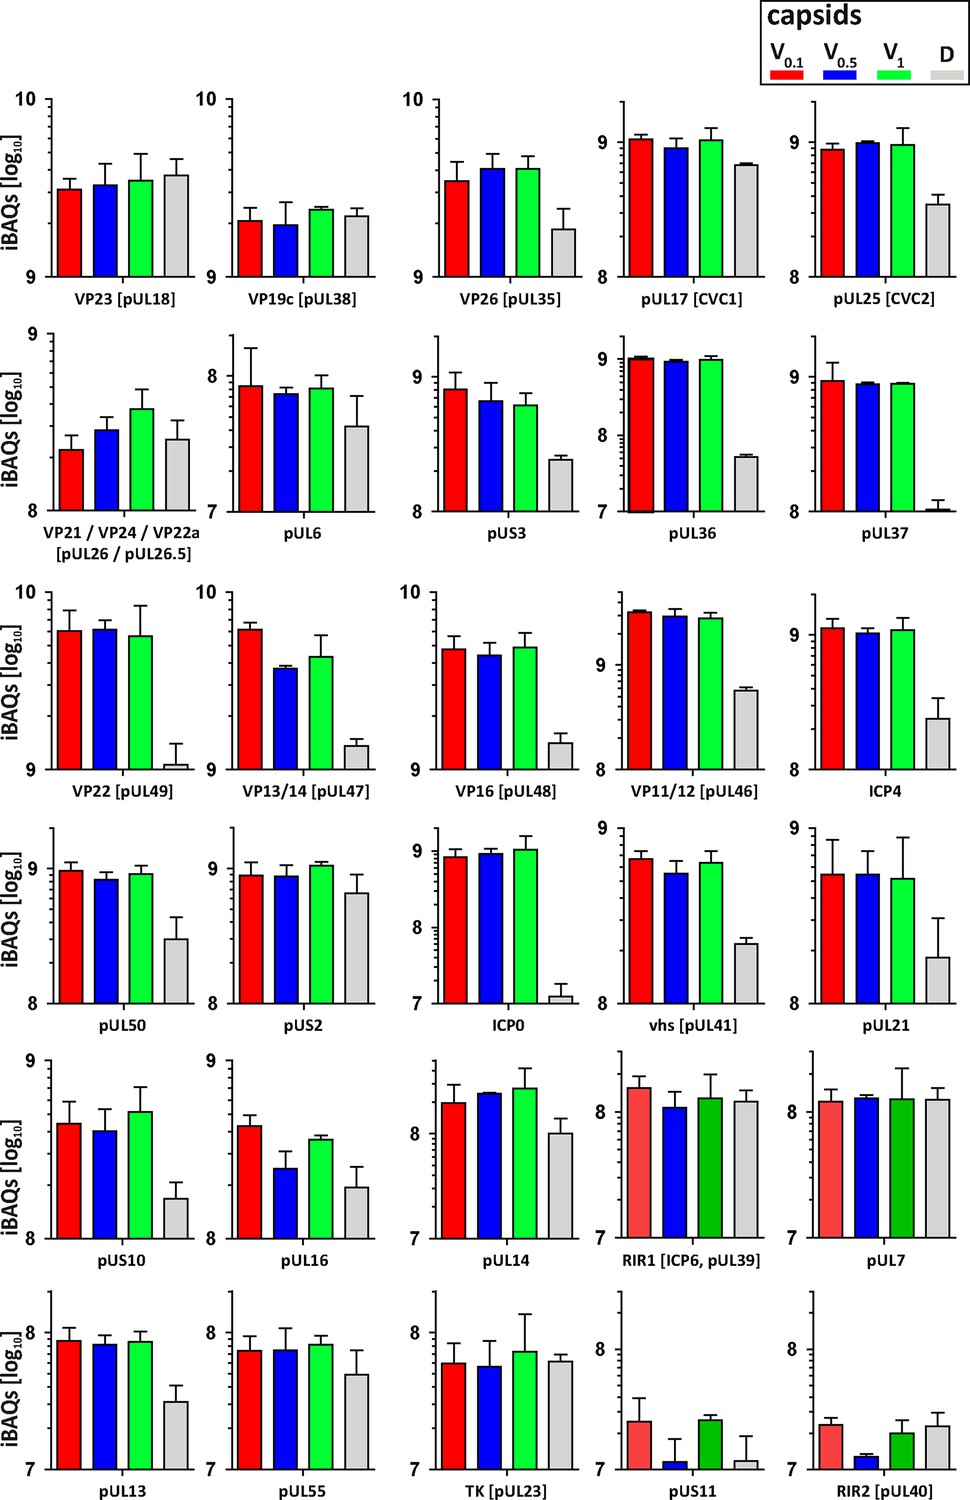
The composition of HSV-1(17+)Lox derived V0.1 (red), V0.5 (blue), V1 (green), and D (gray) capsids was analyzed by quantitative mass spectrometry in four biological replica. The sum of all the peptides intensities (iBAQ, intensity-based absolute quantification) of each viral protein known to participate in the structure of the capsids was normalized to the one of VP5 and displayed in a bar plot for each viral protein.
Figure 8—figure supplement 1
Membrane and non-structural proteins on V capsids versus D capsids.
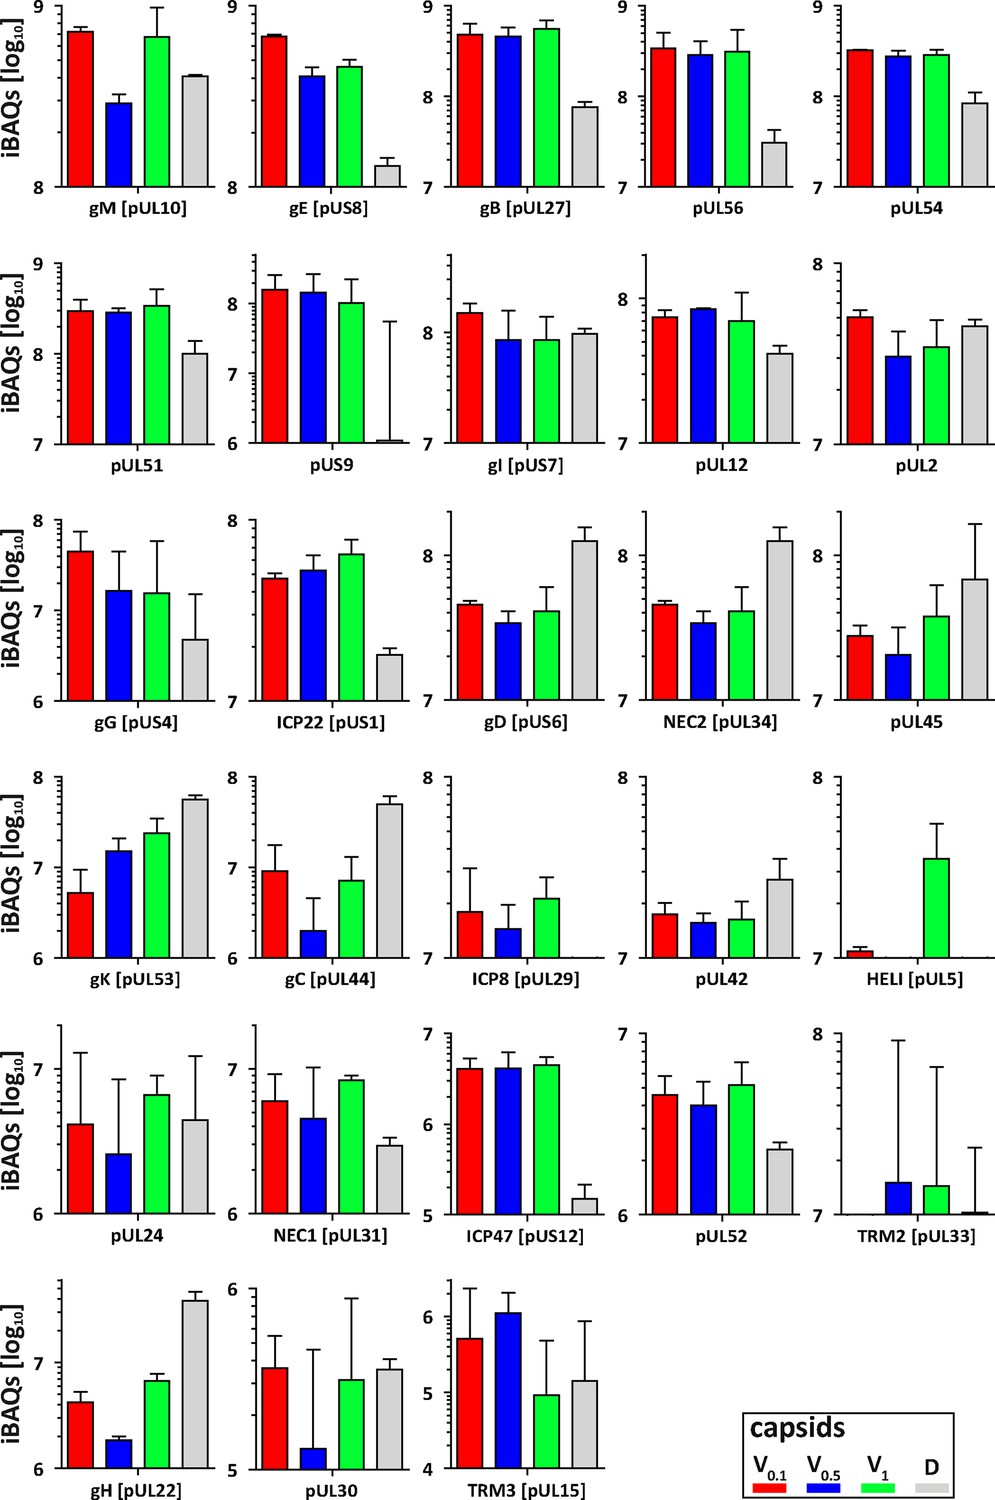
The composition of HSV-1 derived V0.1 (red), V0.5 (blue), V1 (green), and D (gray) capsids were analyzed by quantitative mass spectrometry in four biological replicates. The sum of all the peptides intensities (iBAQ, intensity-based absolute quantification) of each viral protein unknown to participate in the structure of the capsids was normalized to the one of VP5 and displayed in a bar plot.
Additional files
-
Supplementary file 1
Host proteins in THP-1 cytosols.
Intensity-Based Absolute Quantitation (iBAQ) counts of the host proteins identified in the proteomic analysis of the cytosolic extracts prepared from rested or IFN-induced THP-1 φ cytosol. Statistical analyses were performed with a Welch’s t-test. The following cut-offs were set for differentially-expressed proteins: permutation-based false-discovery rate (FDR) ≤ 0.05 and |log2 fold-change| ≥ 1.5. The protein groups were filtered to keep only the intensities measured in at least three out of four replicates per condition. Gene Ontology knowledge was used to reference the proteins previously described as induced by interferon.
- https://cdn.elifesciences.org/articles/76804/elife-76804-supp1-v2.xlsx
-
Supplementary file 2
Host proteins in capsid-host protein complexes.
Intensity-Based Absolute Quantitation (iBAQ) counts of host proteins identified in the V0.1, V0.5, V1 and D capsid-host protein complexes assembled in rested or IFN-induced THP-1 φ cytosol. Statistical analyses were performed with a Welch’s t-test. The following cut-offs were set for differentially bound proteins: permutation-based false-discovery rate (FDR) ≤ 0.05 and a |log2 fold-change ≥1.5|. The protein groups were filtered to keep only those with intensities measured in at least three out of four replicates, in at least one condition. “Interaction significance” column indicates the proteins considered as specific interactors.
- https://cdn.elifesciences.org/articles/76804/elife-76804-supp2-v2.xlsx
-
Supplementary file 3
Viral proteins in capsid-host protein complexes.
Intensity-based absolute quantification (iBAQ) counts of HSV-1(17+)Lox viral proteins from isolated V0.1, V0.5, V1 and D capsids (A) normalized to the intensity of the major capsid protein VP5, (B) unnormalized LFQ intensities. The viral proteins were filtered to keep only those with intensities measured in at least three out of four replicates, in at least one condition.
- https://cdn.elifesciences.org/articles/76804/elife-76804-supp3-v2.xlsx
-
Supplementary file 4
List of Antibodies.
mAb: monoclonal antibody. pAb: polyclonal antibody.Anti-capsid SY4563 (Döhner et al., 2018); Anti-VP5 NC-1 (Cohen et al., 1980); anti-calnexin (Hammond and Helenius, 1994); Anti-MxA/MxB M143 (Flohr et al., 1999).
- https://cdn.elifesciences.org/articles/76804/elife-76804-supp4-v2.docx
-
Transparent reporting form
- https://cdn.elifesciences.org/articles/76804/elife-76804-transrepform1-v2.pdf
Download links
A two-part list of links to download the article, or parts of the article, in various formats.
Downloads (link to download the article as PDF)
Open citations (links to open the citations from this article in various online reference manager services)
Cite this article (links to download the citations from this article in formats compatible with various reference manager tools)
The interferon-inducible GTPase MxB promotes capsid disassembly and genome release of herpesviruses
eLife 11:e76804.
https://doi.org/10.7554/eLife.76804


