Structure of Mycobacterium tuberculosis Cya, an evolutionary ancestor of the mammalian membrane adenylyl cyclases
- Laboratory of Biomolecular Research, Division of Biology and Chemistry, Paul Scherrer Institute, Switzerland
- Institute of Molecular Biology and Biophysics, ETH Zurich, Switzerland
- Institute of Molecular Systems Biology, ETH Zurich, Switzerland
- Institute of Parasitology, University of Zurich, Switzerland
Figures
Figure 1 with 5 supplements
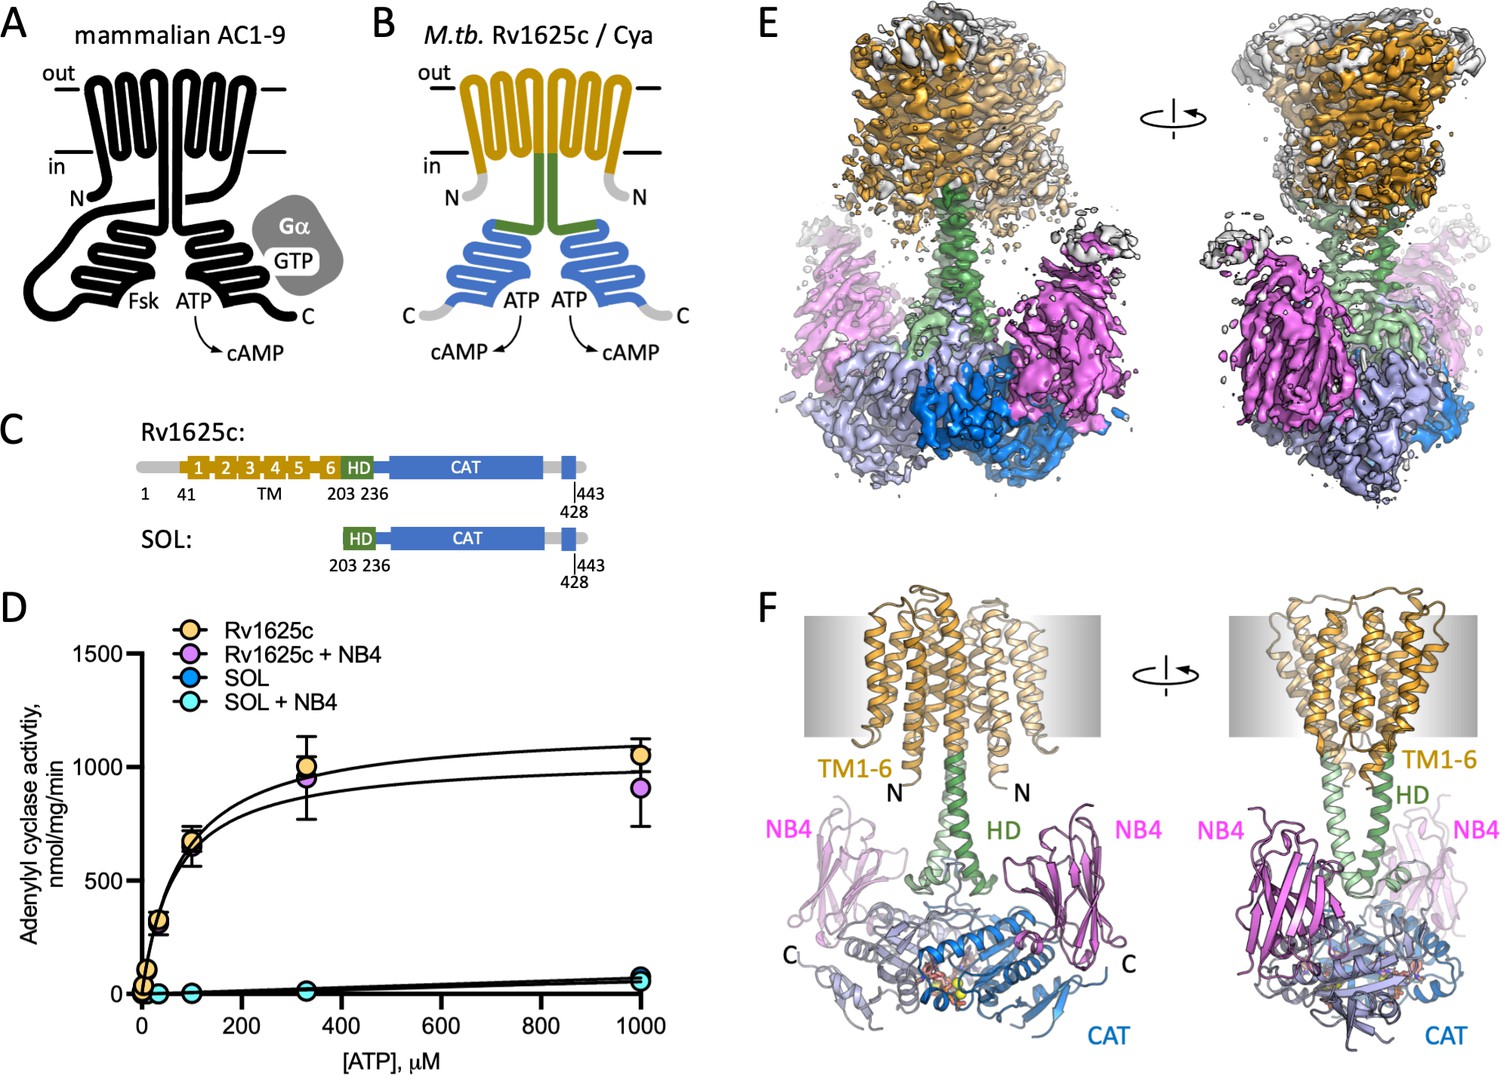
Structure of Cya–NB4 complex.
(A) Schematic representation of the mammalian membrane adenylyl cyclases (ACs), indicating the key elements of AC structure: 12 transmembrane (TM) domains, 2 catalytic domains, an ATP, and a forskolin (Fsk)-binding site. The protein is depicted in a G-protein-bound state. (B, C) A schematic representation of Rv1625c/Cya, illustrating the regions resolved in the cryo-EM structure. The TM region is coloured orange, the helical domain (HD) is green, the catalytic domain is blue. Regions absent in the cryo-EM structure are grey. (D) The activity of the full-length Cya in detergent is similar in the absence (yellow) and in the presence of nanobody NB4 (pink); the soluble domain of Cya (SOL, blue) shows low levels of activity. The activity of SOL in the presence of NB4 (cyan) is similar to SOL alone. For all experiments, the data are shown as mean ± standard error of the mean (SEM) (n = 3; for SOL, n = 6). (E) The density map of Cya–NB4 complex at 3.57 Å resolution, obtained using masked refinement of the best dataset with C2 symmetry imposed. (F) The corresponding views of the atomic model of Cya–NB4 complex, coloured as in B, C. ‘N’ indicates the N-terminal part of the protein; ‘HD’ – helical domain; ‘CAT’ – catalytic domain.
-
Figure 1—source data 1
Adenylyl cyclase acivity data and analysis (Figure 1D).
- https://cdn.elifesciences.org/articles/77032/elife-77032-fig1-data1-v3.xlsx
Figure 1—figure supplement 1

Purification and characterization of Cya.
(A) Size-exclusion chromatography (SEC) and sodium dodecyl sulfate–polyacrylamide gel electrophoresis (SDS–PAGE) of the purified Cya. SEC was peformed using a Superose 6 Increase column. (B, C) Same as in A, for NB4 (B) and for Cya-SOL. SEC was performed using a Superdex 200 Increase column. (D) Analytical SEC analysis Cya–NB4 interaction was performed using the Agilent Bio SEC-5 column. The shift of the SEC peak upon NB4 binding is indicated with an arrow; a dashed line indicates the position of the Cya alone. (E) Isothermal titration calorimetry (ITC) analysis of Cya-SOL/NB4 binding; mean Kd ± standard deviation (SD) is indicated in the graph (n = 3). ITC thermogram integration was carried out using NITPIC. Global analysis of integrated thermograms was performed using SEDPHAT and figures were generated using GUSSI.
Figure 1—figure supplement 2
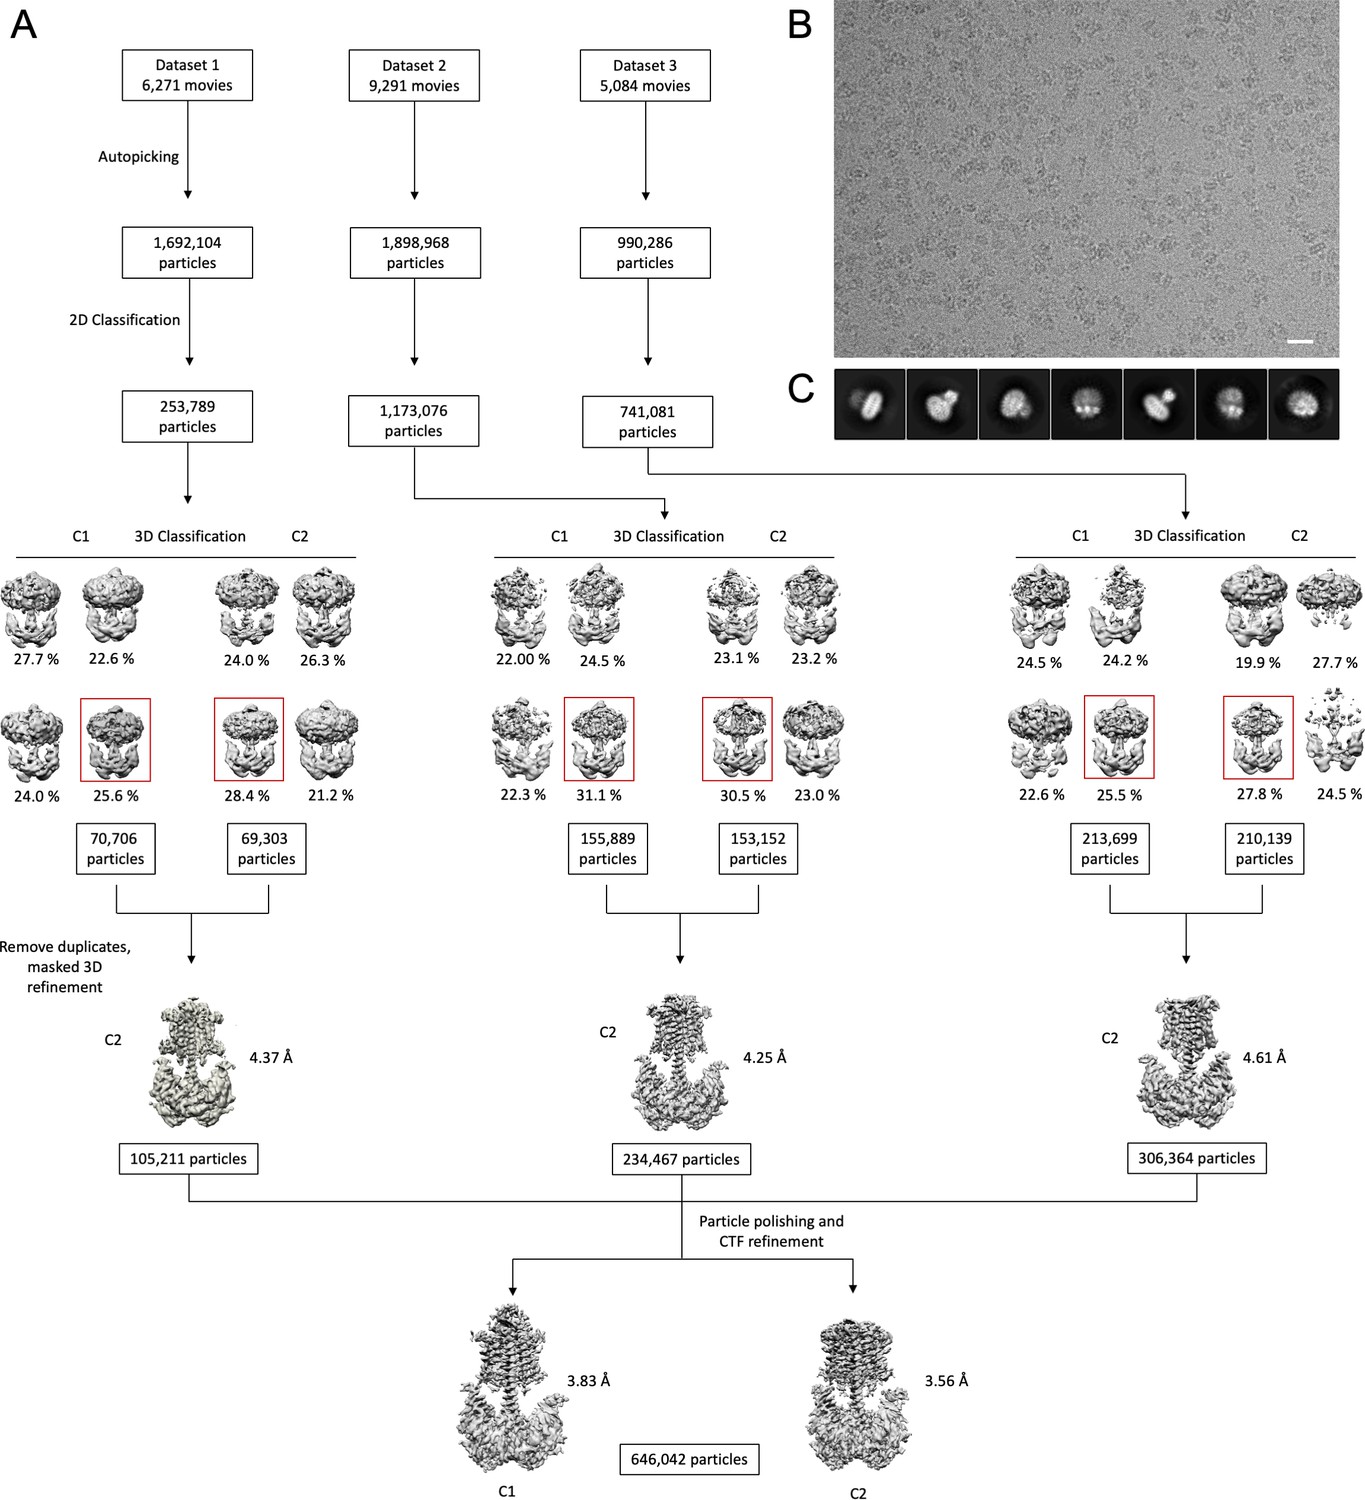
Cryo-EM processing workflow.
(A) A processing pipeline for 3D reconstruction of the Cya–NB4 complex. Three datasets were processed in both C1 and C2 symmtery in parallel. Particles resulting from the best 3D classes were pooled, duplicates removed, and the resulting particle selection was refined in C2 symmetry for each dataset. All three datasets were combined and further processed by particle polishing and CTF refinement, resulting in two density maps: one processed in C1 symmetry (at a resolution of 3.83 Å) and another one in C2 symmtery (at a resolution of 3.57 Å), as detailed in ‘Materials and methods’. (B) An example of a cryo-EM micrograph the bar corresponds to 200 Å. (C) Representative 2D classes reveal distinct views of the Cya–NB4 complex.
Figure 1—figure supplement 3
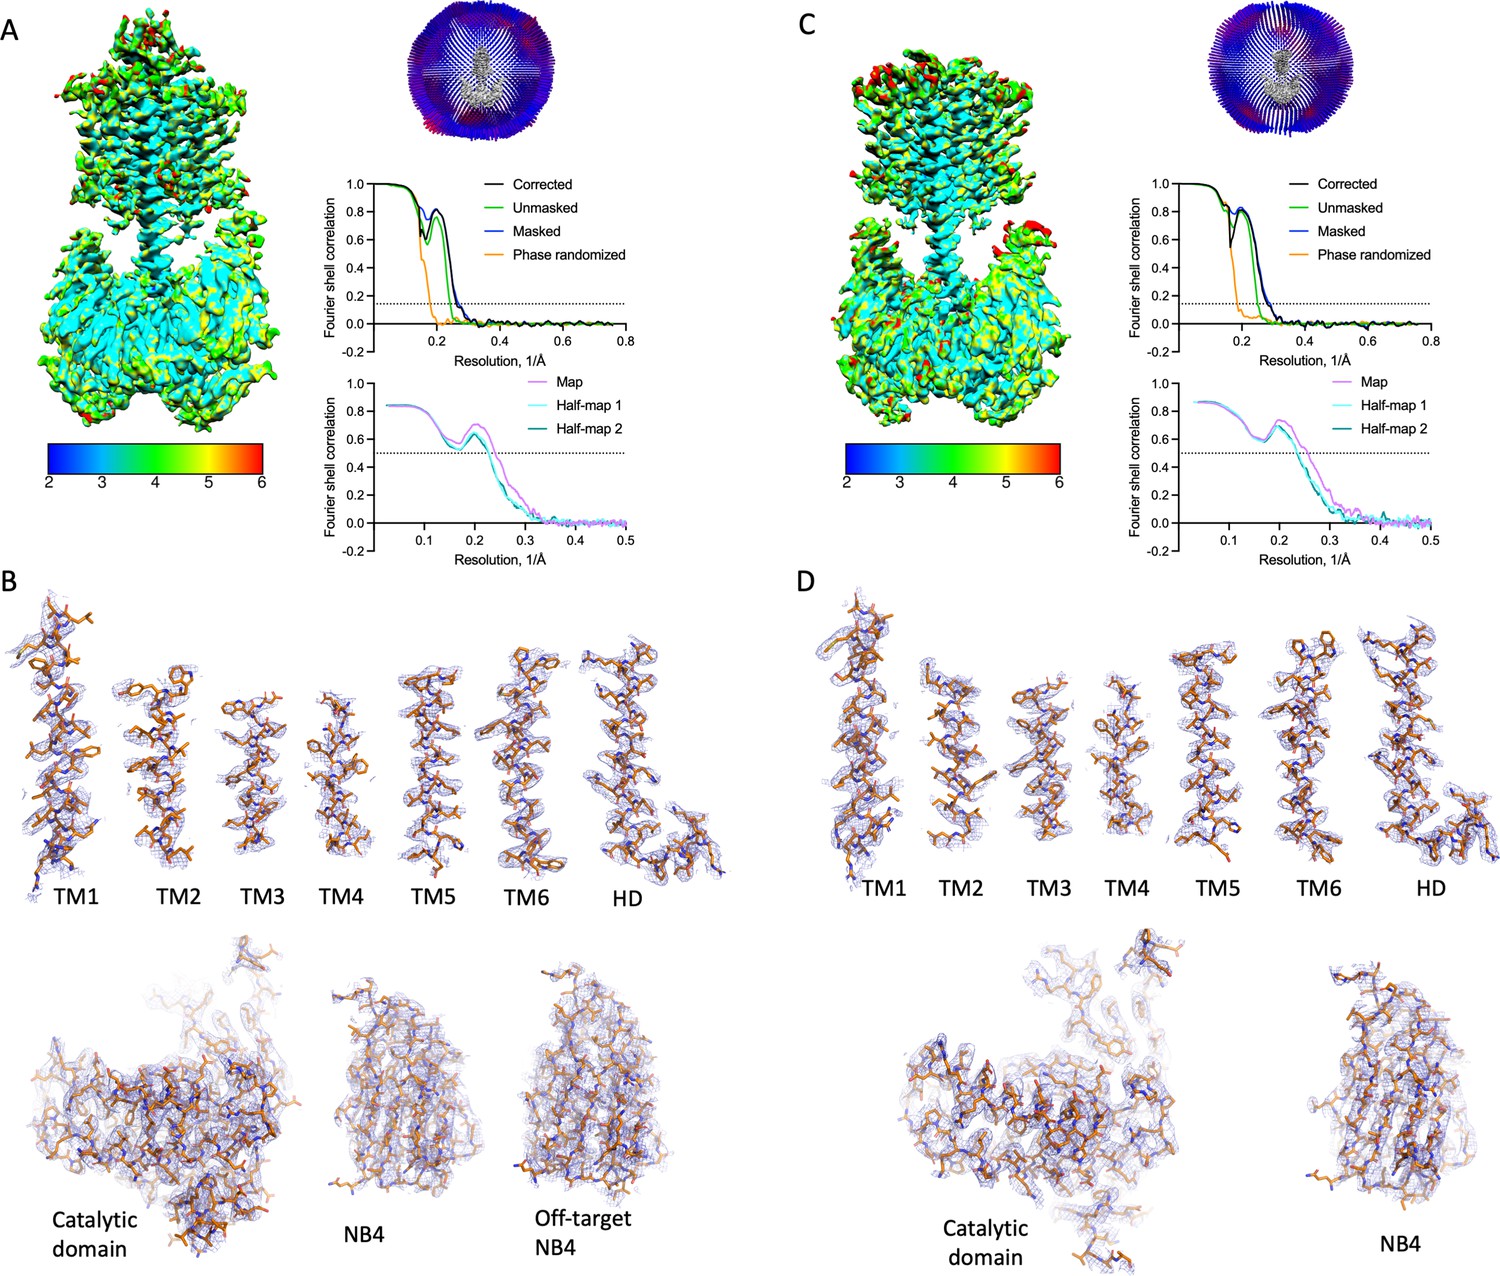
Properties of the Cya–NB4 density maps.
(A) Local resolution, angular distribution, and Fourier shell correlation (FSC) curve of the Cya–NB4 complex processed in C1 symmetry. Scale bar indicates local resolution range in Å. (B) Isolated cryo-EM density for each of TM helix and the helical domain (HD) contoured at 8σ (top). Isolated cryo-EM density for catalytic domain and NB4 contoured at 8σ, with extracellular NB4 contoured with 4σ (bottom). (C, D) Same as A, B, for the Cya–NB4 processed in C2 symmetry. All density map features are contoured at 8σ.
Figure 1—figure supplement 4
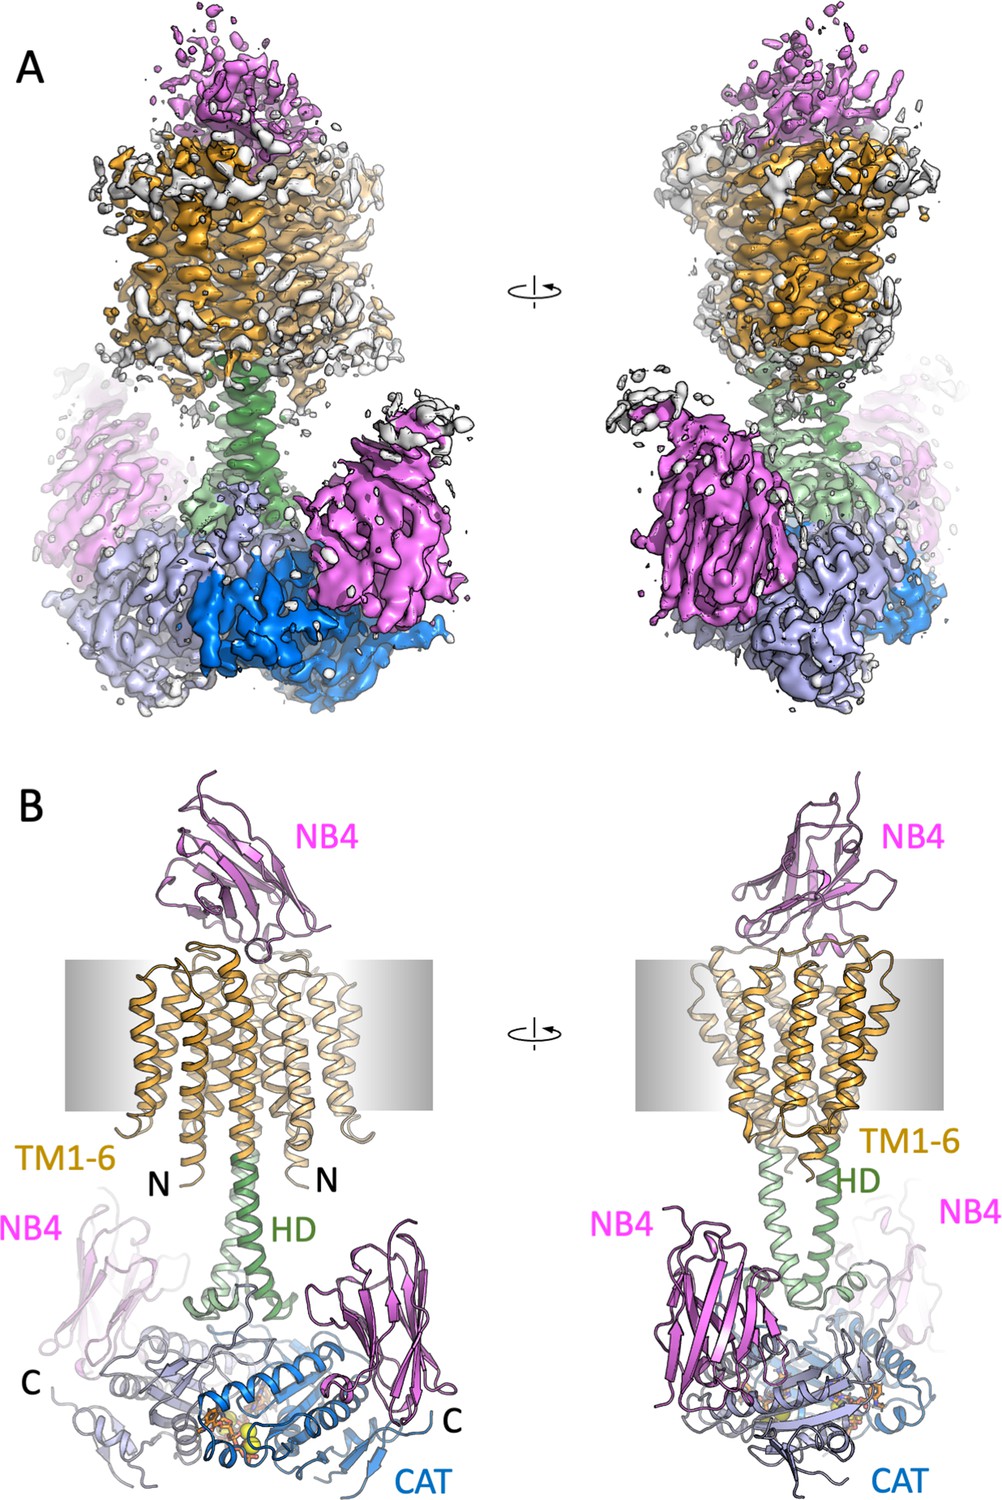
Cryo-EM density map and model of Cya in C1 symmetry.
(A) The density map of Cya–NB4 complex at 3.83 Å resolution, obtained using masked refinement of the best dataset with C1 symmetry. (B) The corresponding views of the atomic model of Cya–NB4 complex, coloured as in B, C. ‘N’ indicates the N-terminal part of the protein; ‘HD’ – helical domain; ‘CAT’ – catalytic domain.
Figure 1—figure supplement 5
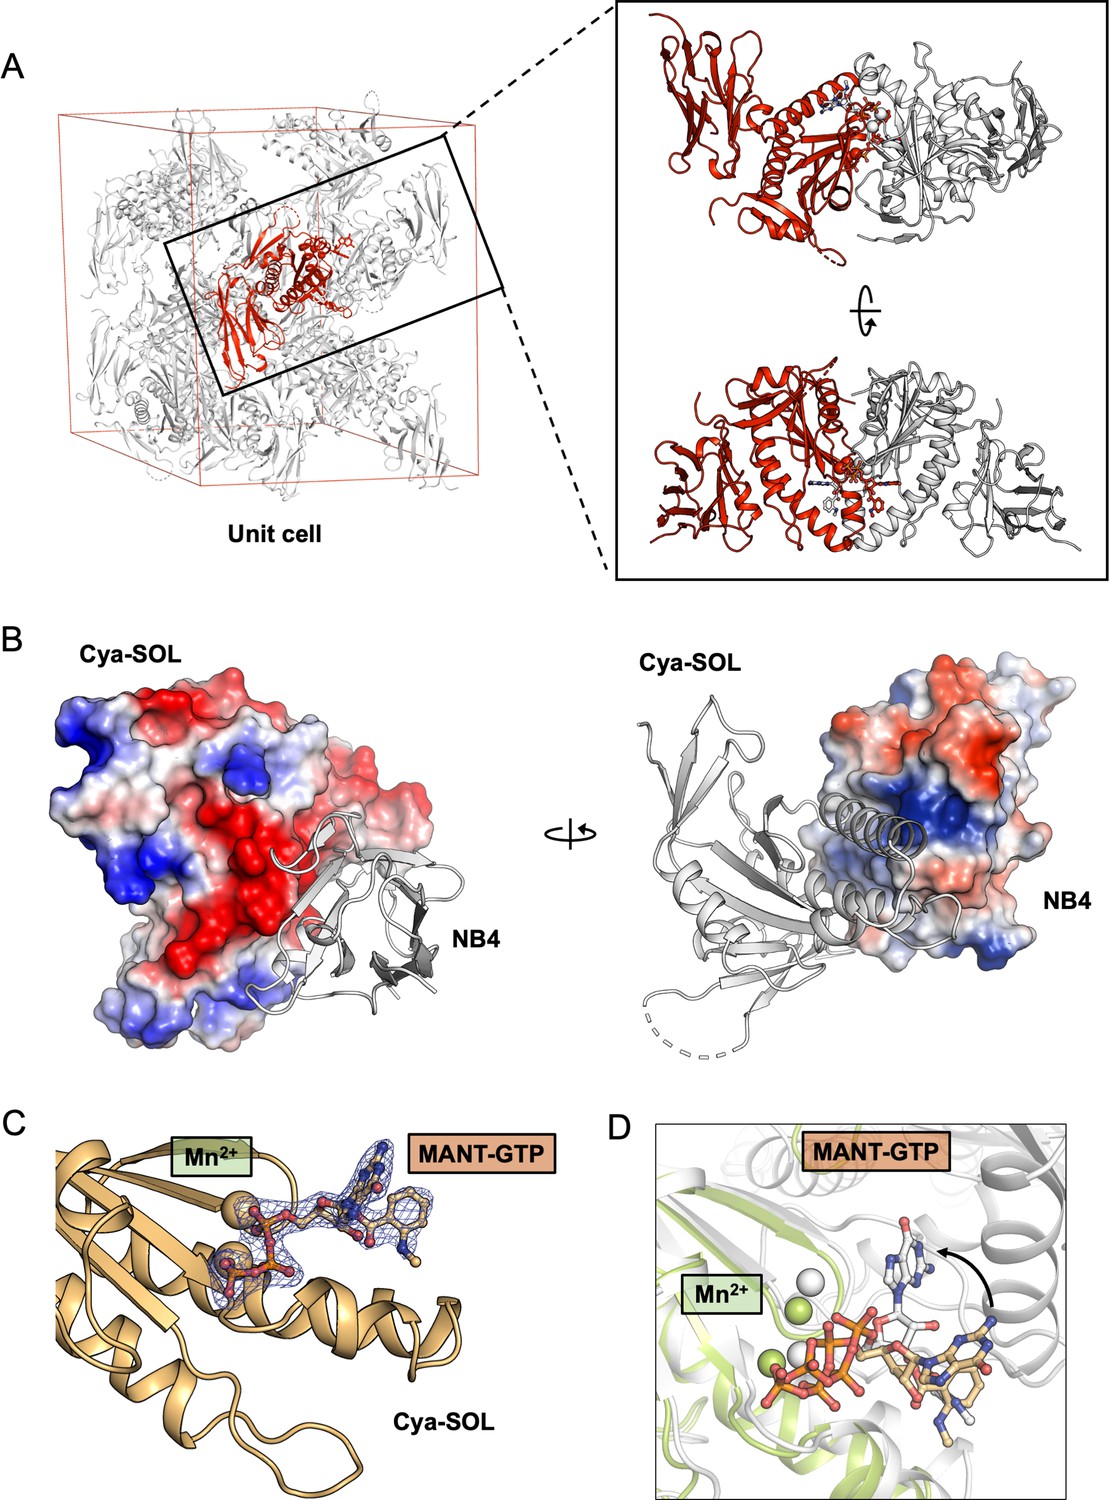
X-ray structure of the catalytic domain of Cya, Cya-SOL, bound to NB4.
(A) Illustration of a crystallographic unit cell in the crystals of catalytic domain of Cya–NB4 complex showing the arrangement of one copy of Cya-SOL–NB4 complex (red) in an asymmetric unit (red). Analysis of the interaction between Cya-SOL–NB4 with its symmetry mates (grey) shows that Cya-SOL–NB4 does engages in non-native interactions with its neighbours, consistent with formation of a crystallographic dimer (right). (B) The surface representations of the catalytic domain of Cya (right) and NB4 (left), coloured according to the calculated electrostatic potential, suggest a role of the surface-exposed charged residues in the Cya–NB4 interaction. (C) Fo–Fc omit map of MANT-GTP (left) bound to Cya-SOL. Density is contoured at 3σ, carved to 1.6 Å in Pymol. (D) Despite retaining the ability to bind the MANT-GTP molecule via one-half of its catalytic site, the position of the nucleotide is distinct from that observed in the structure of the nucleotide-bound dimeric Cya.
Figure 2 with 3 supplements
Features of the Cya transmembrane (TM) domain.
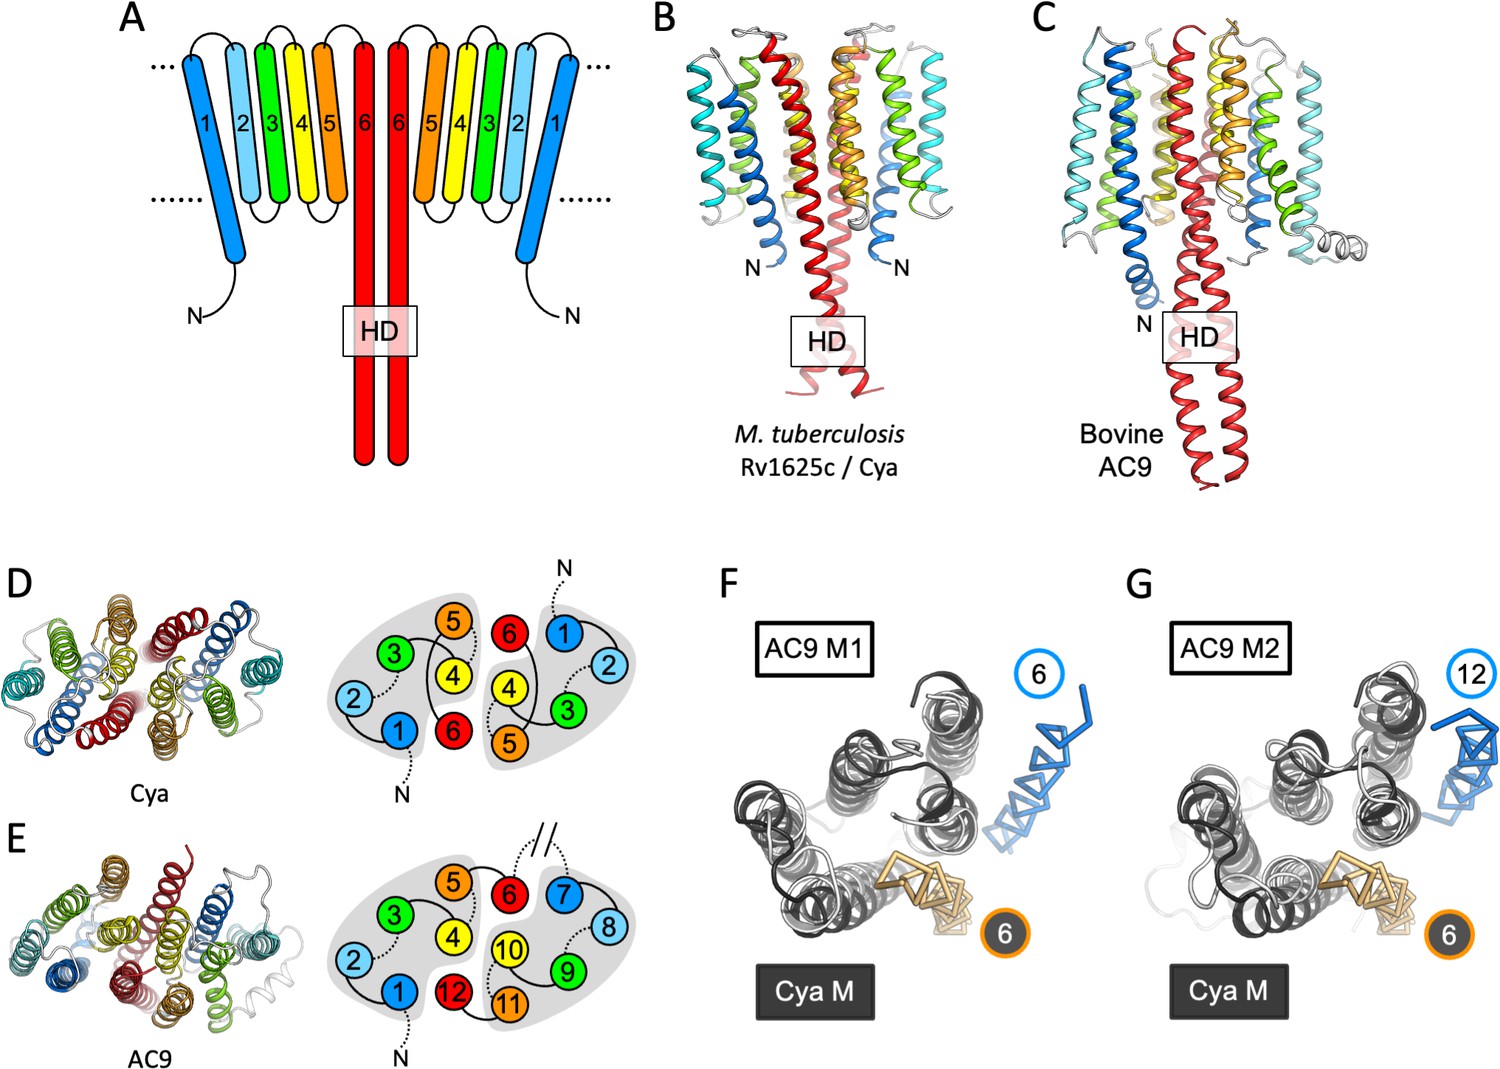
(A) A schematic representation of the 6-TM bundles (TM1–TM6) of Cya, arranged as dimer. A view of Cya (B) and AC9 (C) TM domain parallel to the membrane plane. A view of Cya (D) and AC9 (E) TM domain perpendicular to the membrane plane. The schematic indicates the relative arrangement of the TM helices, with helices 4, 5, and 6 at the dimer interface. The grey shapes indicate the conserved structural motif (TM1–5 in Cya, TM1–5 and TM7–11 in AC9) of the membrane adenylyl cyclases (ACs). The extracellular and intracellular loops connecting the TM helices are shown using solid and dotted lines, respectively. The connection between TM6 and TM7 of AC9 is indicated as a broken line, in place of the catalytic domain C1a and the connecting loop C1b. Alignment of the 6-TM bundles of Cya (black) and AC9 (white) reveals a high level of structural conservation, in particular in the TM1–5 ( (RMSD) 3.42 Å over 112 residues; F) and TM7–11 regions of the two proteins (RMSD 3.56 over 112 residues; G). The positions of the helical domain (HD)-forming TM helices are conserved, but the TM6 and TM12 are swapped in AC9 (blue) relative to Cya (orange).
Figure 2—figure supplement 1
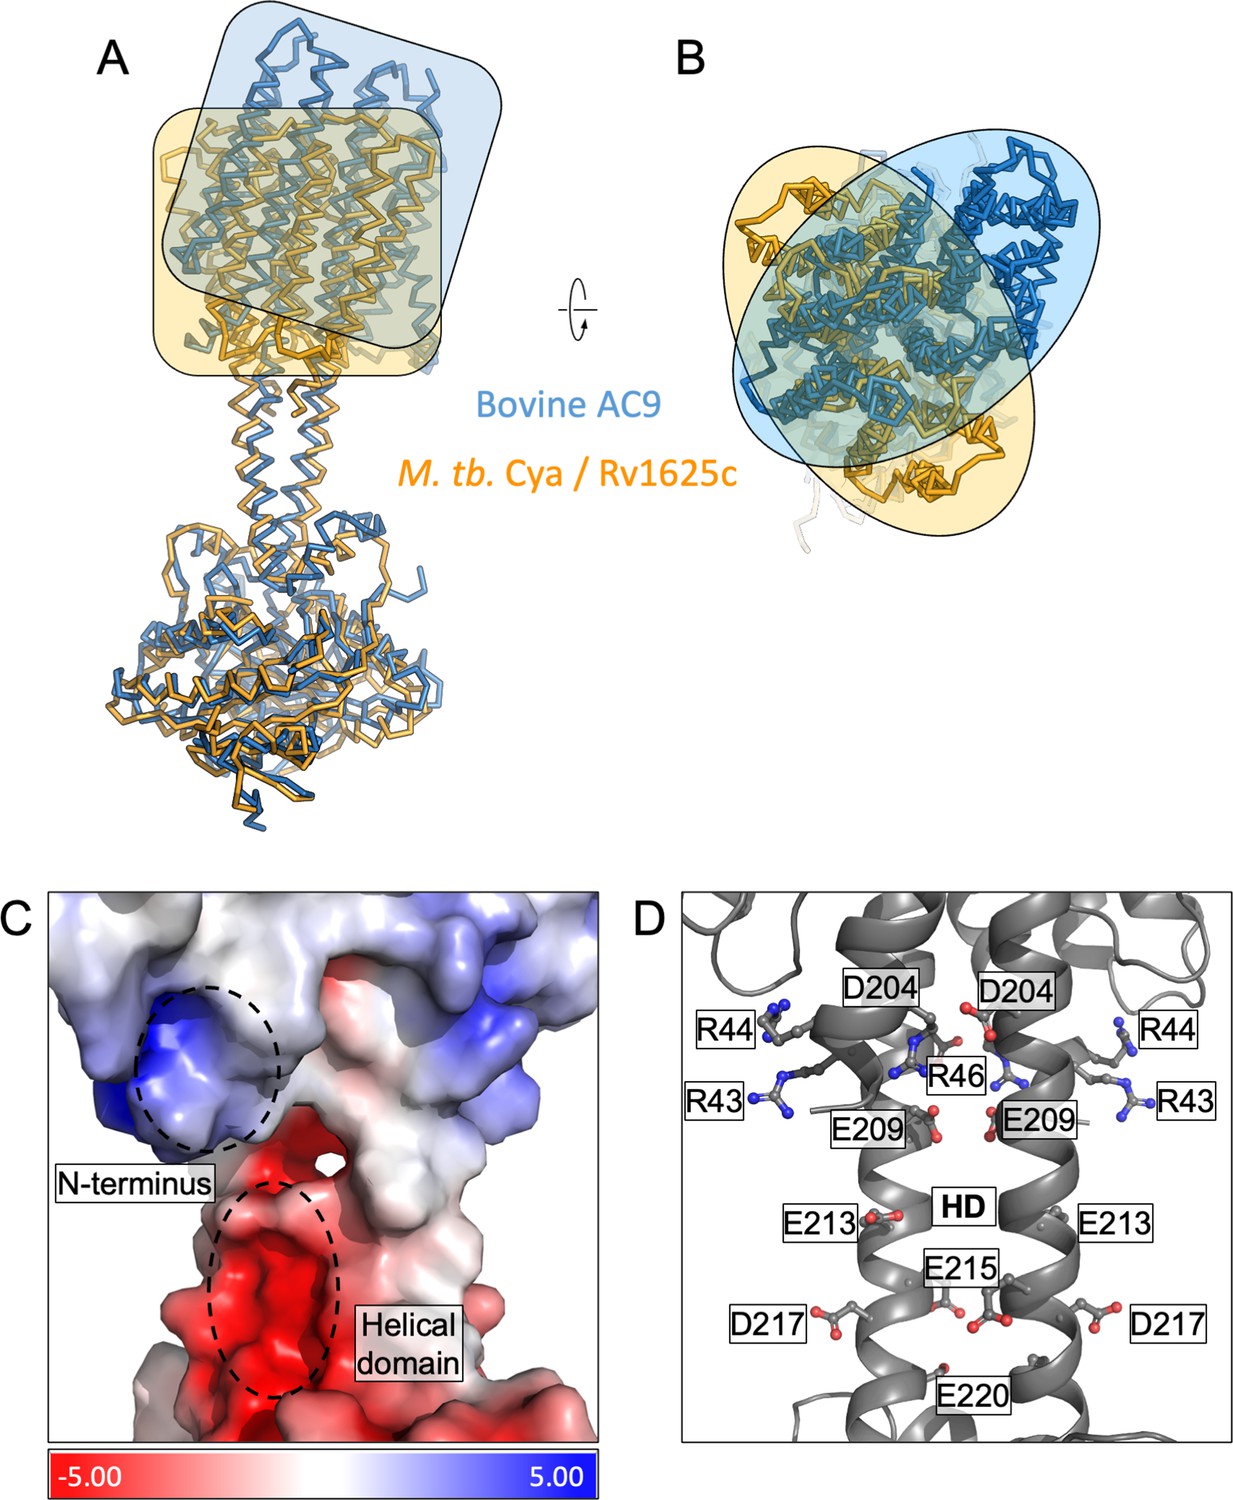
Comparison of M. tuberculosis Cya and bovine AC9.
(A) Structural alignment of Cya and bovine AC9 using their catalytic domains. The transmembrane (TM) regions show considerable deviation in alignment, highlighted by orange/blue boxes (left) and ovals (right) outlining the protein shapes. The top view of the alignment shows an approx. 90° rotation of the bAC9 TM domain compared to that of Rv1625c further highlighting the global structural difference between the two cyclases. (A, B) Vacuum electrostatic charge distribution of the N-terminus and the helical domain (HD) of Cya (C). The positively charge residues of the N-terminus may interact with the negatively charged residues of the HD (C, D).
Figure 2—figure supplement 2
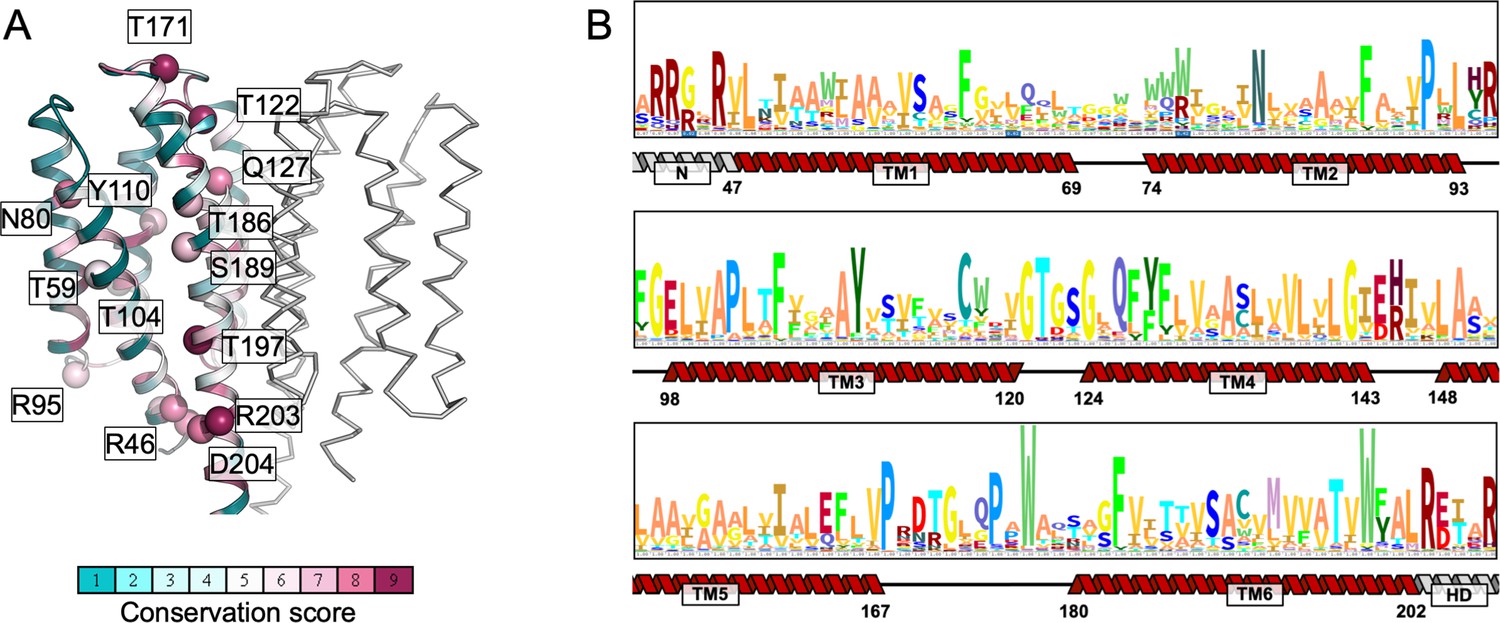
Sequence conservation of the transmembrane (TM) domain residues of mycobacterial Cya homologues.
(A) The conservation scores were calculated using ConSurf (Jo et al., 2008), using multiple sequence alignment including 170 homologues of Cya from Mycobacteria; the sequences of the homologues were obtained by a Blast search. (B) The HMM logo of the aligned sequences used in the ConSurf analysis. The secondary structure features indicate the relative positions of the residues in the TM domain.
Figure 2—figure supplement 3
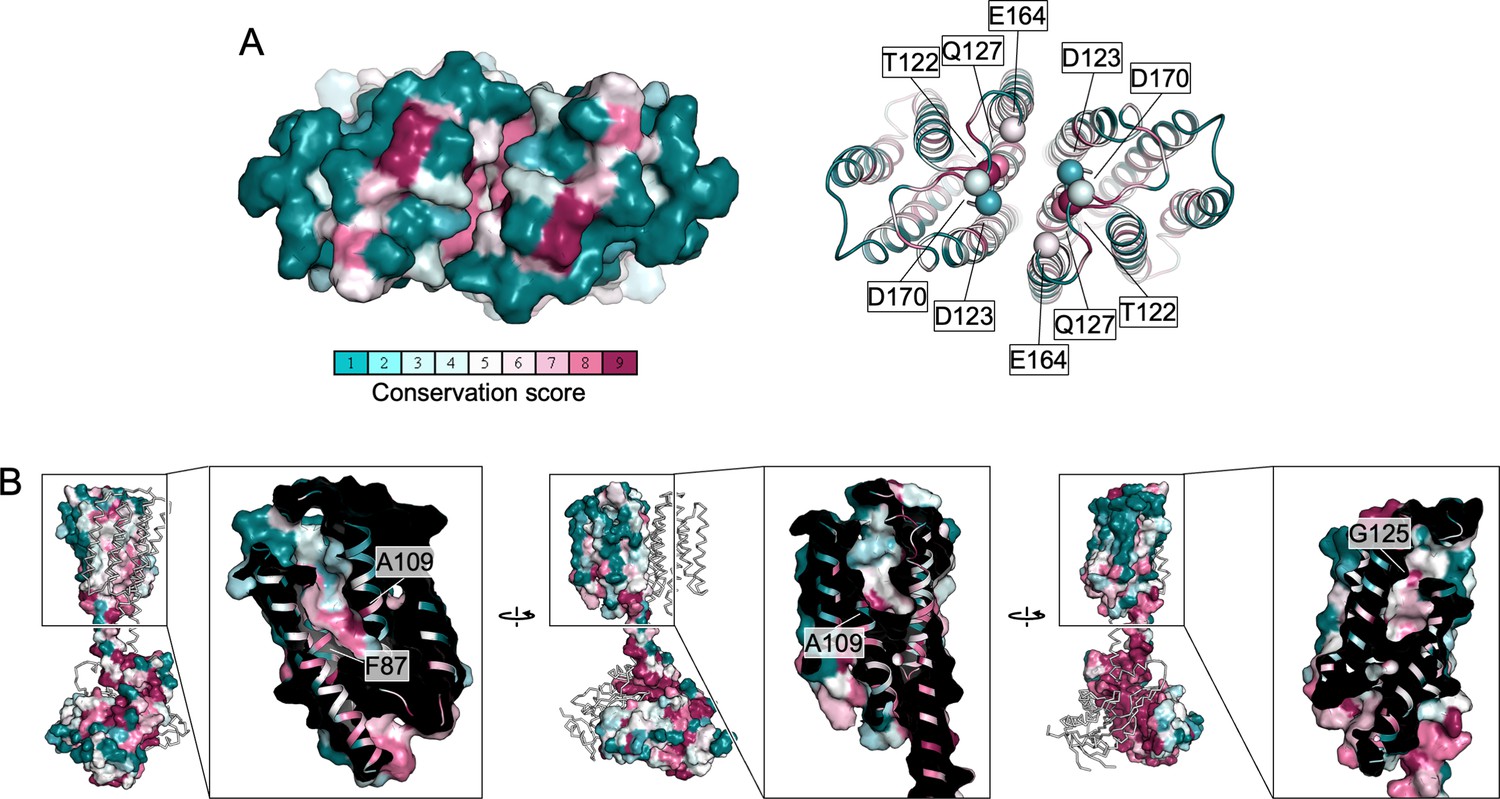
Conservation of the extracellular pockets of Cya.
(A) Two of the polar residues in the Ex1 domain are conserved (T22, Q127), whereas D123, E164, and D170 are not conserved. (B) The surface representation of the Ex2 pocket shows that the residues are largely not conserved. For comparison, the overview image of the full Cya dimer shows a high degree of conservation at the catalytic domain or helical domain (HD) interface. Several of the conserved residues within the Ex2 pocket are indicated by a white box.
Figure 3

The role of the transmembrane (TM) domain as a chaperone for helical domain (HD)/adenylyl cyclase (AC) assembly.
Guide rail-like structures are formed by the TM1–5 in Cya (black, A) and the TM1–5/TM7–11 in AC9 (white, B). The arrangement of these rail-like structures positions the TM6 helices for optimal assembly of the HD and the catalytic domain. (C) The views of Cya and AC9 with the TM1–5 (Cya) and TM1–5/TM7–11 (AC9; PDB ID: 6r3q) represented as transparent surface. (D) The TM–HD regions of Cya and AC9 aligned. Despite the difference in HD length and the deviation in the TM domains, the cores of the HD domains are well aligned. (E, F) Similar to C, D, for the human soluble guanylyl cyclase sGC (inactive form; PDB ID: 6jt0). (G, H) Similar to E, F, for the activated form of sGC (sGC*; PDB ID: 6jt2). The brackets in F and H indicate the misaligned (F) and aligned (H) portions of the Cya and sGC HDs.
Figure 4 with 3 supplements
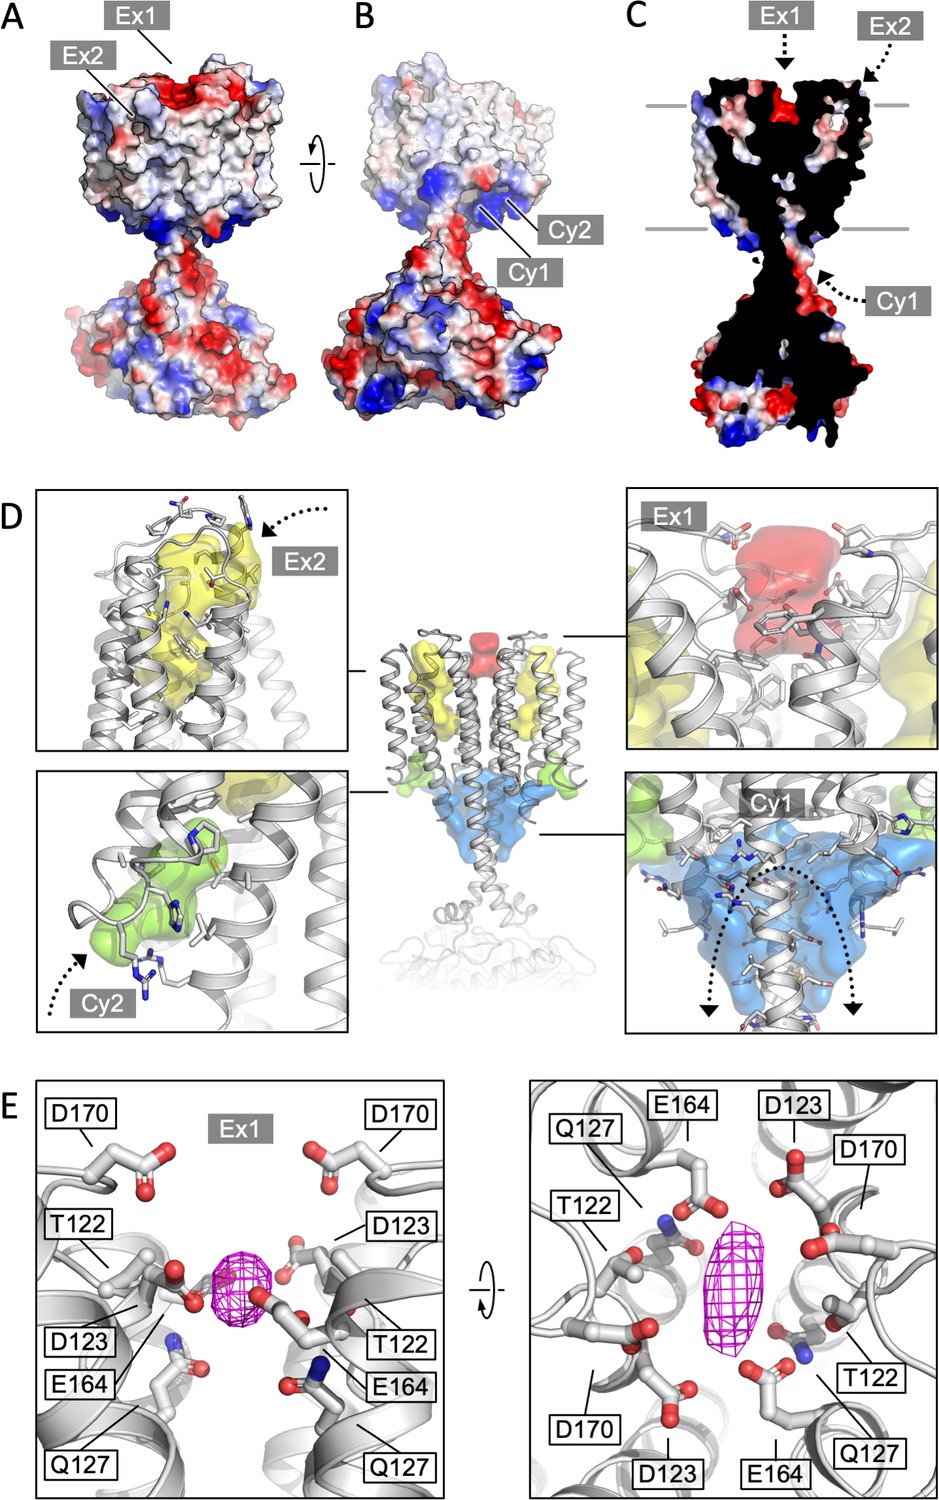
Cya transmembrane (TM) domain as a receptor module.
(A) A view of the Cya structure (nanobody NB4 not shown) in surface representation, coloured according to electrostatic potential. The location of two putative binding sites, sites Ex1 (negatively charge) and Ex2 (hydrophobic) are indicated. (B) Similar as (A), a view at the Cya structure from the cytosol, showing the locations of the positively charged sites Cy1 and Cy2. (C) A slice through the structure shows the internal cavities with access points Ex1, Ex2, and Cy1. (D) The density maps corresponding to the internal cavities within the TM region of Cya, calculated using 3 V (Voss and Gerstein, 2010) and low pass filtered to 3 Å for presentation purposes. Arrows indicate the access to the cavities. (E) A prominent density featured in the density map of Cya–NB4 complex, occupying the site Ex1. Polar and negatively charged residues surround the density, consistent with a binding site for metals (or organic cations).
Figure 4—figure supplement 1
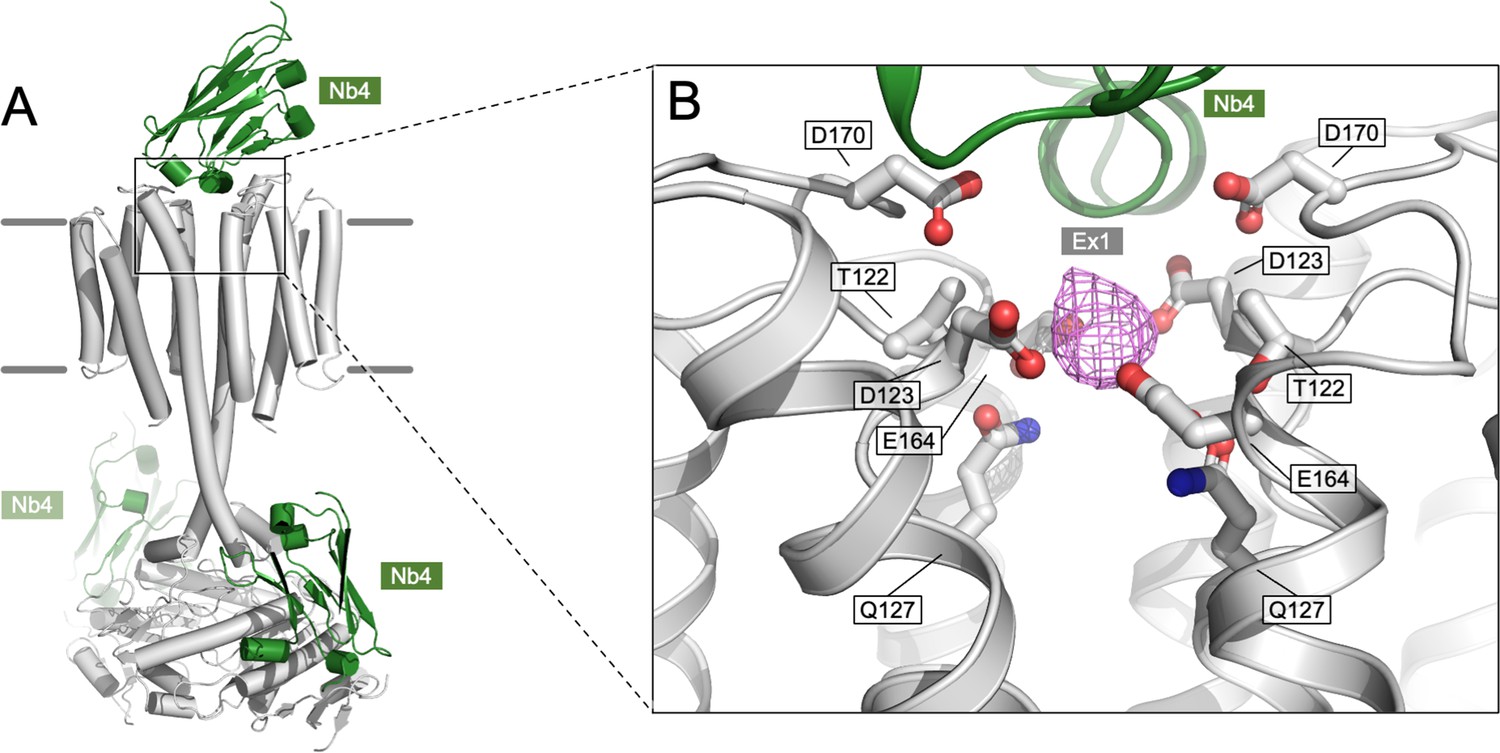
Density present in the Ex1 site.
(A) An overview of the Cya model in C1 symmetry, indicating the positions of the bound NB4 chains in green. (B) A corresponding zoomed-in view of the site Ex1 in the C1 model, indicating the density feature (magenta) occupying the site in the postprocessed Cya map (C1 symmetry); the corresponding feature in the C2 symmetry map is shown in Figure 4E. The side chains of the polar residues in the vicinity of the site are indicated as sticks.
Figure 4—figure supplement 2
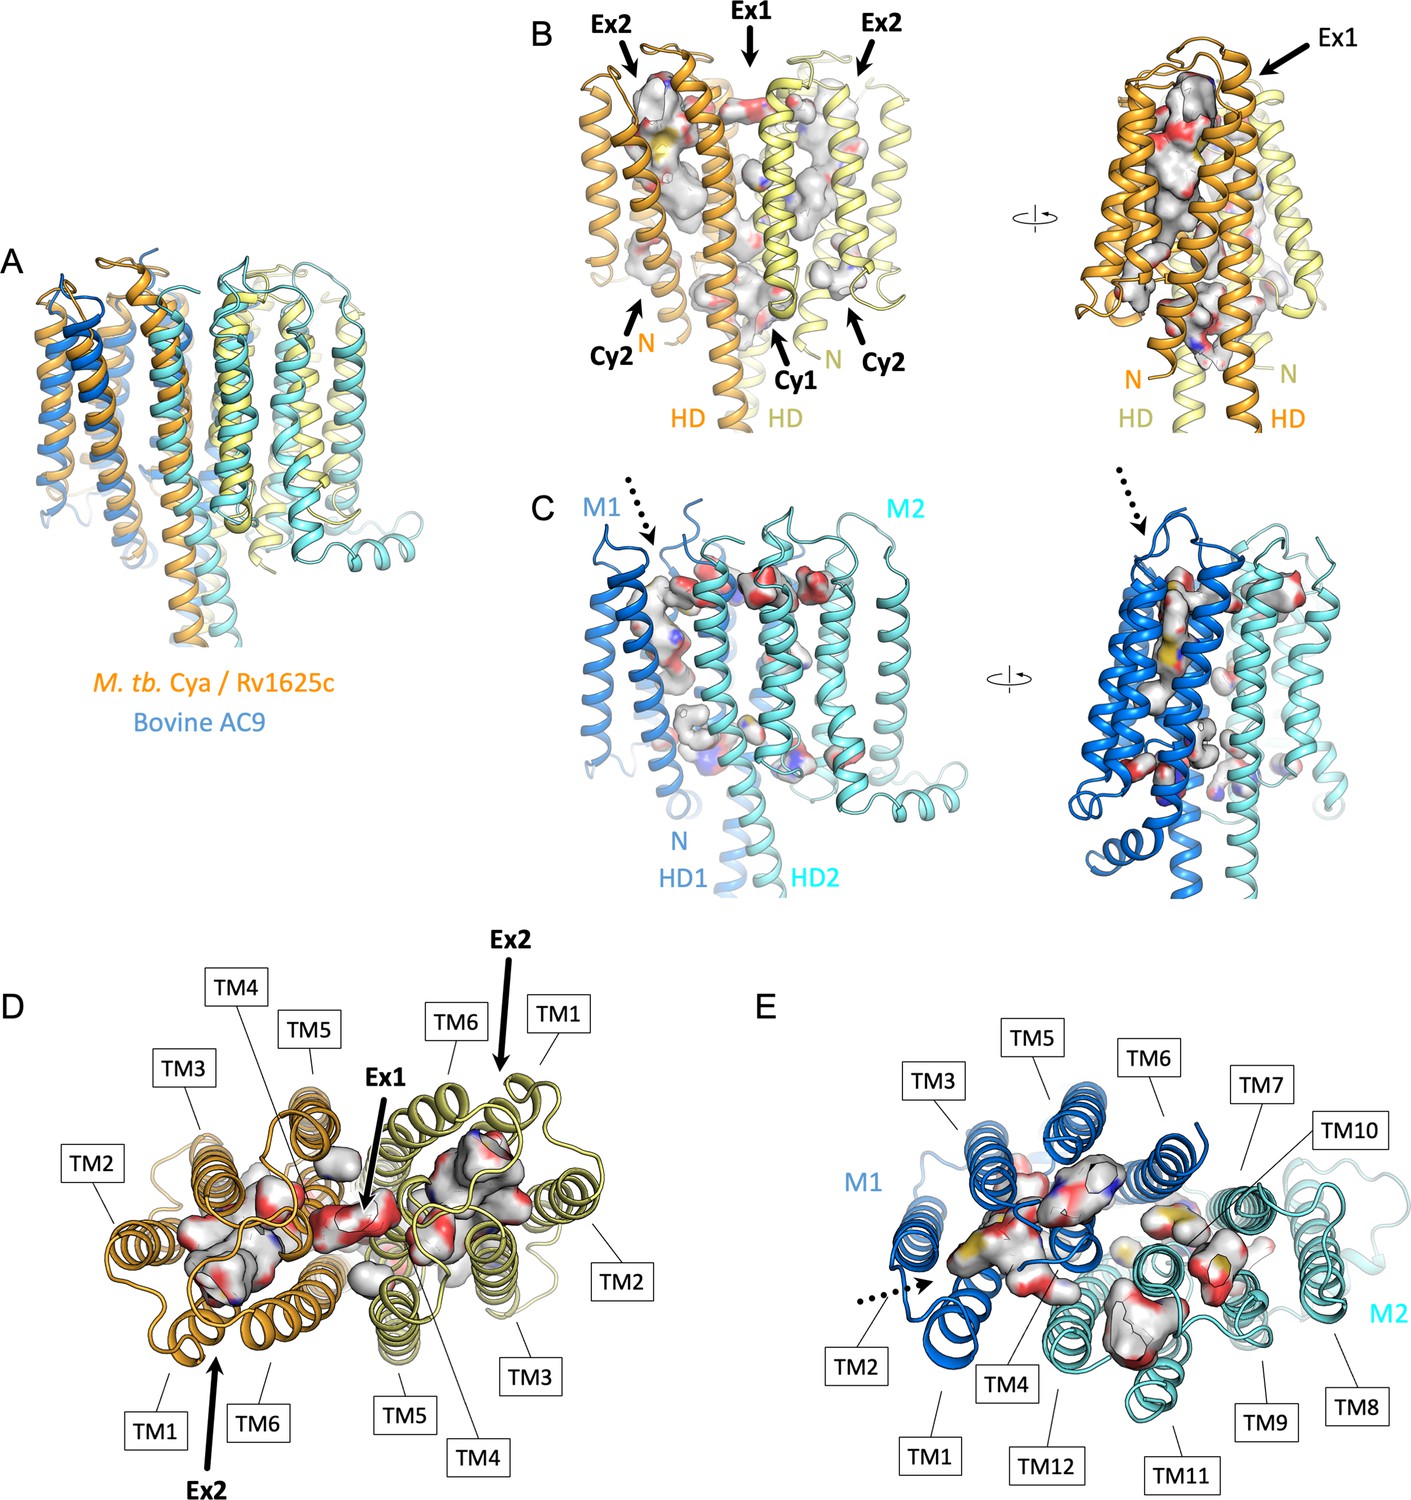
Comparison of the intramembrane cavities formed by Cya and AC9.
(A) A view of the overlayed Cya and AC9, aligned using the membrane domain of AC9 and the TM1–6 (‘M1’) of AC9. (B) A side view of Cya with the Ex2 cavity depicted in Pymol with a cavity detection of three solvent radii and cavity detection cutoff of five solvent radii. The cavities corresponding to site Ex1, Ex2, Cy1, and Cy2 are indicated with an arrow. ‘N’ – N-terminus; ‘HD’ – helical domain. (C) The view of the aligned AC9, indicating the cavities detected in pymol using the same parameters as in B. The regions of the protein corresponding to TM1–6 and TM7–12 are indicated as ‘M1’ (marine) and ‘M2’ (cyan), respectively. The only prominent cavity is located in the M1 domain, corresponding to the site Ex2 in Cya, indicated by a dotted arrow. Views of the extracellular surface of Cya (D) and AC9 (E). The transmembrane (TM) domains are indicated with the boxes. Surface colours in B–E correspond to atom type, based on the residues lining the cavity.
Figure 4—figure supplement 3

Molecular dynamics (MD) simulations of Cya.
(A) Illustration of Cya embedded in lipid bilayer, solvated with TIP3 water molecules and neutralized with 0.15 M KCl or MgCl2 for MD simulations. (B) Overlay of potassium (blue) and magnesium (cyan) occupancy maps from independent simulations fitter on the reference structure (yellow). (C, D) Depiction of Mg2+ and Cl− ions present within 4 Å of Ex1 site and of the catalytic pocket of Cya at the end of a 200-ns simulation. (E) Average distances between negatively charged residues and K+ (light blue) or Mg2+ ions (cyan) during the course of a simulation. (F) The density grid of water molecules (blue mesh) showing the partial solvent accessibility of Ex2 pocket during simulation.
Figure 5 with 2 supplements

Extracellular site Ex1 is linked to the adenylyl cyclase activity of Cya.
(A) An illustration of the Ex1 site residues mutated to generate the Ex1-5A mutant, substituting the five indicated residues with Ala. (B) Calculated electrostatic potential of the wild-type Cya. (C) Same as B, for the Ex1-5A mutant. (D) The mutant shows thermostability profile consistent with that of the wild-type protein, based on the observed Tm values in the presence and in the absence of a nucleotide analogue. For experiments in D–F, n = 3; data are shown as mean ± standard error of the mean (SEM). (E) The enzymatic properties of the mutant are substantially affected by the mutation (the dashed red curve corresponds to the fit shown for Cya in Figure 1D for comparison). (F) The affinity of the Ex1-5A mutant for MANT-GTP is reduced (110 and 420 μM, respectively). (G) Limited proteolysis-coupled mass spectrometry (LiP-MS) analysis of Cya and Ex1-5A mutant. The graph indicates sequence coverage and the identified tryptic, semi-tryptic, or non-tryptic peptides. Significantly changing peptides (|log2(FC)|>2; q value <0.001) are marked with a blue dot. A bar within the plot is coloured according to the change in protease accessibility at each peptide (blue = no change, pink = high fold change; absolute log2 transformed fold changes range from 0 to 7.3). (H) A model of Cya coloured according to the bar in E.
-
Figure 5—source data 1
Biophysical and biochemical properties of the Ex1-5A mutant (Figure 5D–F).
- https://cdn.elifesciences.org/articles/77032/elife-77032-fig5-data1-v3.xlsx
Figure 5—figure supplement 1
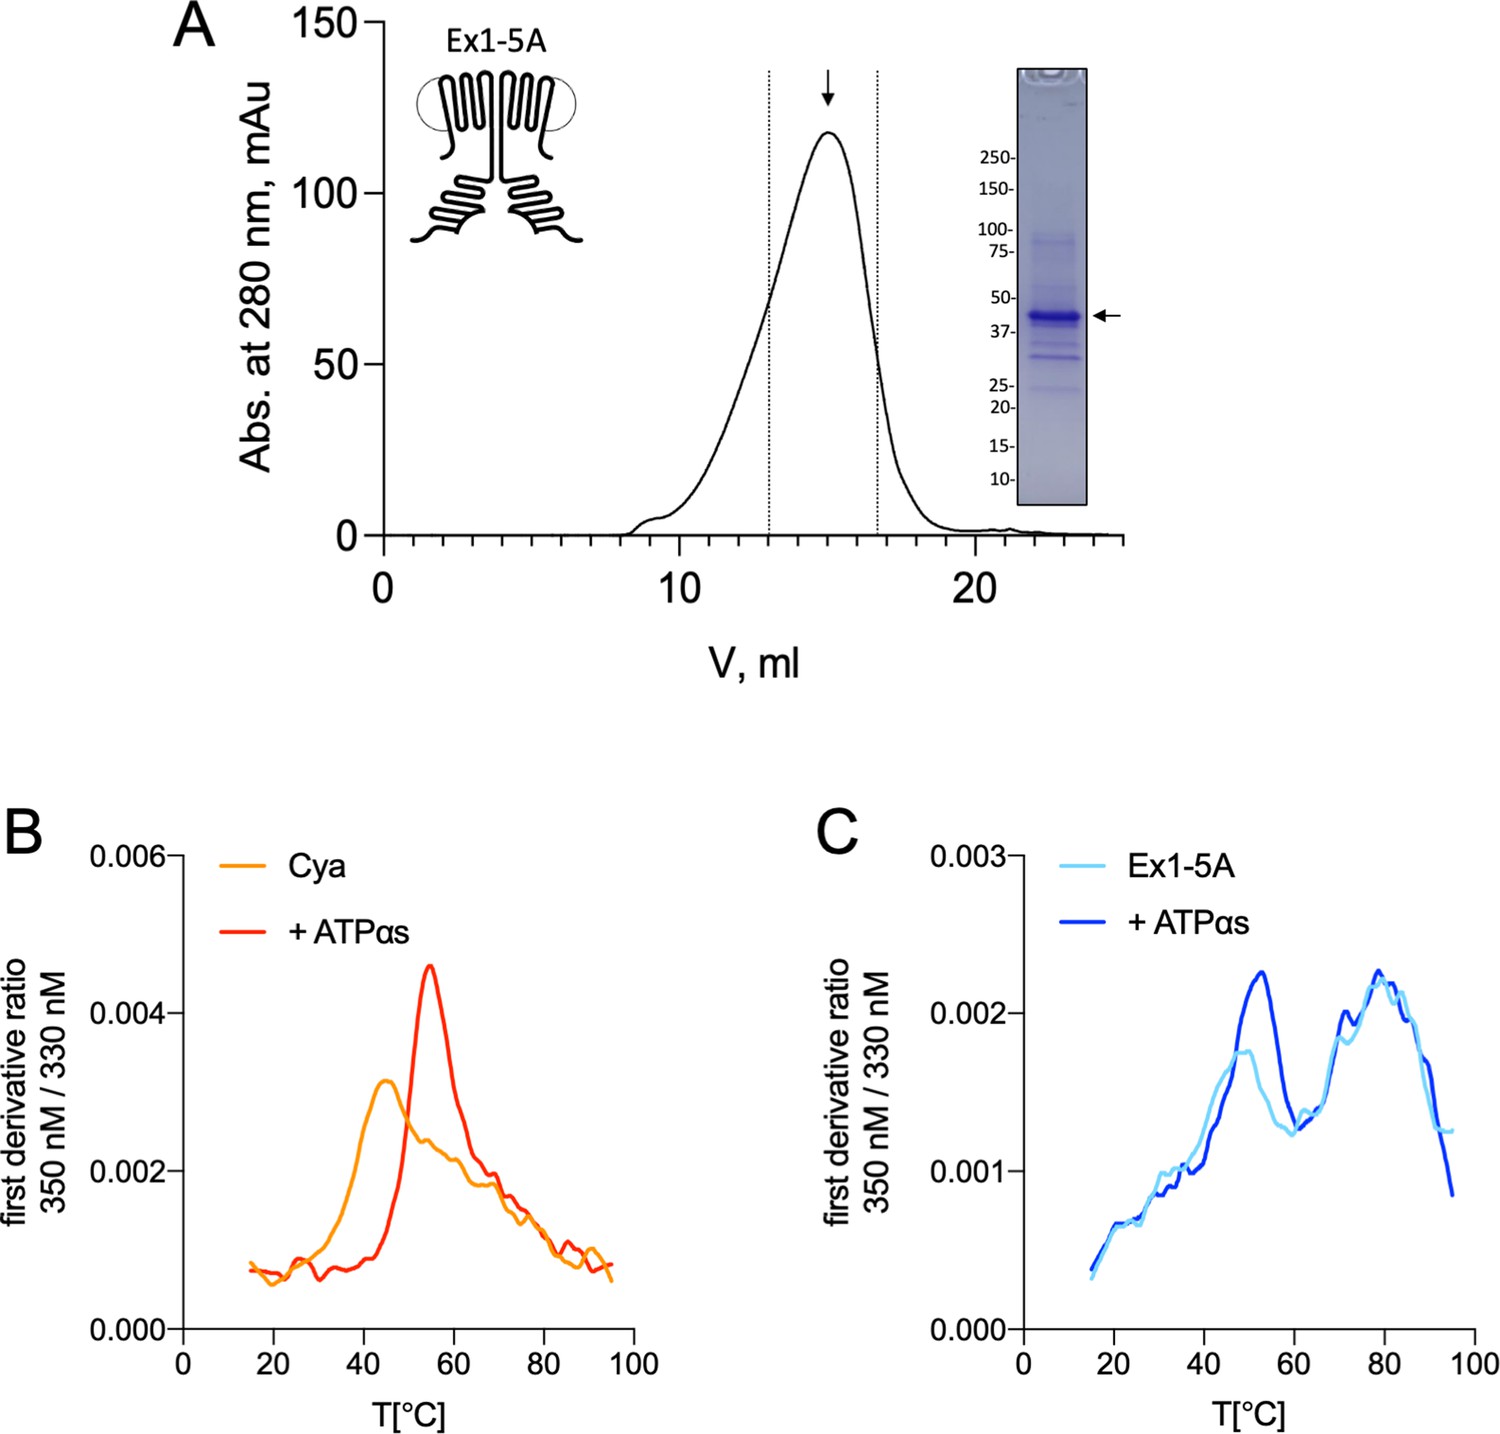
Purification and stability of Cya mutant Ex1-5A.
(A) Size-exclusion chromatography (SEC) and sodium dodecyl sulfate–polyacrylamide gel electrophoresis (SDS–PAGE) of Ex1-5A. The dashed lines indicate the selected fractions of the purified protein sample. (B) Analysis of protein thermostability, performed using Prometheus Panta instrument, shows that wild-type Cya has an apparent melting temperature of ~42°C, and is stabilized by addition of the nucleotide analogue (ATPαS), resulting in the shift of the first derivative ratio (350/330 nm) peak towards higher temperatures. Here, a representative experiment is shown (the average Tm values are shown in Figure 5). (C) Same as in B, for Ex1-5A mutant. The mutant displays a different melting profile, with additional peaks appearing in the high temperature range. Addition of ATPαS shifts the first peak towards high temperatures.
Figure 5—figure supplement 2
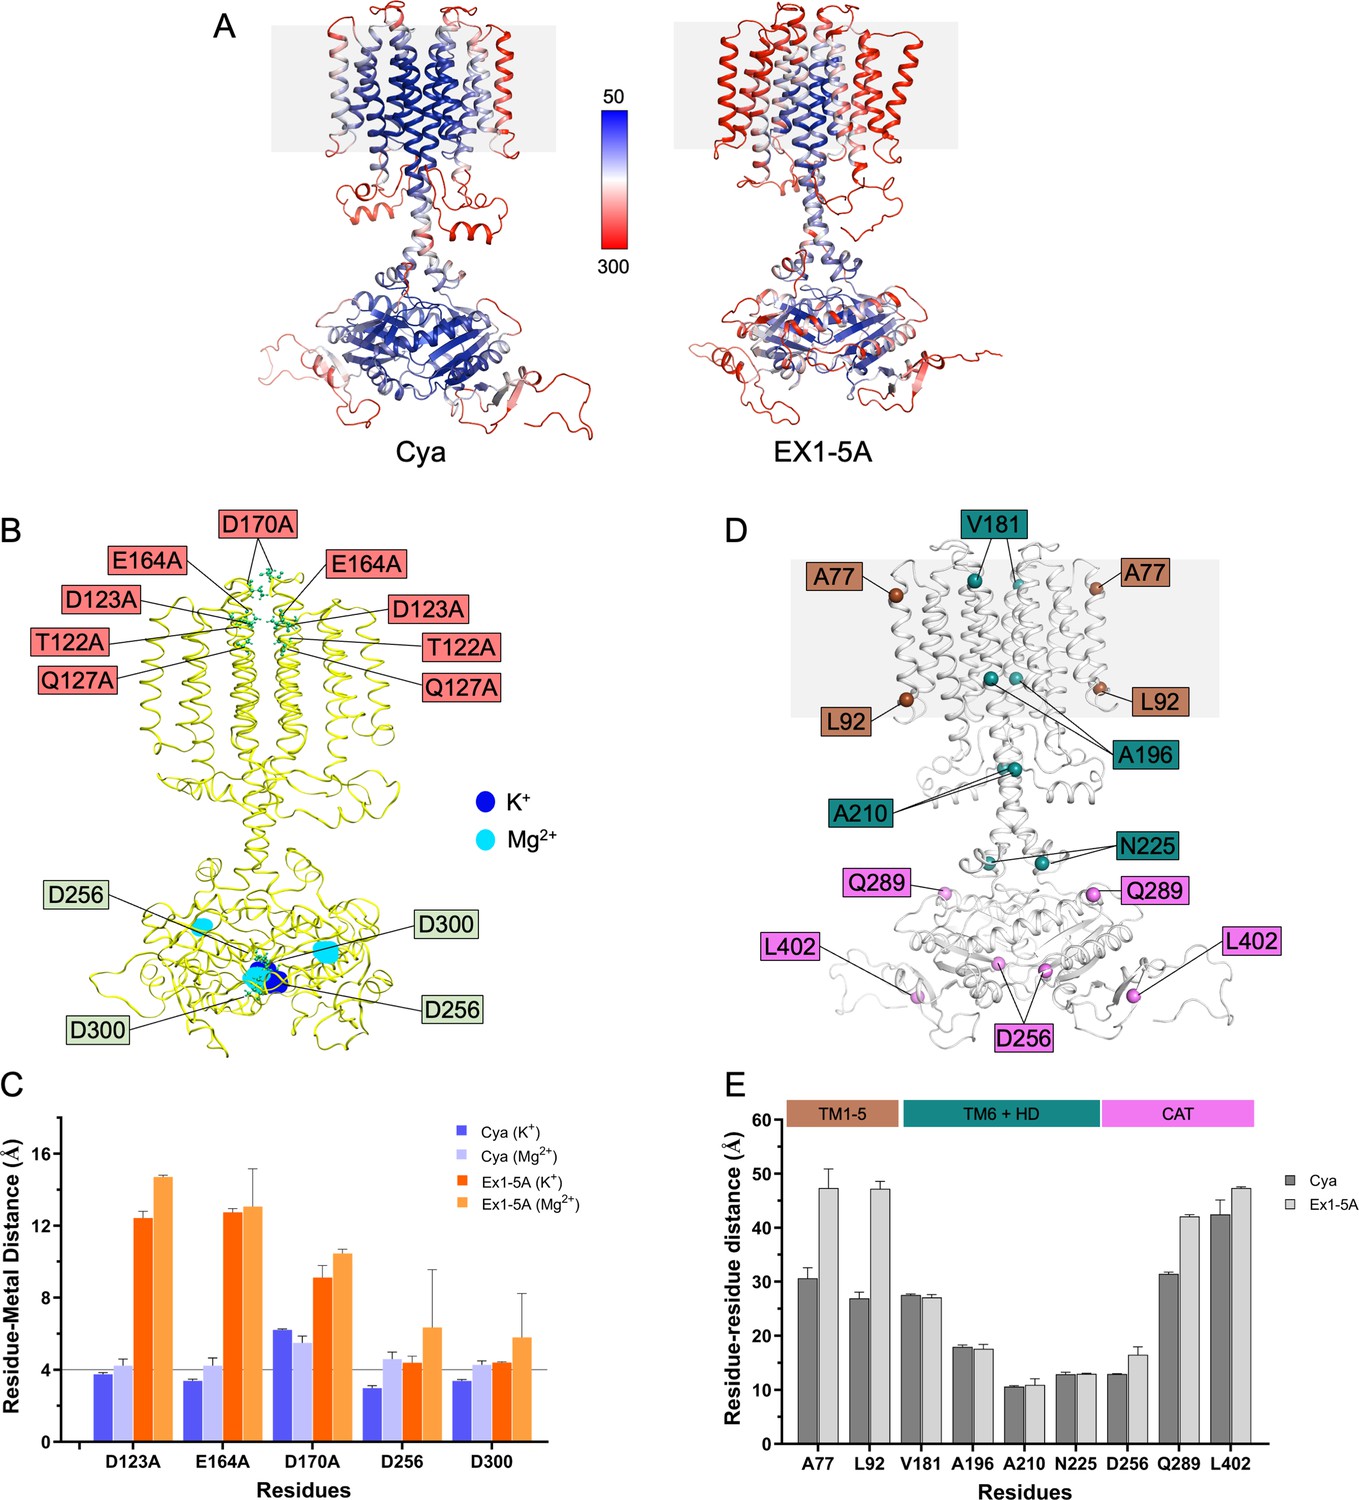
Molecular dynamics (MD) simulations of Cya mutant Ex1-5A.
(A) Comparison of B factors of Cya and Ex1-5A mutant derived from MD simulations. (B) Overlay of potassium (blue) and magnesium (cyan) occupancy maps from independent simulations fitted on the reference structure (yellow) showing mutated ex1 site residues and residues involved in metal cofactor biding in catalytic domain. (C) Average distances between key negatively charged residues (or equivalent residues in Ex1-5A mutant) and K+ (light blue) or Mg2+ ions (cyan) during the course of a simulation. (D, E) Comparison of average distances between key residues in Cya monomers. Ex1-5A mutant exhibit increased average distances between D256 residue of each monomer, suggesting the existence of partially open catalytic domain in Ex1-5A mutant.
Figure 6
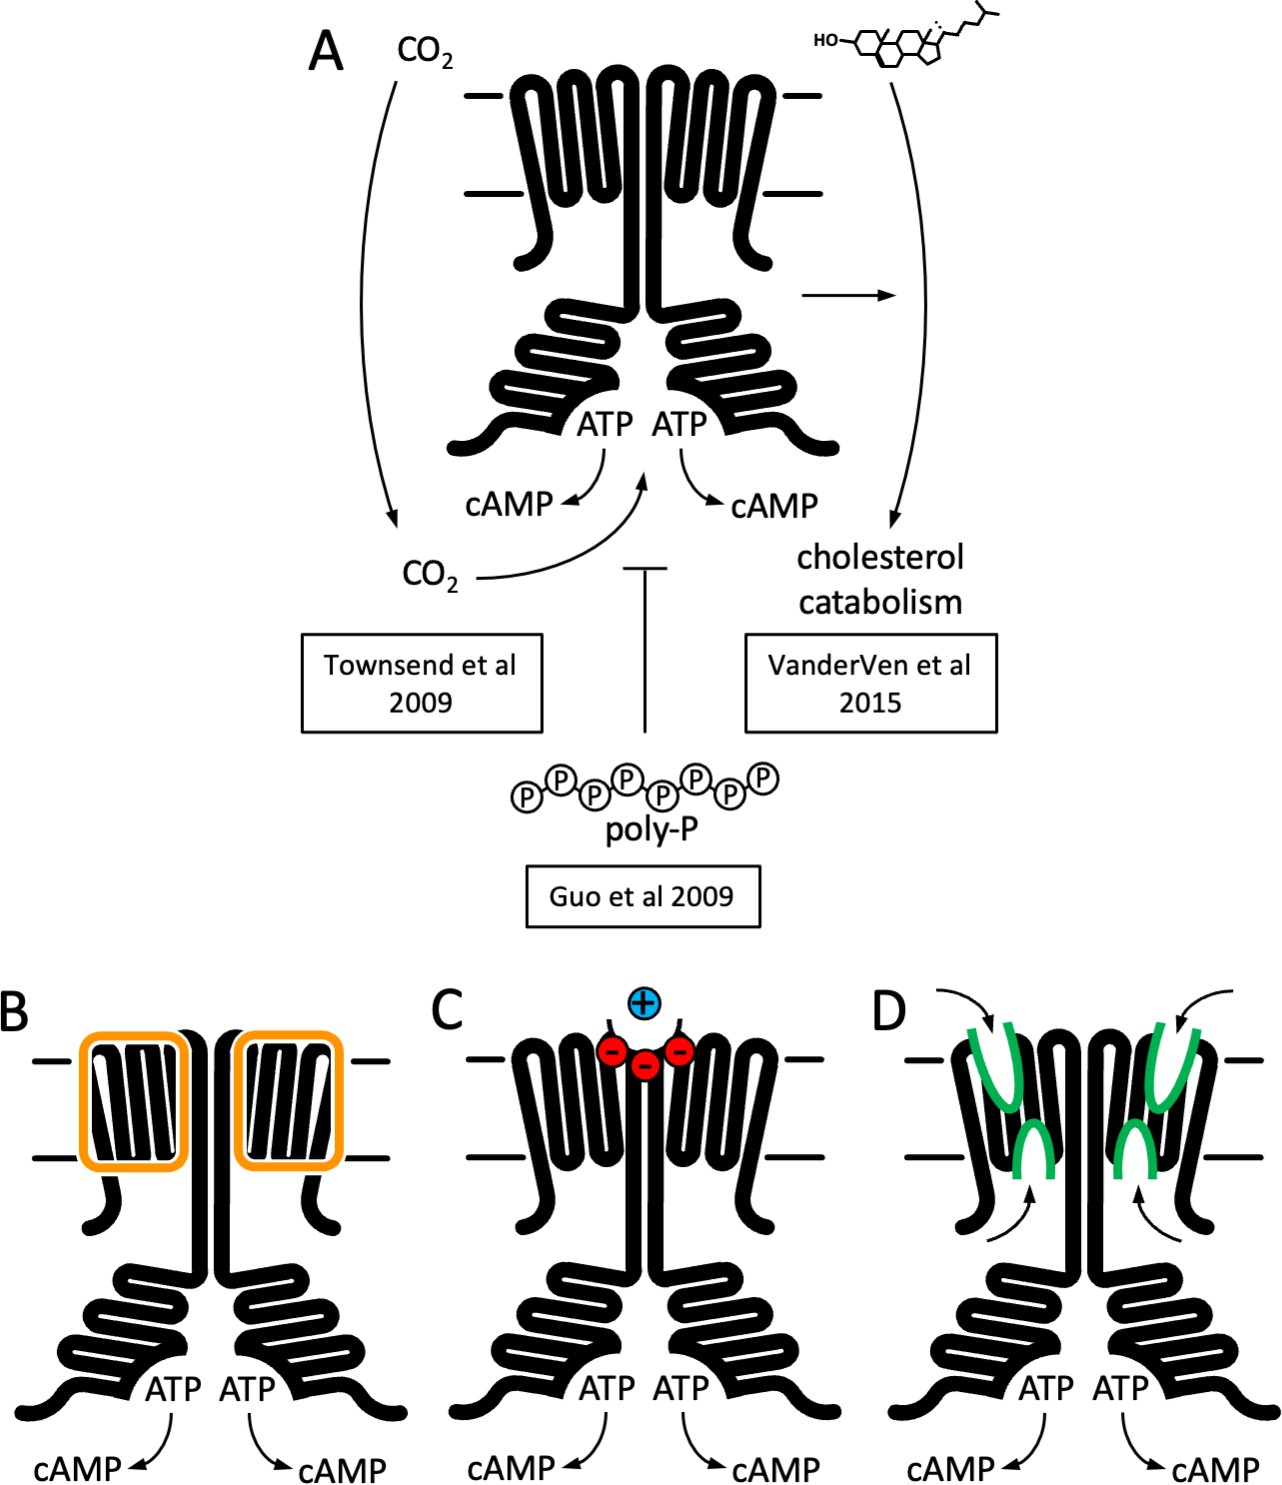
Function and structure of Rv1625c/Cya.
(A) Known regulators and cellular functions of Cya. Insights into the function of the membrane domain of Cya, with new functions of the transmembrane (TM) domain suggested by the cryo-EM structure: a stabilizer of the cytosolic domain assembly (B), a receptor for positively charged agents via the Ex1 site at the Cya dimer interface (C), and a receptor of yet unknown ligands via sites Ex2/Cy1/Cy2 (D).
Additional files
-
Supplementary file 1
Cryo-EM analysis and statistics.
- https://cdn.elifesciences.org/articles/77032/elife-77032-supp1-v3.docx
-
Supplementary file 2
X-ray data analysis and statistics.
- https://cdn.elifesciences.org/articles/77032/elife-77032-supp2-v3.docx
-
Transparent reporting form
- https://cdn.elifesciences.org/articles/77032/elife-77032-transrepform1-v3.pdf
Download links
A two-part list of links to download the article, or parts of the article, in various formats.
Downloads (link to download the article as PDF)
Open citations (links to open the citations from this article in various online reference manager services)
Cite this article (links to download the citations from this article in formats compatible with various reference manager tools)
Structure of Mycobacterium tuberculosis Cya, an evolutionary ancestor of the mammalian membrane adenylyl cyclases
eLife 11:e77032.
https://doi.org/10.7554/eLife.77032


