Control of craniofacial development by the collagen receptor, discoidin domain receptor 2
- Department of Periodontics & Oral Medicine, University of Michigan School of Dentistry, United States
- Center for Organogenesis and Trauma, Department of Surgery, University of Texas Southwestern, United States
- Division of Cardiovascular Medicine, University of California, San Diego, United States
- Department of Diagnostic and Biomedical Sciences, University of Texas Health Science Center at Houston School of Dentistry, United States
- Department of Prosthetic Dental Sciences, College of Dentistry, King Saud University, Saudi Arabia
- Department of Biologic & Materials Science, University of Michigan School of Dentistry, United States
- Department of Biological Chemistry, School of Medicine, University of Michigan, United States
- Department of Biomedical Engineering, University of Michigan, United States
Figures
Figure 1 with 1 supplement
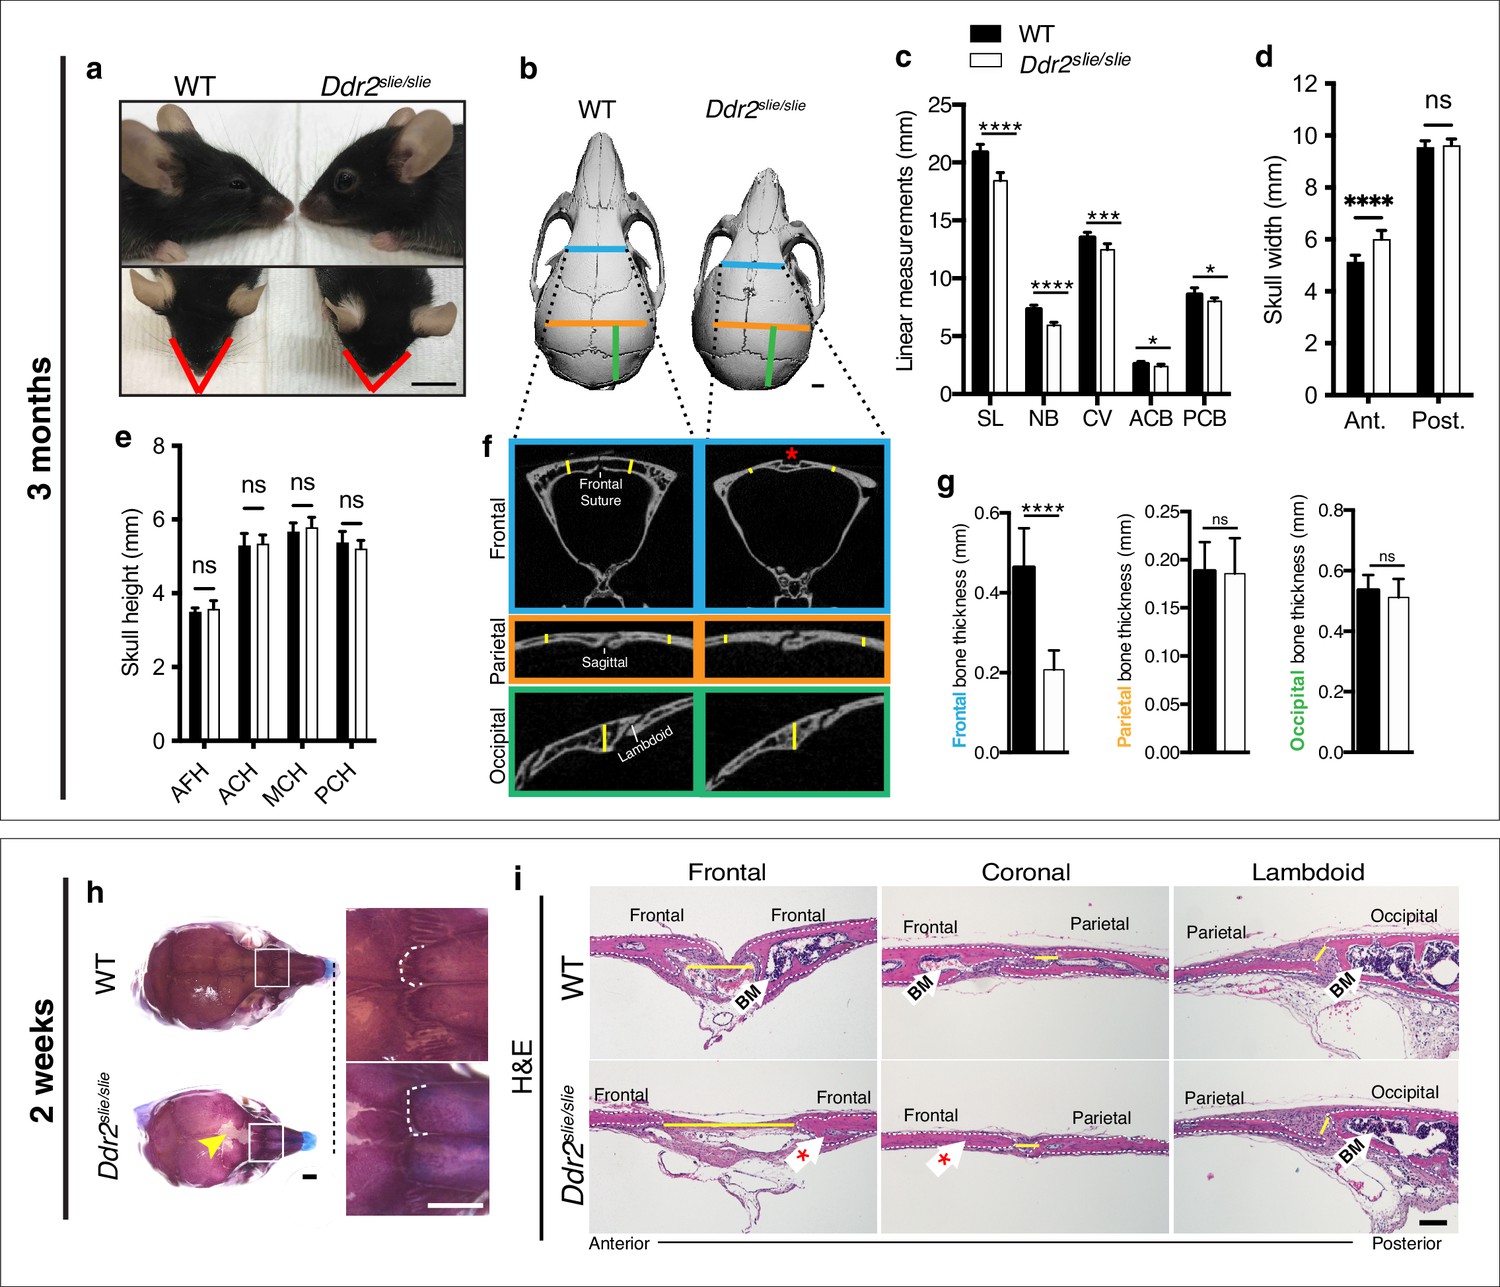
Ddr2 deficiency results in impaired anterior-posterior skull growth with abnormal frontal bone and suture formation.
WT and Ddr2slielsile mice were compared at 3 months (a–g) and 2 weeks (h,i). (a-c) Short snout, and reduced skull length in Ddr2slielsile mice. (a) Side (upper) and top (lower) head views of 3-month-old Ddr2slie/slie mice and WT littermates. Scale bar: 1 cm. (b) 3D rendering of μCT scans of 3-month-old skulls. Scale bar: 1 mm. (c) Linear measurements along anteroposterior axis of skulls, where SL: skull length; NB: nasal bone; CV: calvaria vault; ACB: anterior cranial base; PCB: posterior cranial base. (d) Quantification of anterior (ant.) and posterior (post.) skull width showed a selective increase only in the anterior skull of Ddr2slie/slie vs WT mice. (e) No changes were observed in skull height at any of the regions measured (anterior cranial height, ACH; middle cranial height, MCH; posterior cranial height, PCH). (f,g) μCT scans of calvarial bones and quantification showing a significant reduction of frontal bone (blue) in 3-month-old Ddr2slie/slie mice in the absence of changes in parietal (orange) or occipital (green) calvarial bones. Note frontal suture defect in Ddr2slie/slie mice (red asterisk). Data are presented as mean ± SD. (n=10). *p<0.01, **p<0.01, ***p<0.001, ****p<0.0001, ns, not significant, two-tailed unpaired t test. (h) Alcian blue and Alizarin red staining of 2-week-old mouse skull whole mounts shows delayed frontal suture formation (yellow arrow) and abnormal suture morphology (white dotted lines) in Ddr2slie/slie mice compared with WT. Boxed region is shown in higher magnification; right. Scale bar: 100 μm. (i) Hematoxylin and eosin (H&E) staining shows open frontal sutures in Ddr2slie/slie, but transverse sutures, such as coronal and lambdoid were not affected (highlighted by yellow lines). Ddr2slie/slie calvariae also had a smaller bone marrow cavity (Bm, white arrows) compared with WT. Frontal suture, coronal section; transverse sutures, sagittal section. Scale bar: 100 μm.
-
Figure 1—source data 1
Skull linear measurements in Wildtype versus Ddr2 knockout mice.
- https://cdn.elifesciences.org/articles/77257/elife-77257-fig1-data1-v4.xlsx
Figure 1—figure supplement 1
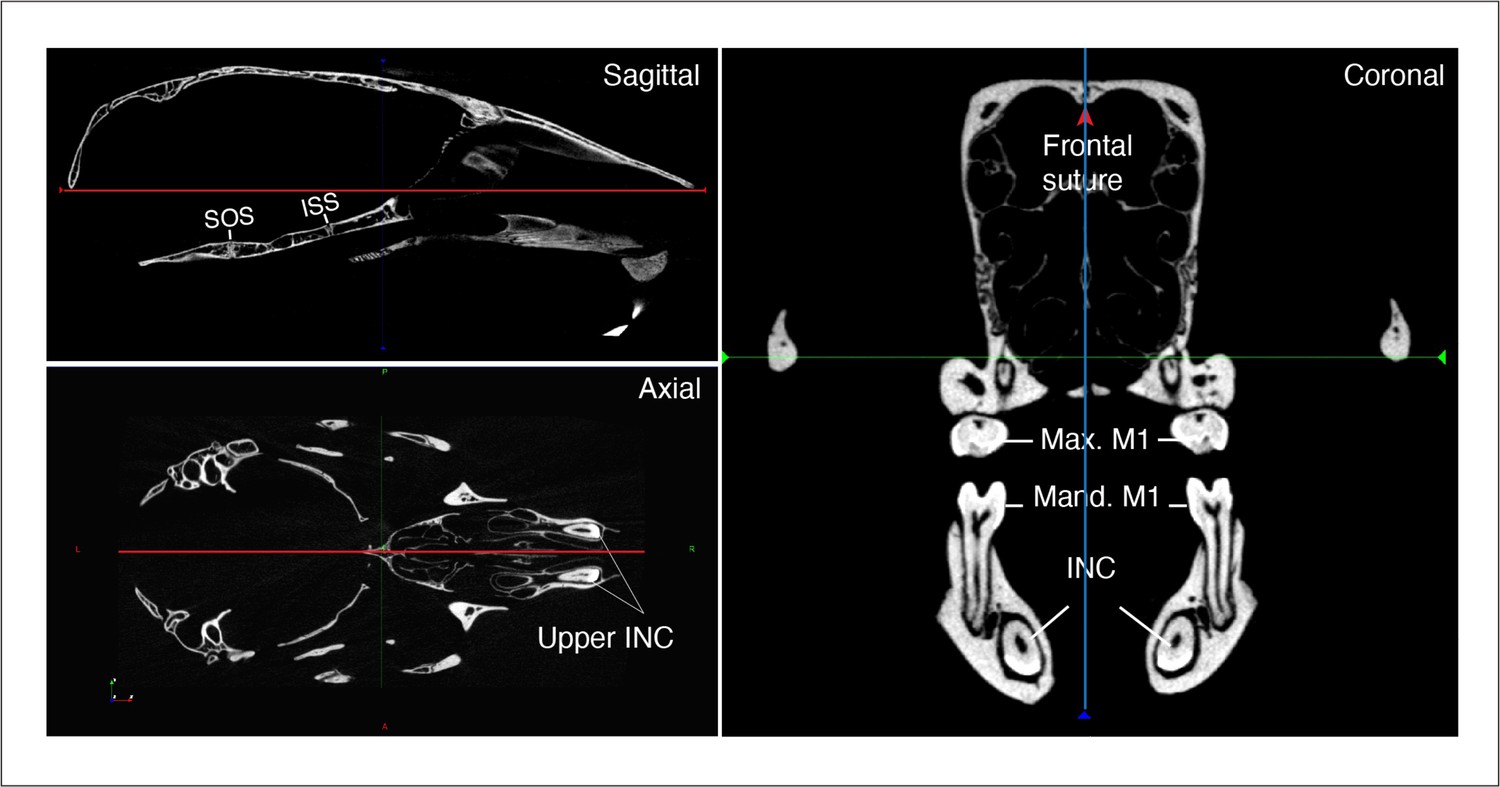
Orientation of skulls in sagittal, axial, and coronal planes.
Max: Maxillary; Mand: Mandibular; M1: first molar; INC: Incisor; ISS: Intersphenoid synchondrosis; SOS: Spheno-occipital synchondrosis.
Figure 2 with 1 supplement
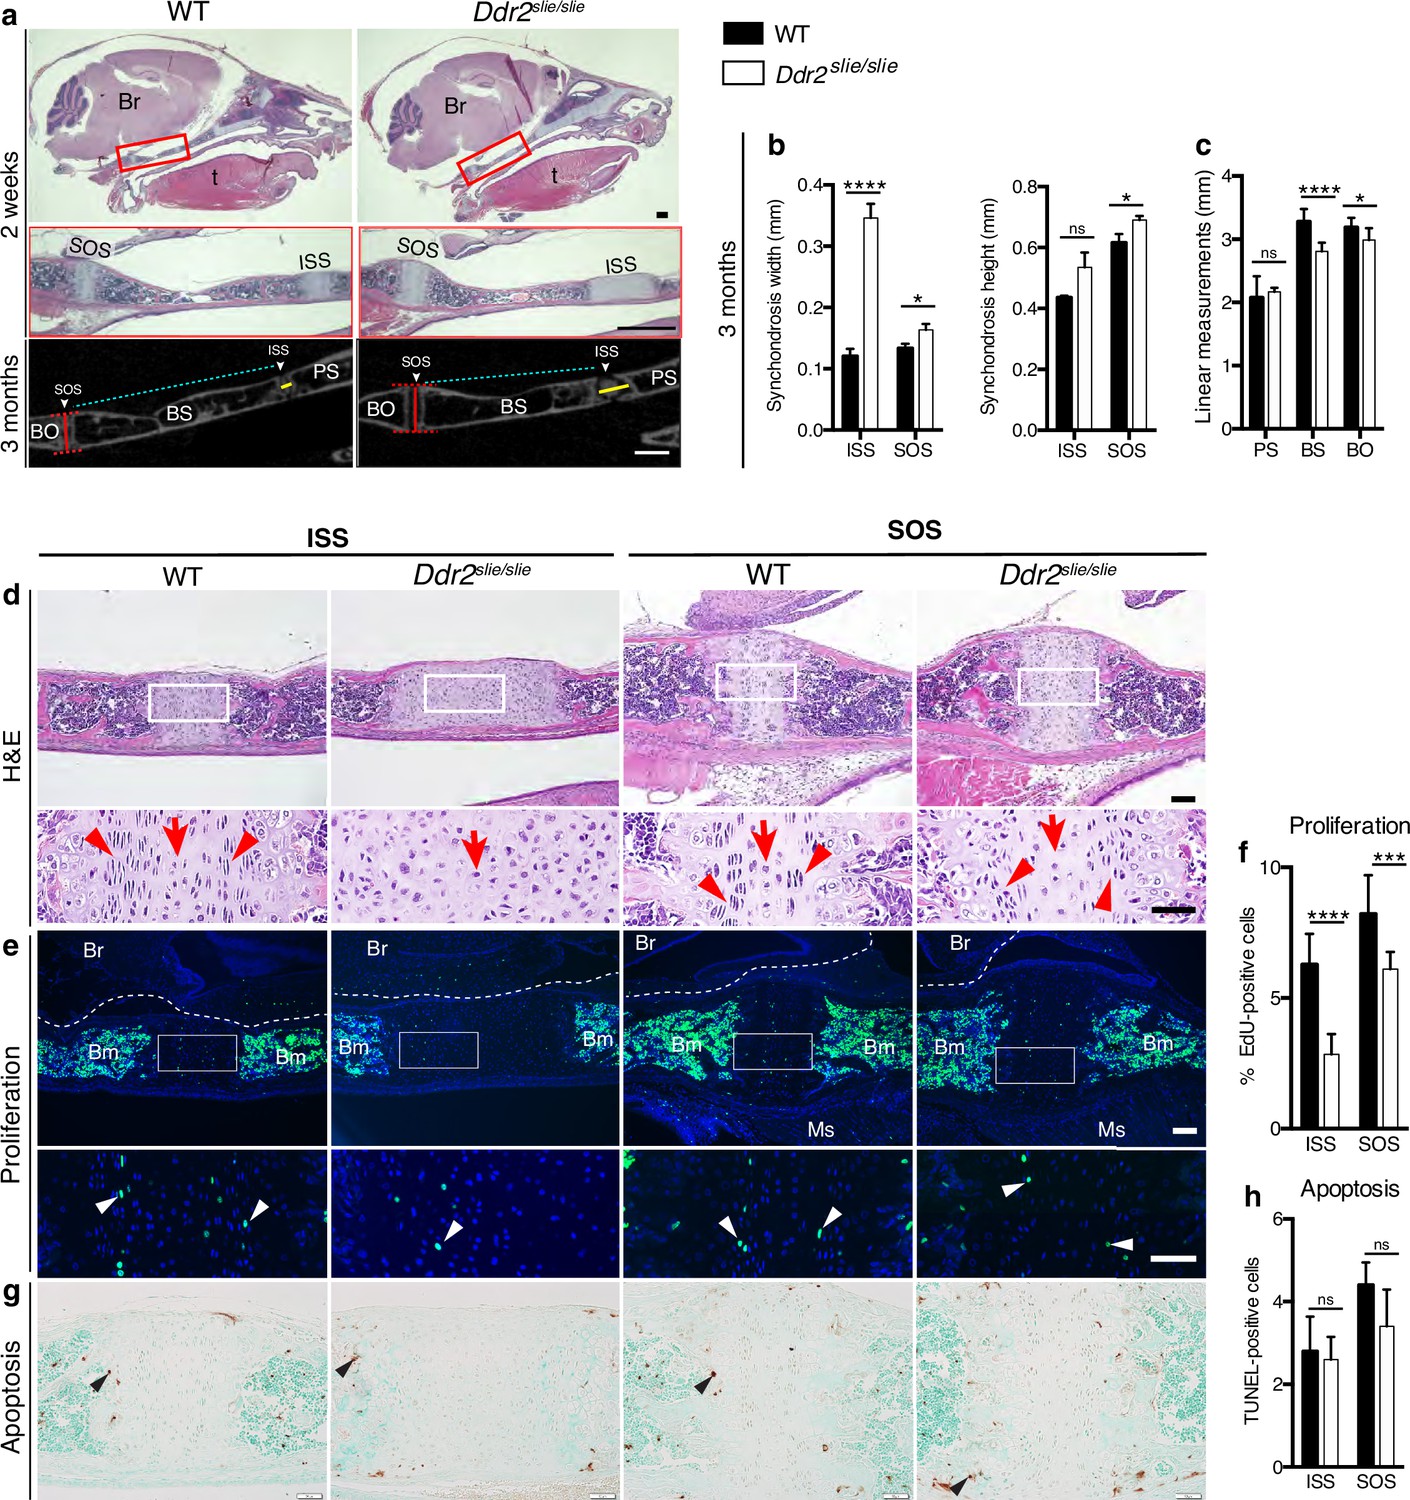
Cranial base hypoplasia due to chondrocyte disorganization and reduced chondrocyte proliferation in Ddr2-knockout synchondroses.
(a) H&E staining (upper) and μCT scans (lower) of WT and Ddr2slie/slie skulls showing wide cranial base synchondroses. Scale bar: 500 μm. Boxed region (red) is shown in higher magnification. Br: Brain; t: Tongue. ISS: Intersphenoid synchondrosis; SOS: Spheno-occipital synchondrosis; PS: Presphenoid bone; BS: Basisphenoid bone; BO: Basis-occipital bone. In μCT scan of skulls (lower), arrowheads point to cranial base synchondroses; yellow and red lines highlight the width and height of synchondroses; respectively (Quantification is shown in b). Cyan lines highlight shortening of basisphenoid bone between ISS and SOS in Ddr2slie/slie vs WT mice (Quantification of cranial base bone lengths is shown in c); Data are presented as mean ± SD. (n=10). *p<0.01, ****p<0.0001, ns, not significant, two-tailed unpaired t test. (d), H&E staining of ISS and SOS sections showing loss of columnar organization of proliferative chondrocytes (red arrowheads) in Ddr2slie/slie mice at 2 weeks of age. Red arrows point to resting chondrocyte zone. Boxed region is shown in higher magnification. Scale bar: 100 μm. (e) EdU staining (green) of ISS and SOS sections showing reduction in EdU + cells (white arrowheads) in Ddr2slie/slie mice compared with WT littermates. Boxed region is shown in higher magnification. Scale bar: 100 μm. Br: Brain, Ms: Muscle; Bm: Bone marrow. White dotted lines define the ventral surface of brain. (f) Percentage of EdU + cells in ISS and SOS of WT and Ddr2slie/slie mice. (g) TUNEL staining (brown, black arrowheads) shows no changes in apoptotic levels between mice Ddr2slie/slie and WT. Cell nuclei were stained with methyl green (green). Scale bar: 50 μm. (h) Quantification of TUNEL-positive cells in cranial base synchondroses. Data in are presented as mean ± SD (panel f, n=5-7; h, n=5). ***p<0.001, ****p<0.0001, ns, not significant, two-tailed unpaired t test.
-
Figure 2—source data 1
Cranial base linear measurements in Wildtype versus Ddr2 knockout mice.
- https://cdn.elifesciences.org/articles/77257/elife-77257-fig2-data1-v4.xlsx
-
Figure 2—source data 2
Proliferation (EdU labeling) and apoptosis (TUNEL assay) in Wildtype versus Ddr2 knockout mice.
- https://cdn.elifesciences.org/articles/77257/elife-77257-fig2-data2-v4.xlsx
Figure 2—figure supplement 1
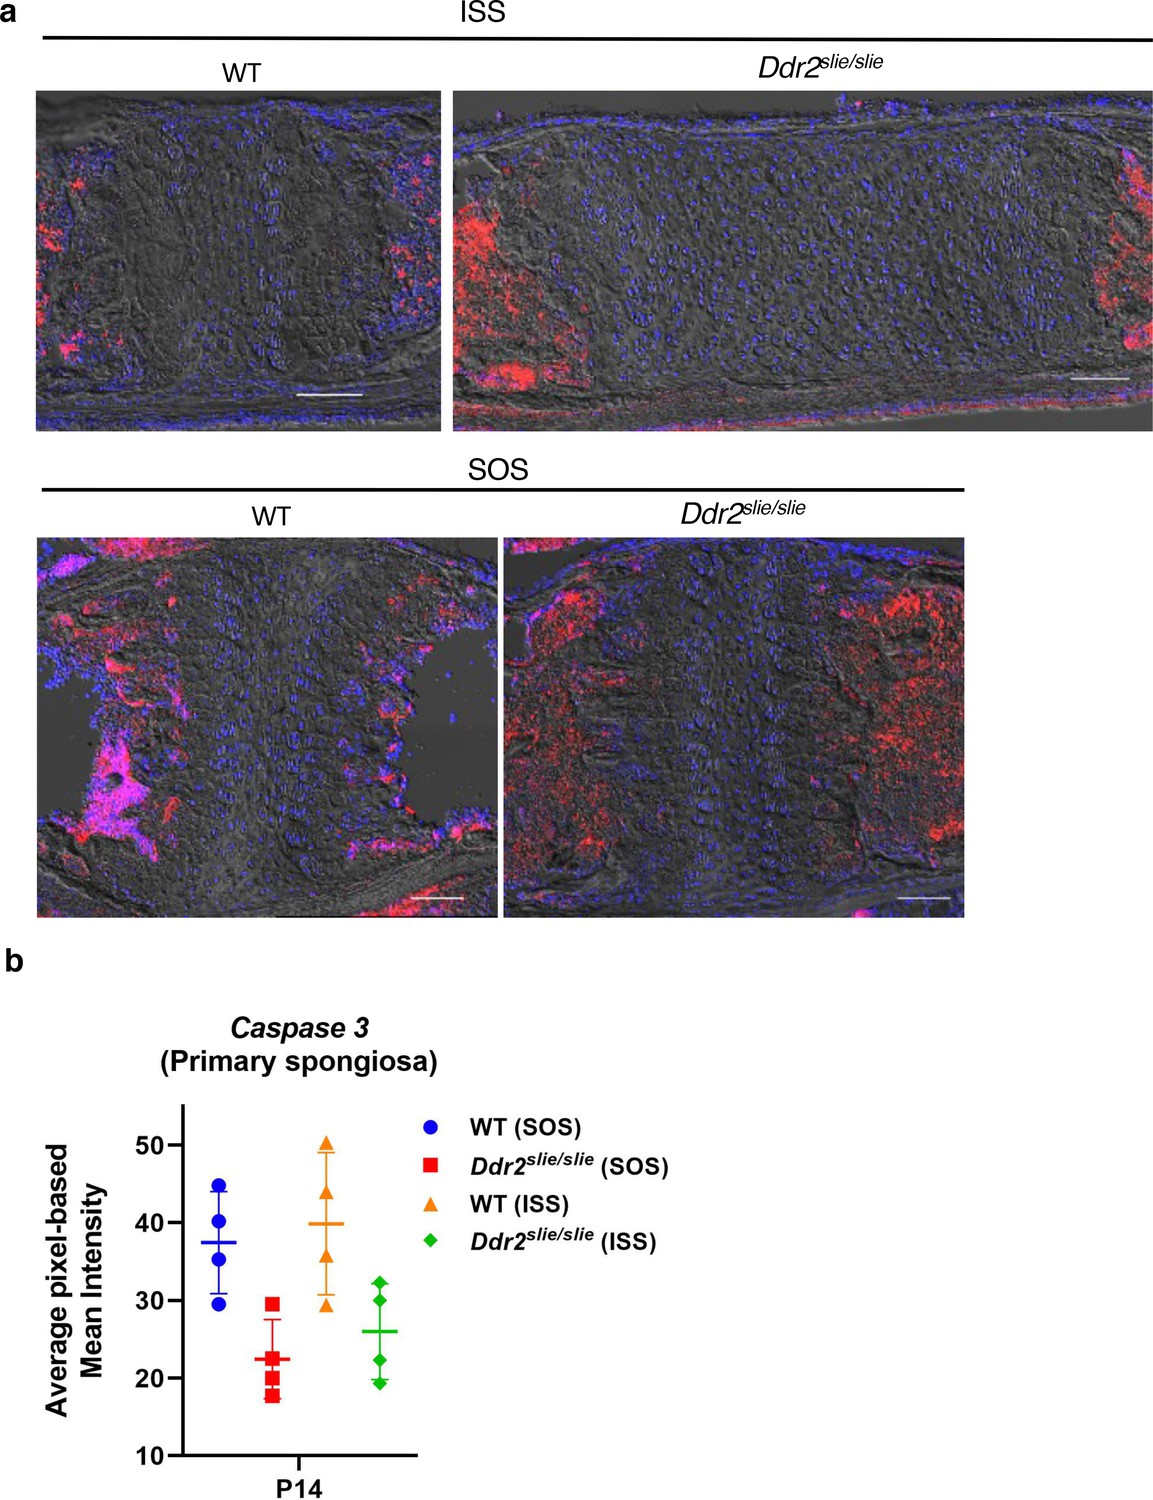
No change in levels of cleaved caspase 3 levels in wild-type versus Ddr2slie/slie mice.
(a) Localization of cleaved caspase 3 in ISS and SOS in 2-week-old mice using immunofluorescence. (b), quantitation of IF staining. Scale bar, 100 um.
Figure 3 with 2 supplements
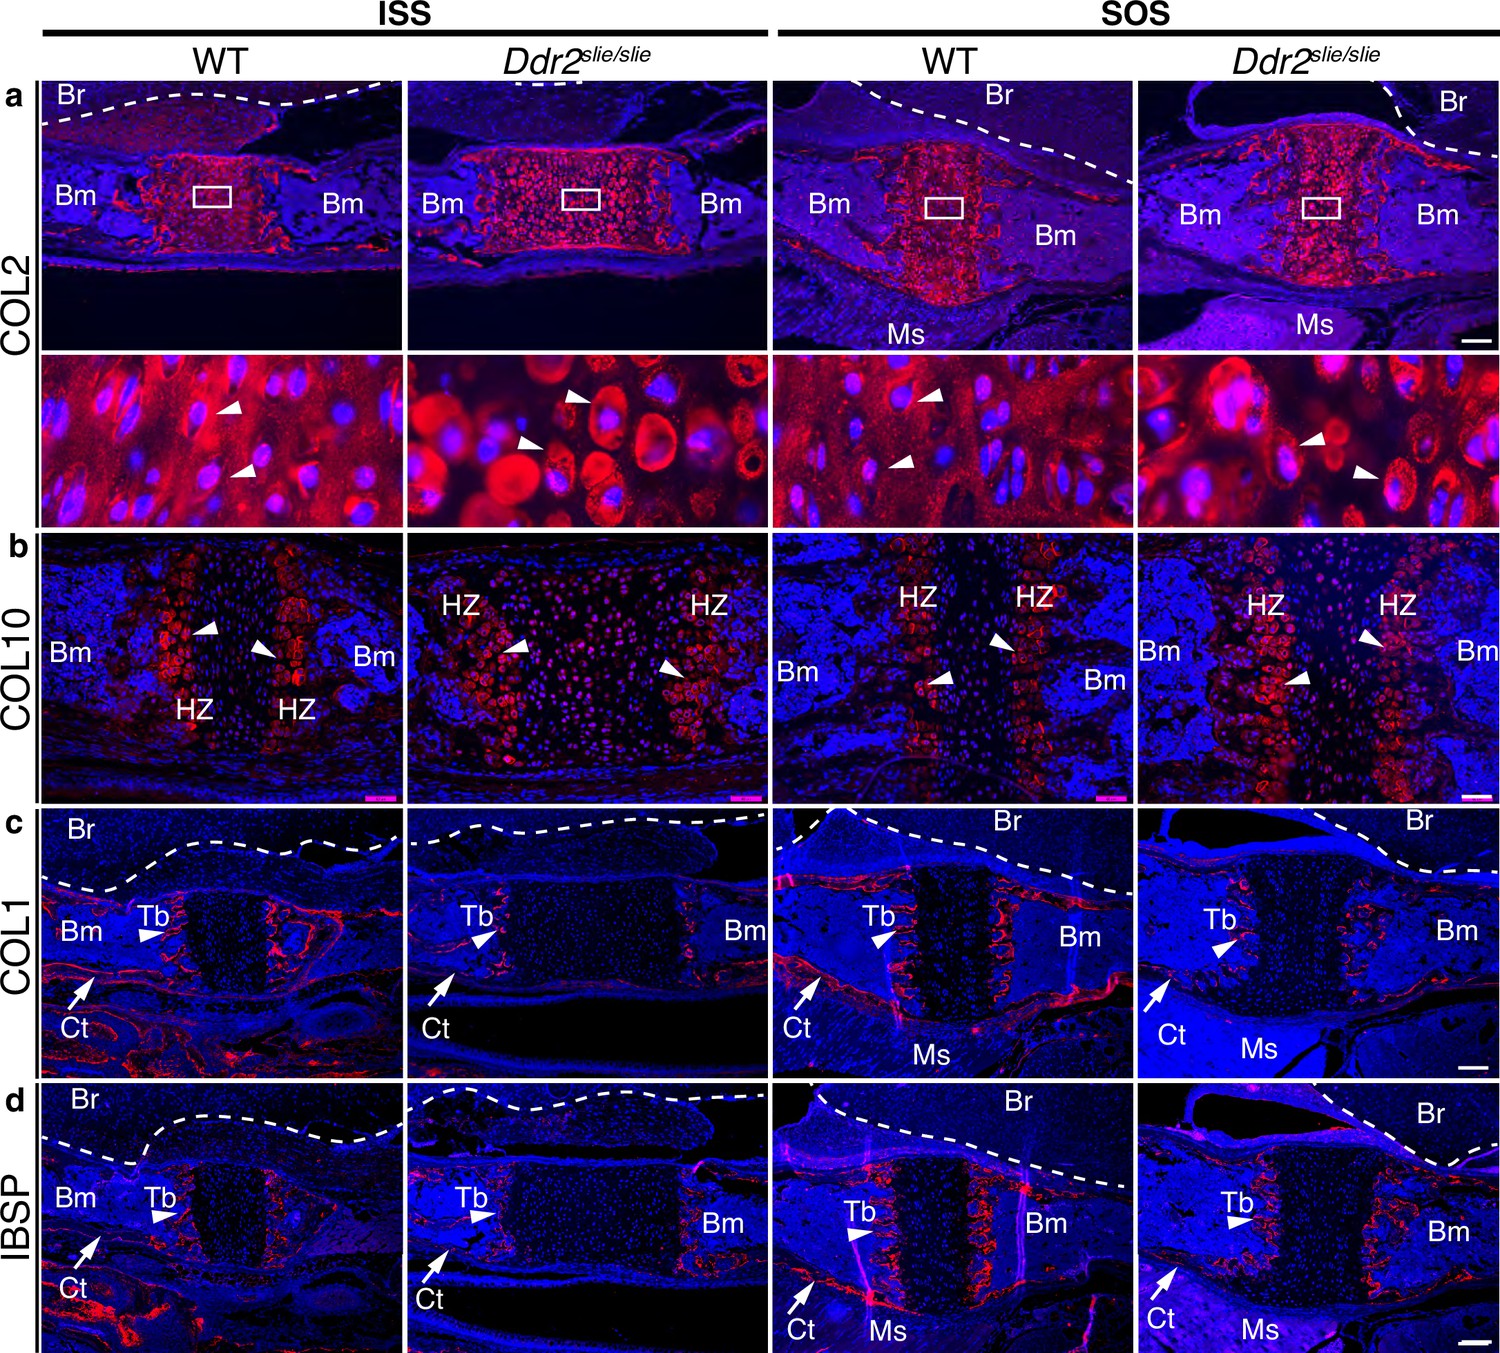
ECM defects in Ddr2-deficient synchondroses.
(a-d) Immunofluorescent staining of ISS and SOS sections from 2-week-old WT and Ddr2slie/slie synchondroses. (a) Representative images of COL2 immunostaining (red) in ISS and SOS showing homogenous distribution around chondrocytes in WT synchondroses, while Ddr2slie/slie mice showed uneven, ring-like immunostaining around chondrocytes (white arrowheads). Boxed region is shown in higher magnification (bottom). Scale bar: 200 μm. (b) Immunofluorescent images of COL10 immunostaining in the hypertrophic zone (HZ) of synchondroses showing no major changes in staining distribution between WT and Ddr2slie/slie mice. Scale bar: 50 μm. (c) Immunofluorescence images showing COL1 (red) staining in trabecular (arrowheads) and cortical (arrows) bones of the cranial base in WT and Ddr2slie/slie mice. Scale bar: 200 μm. (d) Immunofluorescent images showing IBSP (red) in trabecular (arrowheads) and cortical (arrows) bones of cranial base is decreased in Ddr2slie/slie synchondrosis compared with WT littermates. See Figure 3—figure supplement 2 for quantitation of IF staining. Scale bar: 200 μm. Cell nuclei were stained with DAPI (blue) in a–d. Bm: Bone marrow; Br: Brain; Tb: Trabecular bone; Ct: Cortical bone; Ms: Muscle.
Figure 3—figure supplement 1
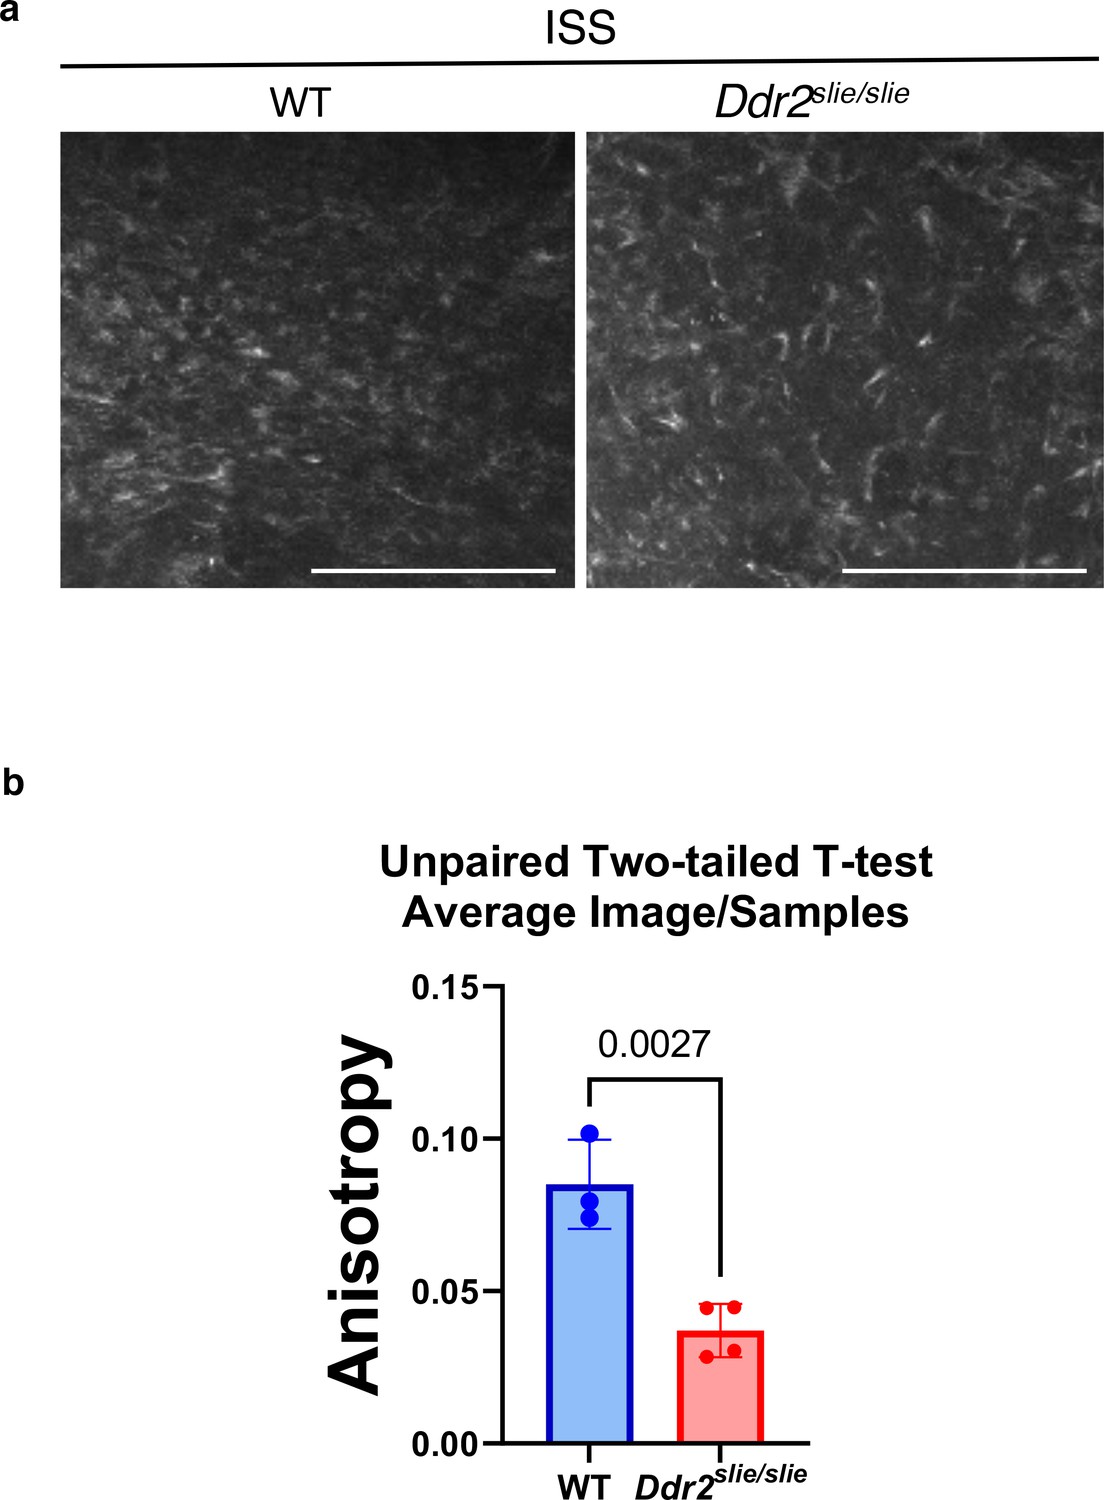
Ddr2 deficiency is associated with loss of collagen organization in the ISS of Ddr2slie/slie mice.
(a) Second harmonic generation imaging of fibrillar collagen in the ISS resting zone of 2-week-old WT versus Ddr2slie/slie mice. Scale bar, 100 µm (b) anisotropy was measured using ImageJ FibrilTool as described in Methods. For each sample, 3 or 4 ROIs were selected within the central ISS resting zone for analysis and averaged (n=3 or 4/group). Bars are mean +/-SEM.
Figure 3—figure supplement 2
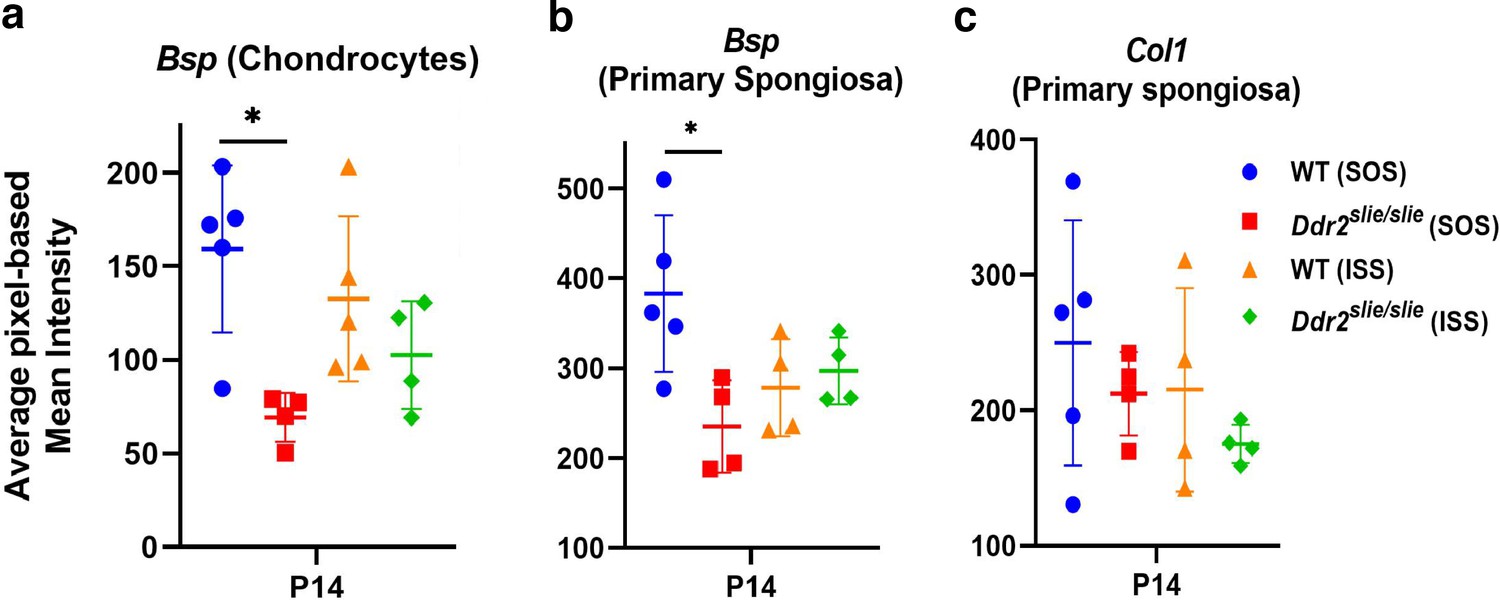
Quantitation of Ibsp (Bsp) and Col I immunofluorescence in WT and Ddr2slie/slie mice.
(a) Ibsp in hypertrophic chondrocyte layers. (b) Ibsp in primary spongiosa. Note: Ibsp is significantly lower only in the SOS. (c) No change in Col I in the primary spongiosa. Data are presented as mean ± SD. *p<0.05.
Figure 4 with 1 supplement
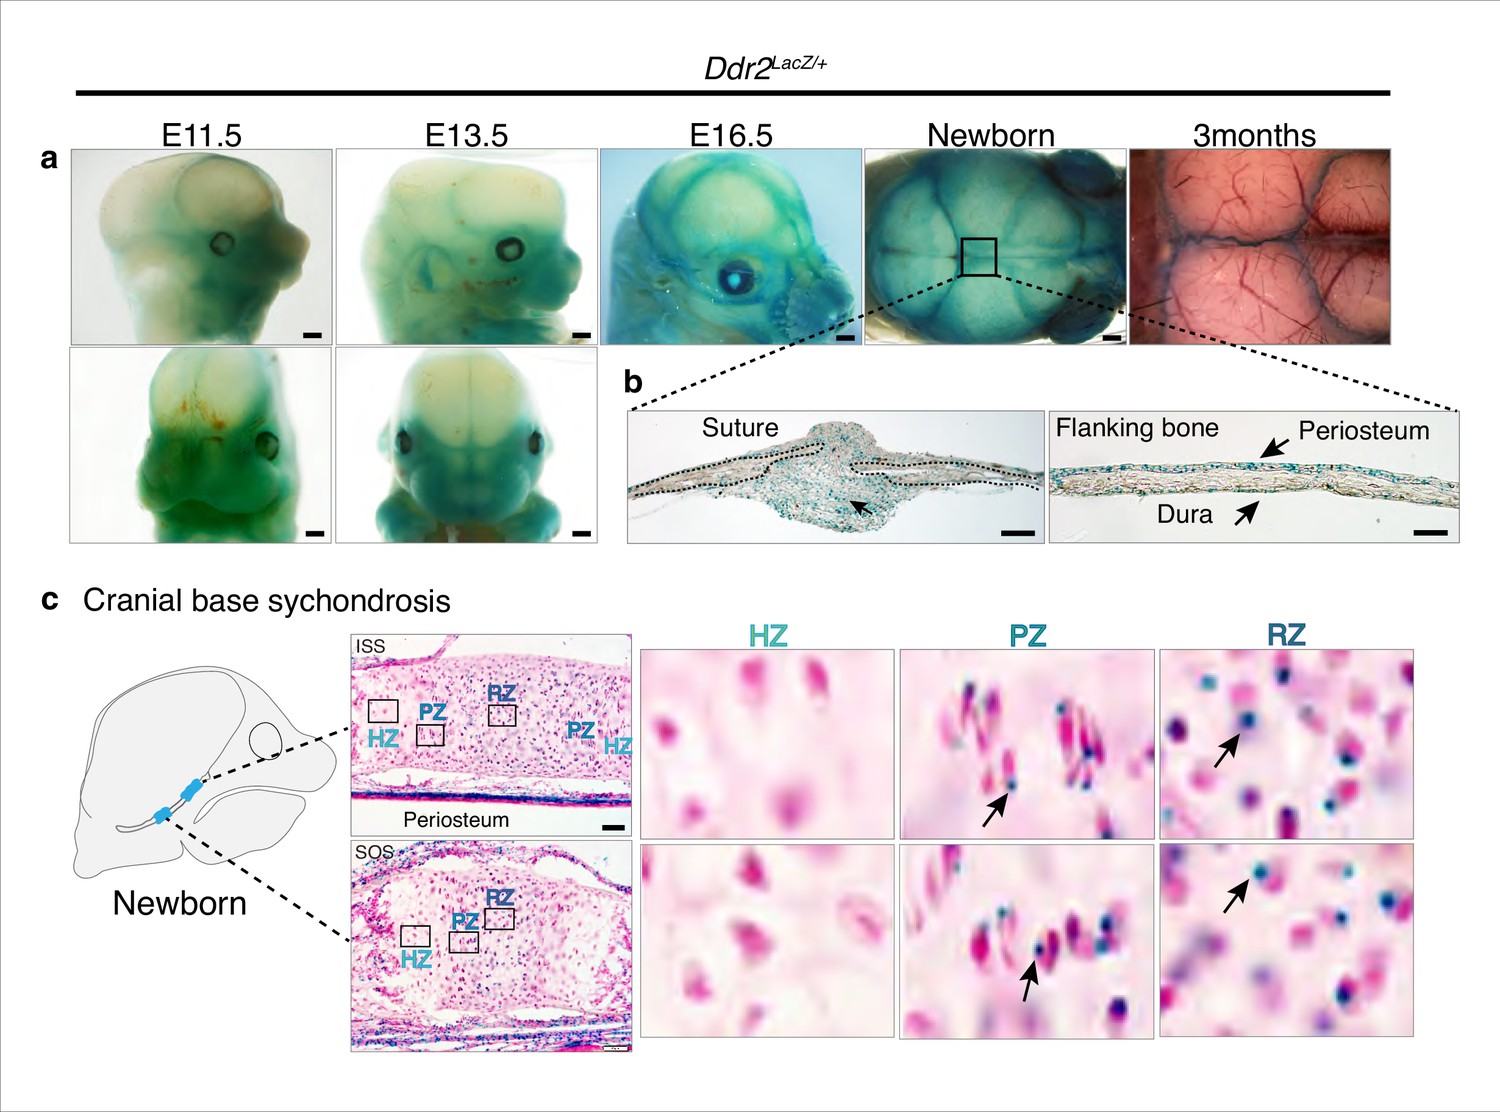
Ddr2 expression in craniofacial skeleton.
(a) Whole-mount X-gal staining (green) of Ddr2Lacz/+ skulls showing of Ddr2 expression in midfacial region, cranial vault, and cranial sutures. Scale bar: 50 μm. (b) X-gal staining of cryostat sections of calvaria from newborn mice showing expression in suture mesenchyme, periosteum, and dura mater of flanking bones. Scale bar: 100 μm, left and 50 μm, right. (c) X-gal staining of cryostat section of ISS (top) and SOS (bottom) from newborn mice revealing Ddr2 expression in resting and proliferative chondrocyte zones, but low or undetected in terminal hypertrophic chondrocytes. Boxed regions are shown in higher magnification, right. Scale bar: 50 μm.
Figure 4—figure supplement 1
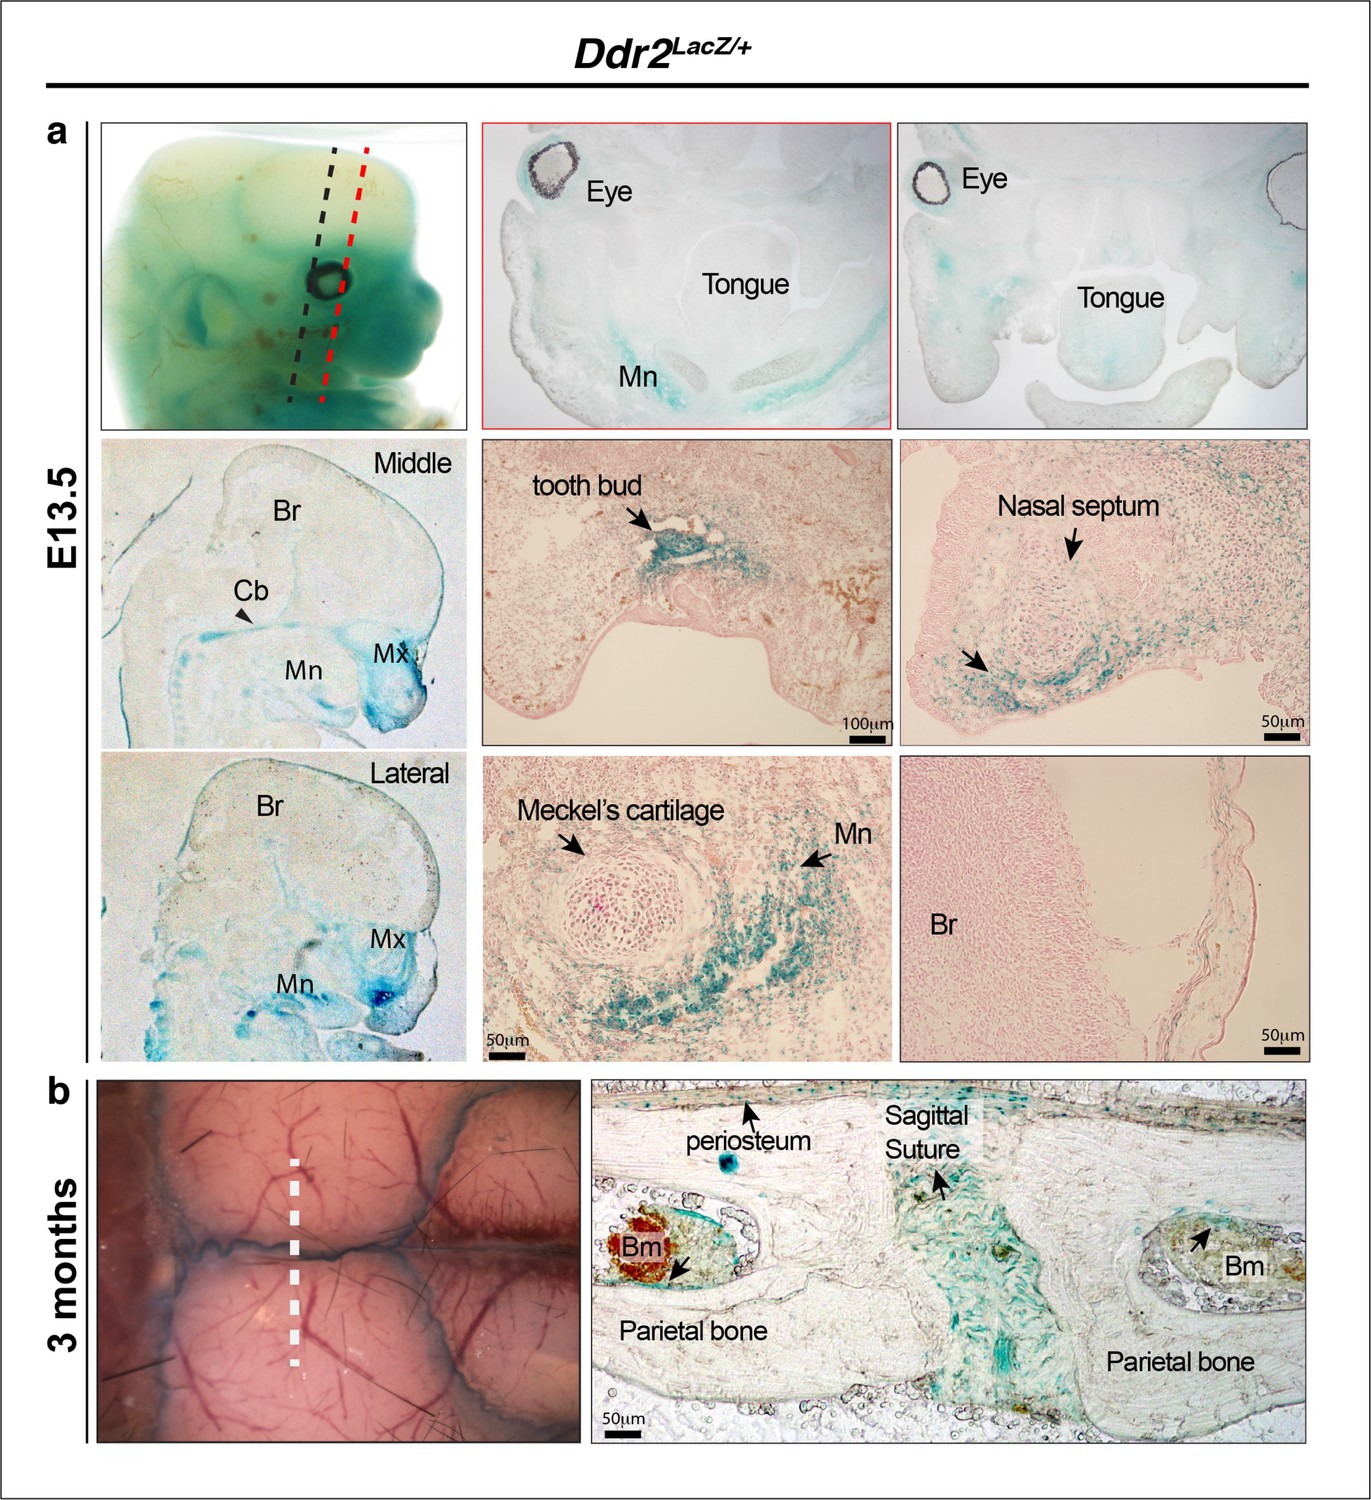
Ddr2-LacZ localization in craniofacial skeleton.
(a) In Ddr2+/LacZ embryos harvested at E13.5, intense X-gal staining can be seen in the maxilla (Mx), mandible (Mn), cartilage primordia of cranial base (Cb, black arrowhead), nasal septum and tooth buds. No staining was detected in the brain (Br) (top row, whole mount X-gal staining; middle and bottom row, X-gal staining on frozen embryos). (b) Whole mount and frozen sections of calvariae from 3-month-old mice show intense X-gal staining in cranial sutures, periosteum and lining of bone marrow inside cranial bones.
Figure 5 with 2 supplements
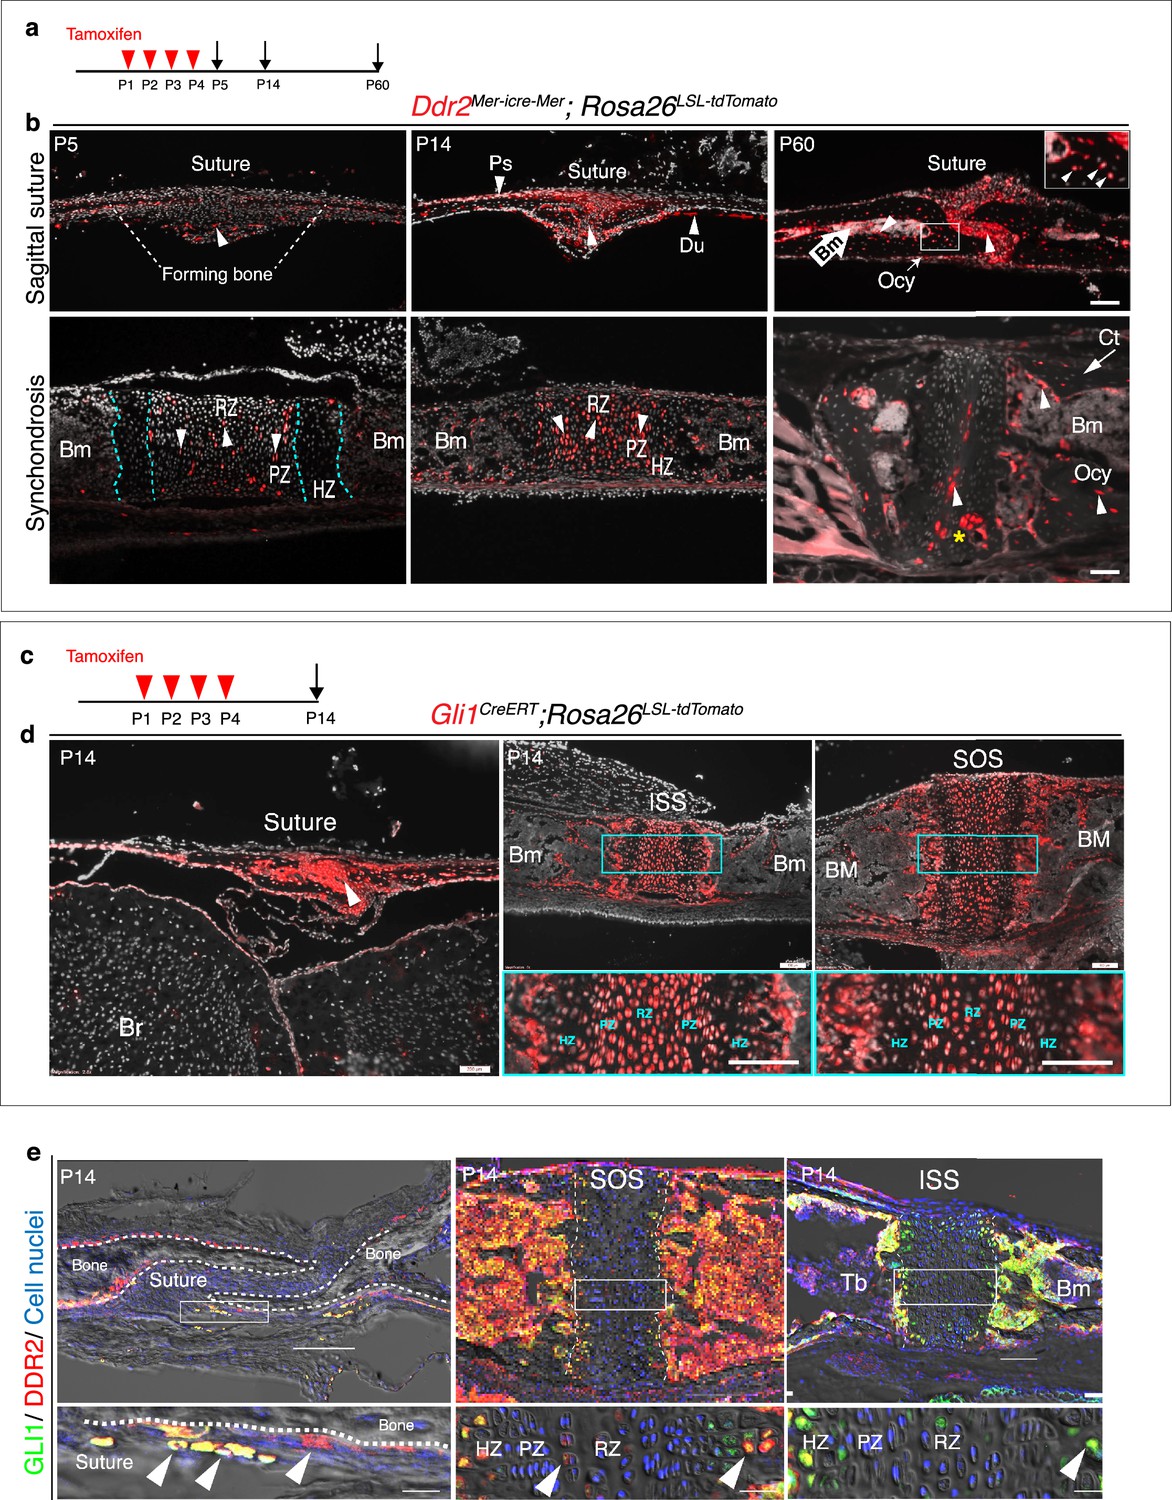
Ddr2mer-iCre-mer marks progenitors of the skeletal lineage during postnatal craniofacial development.
(a) Protocol used for induction of Cre-recombination and expression of tdTomato fluorescent protein (red) upon tamoxifen injection. (b) Fluorescent tdTomato on cryostat sections of calvaria (upper panel) at the postnatal P5, P14, and P60 showing labeling (white arrowheads) in suture mesenchyme, periosteum (Ps) and dura mater (Du), subsequently contributing to osteocytes (Ocy) (inset box) and bone marrow (Bm) of calvarial bones over time. Scale bar: 100 μm. Lower panel, cranial base synchondrosis (ISS) showing labeling at P5 in resting (RZ) and proliferative (PZ) chondrocyte zones, but not in the hypertrophic zone (HZ) (cyan dotted lines), consistent with X-gal staining. Lineage trace at P14 shows an increase in tdTomato + cells in all synchondrosis regions and associated bone marrow (Bm). At P60, tdTomato labeling is persistent in the middle zone and shows a clone of tdTomato labeling in proliferative and hypertrophic chondrocytes (yellow asterisk) and appears in the lining of bone marrow (Bm) and osteocytes (Ocy) of cortical bone (Ct). Scale bar: 100 μm (P14 and P60) and 50 μm (P5). Gray: cell nuclei. (c) Protocol used for induction of Cre-recombination and expression of tdTomato fluorescent protein (red) in Gli1CreERT; Rosa26LSL-tdTomato mice. (d) Fluorescent tdTomato (red) on cryostat sections of calvaria (right) and cranial base synchondroses (ISS and SOS, left) from 2-week-old Gli1CreERT; Rosa26LSL-tdTomato mice showing labeling in a similar cell population to that seen with Ddr2mer-iCre-mer. Scale bar: 200 μm (Suture; left) and 100 μm (ISS and SOS; right). Boxed region is shown in higher magnification (bottom). RZ: resting zone; PZ: proliferative zone; HZ: hypertrophic zone. (e) Representative immunofluorescence images showing Gli1 (green) and Ddr2 (red) immunostaining of coronal sutures, SOS and ISS from 2-week-old mice. Scale bar: 100 μm. Boxed region is shown in higher magnification (bottom). White arrowheads indicate co-localization. Cell nuclei were stained with DAPI (blue). Bm: Bone marrow; Tb; trabecular bone.
Figure 5—figure supplement 1
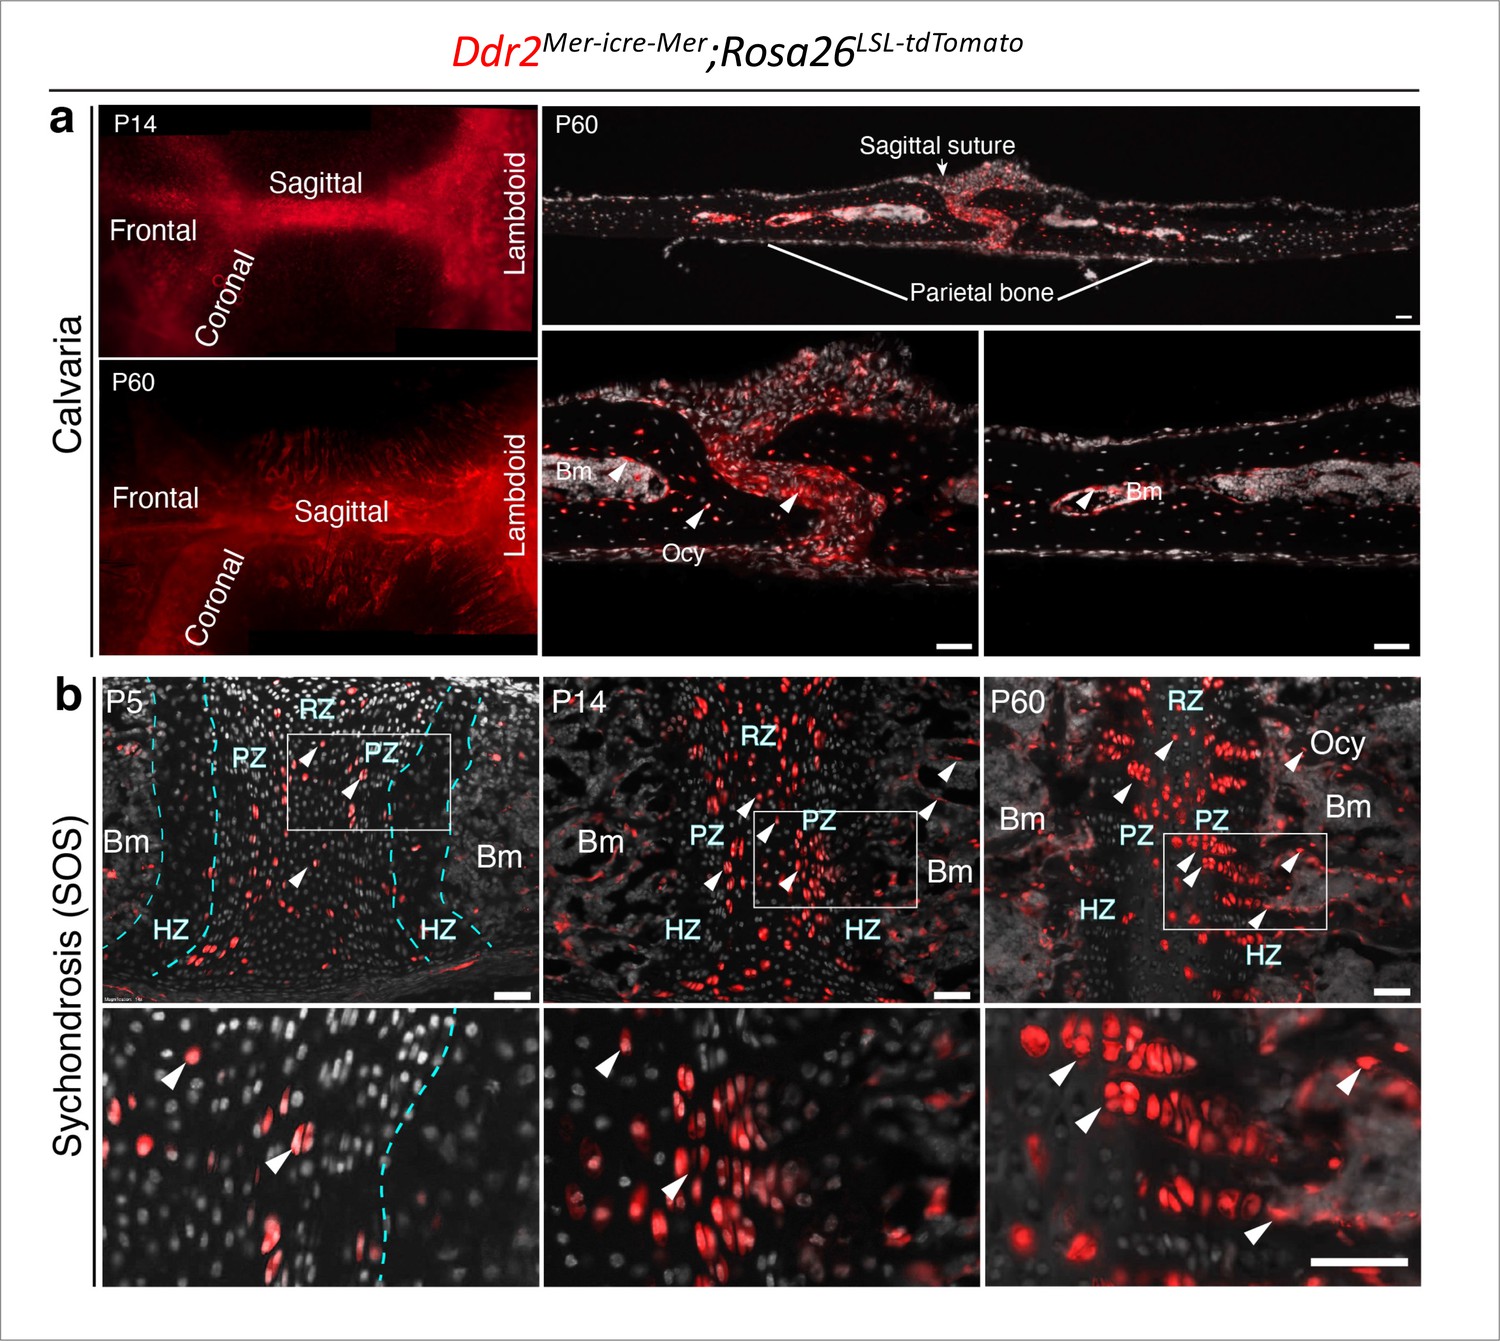
Ddr2mer-iCre-mer induced recombination in cranial sutures and cranial base synchondrosis.
Neonatal Ddr2Mer-icre-Mer;Rosa26LSL-tdTomato mice were treated with tamoxifen as described in Figure 5. (a) Whole mounts (left) at P14 and P60 show Ddr2 tdTomato labeling in all cranial sutures: frontal, sagittal, coronal, and lambdoid sutures (left). Cryosections (right) show distribution of tdTomato-labeled cells at P60 in the suture mesenchyme, bone marrow lining cells and osteocytes. Scale bar: 50 μm. (b) Cryostat sections of the cranial base spheno-occipital synchondrosis (SOS) shows tdTomato labeling initially in resting and proliferative chondrocyte zones (P5). At later times (P14, P60), progeny of Ddr2-positive cells form single or two column clones along the axis of cranial base growth extending into the hypertrophic zone and osteocytes. Scale bar: 50 μm.
Figure 5—figure supplement 2
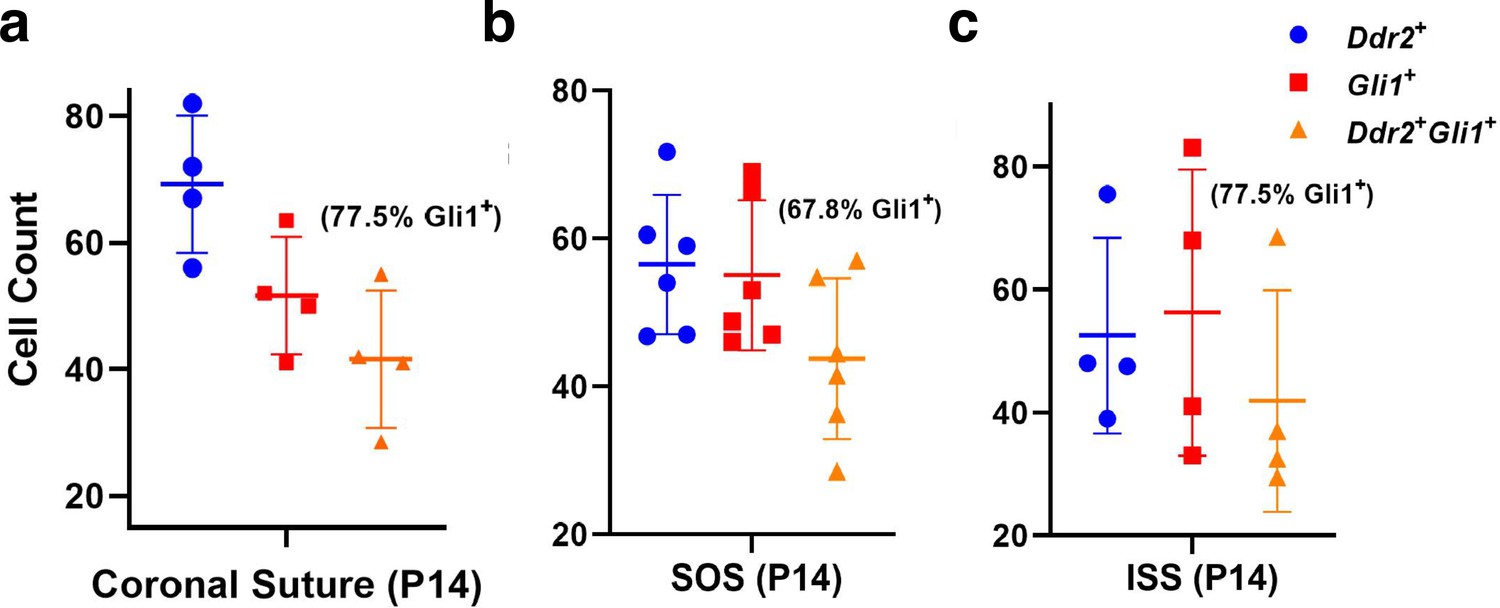
Co-localization of DDR2 and GLI1 in cranial suture and synchondroses in 2-week-old mice.
(a) Coronal suture. (b) SOS. (c) ISS. Colocalization is expressed as the percentage of GLI1 + cells that are also DDR2+.
Figure 6
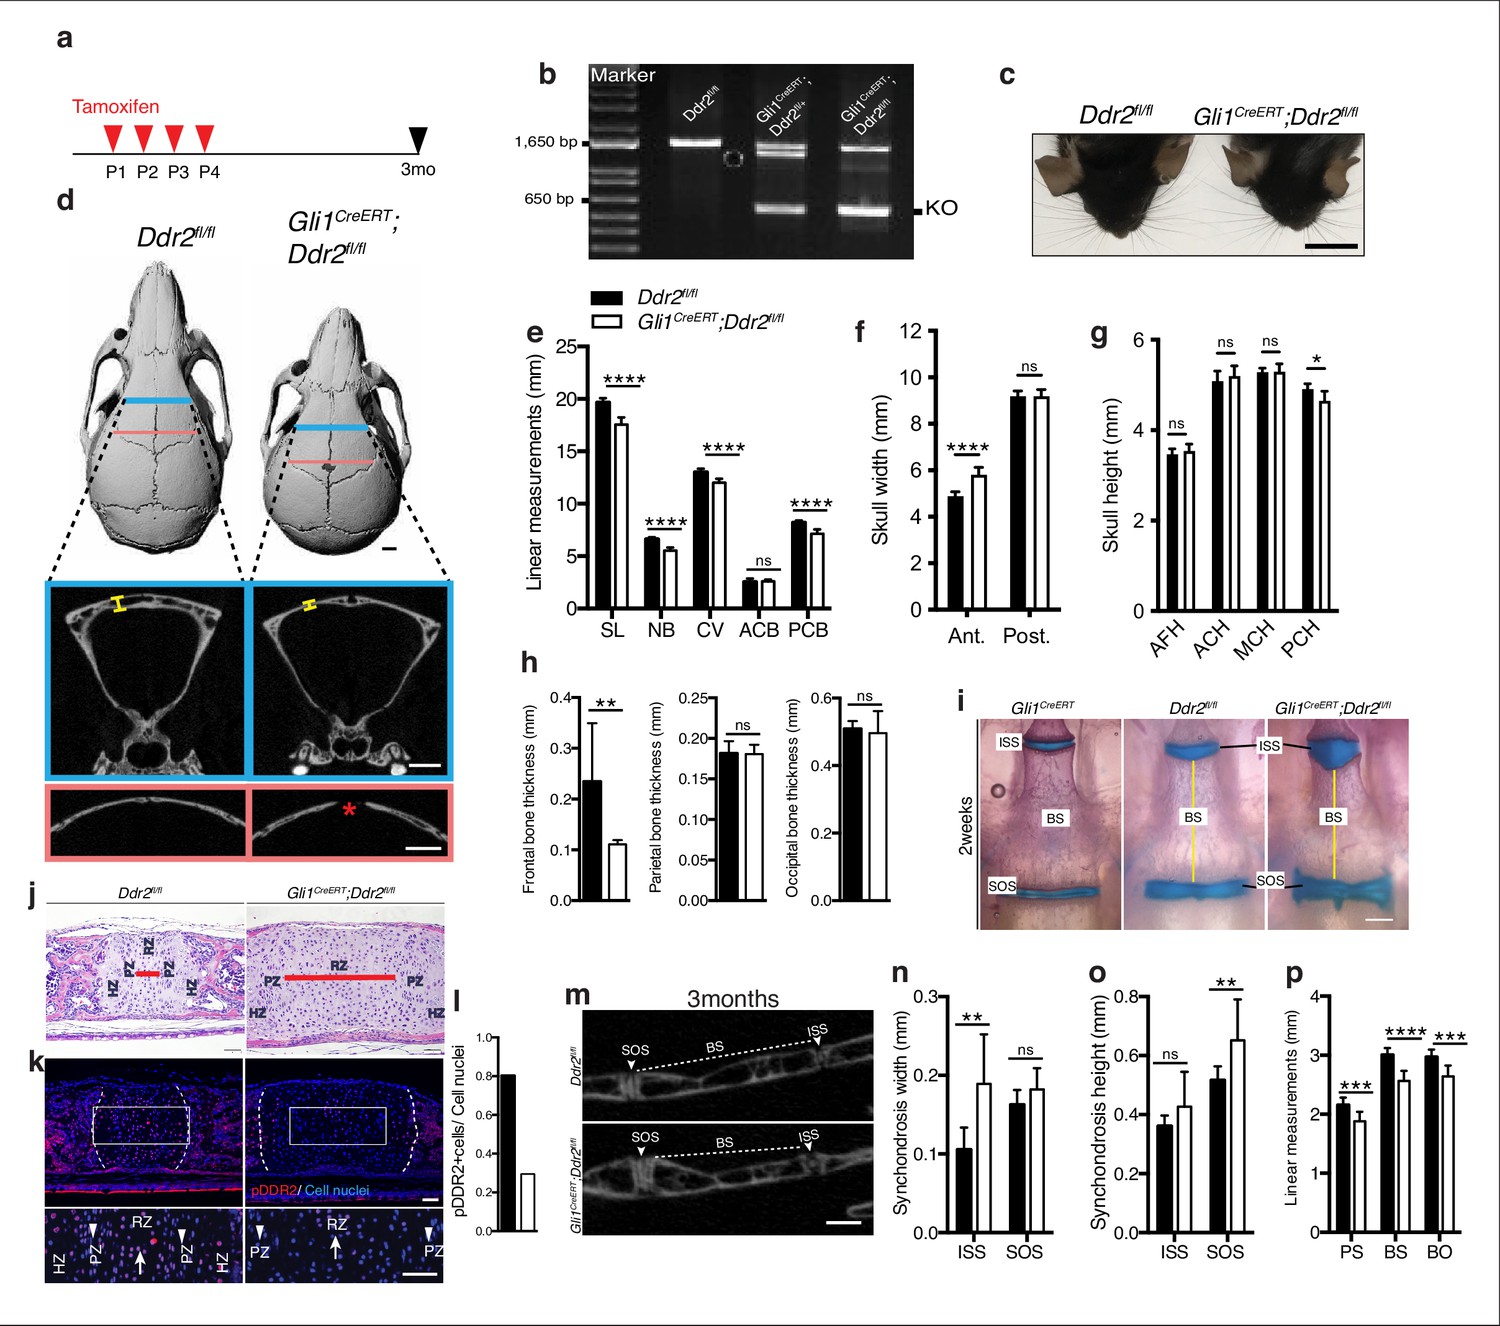
Loss of Ddr2 in Gli1-expressing cells resulted in a craniofacial phenotype similar to Ddr2slie/slie mice.
(a) Protocol used for induction of Cre-recombination upon tamoxifen injection. (b) Genotyping PCR showing WT (lower band) and Ddr2 floxed alleles (upper band) near 1650 bp and recombined knockout allele below the 650 bp marker (KO). (c) Top head view showing Gli1CreERT; Ddr2fl/fl mice have short snout compared with Ddr2fl/fl mice. Scale bar: 1 cm. (d) μCT scans of Ddr2fl/fl and Gli1CreERT; Ddr2fl/fl skulls show reduced anterior-posterior skull length and increased anterior skull width (quantification in e–g). Note thinning and suture defect in the frontal bone in Gli1CreERT; Ddr2fl/fl skulls (d, bottom). Scale bar: 1 mm. (h) Quantification of frontal, parietal, and occipital bone thickness. (i) Alcian blue and Alizarin red whole mount staining shows Gli1-Cre; Ddr2fl/fl skulls have wide cranial base synchondroses compared with Gli1CreERT and Ddr2fl/fl. Scale bar: 500 μm. (j) H&E staining of ISS shows widening of resting zone and chondrocyte disorganization in Gli1CreERT; Ddr2fl/fl mice. Scale bar: 50 μm. RZ: Resting zone; PZ: Proliferative zone; HZ: Hypertrophic zone. Red bar compares RZ width. (k) Immunofluorescence images show reduced pDDR2 (red) immunostaining indicative of reduced DDR2 signaling in Gli1CreERT; Ddr2fl/fl synchondrosis. Dotted lines denote chondro-osseous junction. Boxed region is shown in higher magnification, lower panel. Cell nuclei were stained with DAPI (blue). Arrows, resting zone; arrowheads, proliferative zone. Scale bar: 50 μm. (l), quantification of immunostaining in k. (m-p) μCT images and quantification show enlarged synchondroses associated with shortening in cranial base bone lengths in 3-month-old Gli1CreERT; Ddr2fl/fl skulls compared with controls. Scale bar: 500 μm. c-h, (m-p) 3-month-old mice. (i–l) 2-week-old mice. Data are presented as mean ± SD. (n=10). *p<0.01, **p<0.01, ***p<0.001, ****p<0.0001, ns, not significant, two-tailed unpaired t test.
-
Figure 6—source data 1
Skull linear measurements in Ddr2fl/fl versus Gli1CreERT ;Ddr2 fl/fl mice.
- https://cdn.elifesciences.org/articles/77257/elife-77257-fig6-data1-v4.xlsx
Figure 7 with 2 supplements
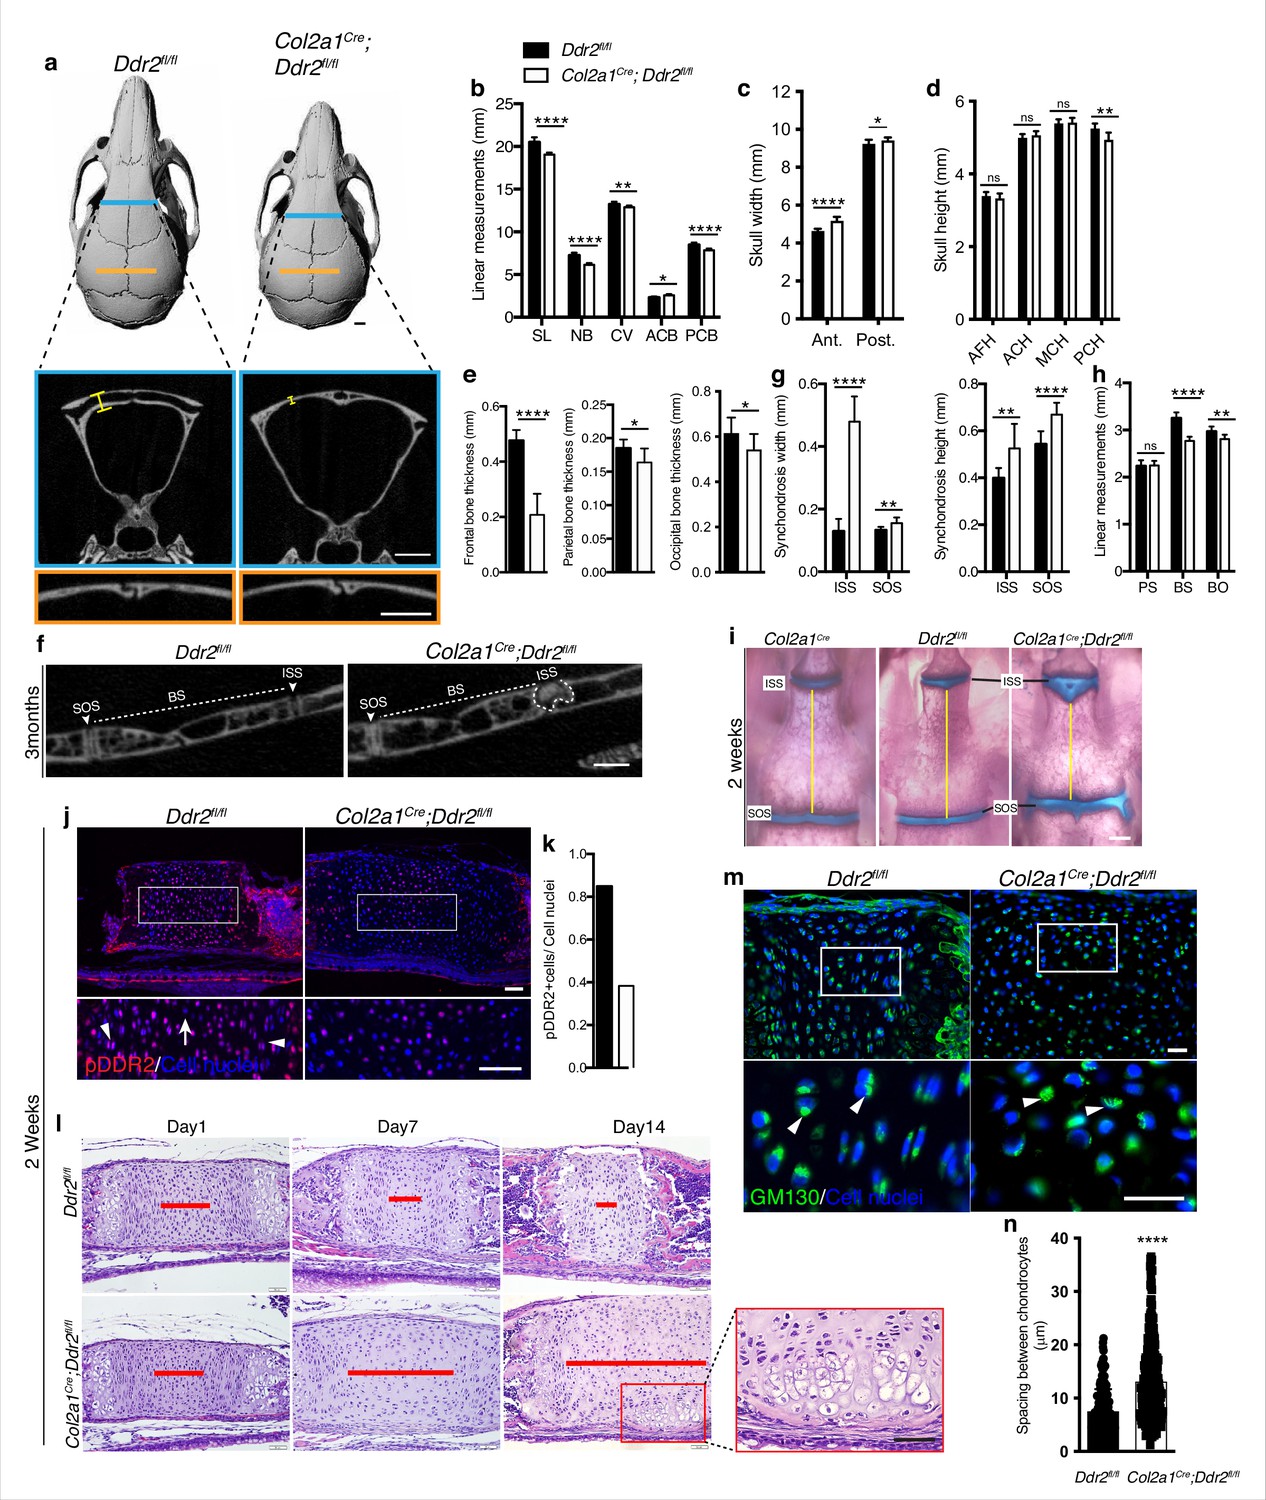
Ddr2 conditional knockout in Col2a1-expressing chondrocytes causes cranial base hypoplasia and alters synchondroses without affecting cranial sutures.
(a-d) μCT scans of Ddr2fl/fl and Col2a1Cre;Ddr2fl/fl skulls (3-month-old) showing reduced anterior-posterior skull length, length of individual bones and increased anterior and, to a lesser extent, posterior skull width in conditional knockout mice. Note thinning of frontal bone in Col2a1Cre;Ddr2fl/fl skulls, but no effect on cranial sutures. Scale bars: 1 mm. (e) Quantification of frontal, parietal, and occipital bone thickness. (f–h) Quantification of μCT scans showing enlarged synchondroses associated with shortening in cranial base bone lengths in Col2a1Cre;Ddr2fl/fl skulls. Data are presented as mean ± SD. (n=10). *p<0.01, **p<0.01, ***p<0.001, ****p<0.0001, ns, not significant, two-tailed unpaired t test. (i) Alcian blue and alizarin red whole mount staining showing 2-week Col2a1Cre;Ddr2fl/fl skulls had wide cranial base synchondroses compared with Col2a1Cre and Ddr2fl/fl. Scale bar: 500 μm. (j) Immunofluorescence images showing reduced pDDR2 (red) immunostaining indicating loss of DDR2 signaling in Col2a1Cre;Ddr2fl/fl mice (Quantification in k). Scale bar: 50 μm. Boxed region is shown at higher magnification, lower panel. Cell nuclei were stained with DAPI (blue). (l-n) Analysis showing Col2a1Cre;Ddr2fl/fl mice exhibited time-dependent widening in resting zone, altered polarization and ectopic hypertrophy. (l) Time-course analysis using H&E staining shows no difference in histological structures of the ISS between Col2a1Cre;Ddr2fl/fl mice and their control littermates at P1, but during the first 2 weeks, the resting zone became abnormally wide (red lines) and exhibited ectopic hypertrophy on the ventral side of cranial base synchondrosis (red box). Scale bar: 50 μm. (m) Immunofluorescent images of GM130 staining (green) shows well-defined Golgi staining adjacent to the nucleus of cells in RZ of wild type synchondroses, but in mutant synchondroses, GM130 immunostaining is diffuse and ill-defined indicating disturbed cell organization. Boxed region is shown in higher magnification, lower panel. Cell nuclei were stained with DAPI (blue). Scale bar: 20 μm. (n) Linear measurements shows increased spacing between chondrocytes in resting zone of wildtype and mutant synchondroses. Spacing between chondrocytes was measured by drawing lines between chondrocytes in resting zone using ImageJ. (a–h) 3-month-old mice, (i–n) 2-week-old mice. Data are presented as mean ± SD. (n=3). ****p<0.0001, two-tailed unpaired t test.
-
Figure 7—source data 1
Skull linear measurements in Ddr2fl/fl versus Col2a1Cre;Ddr2fl/fl mice.
- https://cdn.elifesciences.org/articles/77257/elife-77257-fig7-data1-v4.xlsx
-
Figure 7—source data 2
Measurement of spacing between chondrocytes in Ddr2fl/fl versus Col2a1Cre;Ddr2fl/fl mice.
- https://cdn.elifesciences.org/articles/77257/elife-77257-fig7-data2-v4.xlsx
Figure 7—figure supplement 1
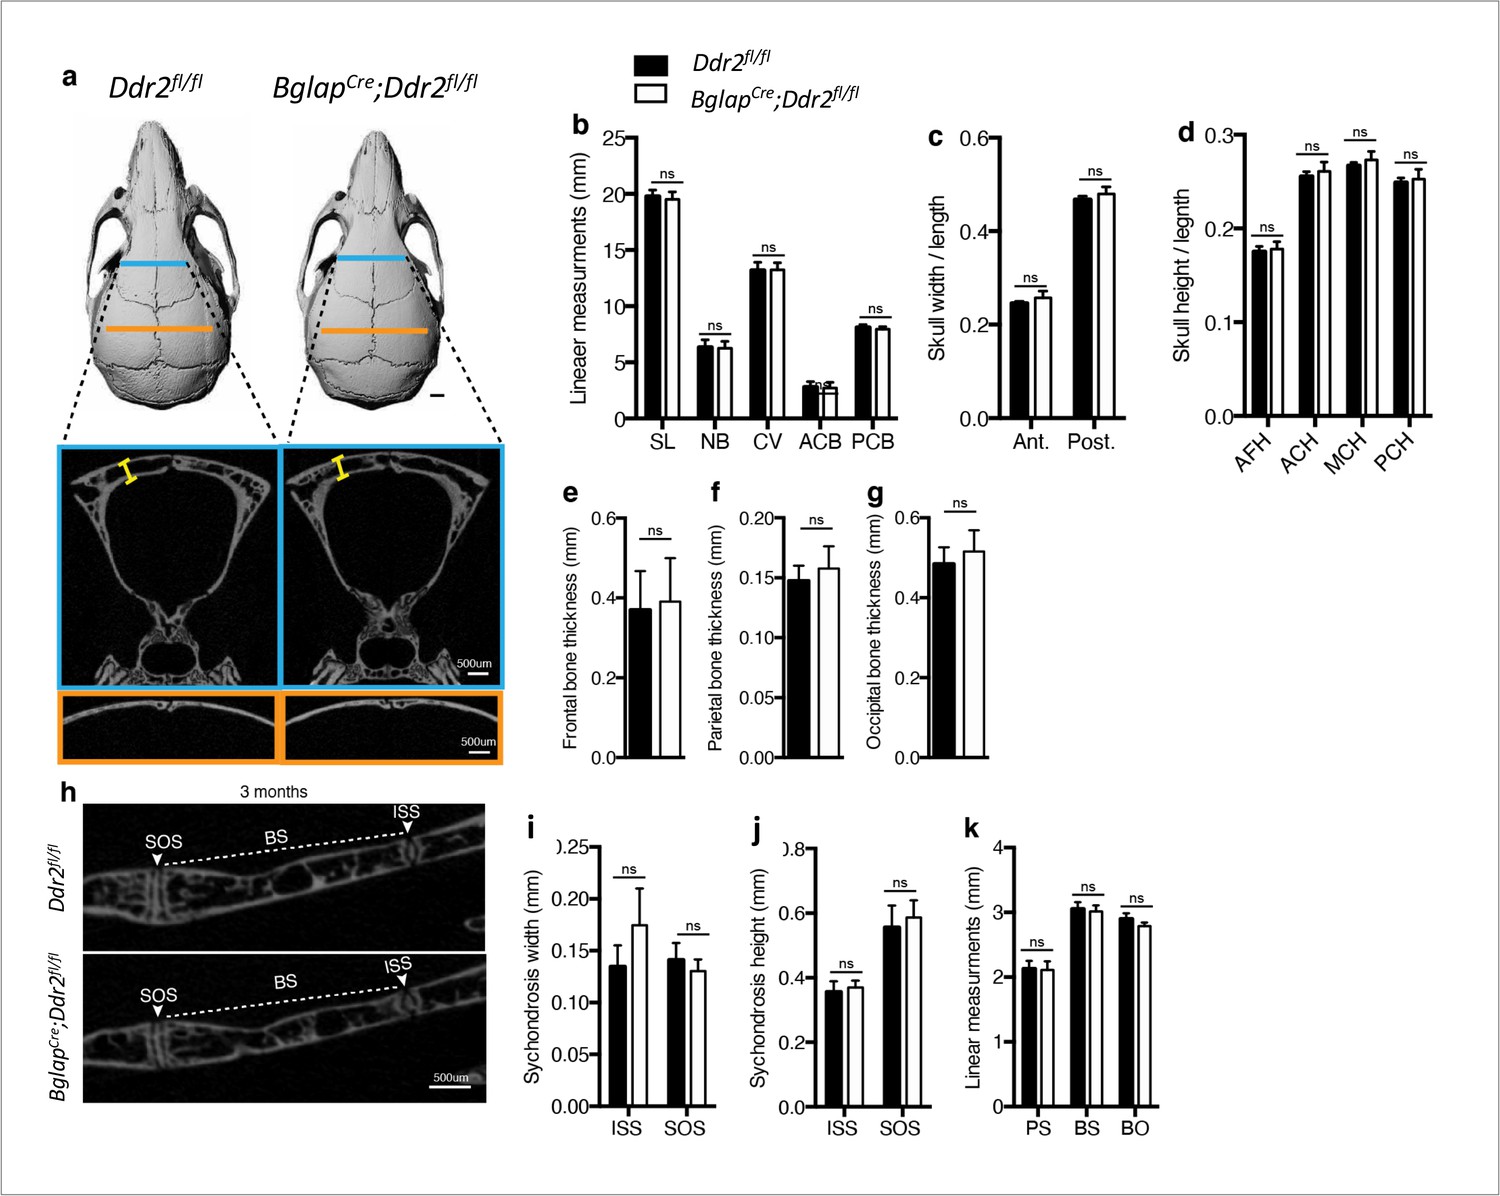
Ddr2 loss in mature osteoblasts using BglapCre did not result in craniofacial abnormalities.
(a-d) Quantification using μCT scans shows no difference between Ddr2fl/fl and BglapCre; Ddr2fl/fl skull length, width and height at age of 3 months. Scale bar: 1 mm in a. (e–g) quantification showing no difference in frontal, parietal, and occipital bone thickness. (h–k) Quantification using μCT scans showing no changes in cranial base synchondroses or associated bones. Data are presented as mean ± SD. (n=10). ns, not significant, two-tailed unpaired t test.
Figure 7—figure supplement 2
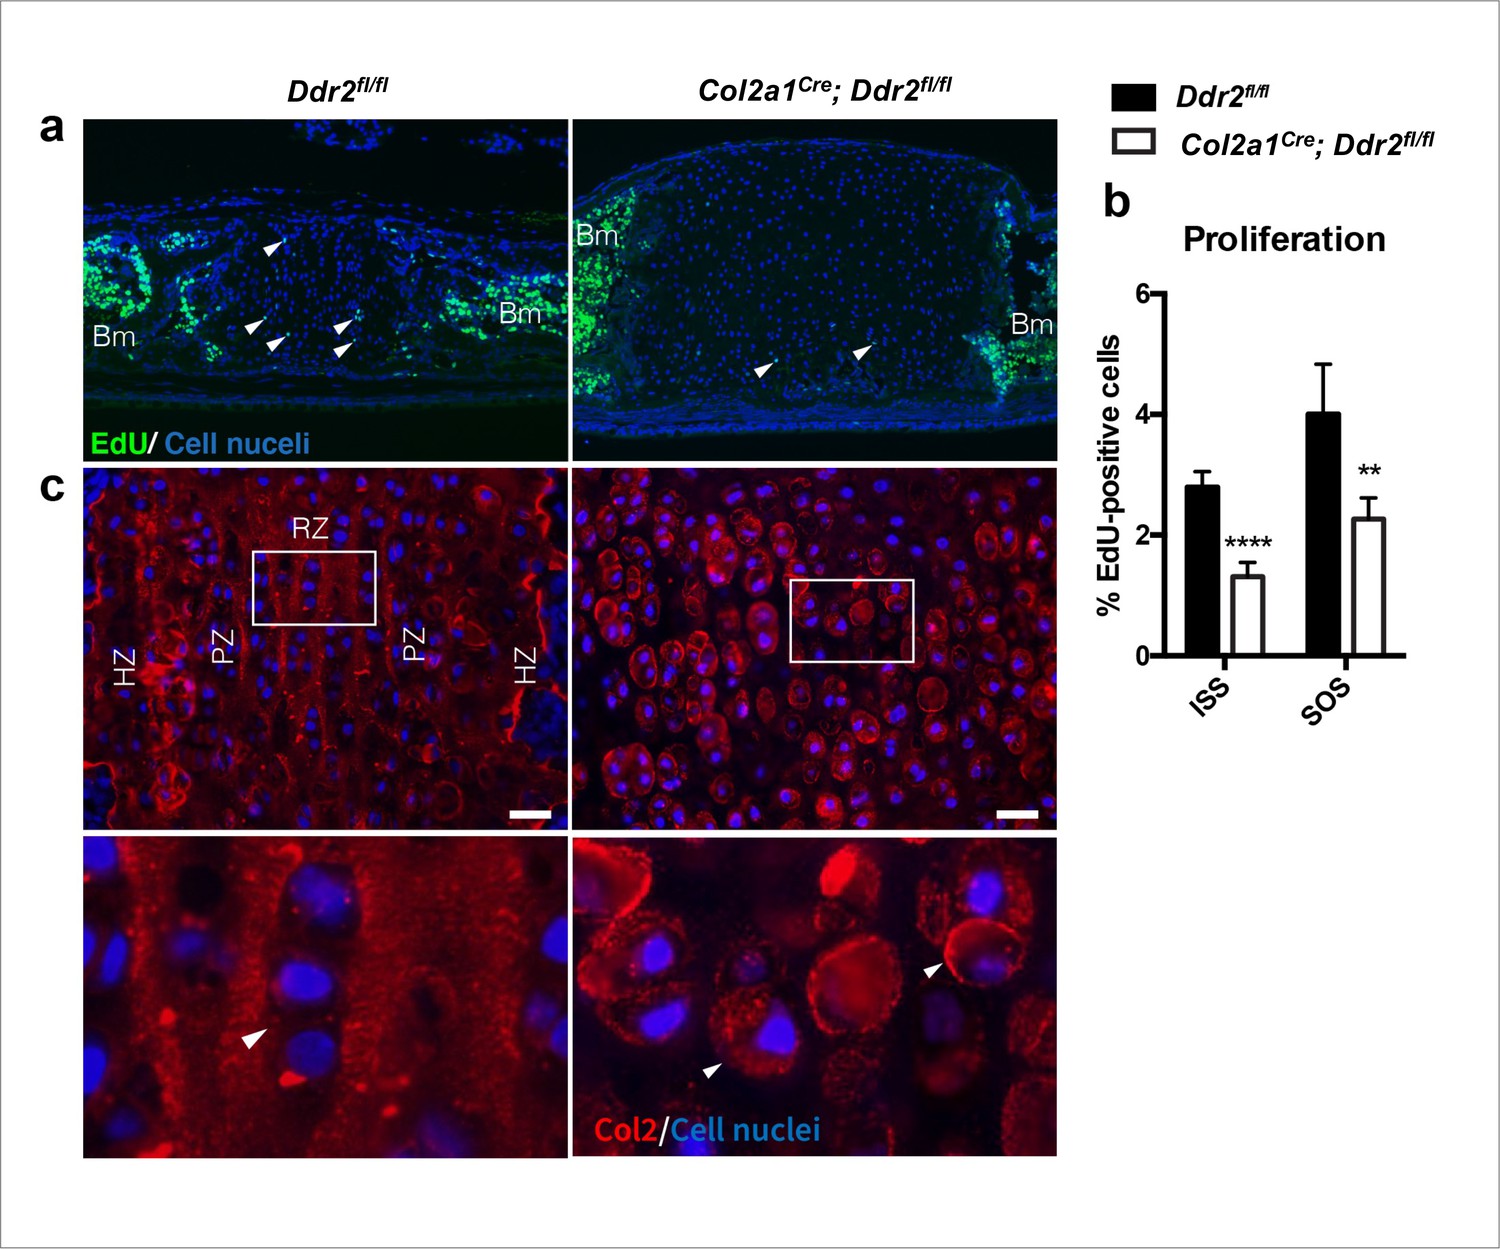
Synchondroses in Col2a1Cre:Ddr2ff mutants exhibited deficient chondrocyte proliferation and abnormal type II collagen distribution.
(a) EdU staining (green) showed a significant reduction of chondrocyte proliferation in Col2a1Cre; Ddr2fl/fl synchondrosis. (b) Bar graph shows quantification of EdU-positive cells in ISS and SOS. (c) COL2 immunostaining shows altered type II collagen matrix in Col2a1Cre; Ddr2fl/fl mice. n=3 mice, **p<0.01, ****p<0.0001. Scale bar: 50 μm in (a), 20 μm in (c).
Tables
Key resources table
| Reagent type (species) or resource | Designation | Source or reference | Identifiers | Additional information |
|---|---|---|---|---|
| Gene (Mus musculus) | Discoidin Domain Receptor2 (Ddr2) | Genbank | Gene ID: 18214 | |
| Strain, strain background (Mus musculus, C57BL/6 J) | Ddr2slie/slie | Jackson lab | JAX:008172 | Breeding with C57BL/6 J mice at least 8 generations. |
| Strain, strain background (Mus musculus, C57BL/6 J) | Ddr2LacZ mice | Generated from ‘knockout-first’ Ddr2tm1a(EUCOMM)Wtsi -ES cells(European Mutant Mouse Repository) | EPD0607__B01 PMID:35140200 | ‘knockout-first’ mice crossed with Sox2Cre mice |
| Strain, strain background (Mus musculus, C57BL/6 J) | Ddr2fl/f | Generated from ‘knockout-first’ Ddr2tm1a(EUCOMM)Wtsi -ES cells(European Mutant Mouse Repository) | EPD0607__B01 PMID:35140200 | ‘knockout-first’ mice crossed with FlpO mice |
| Strain, strain background (Mus musculus, C57BL/6 J) | Ddr2mer-iCre-mer | Generated in UCSD Transgenic Animal Model Core and Embryonic Stem Cell shared resource | PMID:35140200 | |
| Strain, strain background (Mus musculus, C57BL/6 J) | Rosa26LSL-tdTomato | Jackson lab | JAX:007914 | |
| Strain, strain background (Mus musculus, C57BL/6 J) | Gli1CreERT | Jackson lab | JAX:007913 | |
| Strain, strain background (Mus musculus, C57BL/6 J) | Col2a1Cre | Generated at Richard R. Behringer lab | PMID:10686612 | |
| Strain, strain background (Mus musculus, C57BL/6 J) | BglapCre | Generated at Thomas L. Clemens lab | PMID:12215457 | |
| Sequence-based reagent | Ddr2fl/f _F | Renny T. Franceschi lab | PMID:35140200 | |
| Sequence-based reagent | Ddr2fl/f _R | Renny T. Franceschi lab | PMID:35140200 | |
| Sequence-based reagent | Ddr2-LacZ-F | Renny T. Franceschi lab | PMID:35140200 | |
| Sequence-based reagent | Ddr2-LacZ-R | Renny T. Franceschi lab | PMID:35140200 | |
| Sequence-based reagent | Ddr2mer-iCre-mer -F | Renny T. Franceschi lab | PMID:35140200 | |
| Sequence-based reagent | Ddr2mer-iCre-mer -R | Renny T. Franceschi lab | PMID:35140200 | |
| Antibody | Anti-human/mouse DDR2(Rabbit polyclonal) | LS Bio | LS-B15752 | IF(1:200) |
| Antibody | Anti-human/mouse Y740P-DDR2(Rabbit monoclonal) | R&D systems | MAB25382 | IF(1:200) |
| Antibody | Anti-Human/mousecleaved caspase 3(Rabbit polyclonal) | Cell Signaling | 9661 | IF(1:200) |
| Antibody | Anti-Human/mouse COL2(Rabbit polyclonal) | ABCam | Ab34712 | IF(1:100) |
| Antibody | Anti-Human/mouse GLI1(Rabbit polyclonal) | Novus Biologicals | NBP1-78259 | IF(1:100) |
| Antibody | Anti-Mouse IBSP(Rabbit polyclonal) | Renny T Franceschi lab | IF(1:200) | |
| Antibody | Anti-Human/mouse COL10(Rabbit polyclonal) | ABCam | Ab58632 | IF(1:100) |
| Antibody | Anti-Mouse COL1(Rabbit polyclonal) | Millipore | AB765P | IF(1:100) |
| Antibody | Anti-Mouse GM130(Mouse polyclonal) | BD Biosciences | 610822 | IF(1:100) |
| Commercial assay or kit | Click-iT EdU Alexa Fluor 488 Imaging Kit | Invitrogen | C10337 | |
| Commercial assay or kit | FragEL DNA Fragmentation Detection Kit | CalBiochem | QIA33-1 | |
| Chemical compound, drug | Tamoxifen | Renny T Franceschi lab | PMID:35140200 | |
| Chemical compound, drug | Aqua-Poly/Mount | Polysciences Inc | 18606 | |
| Chemical compound, drug | ProLong Gold Antifade Mountant with DAPI | Life technologies | P36931 | |
| Software, algorithm | Prism 9 | GraphPad | GraphPad Software, San Diego, CA | https://www.graphpad.com/ |
| Software, algorithm | ImageJ | ImageJ FibrilTool-Plugin | PMID:24481272 | https://imagej.nih.gov/ij/ |
| Other | Scano μCT 100 | MicroView software version 2.5.0 | PMID:35140200 | Methods-Skull morphometric analysis |
Additional files
Download links
A two-part list of links to download the article, or parts of the article, in various formats.
Downloads (link to download the article as PDF)
Open citations (links to open the citations from this article in various online reference manager services)
Cite this article (links to download the citations from this article in formats compatible with various reference manager tools)
Control of craniofacial development by the collagen receptor, discoidin domain receptor 2
eLife 12:e77257.
https://doi.org/10.7554/eLife.77257


