Interrogating the precancerous evolution of pathway dysfunction in lung squamous cell carcinoma using XTABLE
- Cancer Biomarker Centre, Cancer Research UK Manchester Institute, The University of Manchester, United Kingdom
- Cancer Research UK Lung Cancer Centre of Excellence, United Kingdom
- Translational Lung Cancer Biology Laboratory, Cancer Research UK Manchester Institute, University of Manchester, United Kingdom
- Department of Histopathology, The Christie Hospital, United Kingdom
- Boston University School of Medicine, United States
Figures
Figure 1
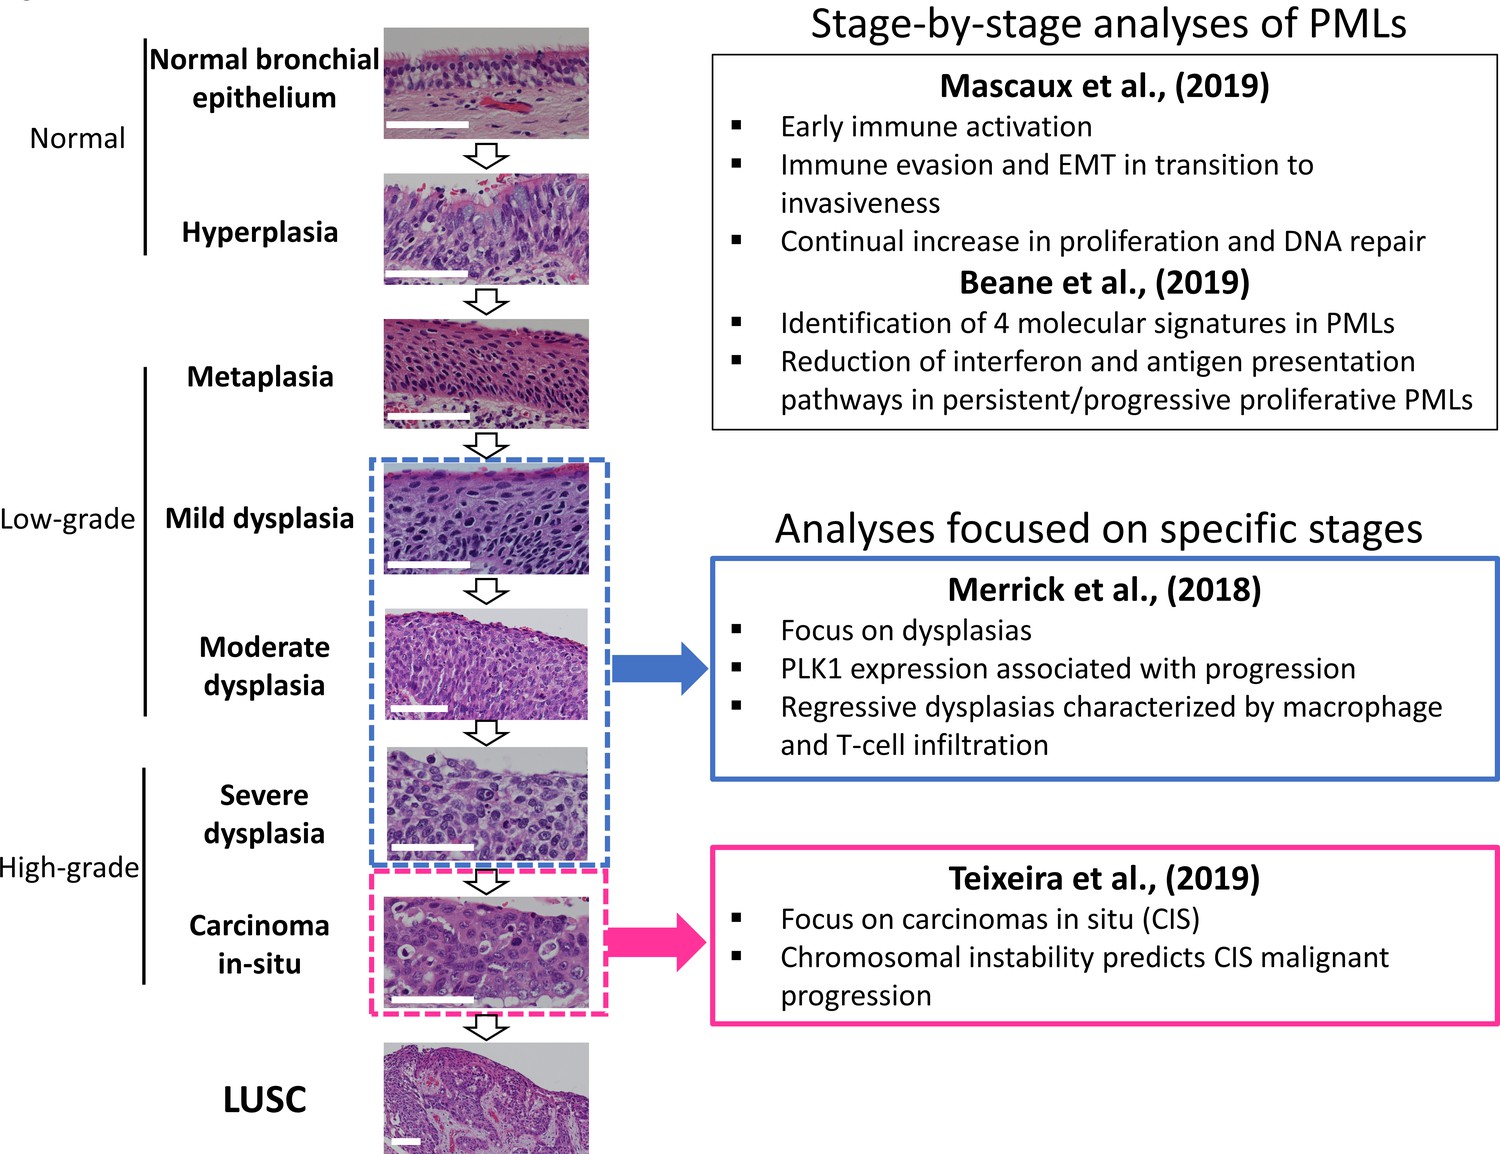
Developmental stages of lung squamous cell carcinoma (LUSC) premalignant lesions (PMLs) with representative histological images for each stage (haematoxilyn-eosin) and a summary of the four studies included in XTABLE (Exploring Transcriptomes of Bronchial Lesions).
PMLs are typically classified as normal epithelium (including hyperplasia), low-grade and high-grade. Two studies (Mascaux et al., 2019, and Beane et al., 2019) carried out gene expression analysis of multiple developmental stages, whereas Merrick et al., 2018, and Teixeira et al., 2019, focused on dysplasias (blue boxes) and carcinomas in situ (CIS) (pink boxes), respectively. The most relevant findings of each article are summarized in the figure. Error bars=50 µm.
Figure 2 with 3 supplements
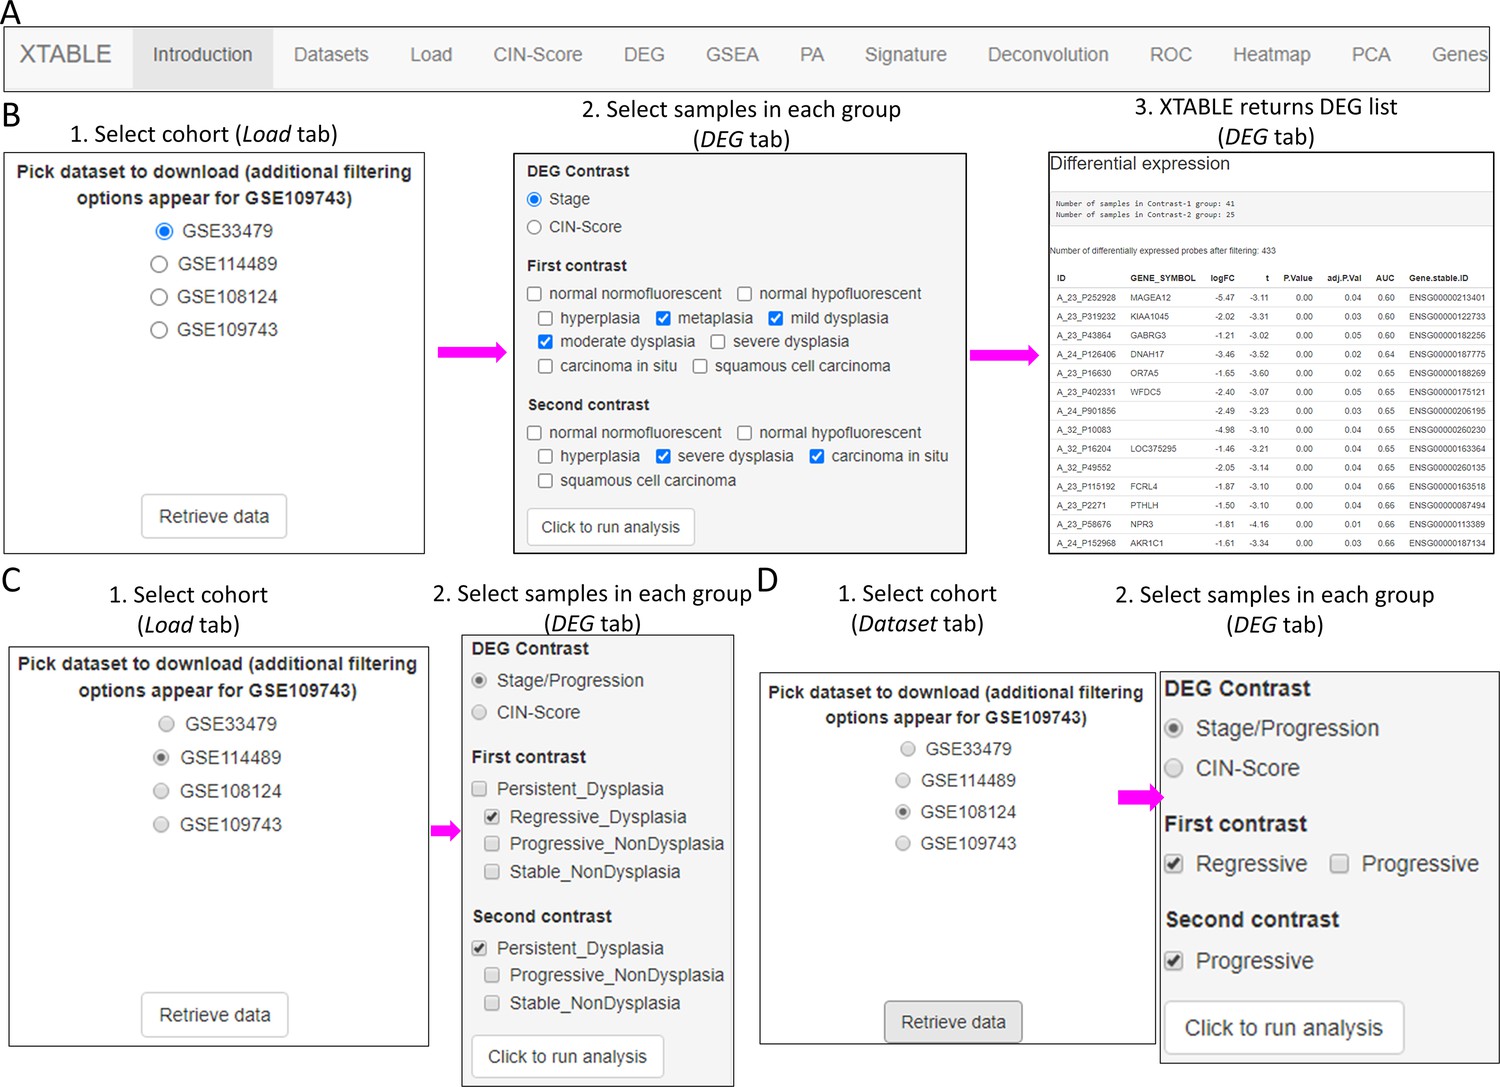
Overall organization of XTABLE (Exploring Transcriptomes of Bronchial Lesions) functions and use of the DEG function.
(A) Organization of all the functions in the XTABLE interface. The functions are interrelated and completing certain analyses requires the use of several functions. For instance, the GSEA and PA functions operate with gene lists obtained with the DEG function. (B) Workflow to obtain differentially expressed genes between two groups using the DEG function. The example shows groups of samples arranged by developmental stage to compare low-grade and high-grade premalignant lesions (PMLs) in the GSE33479 cohort. (C and D) Workflow to obtain differentially expressed genes between two groups using the DEG function. The two groups have been arranged by progression status using in the GSE114489 and GSE108124 cohorts, respectively.
Figure 2—figure supplement 1
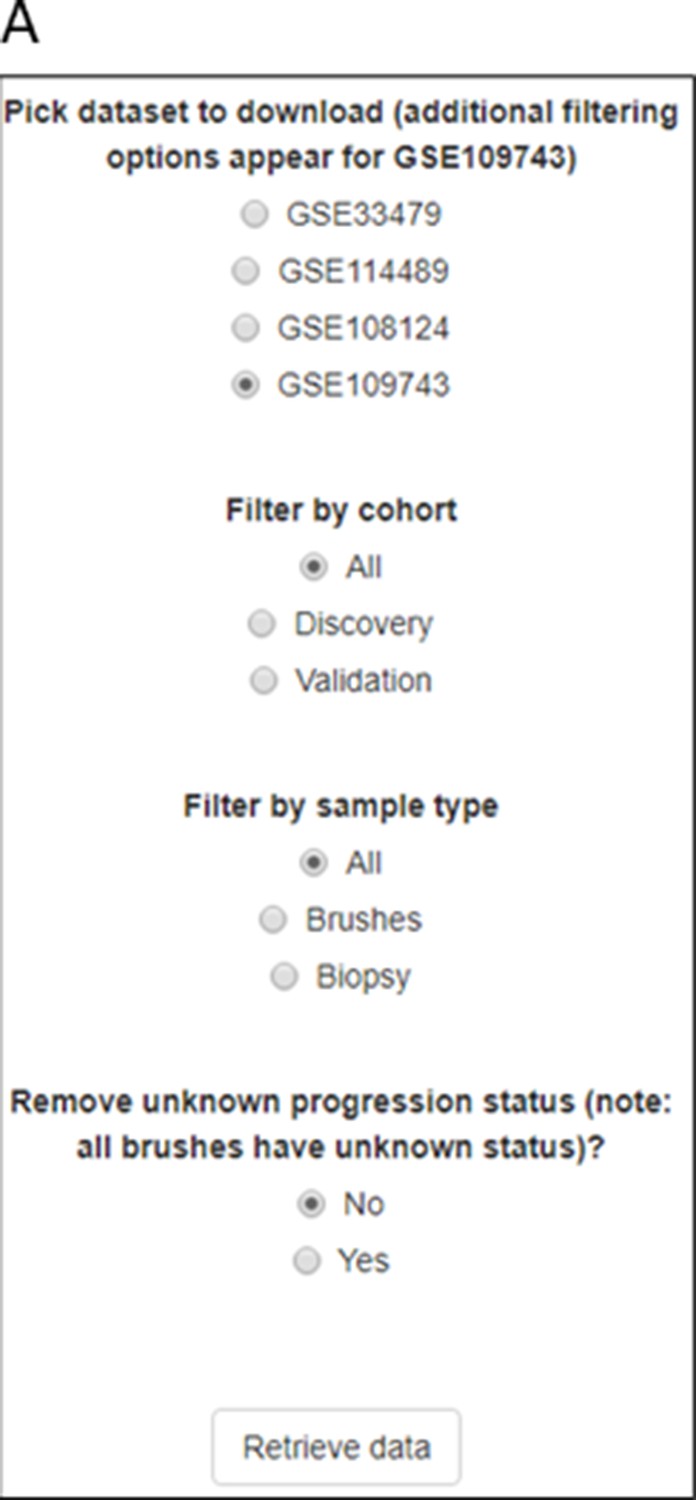
Sample selection options for cohort GSE109743.
Figure 2—figure supplement 2
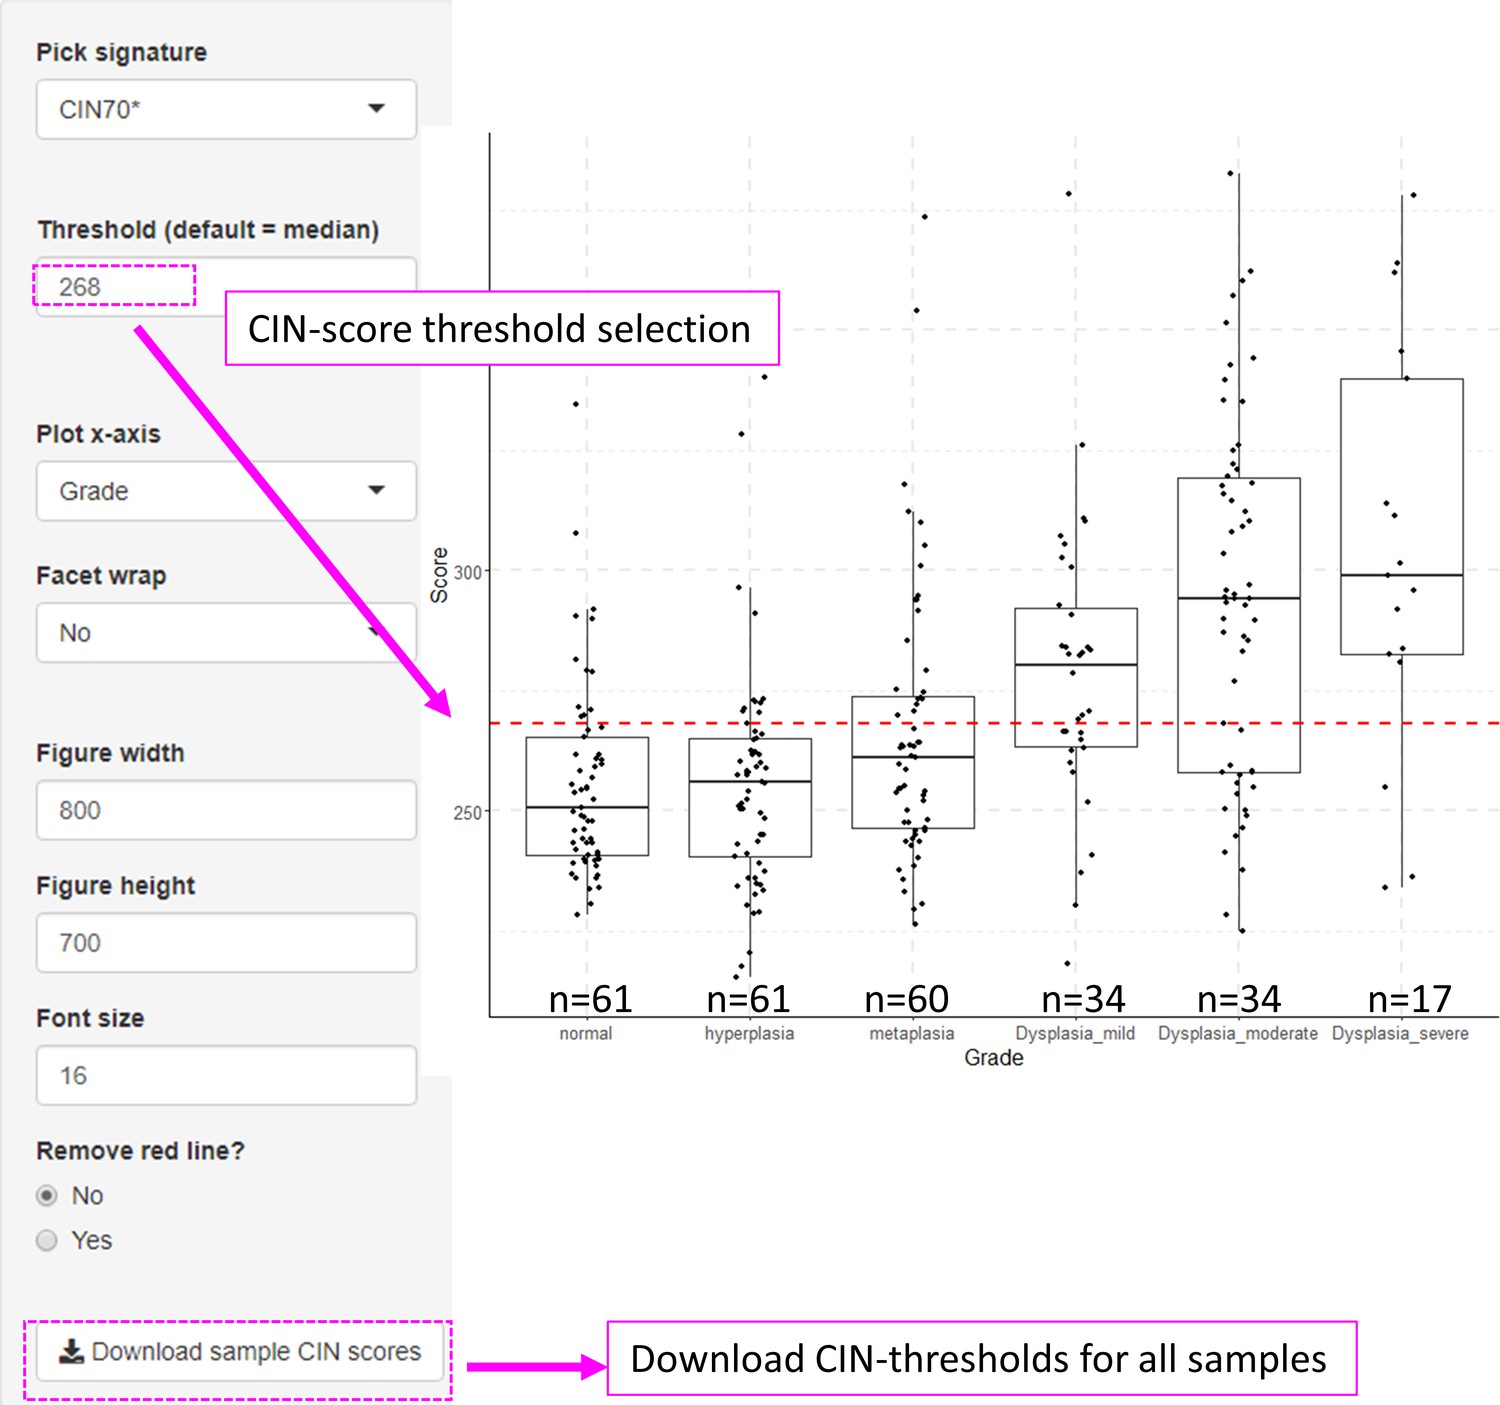
Visualization of chromosomal instability (CIN)-scores in with XTABLE (Exploring Transcriptomes of Bronchial Lesions).
The example shows CIN70 scores in GSE109743 cohort. The CIN signature can be changed in the ‘Pick signature’ option and the sample classification used in the x-axis can be selected with the ‘Plot x-axis’ option.
Figure 2—figure supplement 3
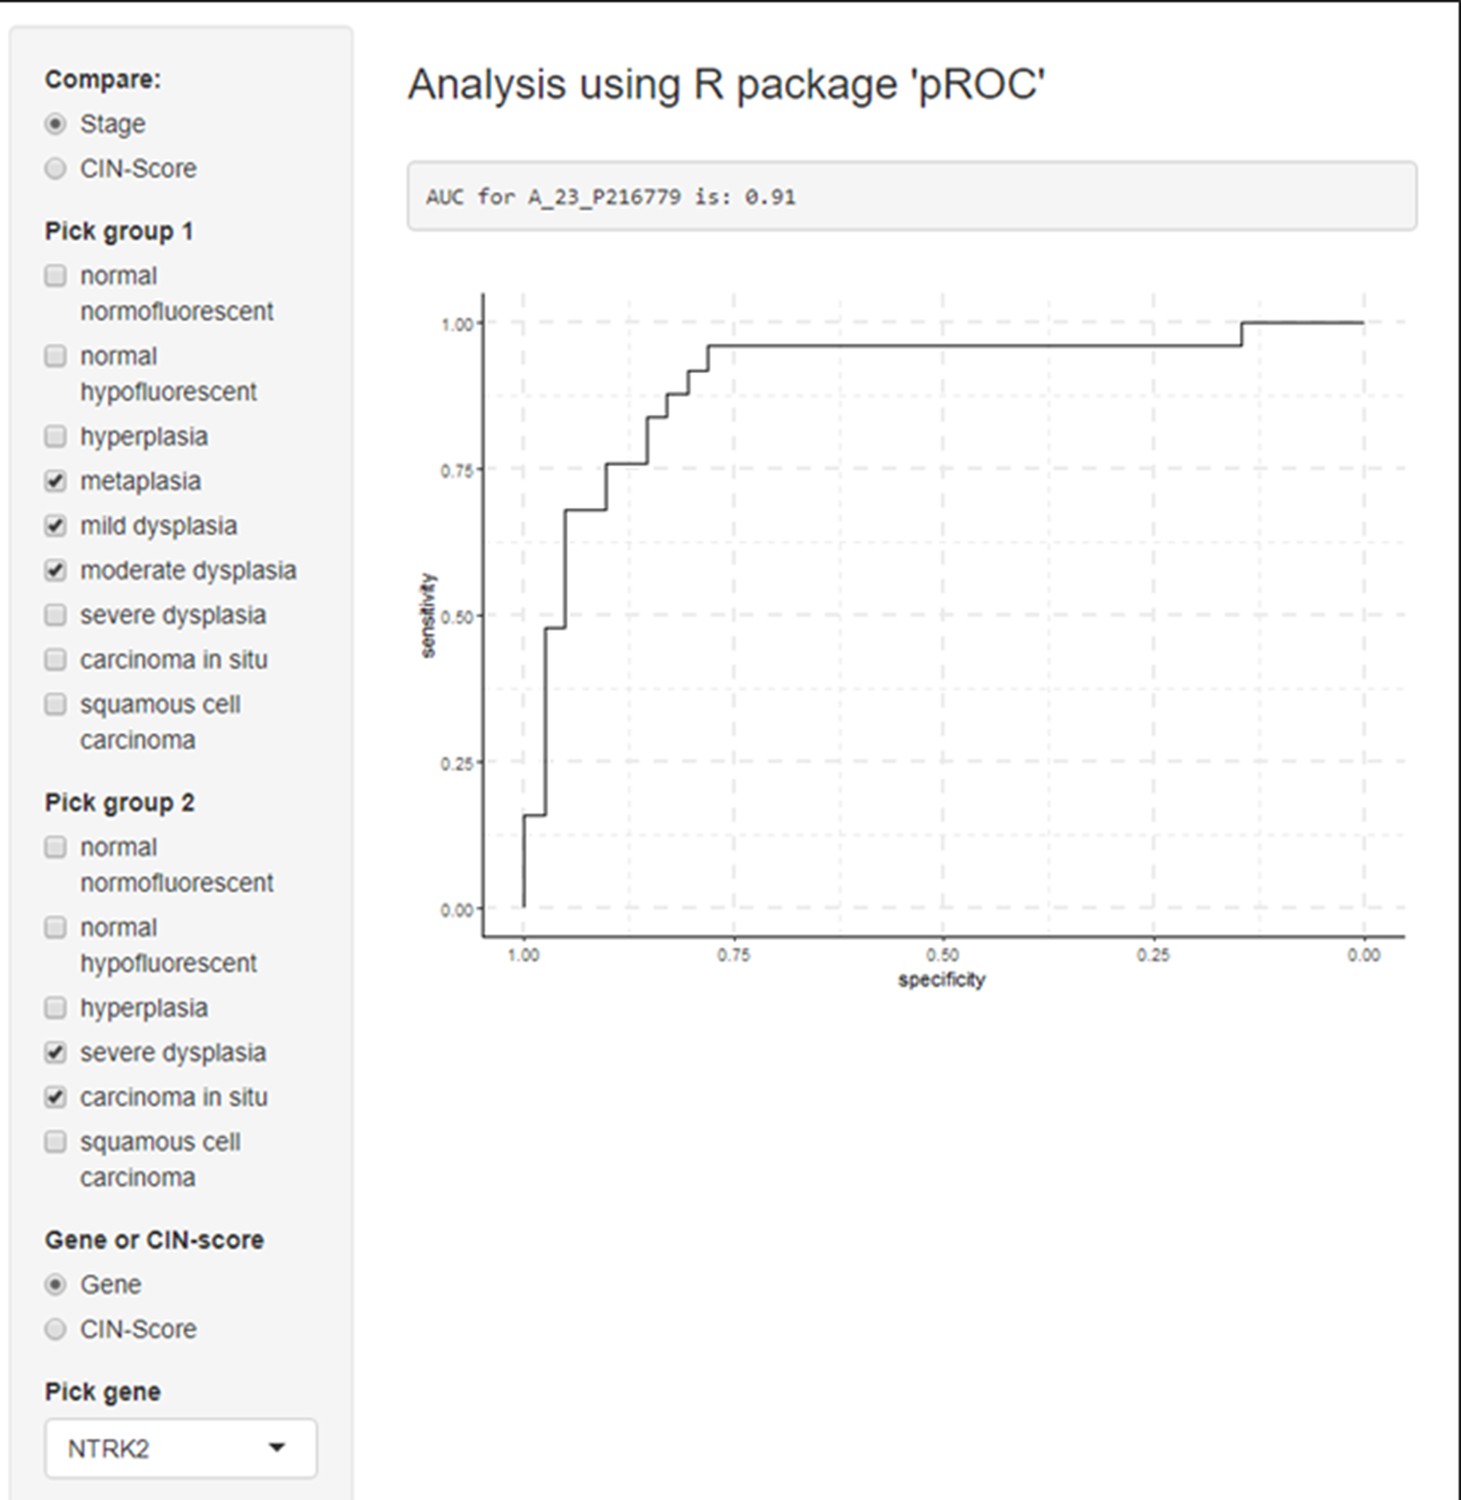
Example of receiver operating characteristic (ROC) curves visualization for a gene of interest (NRTK2) in premalignant lesion (PML) samples stratified by low and high grades.
Figure 3
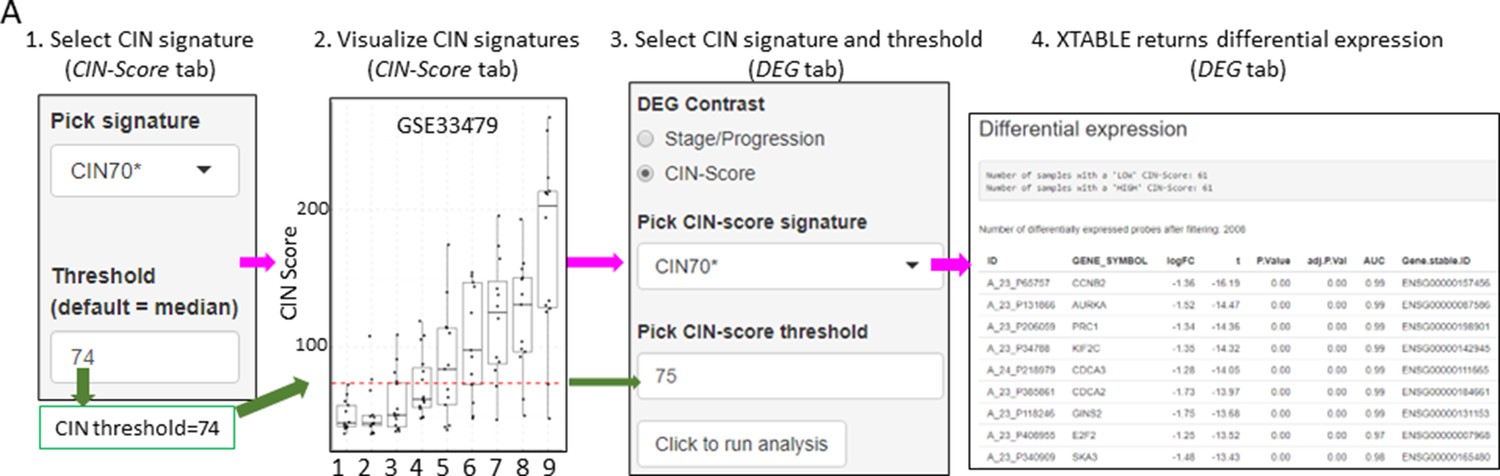
Differential expression analysis between two groups of samples classified according to a chromosomal instability (CIN)-score threshold.
The CIN-score function allows the graphic visualization of CIN-scores for all samples in a study. A CIN-score threshold selected by the user can be depicted on the graph (red dotted line). The CIN-score threshold selected by the user can be used in the DEG tab to define the two-group comparison. Stages 1–9 represent the nine developmental stages of LUSC as described in Mascaux et al., 2019 (GSE33479). CIN70, CIN25, and CIN5 can be used in the DEG tab. Sample sizes: n=12 (stage 7), n=13 (stages 1, 5, 6 and 8), n=14 (stages 2 and 9), n=15 (stages 3 and 4). Boxplots show median and upper/lower quartile. Whiskers show the smallest and largest observations within 1.5× IQR.
Figure 4 with 1 supplement
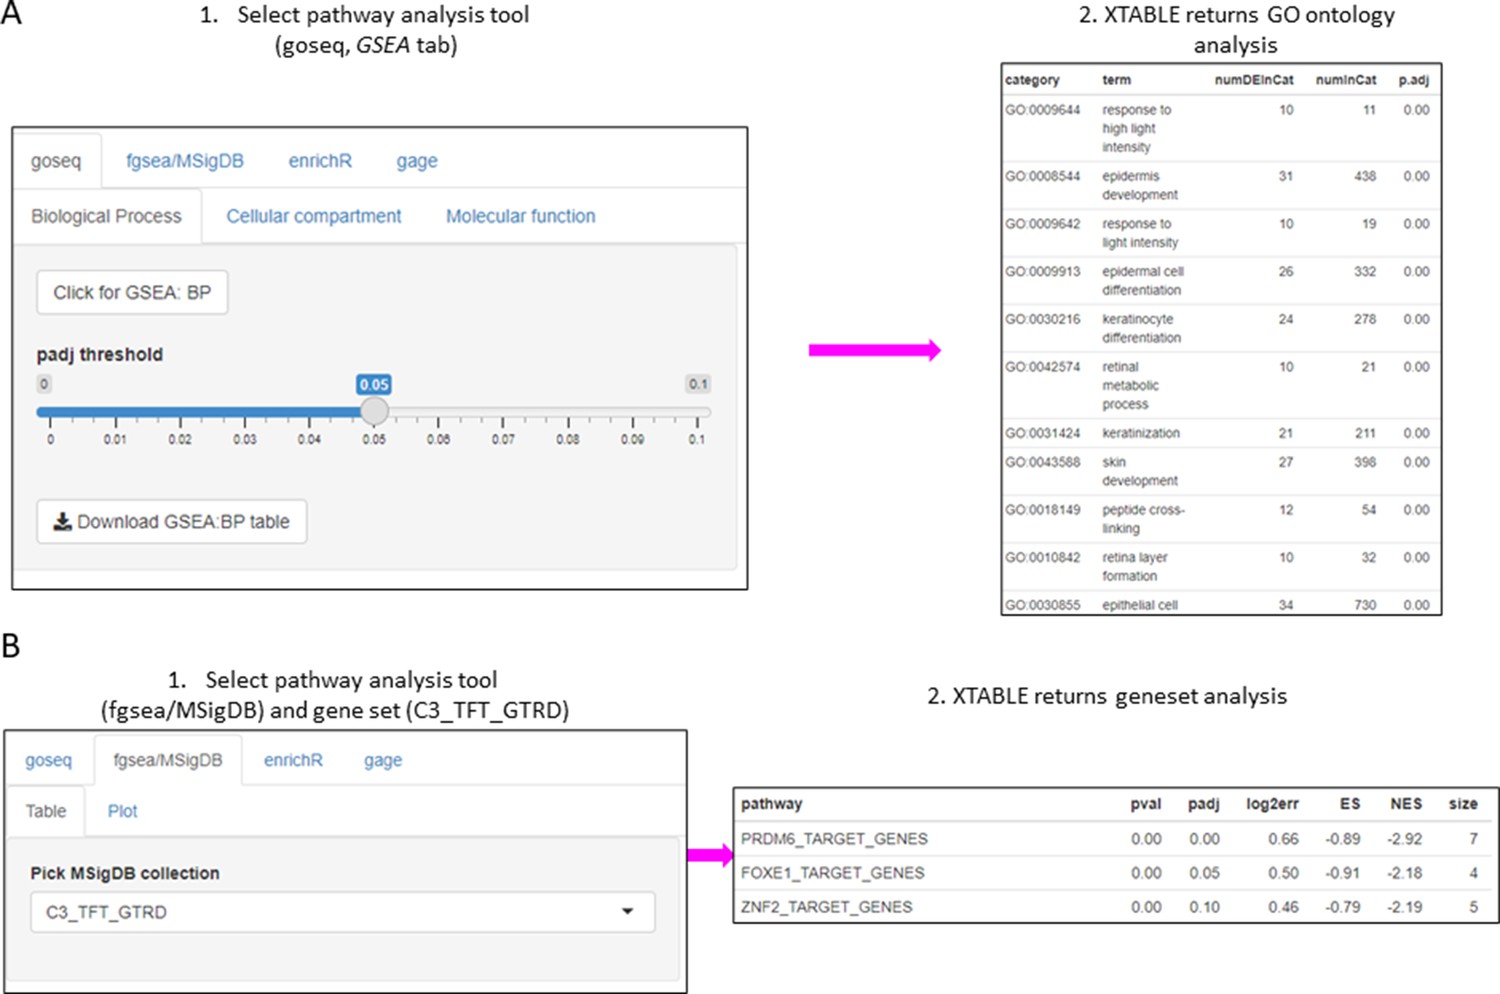
Gene set enrichment analyses in a list differentially expressed genes using the GSEA tab.
(A) Gene set enrichment analysis using the goseq tool of a list of differentially expressed genes obtained in the DEG tab. One of the three main Gene Ontologies (GO) can be selected for analysis at a time. After selection of a p-value, XTABLE (Exploring Transcriptomes of Bronchial Lesions) returns a downloadable list of GO with associated statistics. (B) Gene set enrichment analysis using the fgsea/MSigDB tool. This tool allows the selection of any collection included in MSigDB and returns a list of signatures with associated statistics. The example shows the selection of the C3_TFT_GTRD collection (Transcription Factor Targets annotated in the Gene Transcription Regulation Database).
Figure 4—figure supplement 1
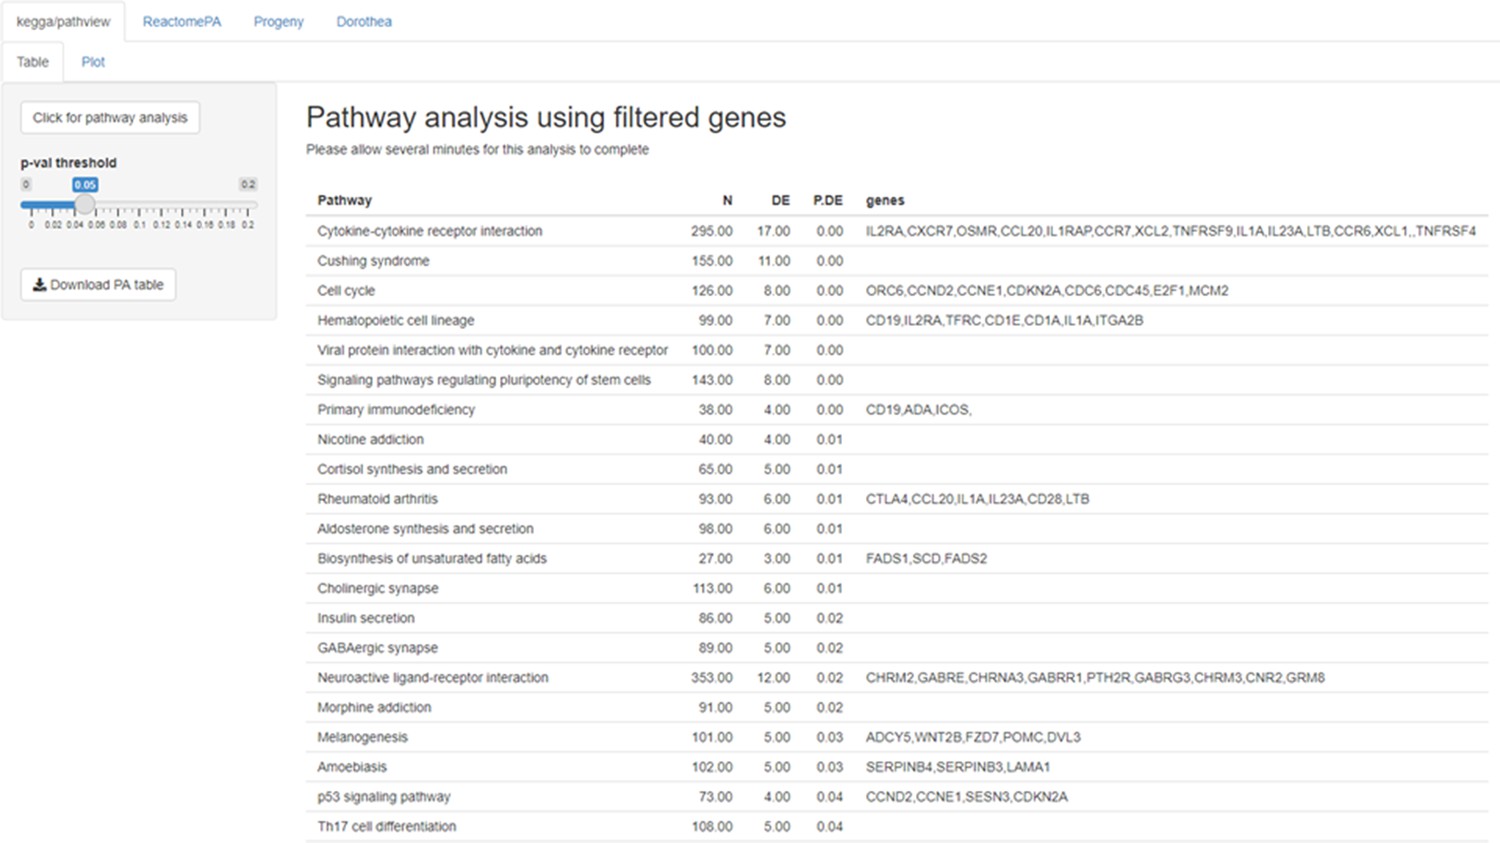
Example of pathway analysis (PA tab) output for a gene list obtained with the DEG function.
Figure 5

XTABLE (Exploring Transcriptomes of Bronchial Lesions) functions to implement analyses on individual genes (Gene tab) and user defined gene signatures (Signature tab).
(A) The ‘Expr’ function (under the Gene tab) retrieves the normalized expression values for a gene of interest in all samples. (B) The ‘Indiv_Contrast’ tool compares the expression of a gene of interest in groups of samples with a predetermined group. In the example, the function compares the expression of MYC in all stages with the normal normofluorescent group in GSE33479. (C) The ‘Mult_Contrast’ tool enables the grouping of samples in up to four groups (contrasts) and statistical comparison with a reference group determined by the user. The example shows the analysis of MYC expression in four groups of samples from the GSE33479 cohort (normal, low-grade, high-grade, and invasive carcinomas). The ‘normal’ group is set as reference group for statistical analysis. (D) Example of the use of the Heatmap tab to interrogate to visualize the expression of gene sets in premalignant lesions (PMLs). Gene sets can be defined by the user (as in the example) and are shown using the stage classification and entered manually or from a .csv file. Alternatively, the heatmap can be generated from a list of differentially expressed genes from the DEG tab or a selected number of genes filtered by variance. The three options can be selected in the scroll-down menu. In the example shown, the heatmap shows all microarray probes associated to each gene symbol. p-Values calculated using Welch’s t-test.
Figure 6 with 7 supplements
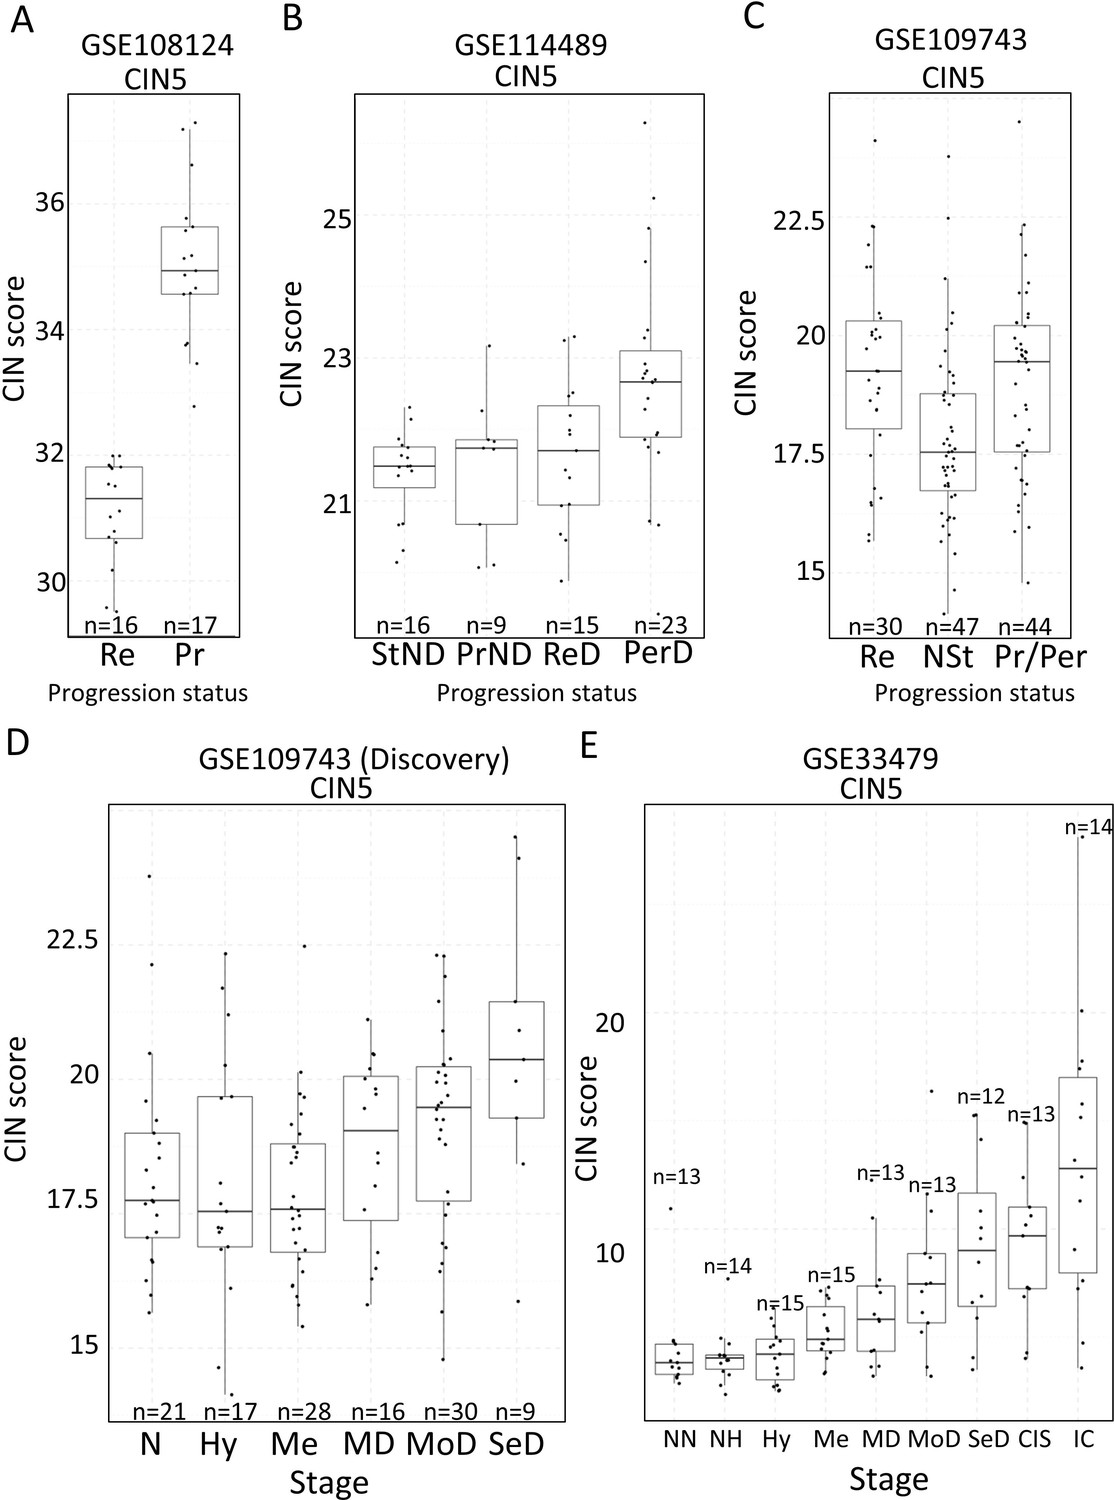
Association of carcinomas in situ (CIN)-scores with progression status and stage in the four cohorts of XTABLE (Exploring Transcriptomes of Bronchial Lesions).
(A) CIN5 score in regressive (Re) and progressive (Pr) carcinomas in situ (CIS) lesions from cohort GSE108124. (B) CIN5 scores in stable non-dysplasias (StND), progressive non-dysplasias (PrND), regressive dysplasias (ReD), and persistent dysplasias (PerD) from cohort GSE114489. (C) CIN5 scores in Re, normal-stable (NSt), and progressive/persistent (Pr/Per) premalignant lesions (PMLs) from cohort GSE109743. (D and E) Evolution of CIN-scores in lung squamous cell carcinoma (LUSC) developmental stages for cohorts GSE109743 and GSE33479. N: normal; NN: normal normofluorescent; NH: normal hypofluorescent; Hy: hyperplasia; Me:metaplasia; MD: mild dysplasia; MoD: moderate dysplasia; SeD: severe dysplasia; CIS: carcinoma in situ; IC: invasive carcinoma. Boxplots show median and upper/lower quartile. Whiskers show the smallest and largest observations within 1.5× IQR.
Figure 6—figure supplement 1
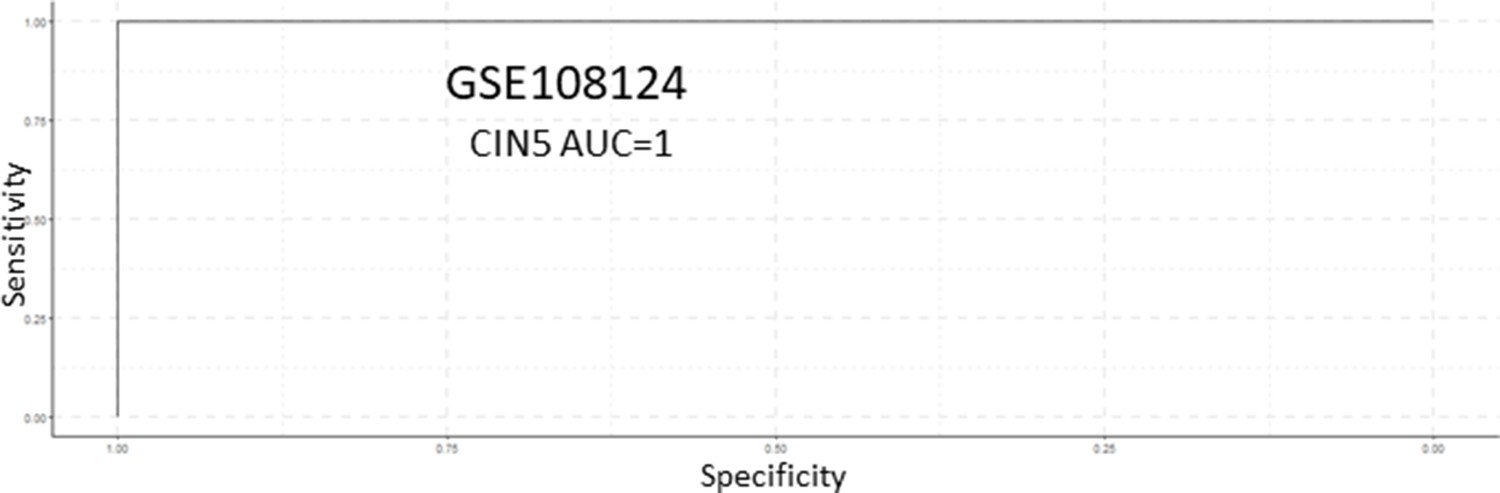
Receiver operating characteristic (ROC) analysis of CIN5 as predictor of carcinomas in situ (CIS) progression in the GSE108124 cohort.
Figure 6—figure supplement 2
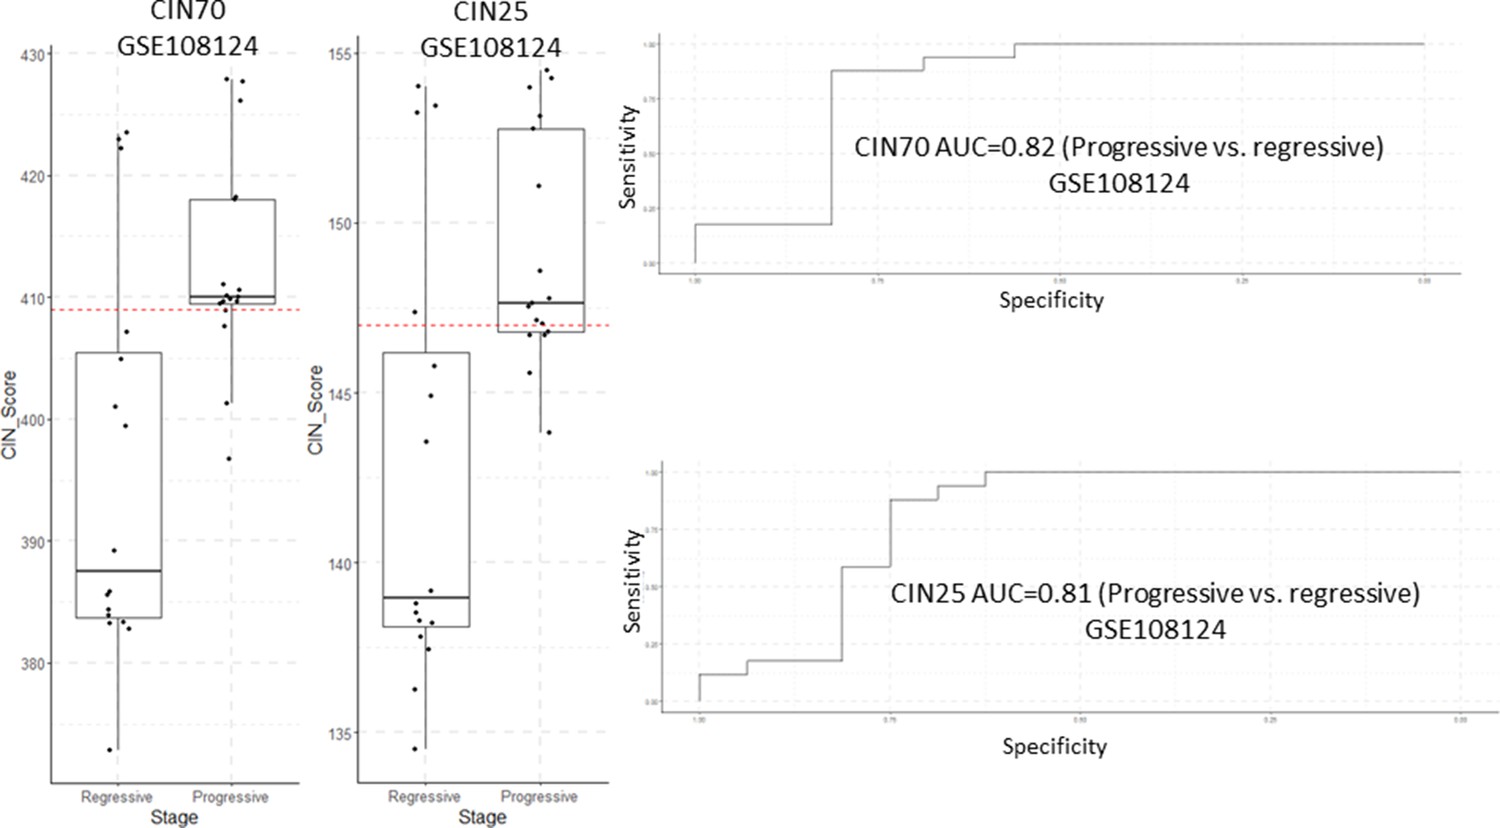
Analysis of CIN70 and CIN25 scores as predictors of carcinomas in situ (CIS) progression in GSE108124.
Sample size: regressive n=16, progressive n=17. Boxplots show median and upper/lower quartile. Whiskers show the smallest and largest observations within 1.5× IQR.
Figure 6—figure supplement 3
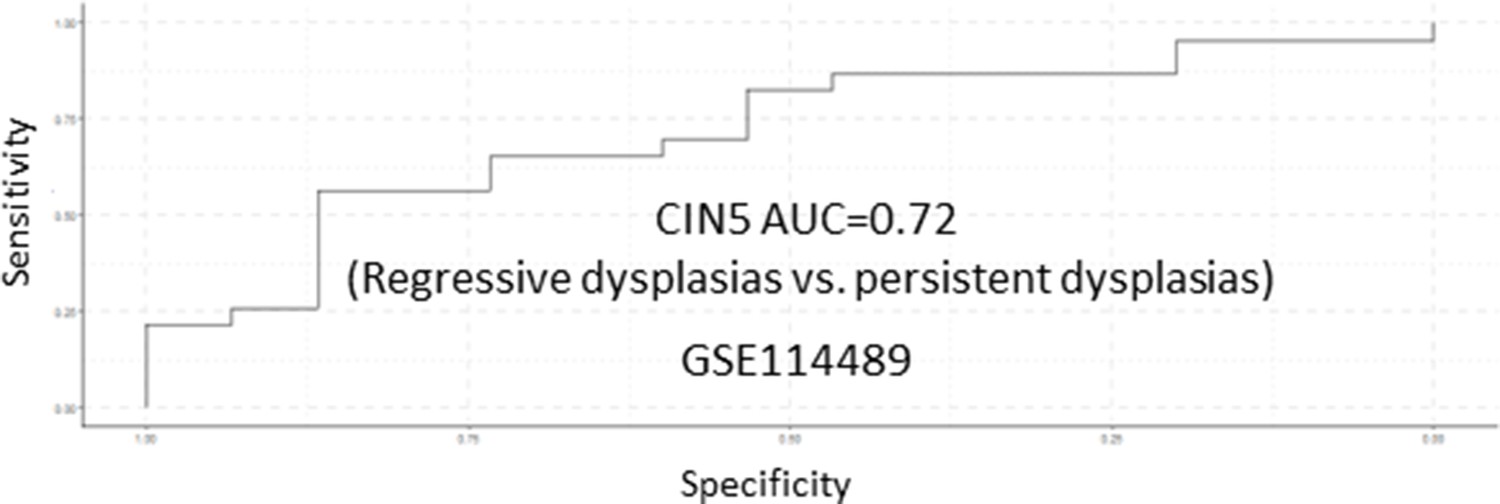
Receiver operating characteristic (ROC) analysis of CIN5 as predictor of premalignant lesion (PML) progression in the GSE114489 cohort.
Figure 6—figure supplement 4
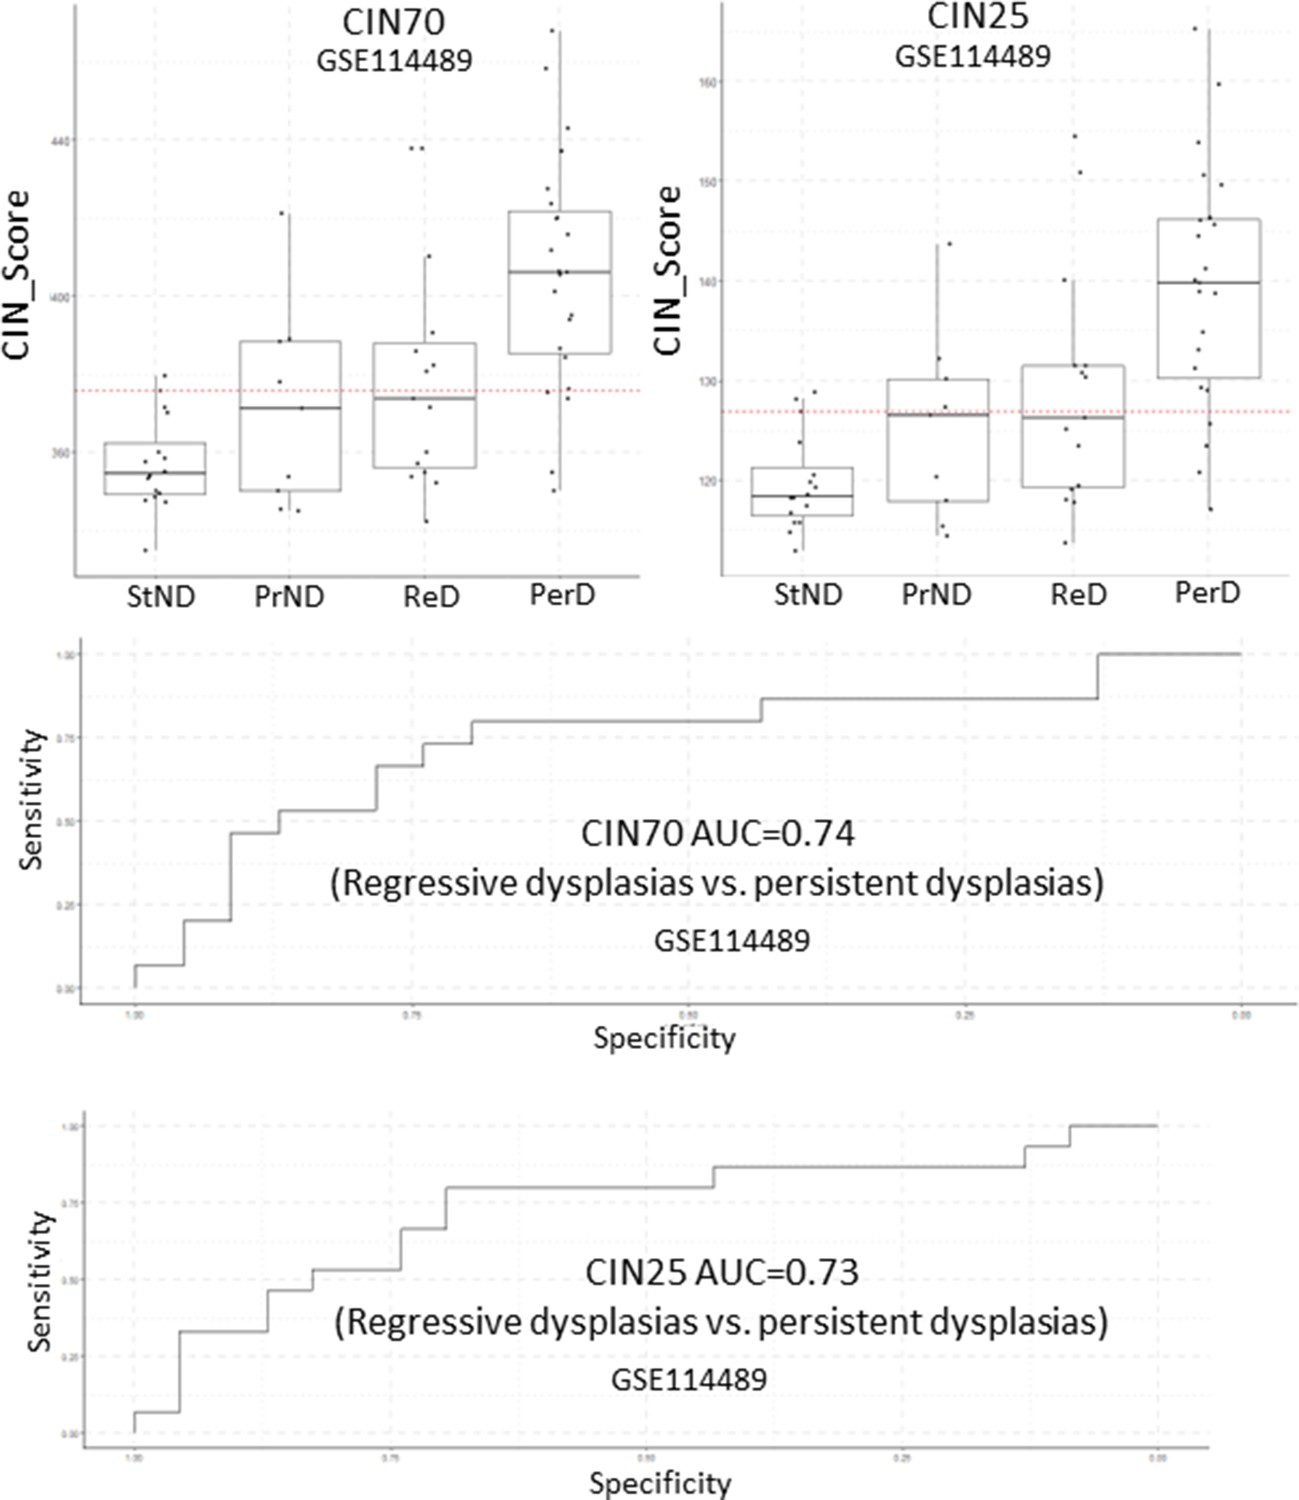
Analysis of CIN70 and CIN25 scores as predictors of premalignant lesion (PML) progression in GSE114489.
Sample size: StND n=16, PrND n=9, ReD n=15, PerD=23. Boxplots show median and upper/lower quartile. Whiskers show the smallest and largest observations within 1.5× IQR.
Figure 6—figure supplement 5
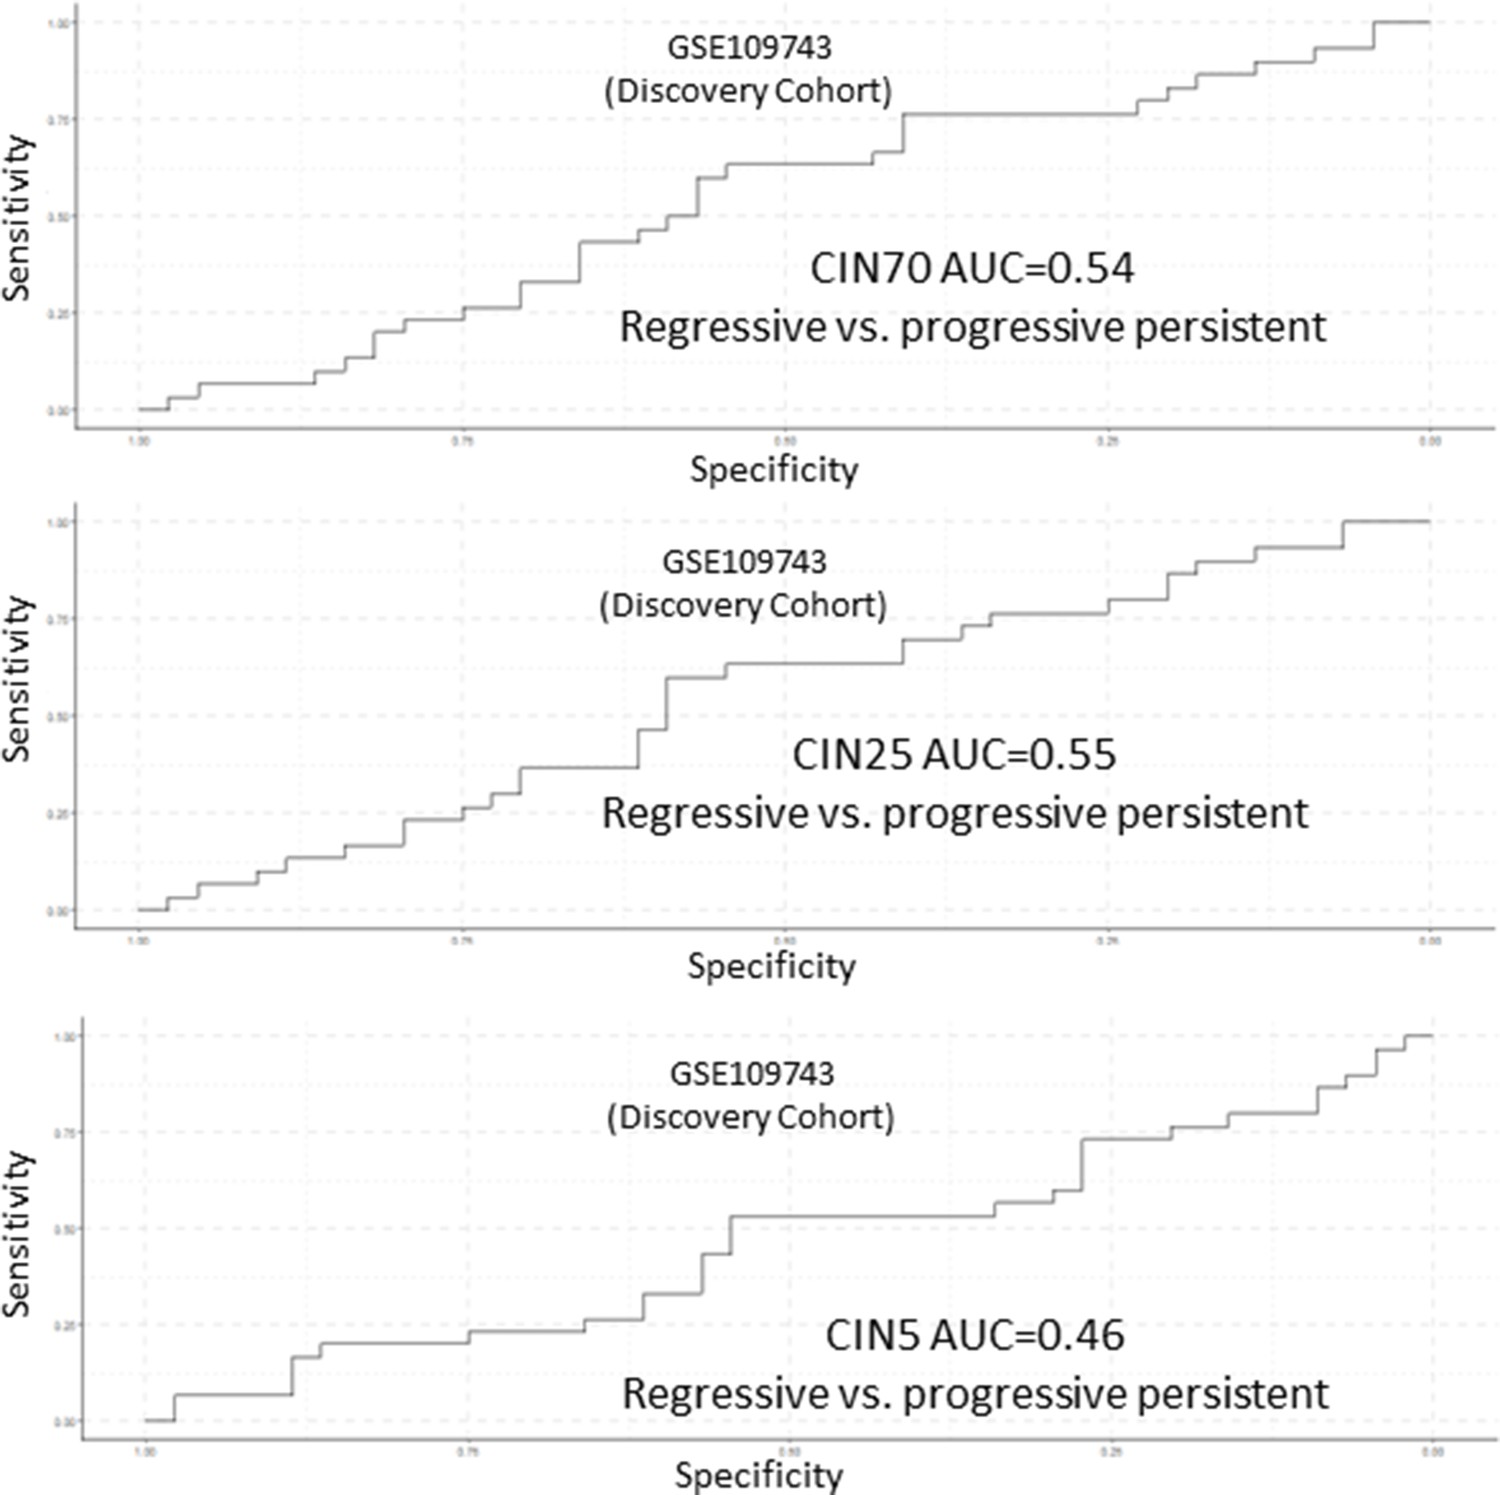
Analysis of CIN70, CIN25, and CIN5 scores as predictors of premalignant lesion (PML) progression in GSE109743.
Figure 6—figure supplement 6
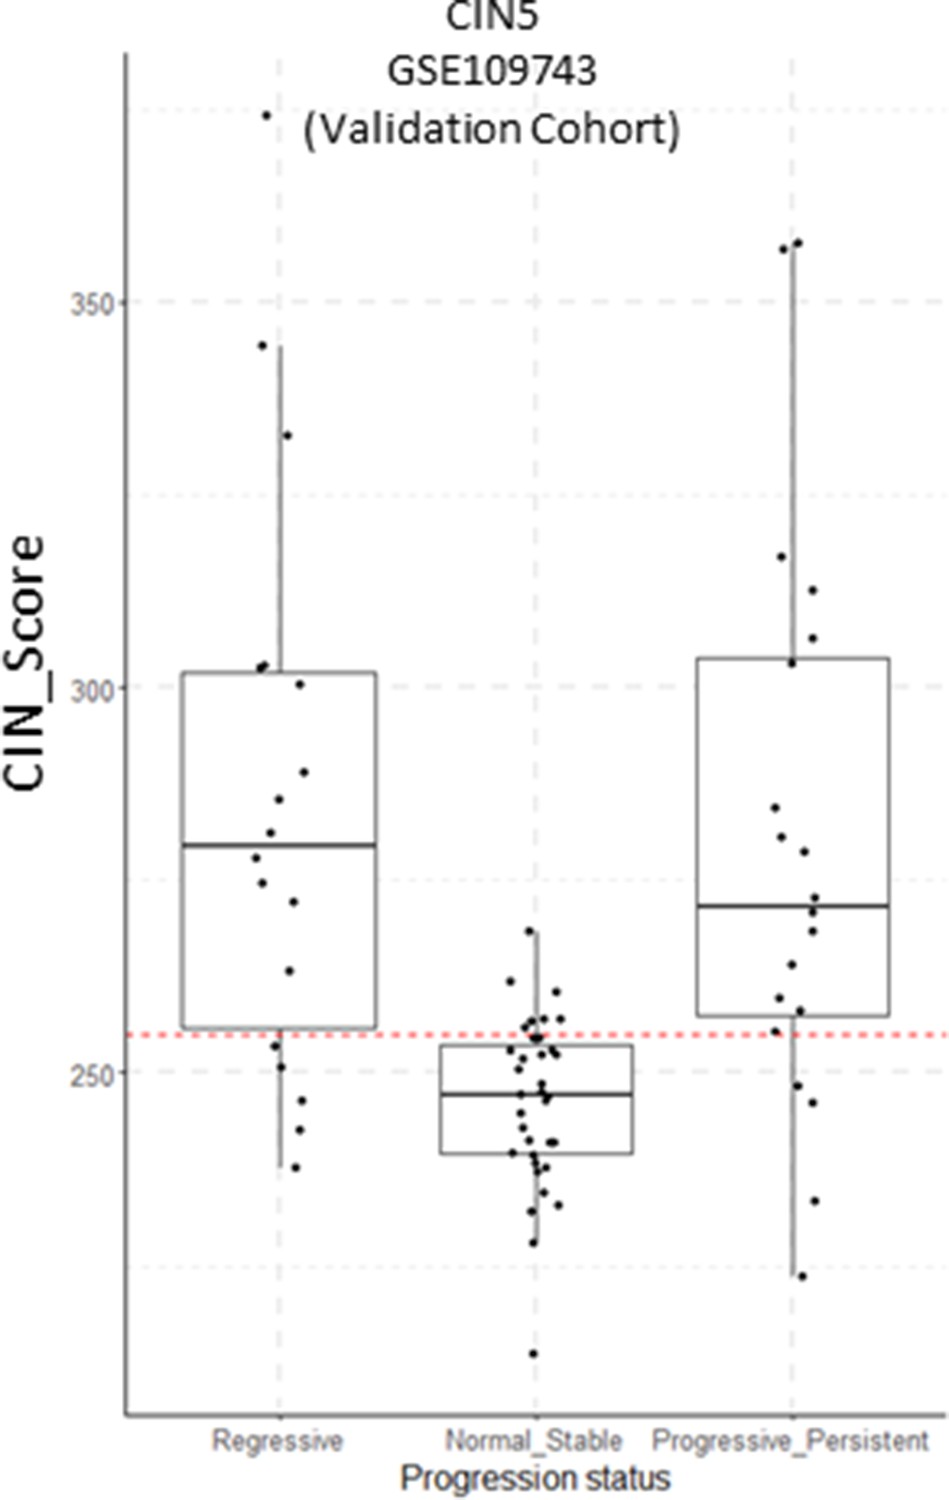
CIN5 scores in the GSE109743 cohort with samples classified by progression status.
Sample size: Regressive n=18, Normal Stable n=35, Progressive/Persistent n=20. Boxplots show median and upper/lower quartile. Whiskers show the smallest and largest observations within 1.5× IQR.
Figure 6—figure supplement 7
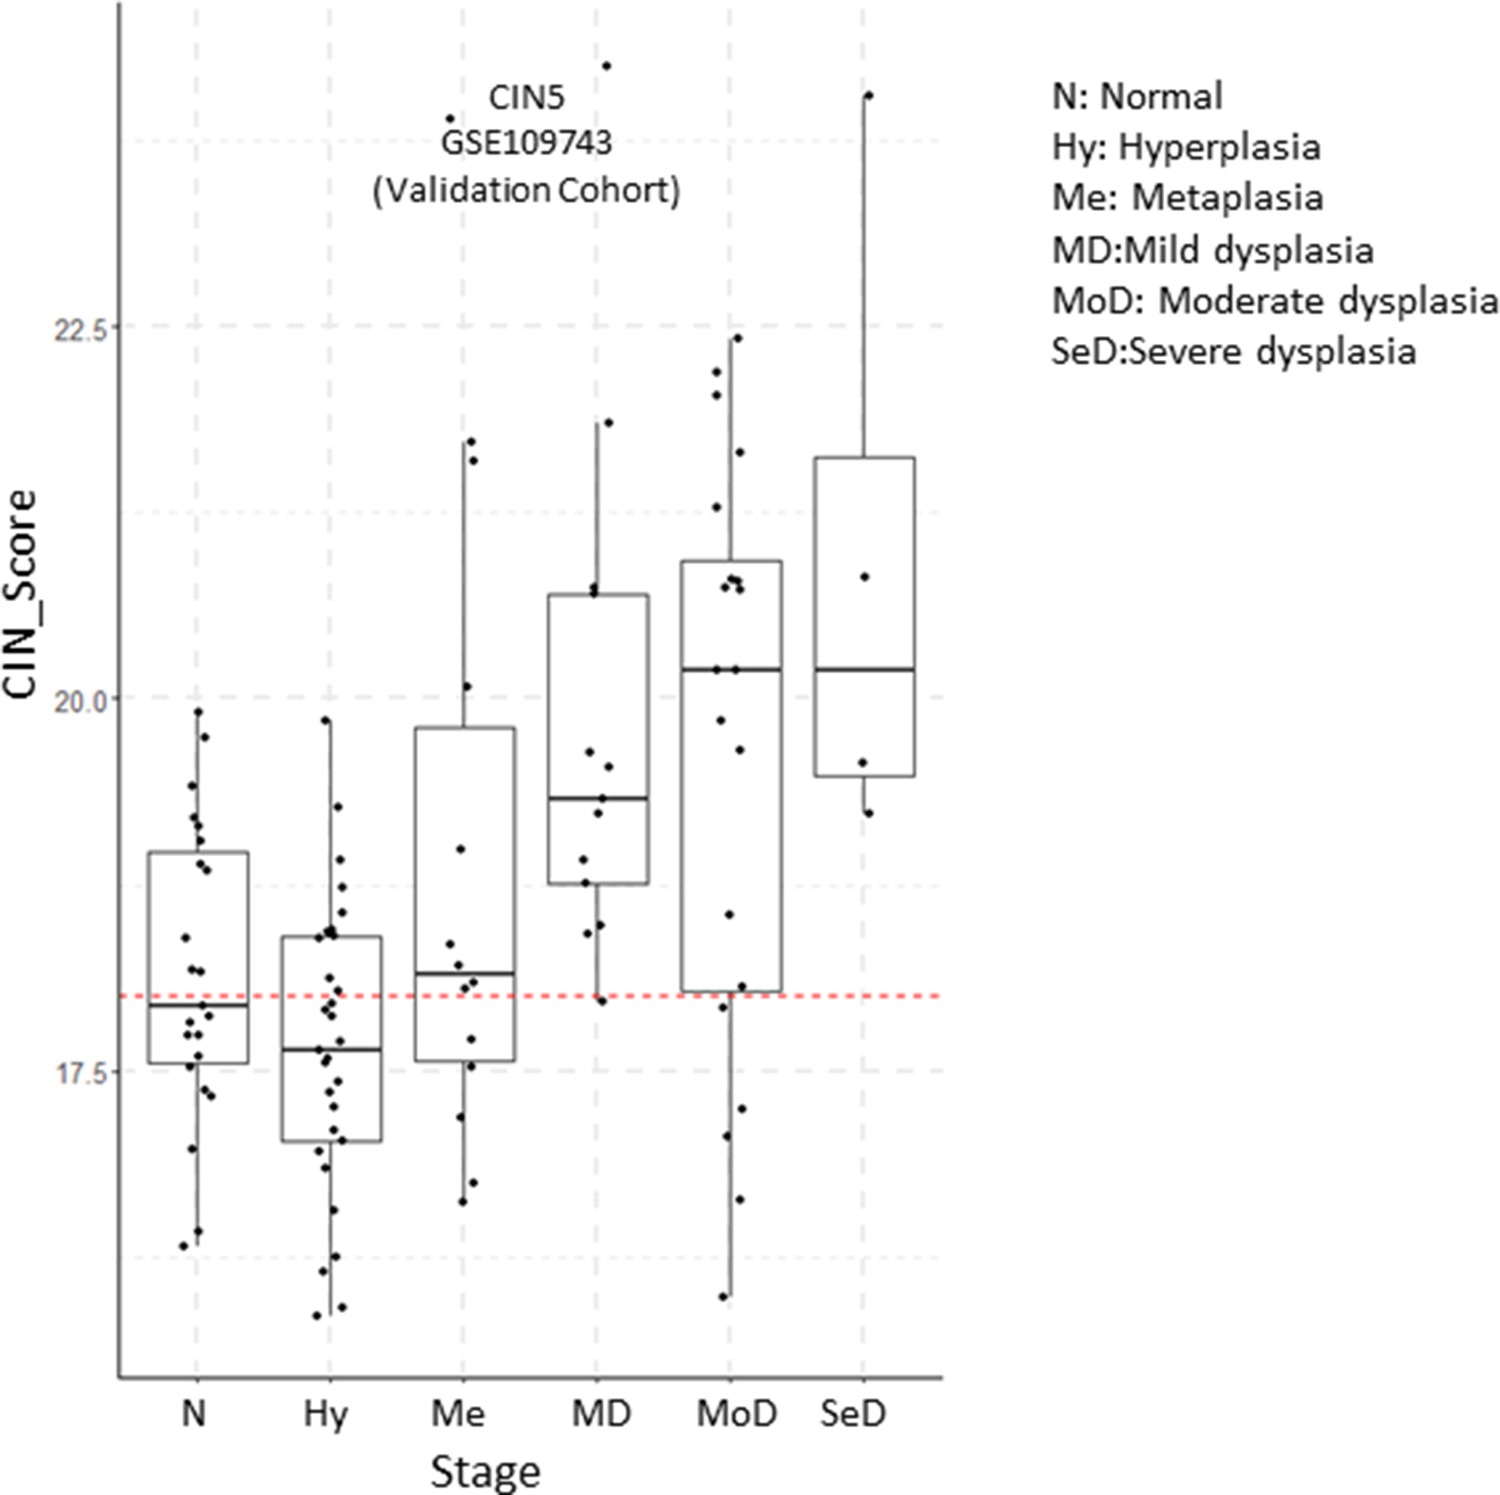
Evolution of CIN5 scores by premalignant lesion (PML) stage in the validation cohort of GSE109743.
Sample size: N n=23, Hy n=31, MD n=13, MoD n=20, SeD n=4. Boxplots show median and upper/lower quartile. Whiskers show the smallest and largest observations within 1.5× IQR.
Figure 7 with 1 supplement
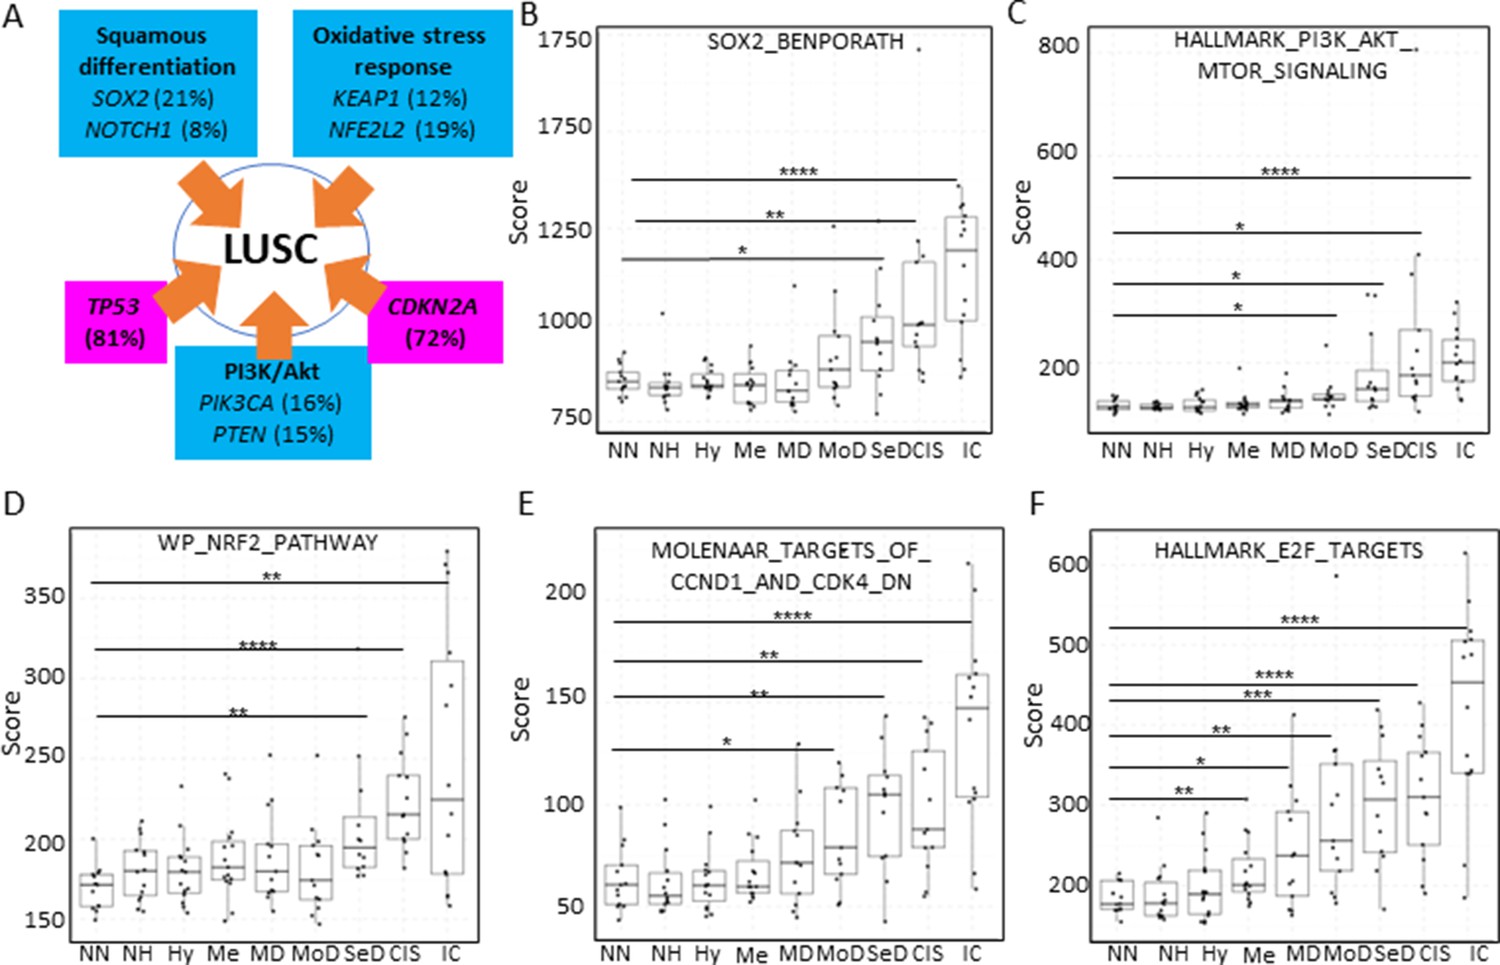
Mapping the evolution of the most relevant lung squamous cell carcinoma (LUSC) pathways to the LUSC developmental stages using published MSigDB transcriptional signatures.
(A) Diagram showing the most important pathways involved in LUSC and the genes involved in such pathways that are found genetically altered in LUSC tumours. (B) Evolution of the SOX2 (the most frequent driver of the squamous differentiation pathway) transcriptional signature (SOX2_BENPORATH) during LUSC progression (GSE33479 cohort). (C) Evolution of the PI3K/Akt pathway during LUSC progression (HALLMARK_PI3K_AKT_MTOR_SIGNALING). (D) Evolution of the NRF2 (WP_NRF2_PATHWAY) transcriptional signature (correlated with the oxidative stress response) during LUSC progression. (E) Evolution of a transcriptional signature correlated with cyclin-D1 and CDK4 (MOLENAAR_TARGETS_OF_CCND1_AND_CDK4_DN) during LUSC progression. CDKN2A alterations in LUSC lead to the inactivation of the p16INK4a, a CDK4 inhibitor. (F) Evolution of the expression of E2F targets (HALLMARK_E2F_TARGETS). Sample size: NN n=13, NH n=14, Hy n=15, Me n=15, MD n=13, MoD n=13, SeD n=12, CIS n=13, IC n=14. Boxplots show median and upper/lower quartile. Whiskers show the smallest and largest observations within 1.5× IQR. *p<0.05, **p<0.01, ***p<0.001, p<0.0001 (Welch’s t-test).
Figure 7—figure supplement 1
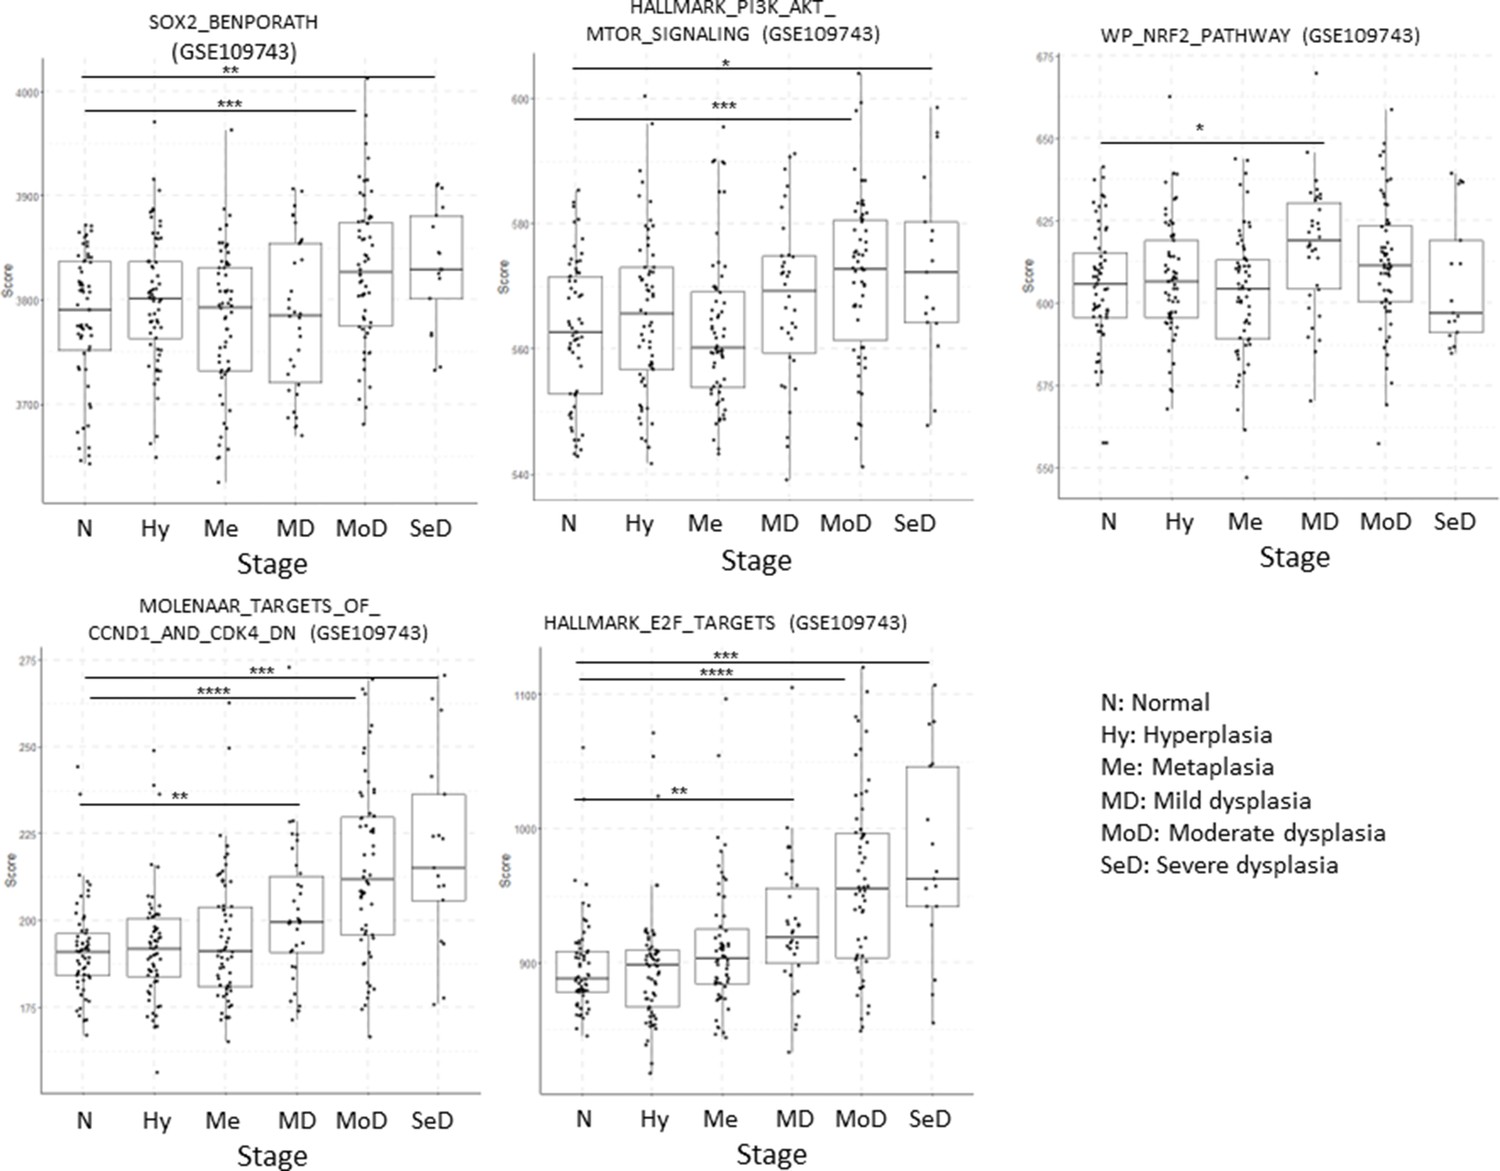
Evolution of five transcriptional signatures in cohort GSE109743.
Sample size: N n=61, Hy n=61, Me n=60, MD n=34, MoD n=34, SeD n=17. Boxplots show median and upper/lower quartile. Whiskers show the smallest and largest observations within 1.5× IQR.
Videos
Video 1
Step-by-step instructions to install XTABLE (Exploring Transcriptomes of Bronchial Lesions) using RStudio.
Tables
Table 1
Description of the four cohorts included in XTABLE (Exploring Transcriptomes of Bronchial Lesions).
| GEO accession | PMID | Stages | Progression status known | Number of samples | Sample type | Transcriptome |
|---|---|---|---|---|---|---|
| GSE33479 | 31243362 | Multiple | No | 122 | Whole biopsies | Microarray |
| GSE109743 | 31015447 | Multiple* | Yes | 448 Discovery cohort (197 Bx, 91 Br) Validation cohort (111Bx, 49 Br) | Whole biopsies and brushings | RNAseq |
| GSE114489 | 29997230 | Dysplasias normal | Yes | 63 | Whole biopsies | Microarray |
| GSE108124 | 30664780 | CIS | Yes | 33 | Microdissected | Microarray |
-
Bx: biopsies; Br: brushings.
-
*
This cohort includes neither carcinomas in situ (CIS) nor invasive carcinomas.
Additional files
Download links
A two-part list of links to download the article, or parts of the article, in various formats.
Downloads (link to download the article as PDF)
Open citations (links to open the citations from this article in various online reference manager services)
Cite this article (links to download the citations from this article in formats compatible with various reference manager tools)
Interrogating the precancerous evolution of pathway dysfunction in lung squamous cell carcinoma using XTABLE
eLife 12:e77507.
https://doi.org/10.7554/eLife.77507


