Mir155 regulates osteogenesis and bone mass phenotype via targeting S1pr1 gene
- Affiliated Stomatology Hospital of Guangzhou Medical University, Guangdong Engineering Research Center of Oral Restoration and Reconstruction, Guangzhou Key Laboratory of Basic and Applied Research of Oral Regenerative Medicine, China
- Laboratory for Myology, Department of Human Movement Sciences, Faculty of Behavioural and Movement Sciences, Vrije Universiteit Amsterdam, Amsterdam Movement Sciences, Netherlands
- State Key Laboratory of Respiratory Diseases, National Clinical Research Center for Respiratory Diseases, Guangzhou Institute of Respiratory Health, the First Affiliated Hospital of Guangzhou Medical University, China
- Guangdong Provincial Key Laboratory of Cancer Immunotherapy Research and Guangzhou Key Laboratory of Tumour Immunology Research, Cancer Research Institute, School of Basic Medical Science, Southern Medical University, China
- Institute of Comparative Medicine & Laboratory Animal Center, Southern Medical University, China
- Department of Oral and Maxillofacial Surgery/Pathology, Amsterdam UMC and Academic Center for Dentistry Amsterdam (ACTA), Amsterdam Movement Science, Vrije Universiteit Amsterdam, Netherlands
- Department of Oral Cell Biology, Academic Center for Dentistry Amsterdam (ACTA), University of Amsterdam and Vrije Universiteit Amsterdam, Netherlands
Figures
Figure 1

Mir155 transgenic (Mir155-Tg) mice showed a low bone mass phenotype.
(A) Mir155 expression in bone, (B) Hematoxylin and eosin (H&E) staining, (C) representative micro-CT images for cortical bone, (D) bone volume/total volume (BV/TV) and bone mineral density (BMD) analysis, (E) representative micro-CT images for trabecular bone, (F) BV/TV, BMD, trabecular number (Tb.N), trabecular thickness (Tb.Th), and trabecular separation (Tb.Sp) analysis. Data are presented as mean ± SD, n=8. Significant difference compared to wild-type mice, *p<0.05, **p<0.01, and ****p<0.0001.
-
Figure 1—source data 1
Raw data for Figure 1A, D (BV/TV and BMD), and Figure 1F (BV/TV, BMD, Tb.N, Tb.Th, and Tb.Sp).
- https://cdn.elifesciences.org/articles/77742/elife-77742-fig1-data1-v2.xlsx
Figure 2
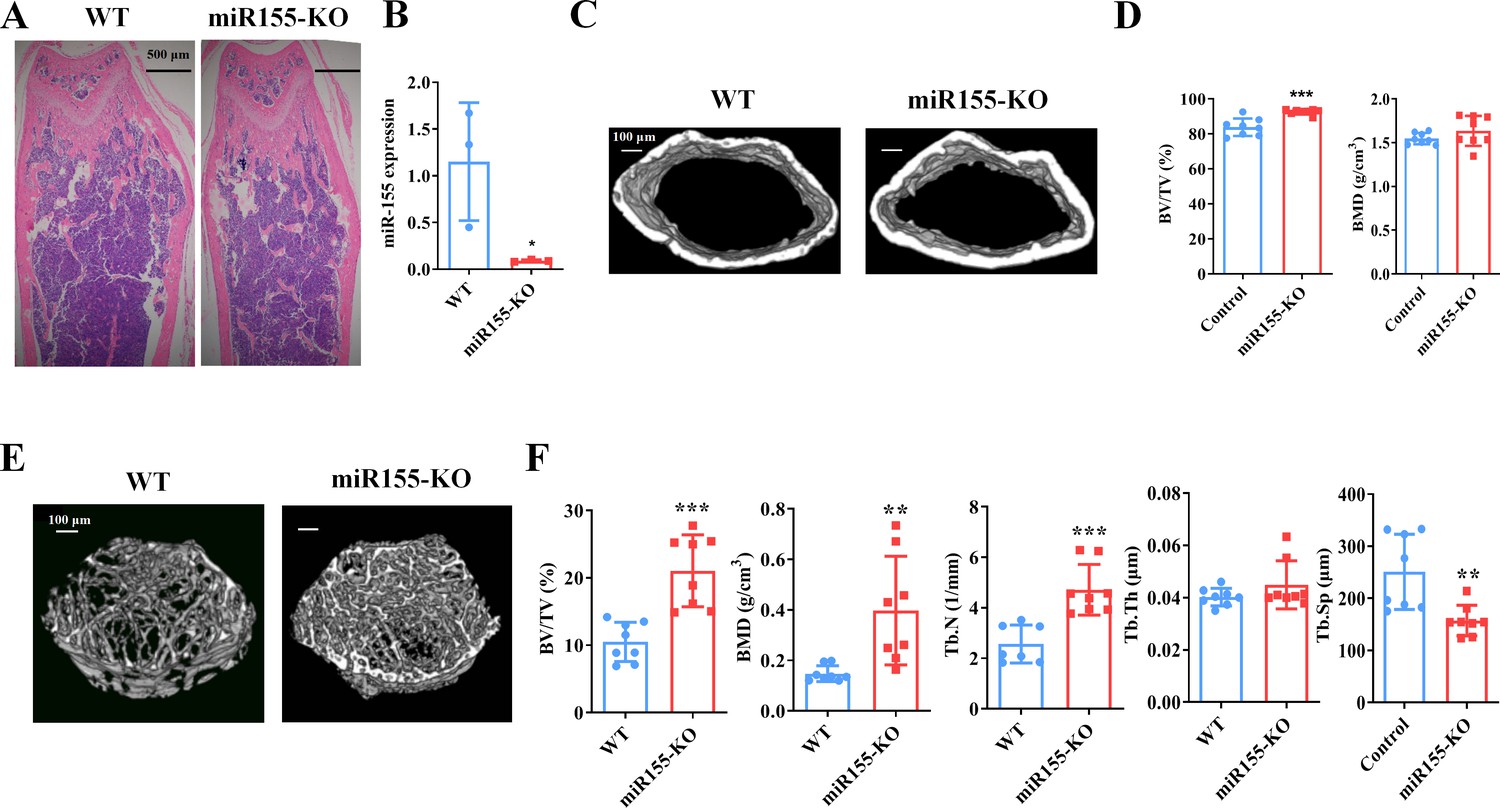
Mir155 knockout (Mir155-KO) mice showed a high bone mass phenotype.
(A) Mir155 expression in bone, (B) Hematoxylin and eosin (H&E) staining, (C) representative micro-CT images for cortical bone, (D) bone volume/total volume (BV/TV) and bone mineral density (BMD) analysis, (E) representative micro-CT images for trabecular bone, (F) BV/TV, BMD, trabecular number (Tb.N), trabecular thickness (Tb.Th), and trabecular separation (Tb.Sp) analysis. Data are presented as mean ± SD, n=8. Significant difference compared to wild-type group, *p<0.05, **p<0.01, and ***p<0.001.
-
Figure 2—source data 1
Raw data for Figure 2A, D (BV/TV and BMD), and Figure 2F (BV/TV, BMD, Tb.N, Tb.Th, and Tb.Sp).
- https://cdn.elifesciences.org/articles/77742/elife-77742-fig2-data1-v2.xlsx
Figure 3
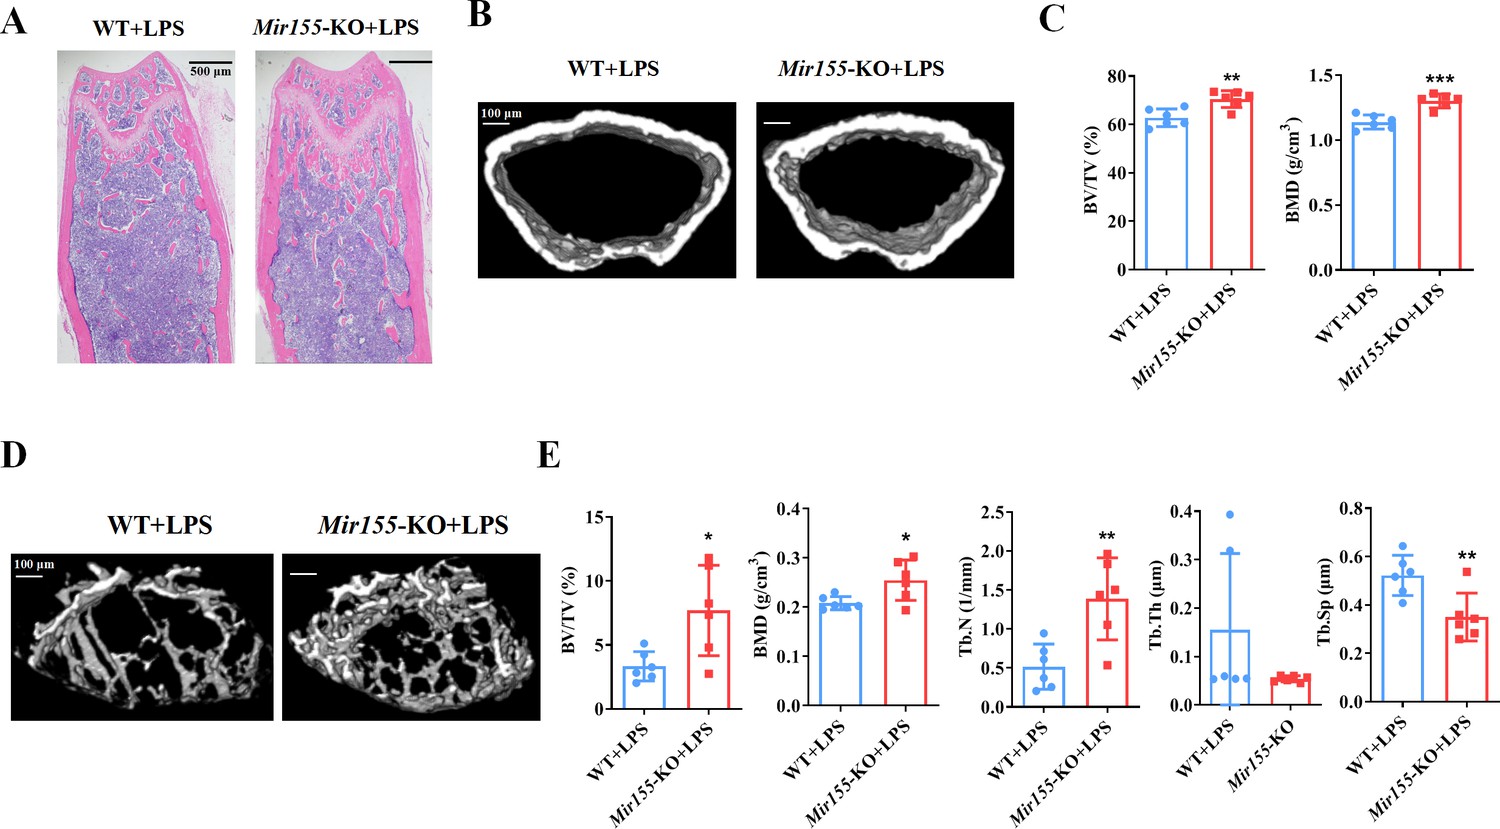
Mir155 knockout (Mir155-KO) mice showed higher resistance against lipopolysaccharide (LPS)-induced bone loss.
(A) Hematoxylin and eosin (H&E) staining, (B) representative micro-CT images for cortical bone, (C) bone volume/total volume (BV/TV) and bone mineral density (BMD) analysis, (D) Representative micro-CT images for trabecular bone, (E) BV/TV, BMD, trabecular number (Tb.N), trabecular thickness (Tb.Th), and trabecular separation (Tb.Sp) analysis. Data are presented as mean ± SD, n=6. Significant difference compared to wild-type group, *p<0.05, **p<0.01, and ***p<0.001.
-
Figure 3—source data 1
Raw data for Figure 3C (BV/TV and BMD) and Figure 3E (BV/TV, BMD, Tb.N, Tb.Th, and Tb.Sp).
- https://cdn.elifesciences.org/articles/77742/elife-77742-fig3-data1-v2.xlsx
Figure 4
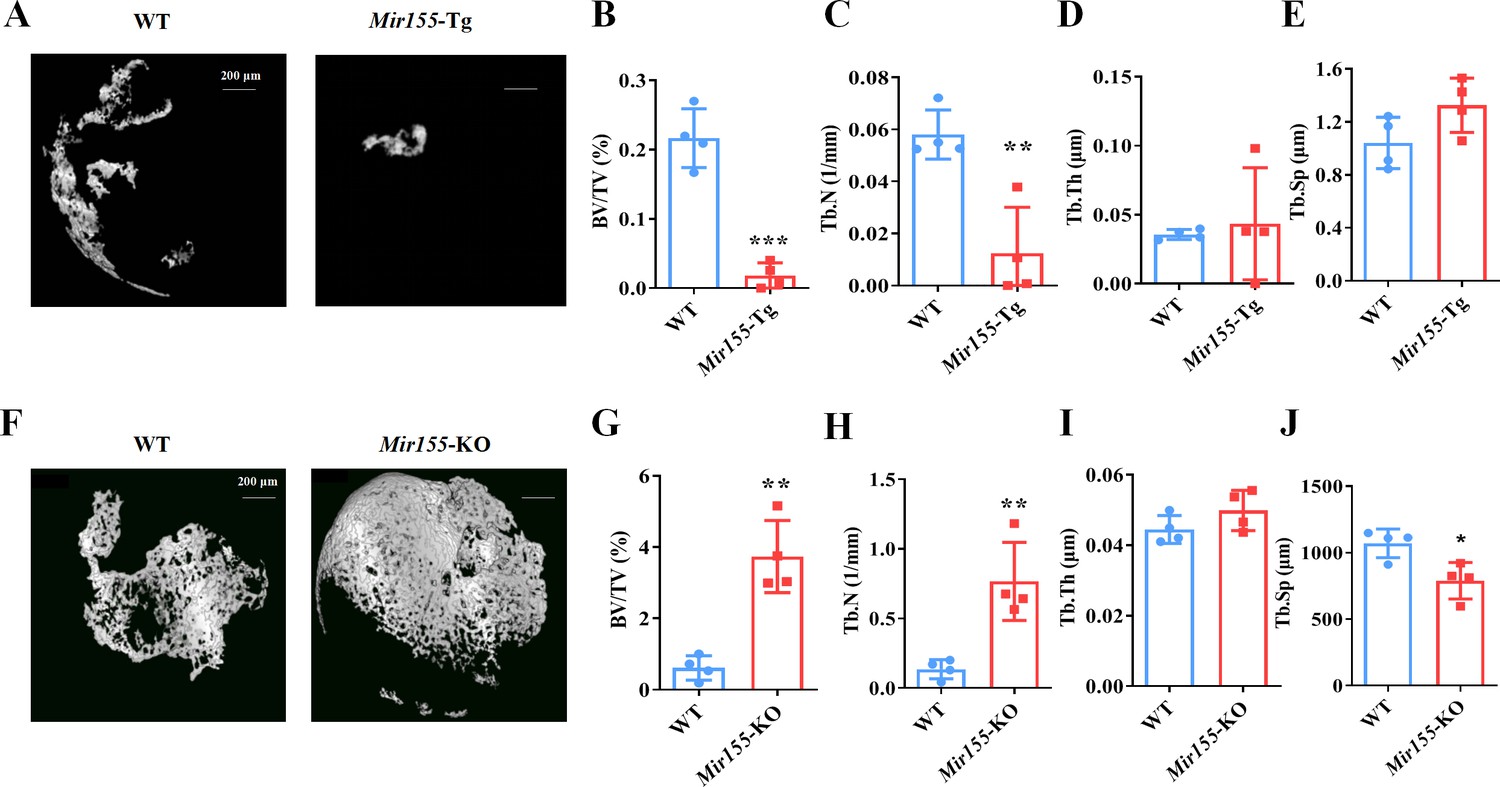
Ectopic bone regeneration was inhibited in Mir155 transgenic (Mir155-Tg) mice but enhanced in Mir155 knockout (Mir155-KO) mice.
(A) Representative micro-CT images. (B) Bone volume/total volume (BV/TV), (C) trabecular number (Tb.N), (D) trabecular thickness (Tb.Th), and (E) trabecular separation (Tb.Sp) analysis in Mir155-Tg and wild-type mice. (F) Representative micro-CT images. (G) BV/TV, (H) Tb.N, (I) Tb.Th, and (J) Tb.Sp analysis in Mir155-KO and wild-type mice. Data are presented as mean ± SD, n=4. Significant difference compared to wild-type group, *p<0.05, **p<0.01, and ***p<0.001.
-
Figure 4—source data 1
Raw data for Figure 4B, E, G-J.
- https://cdn.elifesciences.org/articles/77742/elife-77742-fig4-data1-v2.xlsx
Figure 5
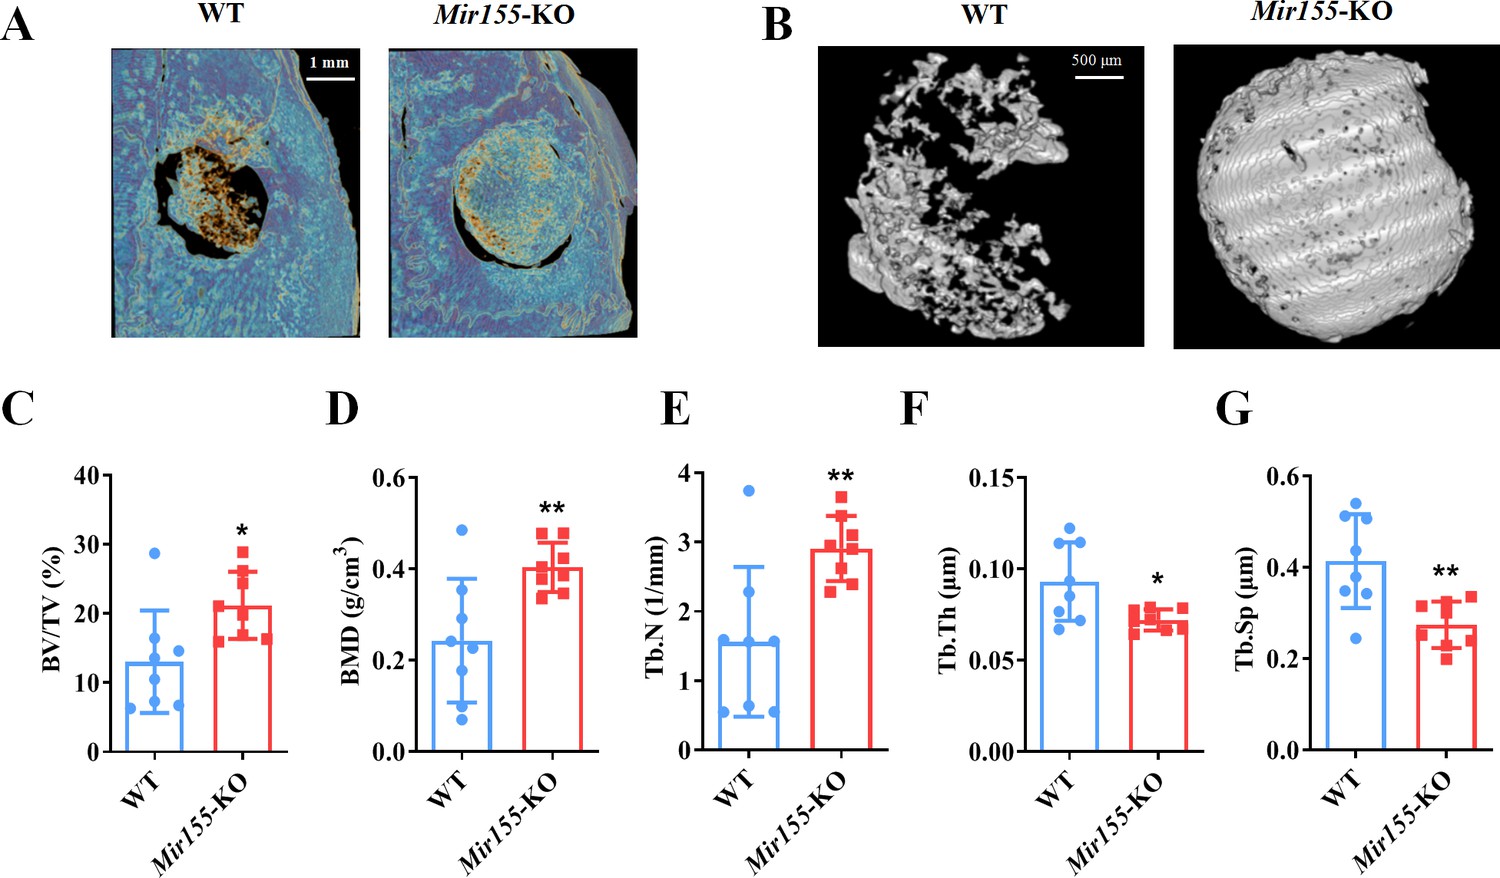
A higher degree of bone regeneration was observed in the calvarial defect of Mir155 knockout (Mir155-KO) mice with a low dose of BMP2 treatment.
(A) Representative micro-CT images, (B) local micro-CT images in defects, (C) bone volume/total volume (BV/TV), (D) bone mineral density (BMD), (E) trabecular number (Tb.N), (F) trabecular thickness (Tb.Th), and (G) trabecular separation (Tb.Sp) analysis. Data are presented as mean ± SD, n=8. Significant difference compared to wild-type mice, *p<0.05 and **p<0.01.
-
Figure 5—source data 1
Raw data for Figure 5C-G.
- https://cdn.elifesciences.org/articles/77742/elife-77742-fig5-data1-v2.xlsx
Figure 6
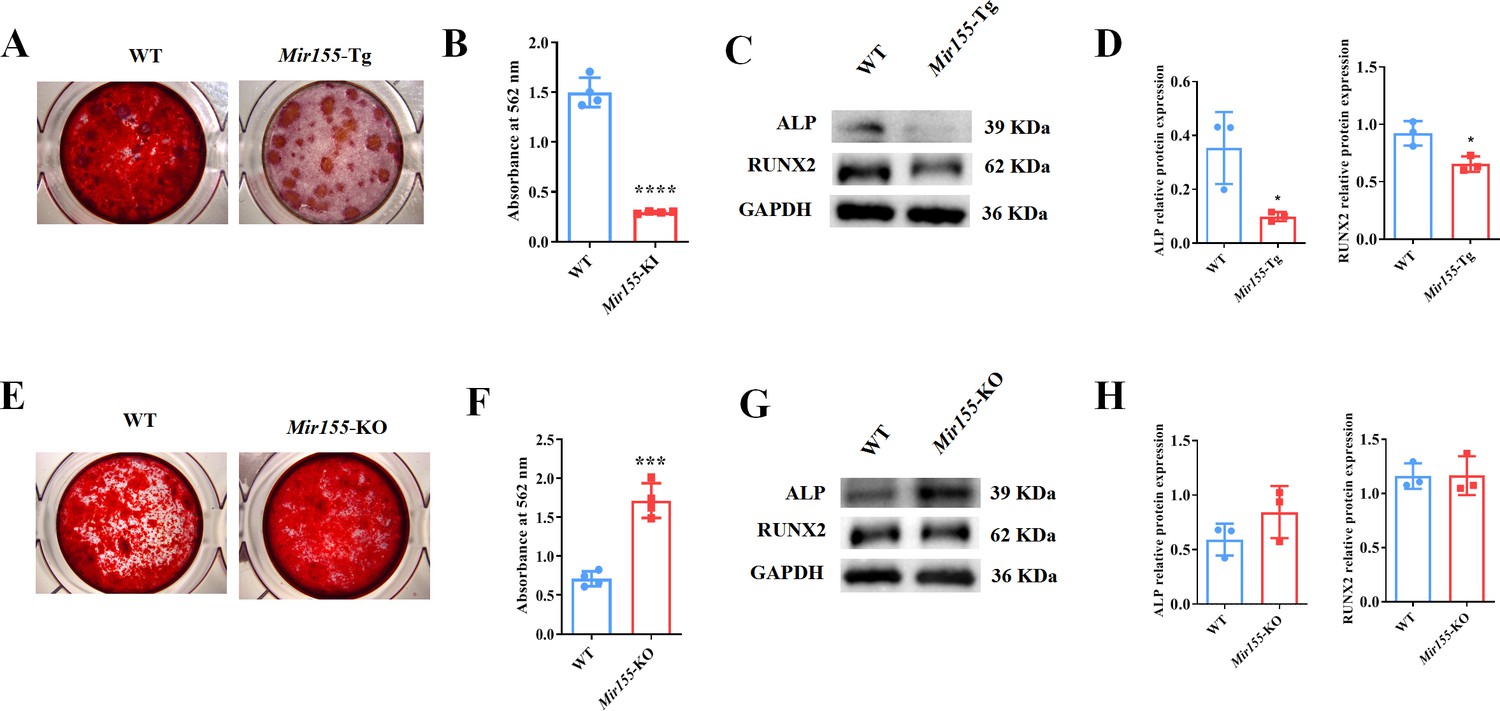
Mir155 transgenic (Mir155-Tg) and Mir155 knockout (Mir155-KO) bone marrow stromal stem cells (BMSCs) showed an opposite trend of osteogenic differentiation.
(A) Alizarin red staining (ARS) images at day 10 of culture, (B) ARS quantification, n=4, (C) Western blot analysis of osteogenic markers, and (D) densitometry quantification of protein bands in Mir155-Tg BMSCs, n=3. (E) ARS images stained at day 10 of culture, (F) ARS quantification, n=4, (G) Western blot analysis of osteogenic markers, and (H) densitometry quantification of protein bands in Mir155-KO BMSCs, n=4. Data are presented as mean ± SD. Significant difference compared to wild-type mice, *p<0.05, ***p<0.001, and ****p<0.0001.
-
Figure 6—source data 1
Raw data for Figure 6B, D (ALP and RUNX2), Figure 6E, H (ALP and RUNX2); original blots for Figure 6C and G.
- https://cdn.elifesciences.org/articles/77742/elife-77742-fig6-data1-v2.zip
Figure 7
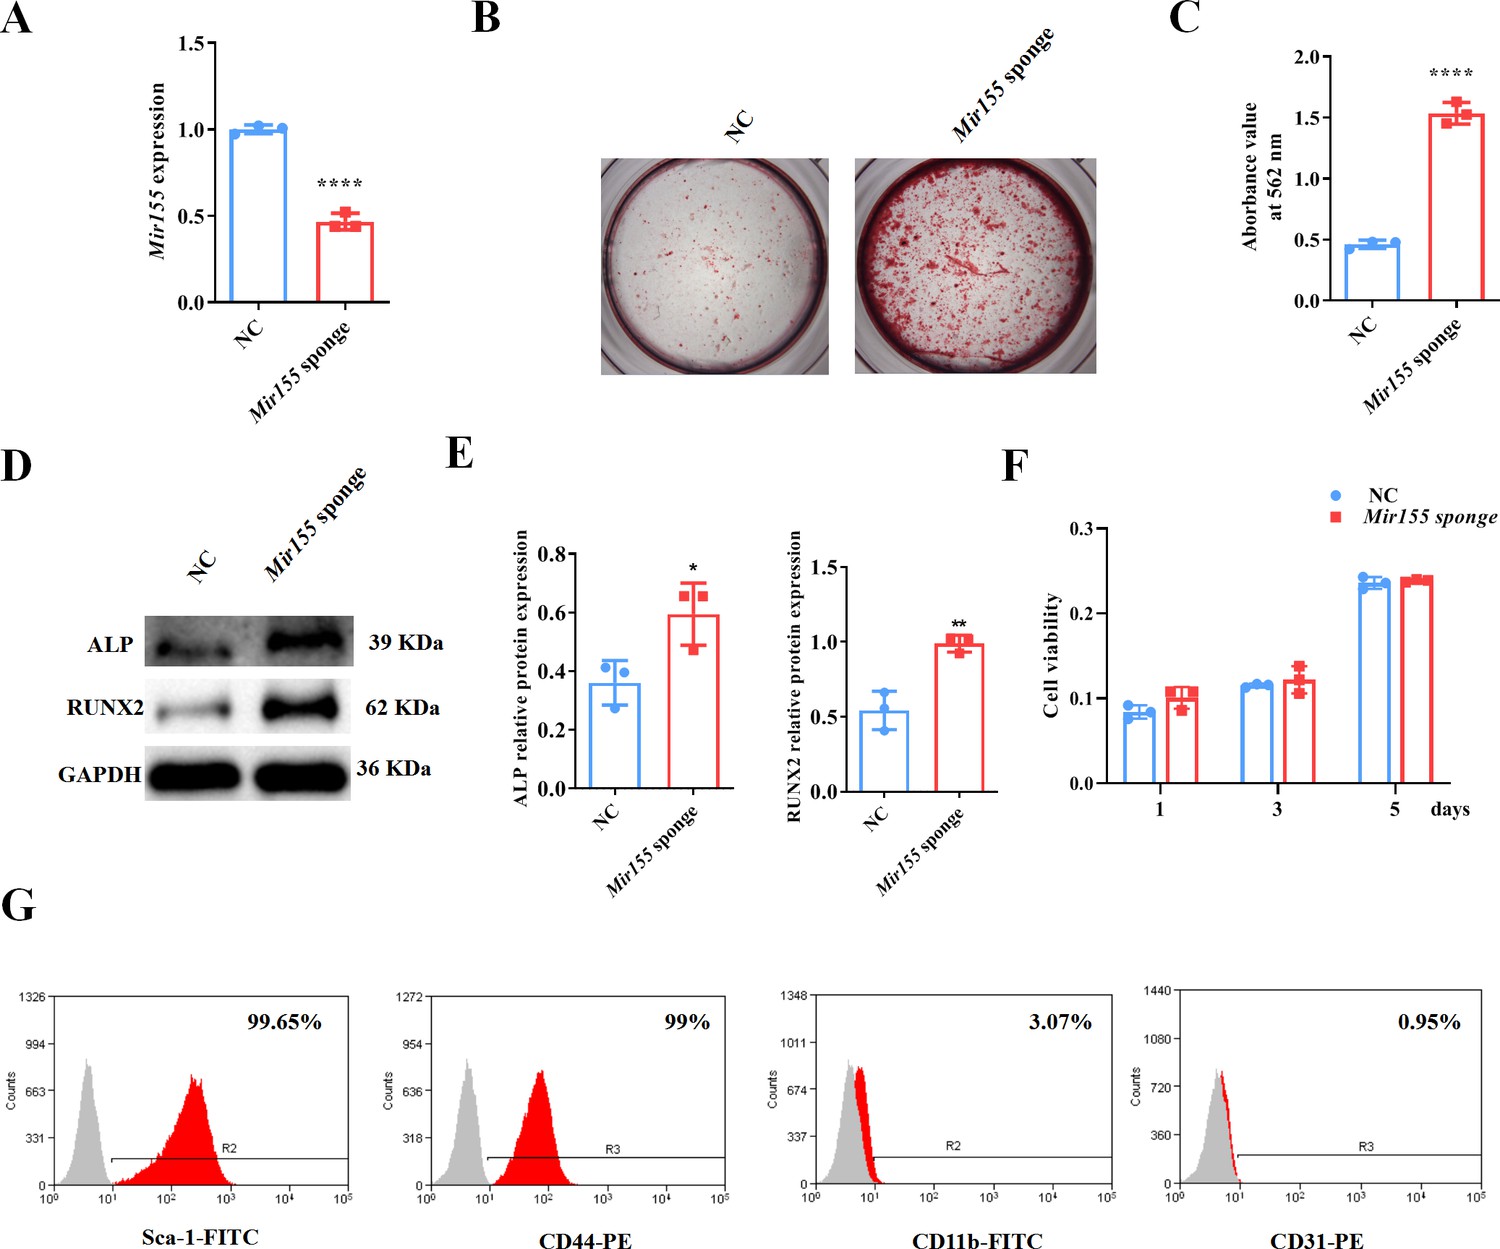
Mir155 knockdown bone marrow stromal stem cells (BMSCs) showed higher osteogenic differentiation potential.
(A) Mir155 expression level, n=3, (B) Alizarin red staining (ARS) images stained at 21 days of culture, (C) ARS quantification, n=3, (D) Western blot analysis, (E) densitometry quantification of protein bands, n=3, (F) cell viability, n=3, and (G) Fluorescence activated cell sorting (FACS) analysis. Data are presented as mean ± SD. Significant difference compared to the negative control, *p<0.05, **p<0.01, and ****p<0.0001. NC: negative control.
-
Figure 7—source data 1
Raw data for Figure 7A, C, E (ALP and RUNX2), and Figure 7F; original blots for Figure 7D.
- https://cdn.elifesciences.org/articles/77742/elife-77742-fig7-data1-v2.zip
Figure 8
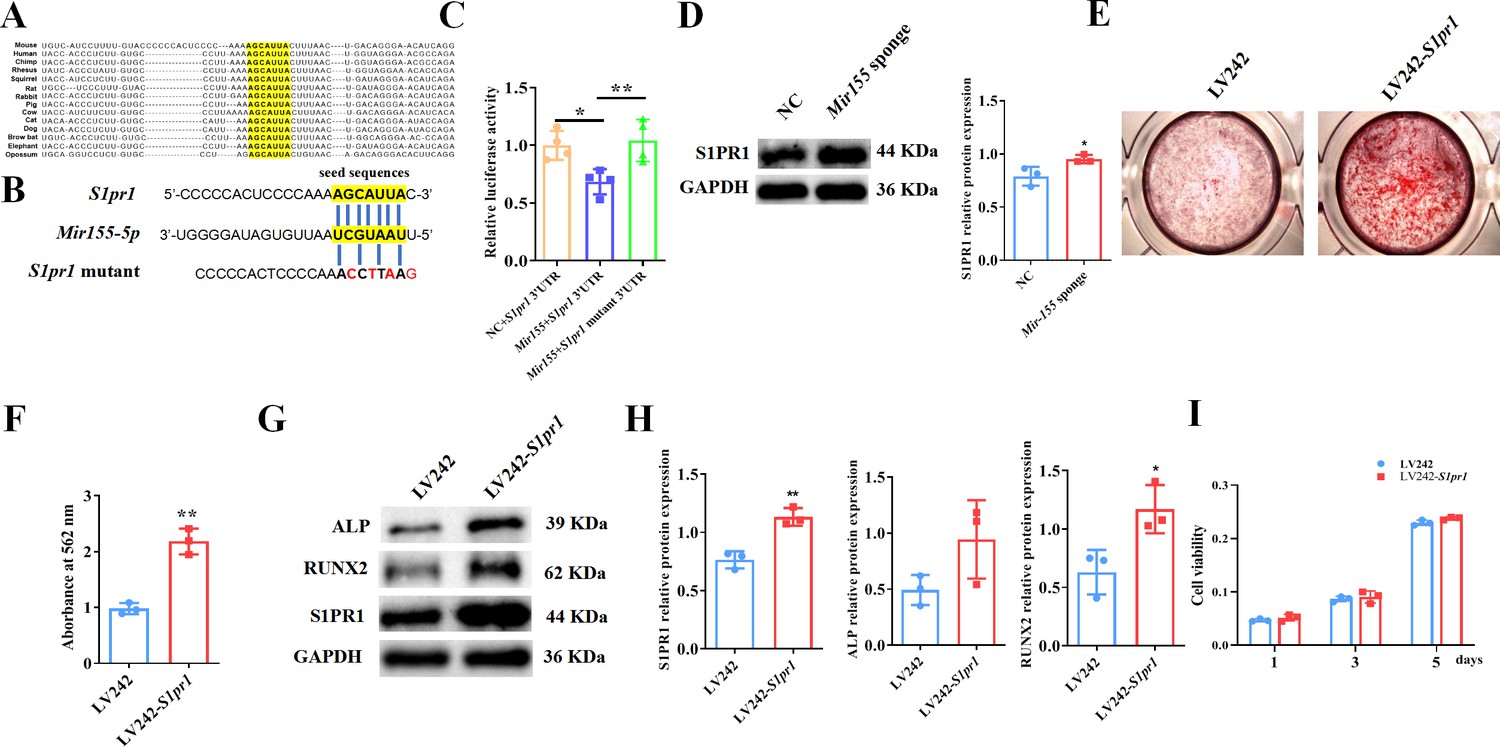
Mir155 targets sphingosine 1-phosphate receptor-1 (S1PR1) to regulate the osteogenic differentiation of bone marrow stromal stem cells (BMSCs).
(A) The Mir155 binding site of S1pr1 in different species, (B) the wild and mutant binding site of S1pr1 in mice. (C) Luciferase assay, n=4, (D) S1PR1 protein expression and densitometry quantification of protein bands, n=3, (E) Alizarin red staining (ARS) images stained at 21 days of culture, (F) ARS quantification, n=3, (G) Western blot analysis of osteogenic markers, (H) densitometry quantification of protein bands, n=3, and (I) cell viability analysis, n=4. Data are presented as mean ± SD. Significant difference compared to negative control, *p<0.05 and **p<0.01.
-
Figure 8—source data 1
Raw data for Figure 8C, D, F, H and I; original blots for Figure 8D, G.
- https://cdn.elifesciences.org/articles/77742/elife-77742-fig8-data1-v2.zip
Figure 9
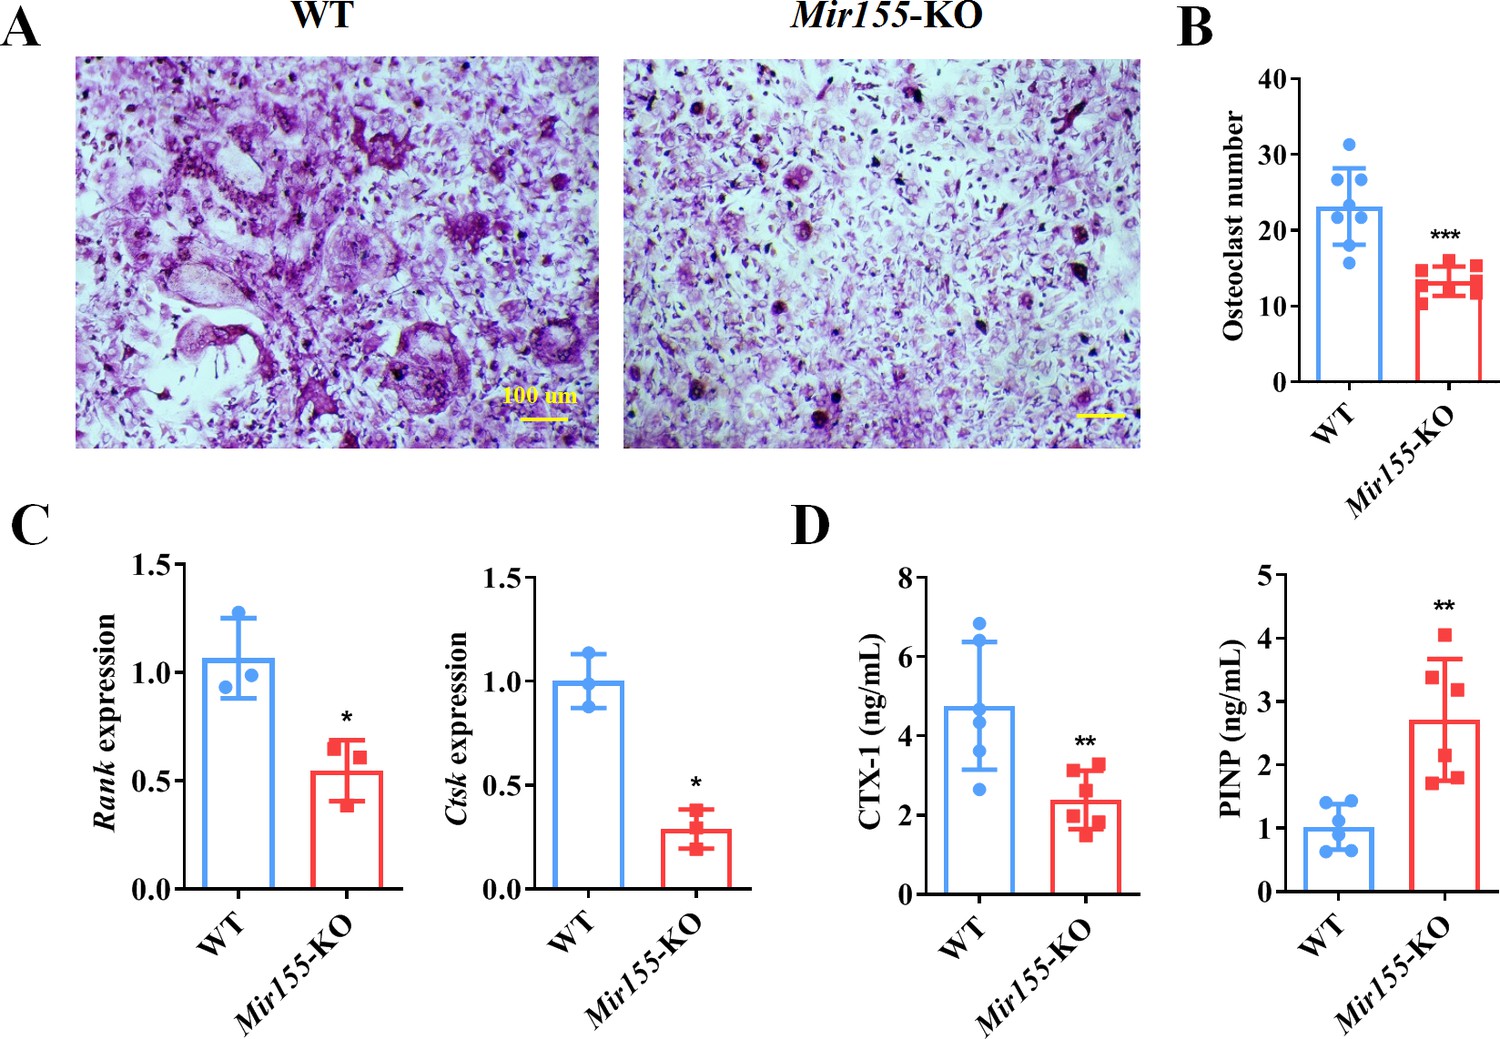
Bone marrow-derived macrophages (BMMs) from Mir155 knockout (Mir155-KO) mice exhibited compromised osteoclastogenic differentiation.
(A) Tartrate-resistant acid phosphatase (TRAP) staining, (B) osteoclast number quantification, n=8, (C) osteoclastogenic markers expression, n=3, (D) C-terminal telopeptides of type I collagen (CTX-1), and procollagen type I N-terminal pro-peptide (PINP) serum level, n=6. Data are presented as mean ± SD. Significant difference compared to the negative control, *p<0.05, **p<0.01, and ***p<0.001.
-
Figure 9—source data 1
Raw data for Figure 9B, C and D.
- https://cdn.elifesciences.org/articles/77742/elife-77742-fig9-data1-v2.xlsx
Figure 10
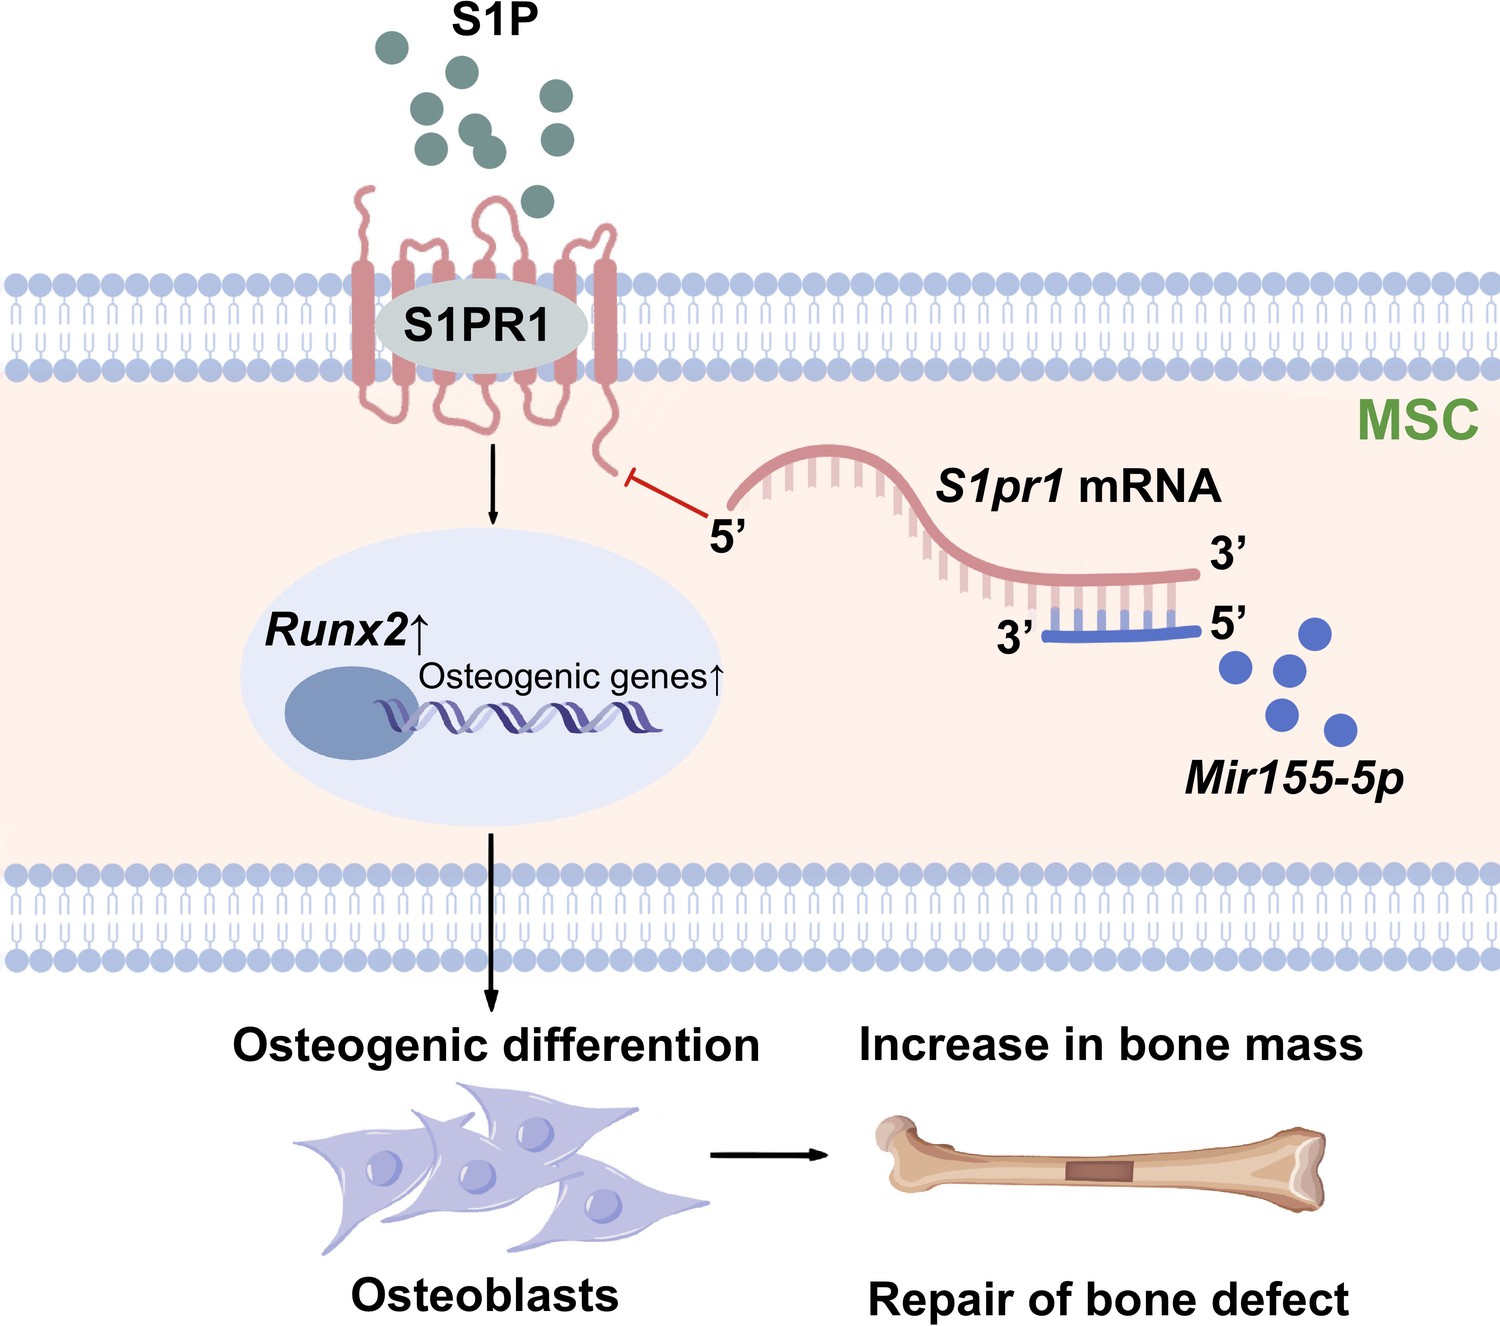
Scheme of Mir155-mediated regulation of osteogenesis.
S1P activates the sphingosine 1-phosphate receptor-1 (S1PR1), further increasing RUNX2 expression to regulate the osteogenic differentiation of MSCs into osteoblasts. Mir155 inhibits this process by direct binding with 3’UTR S1pr1 mRNAs. MSCs: mesenchymal stromal cells.
Tables
Table 1
Primers used for RT-qPCR.
| Gene name | Forward sequence (5’->3’) | Reversed sequence (5’->3’) |
|---|---|---|
| Gapdh | TGTGTCCGTCGTGGATCTG | TTGCTGTTGAAGTCGCAGGA |
| Rank | CCAGGAGAGGCATTATGAGCA | ACTGTCGGAGGTAGGAGTGC |
| Ctsk | FCTCGGCGTTTAATTTGGGAGA | TCGAGAGGGAGGTATTCTGAGT |
| Mir155 | 5’-TAATGCTAATTGTGATAGGGGT-3’ | |
Additional files
Download links
A two-part list of links to download the article, or parts of the article, in various formats.
Downloads (link to download the article as PDF)
Open citations (links to open the citations from this article in various online reference manager services)
Cite this article (links to download the citations from this article in formats compatible with various reference manager tools)
Mir155 regulates osteogenesis and bone mass phenotype via targeting S1pr1 gene
eLife 12:e77742.
https://doi.org/10.7554/eLife.77742


