Stage-dependent differential influence of metabolic and structural networks on memory across Alzheimer’s disease continuum
- Department of Neurology, National Neuroscience Institute, Singapore
- Duke-NUS Medical School, Singapore
- Lee Kong Chian School of Medicine, Nanyang Technological University Singapore, Singapore
- Centre for Sleep and Cognition and Centre for Translational MR Research,Yong Loo Lin School of Medicine, National University of Singapore, Singapore
- Translational Neuroimaging Laboratory, McGill University Research Centre for Studies in Aging, Alzheimer’s Disease Research Unit, Douglas Research Institute, Le Centre intégré universitaire de santé et de services sociaux (CIUSSS) de l’Ouest-de-l’Île-de-Montréal, and Departments of Neurology, Neurosurgery, Psychiatry, Pharmacology and Therapeutics, McGill University, Canada
- Montreal Neurological Institute, McGill University, Canada
- Department of Neurology & Neurosurgery, McGill University, Canada
- Department of Electrical and Computer Engineering, National University of Singapore, Singapore
- Integrative Sciences and Engineering Programme (ISEP), National University of Singapore, Singapore
Figures
Figure 1 with 2 supplements
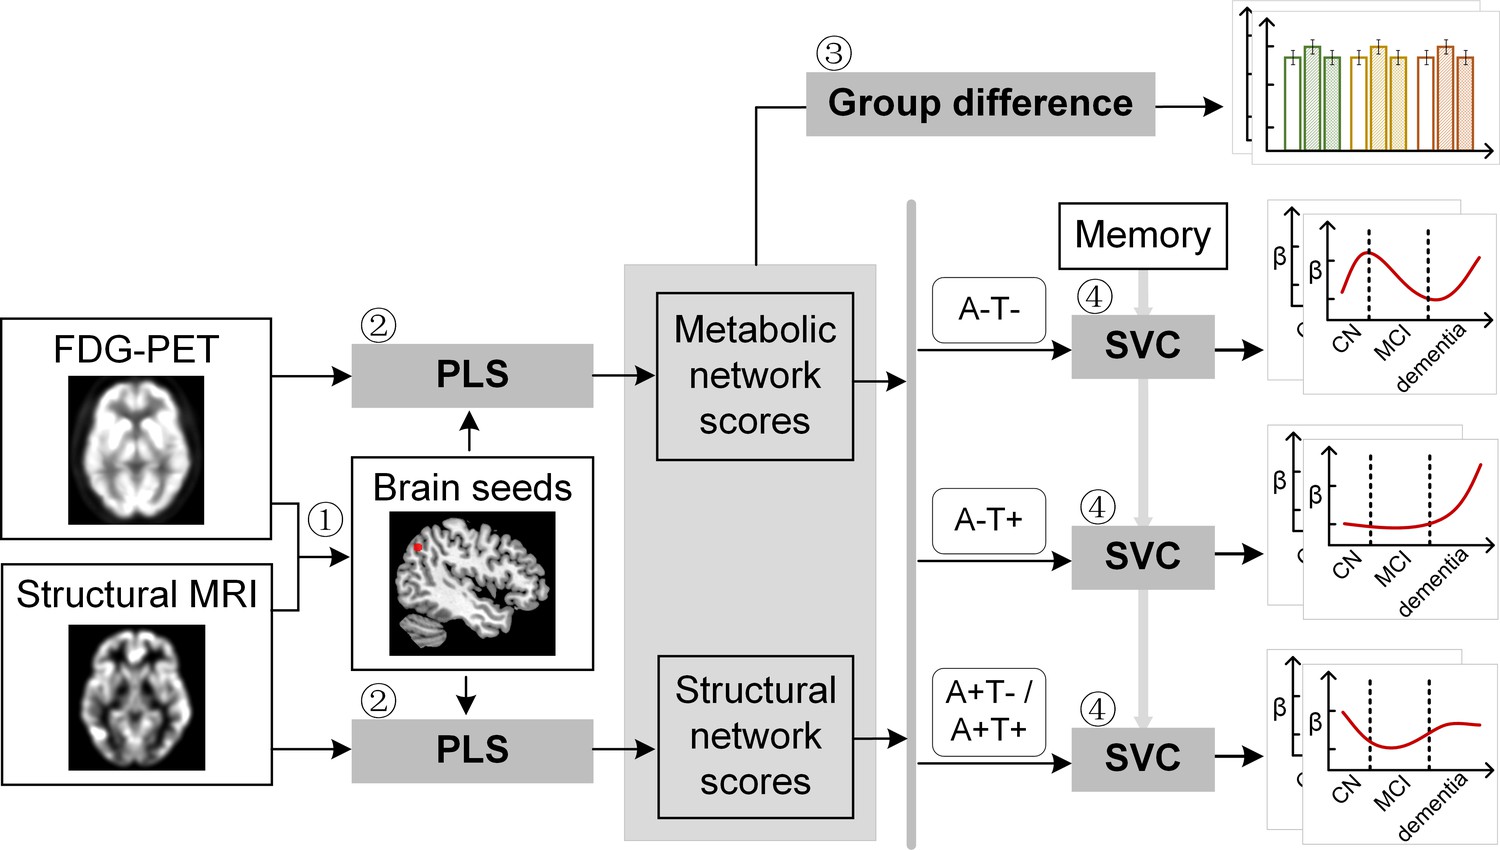
Study design schematic.
Seven hundred and eight participants with either healthy cognition (CN), mild cognitive impairment (MCI) or dementia were studied. Twelve brain seeds covering the key regions of hippocampus, the default mode network, the executive control network, and salience network were defined based on hypometabolism (via FDG) and grey matter atrophy (via MRI) patterns in all patients with probable AD compared to CN (step 1). Using seed-based partial least square (PLS) analysis (step 2), the covariance patterns in metabolism and grey matter volume maps were identified and used to derive the individual-level brain metabolic network scores and structural network scores for each seed. The group difference was evaluated between different cognitive stages and pathology groups (step 3). We then investigated the differential stage-dependent associations between these key brain network scores with memory performance in each of the three pathology groups (A-T-, A-T+, and A+T-/A+T + ) separately using sparse varying coefficient (SVC) modelling (step 4). Abbreviations: A=Aβ; T=tau; ‘-’ = negative; ‘+’ = positive.
Figure 1—figure supplement 1
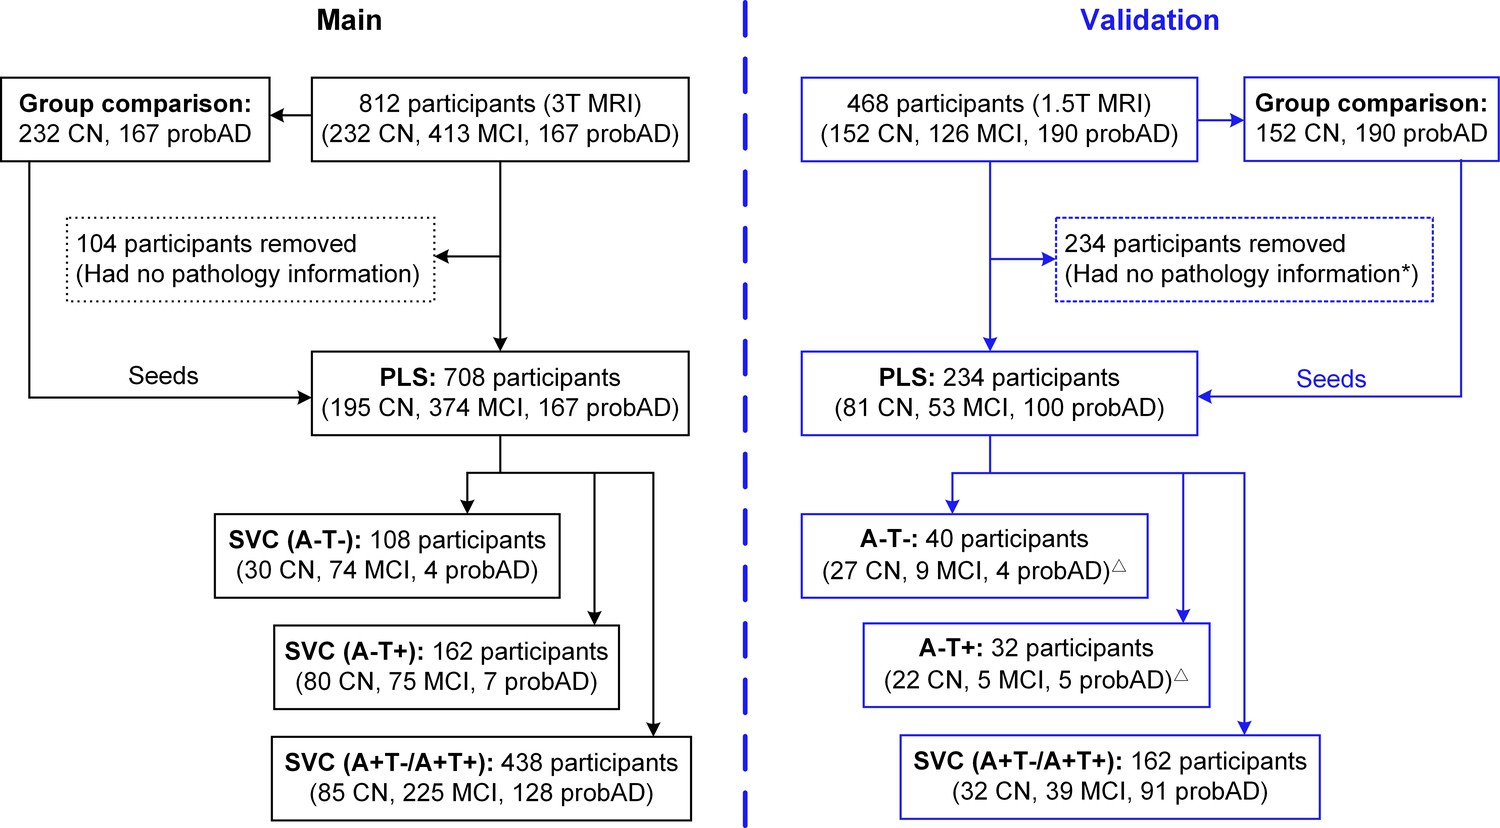
Flowchart of participant pool selection.
For the main analysis, in total 812 participants who underwent 3T MRI scan were selected. Of these participants, group comparisons of the grey matter volume and brain metabolism were performed between the 232 CN participants and 167 probable AD participants to define the brain seeds. We removed 104 participants who had no pathology information; therefore 708 participants were projected into the PLS analysis to generate the individual brain network scores. We stratified the 708 participants into three pathology groups and performed SVC modelling on each of the groups to examine the cognitive stage dependent associations between the brain network scores and the memory. To form a larger validation dataset (here after refer as validation dataset 1), we added an additional 468 individuals who underwent 1.5T MRI scan. With the original main dataset of 812 participants, we had 1280 participants (383 CN, 537 MCI, and 360 probAD) in total for brain seed definition. Out of 1280 participants 859 participants who had pathology information were projected into the PLS analysis and then stratified into three pathology groups for SVC modelling (groups sizes were described in Supplementary file 2). We also performed an additional validation analysis on the fully independent 468 participants (see the flowchart at right; here after refered as validation dataset 2). We defined the seeds based on the group comparisons between the 152 CN and 190 probable AD individuals from the 468 subjects. *To increase the sample size for the PLS-SVC model, we selected 234 subjects who have the tau information within 1 year from the scan time and amyloid-beta information within 3 years from the scan time.△We performed SVC modelling on the A+T-/A+T + group (162 participants); however we were unable to perform SVC modelling on the A-T- and A-T +groups due to their relatively small sample size. Abbreviations: CN = cognitively normal; MCI = mild cognitive impairment; probAD = probable AD; A = β-amyloid; T=tau; ‘+’ = positive; ‘-’ = negative; PLS = partial least square analysis; SVC = sparse varying coefficient modelling.
Figure 1—figure supplement 2
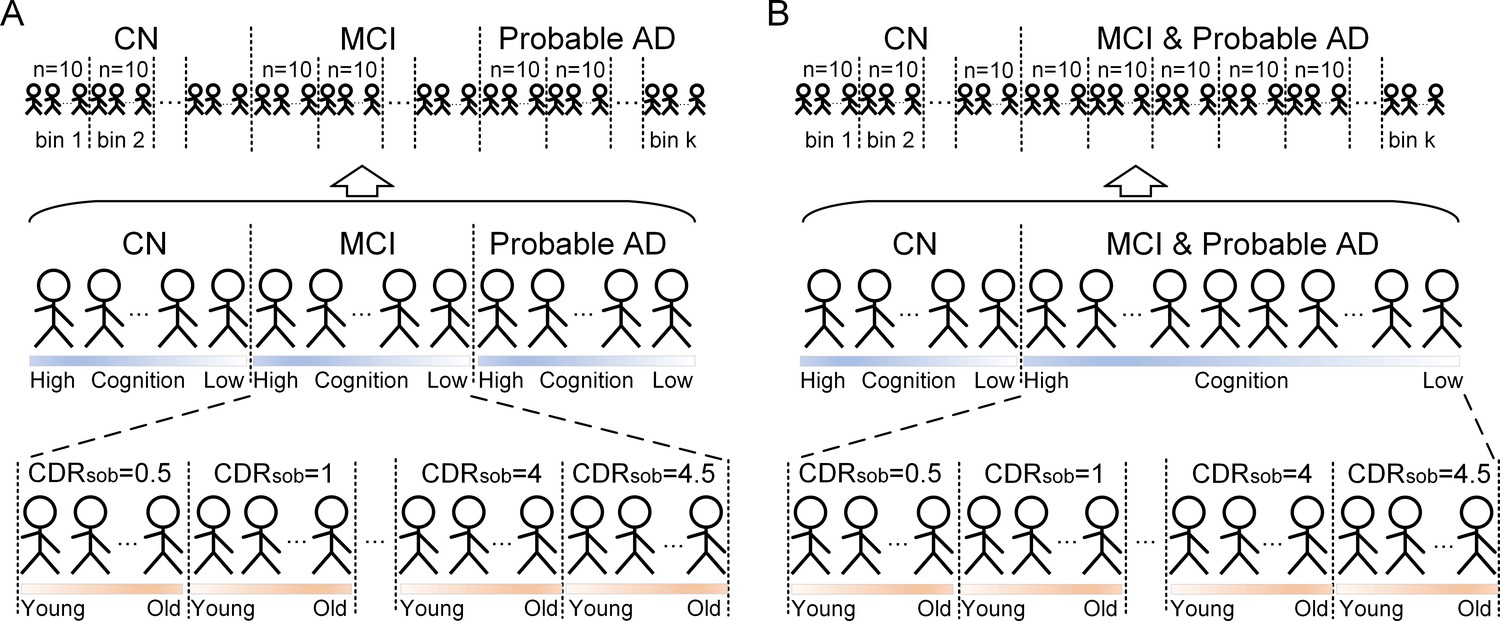
Subject ordering for SVC modelling within each pathology group.
The participants were ordered by their diagnosis. In the main ordering method (panel A), CN was followed by MCI, and MCI was followed by probable AD. The validation ordering method (panel B) did not differentiate MCI and probable, where CN subjects was followed by subjects with MCI or probable AD. Within each diagnosis, the participants were ordered by the severity of cognitive impairment (i.e. no impairment → severe impairment). Specifically, the participants within CN diagnosis were ordered by decreasing MMSE scores, and the participants within MCI or dementia diagnosis were ordered by increasing CDR-sum of boxes (SOB) scores. If the participants had the same MMSE or CDR-SOB scores in the earlier ordering step, they will then be further ordered by increasing age (i.e. young → old). After ordering the participants, we distributed the participants evenly into bins (i.e. 10 subjects/bin).
Figure 2 with 1 supplement
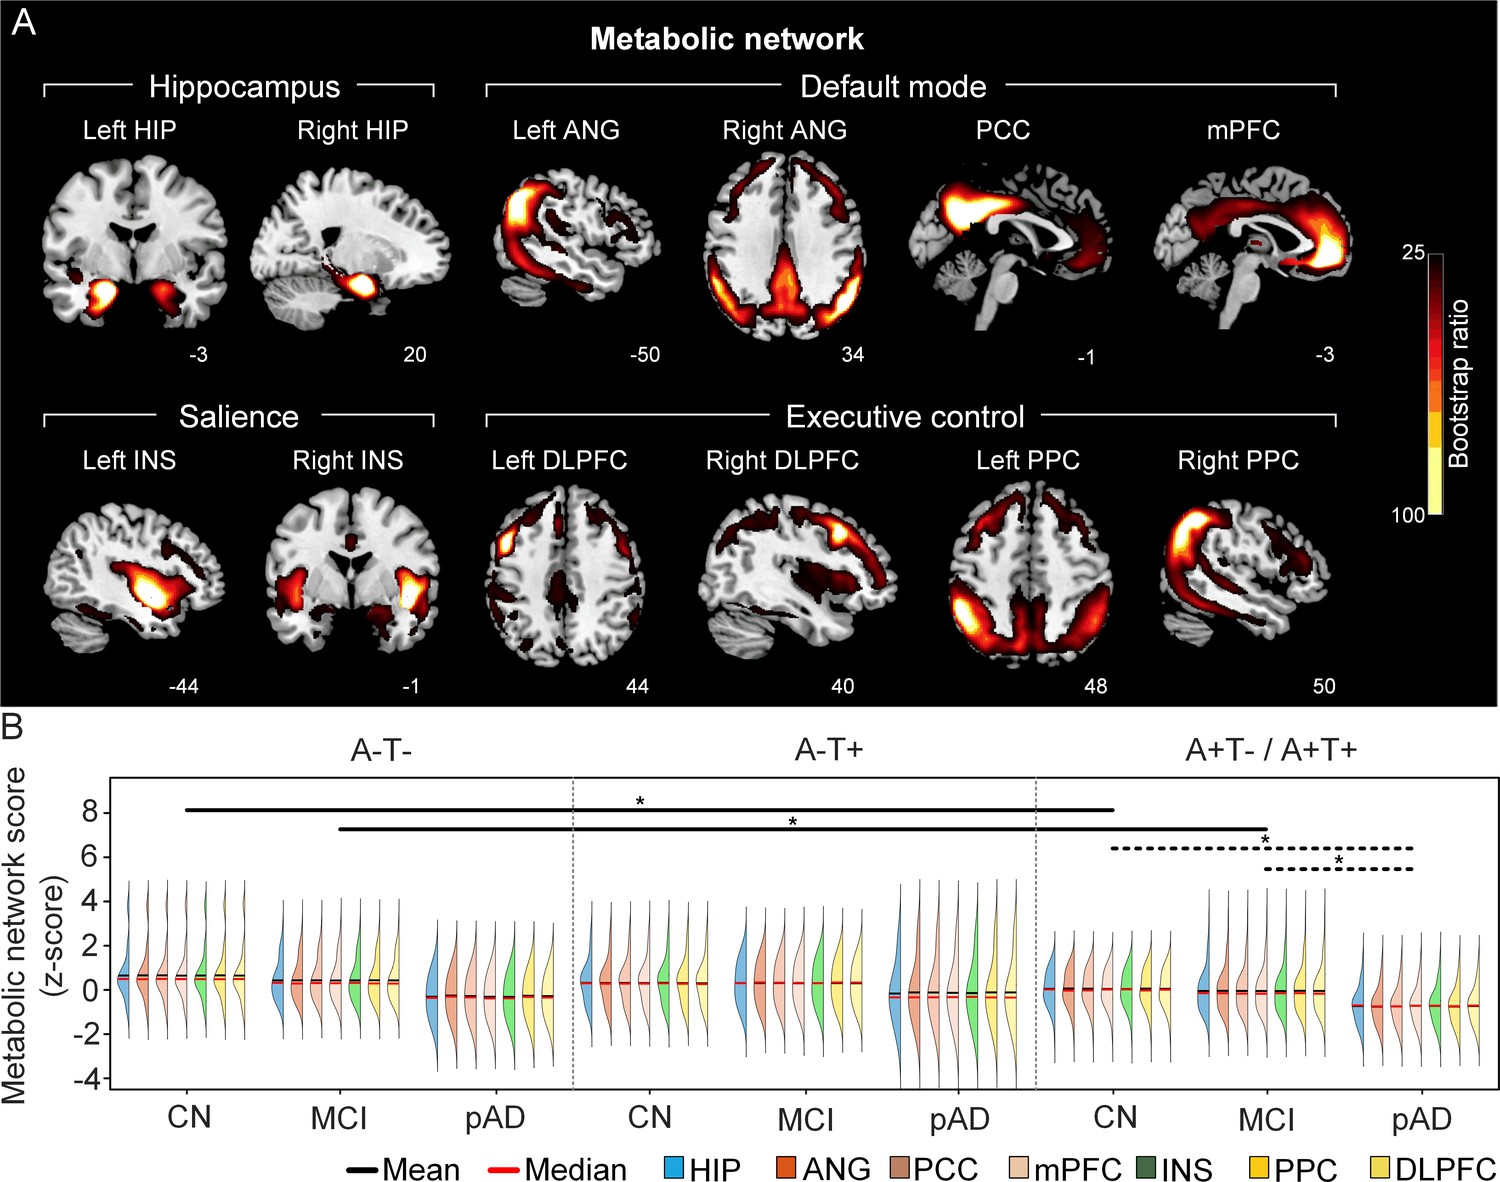
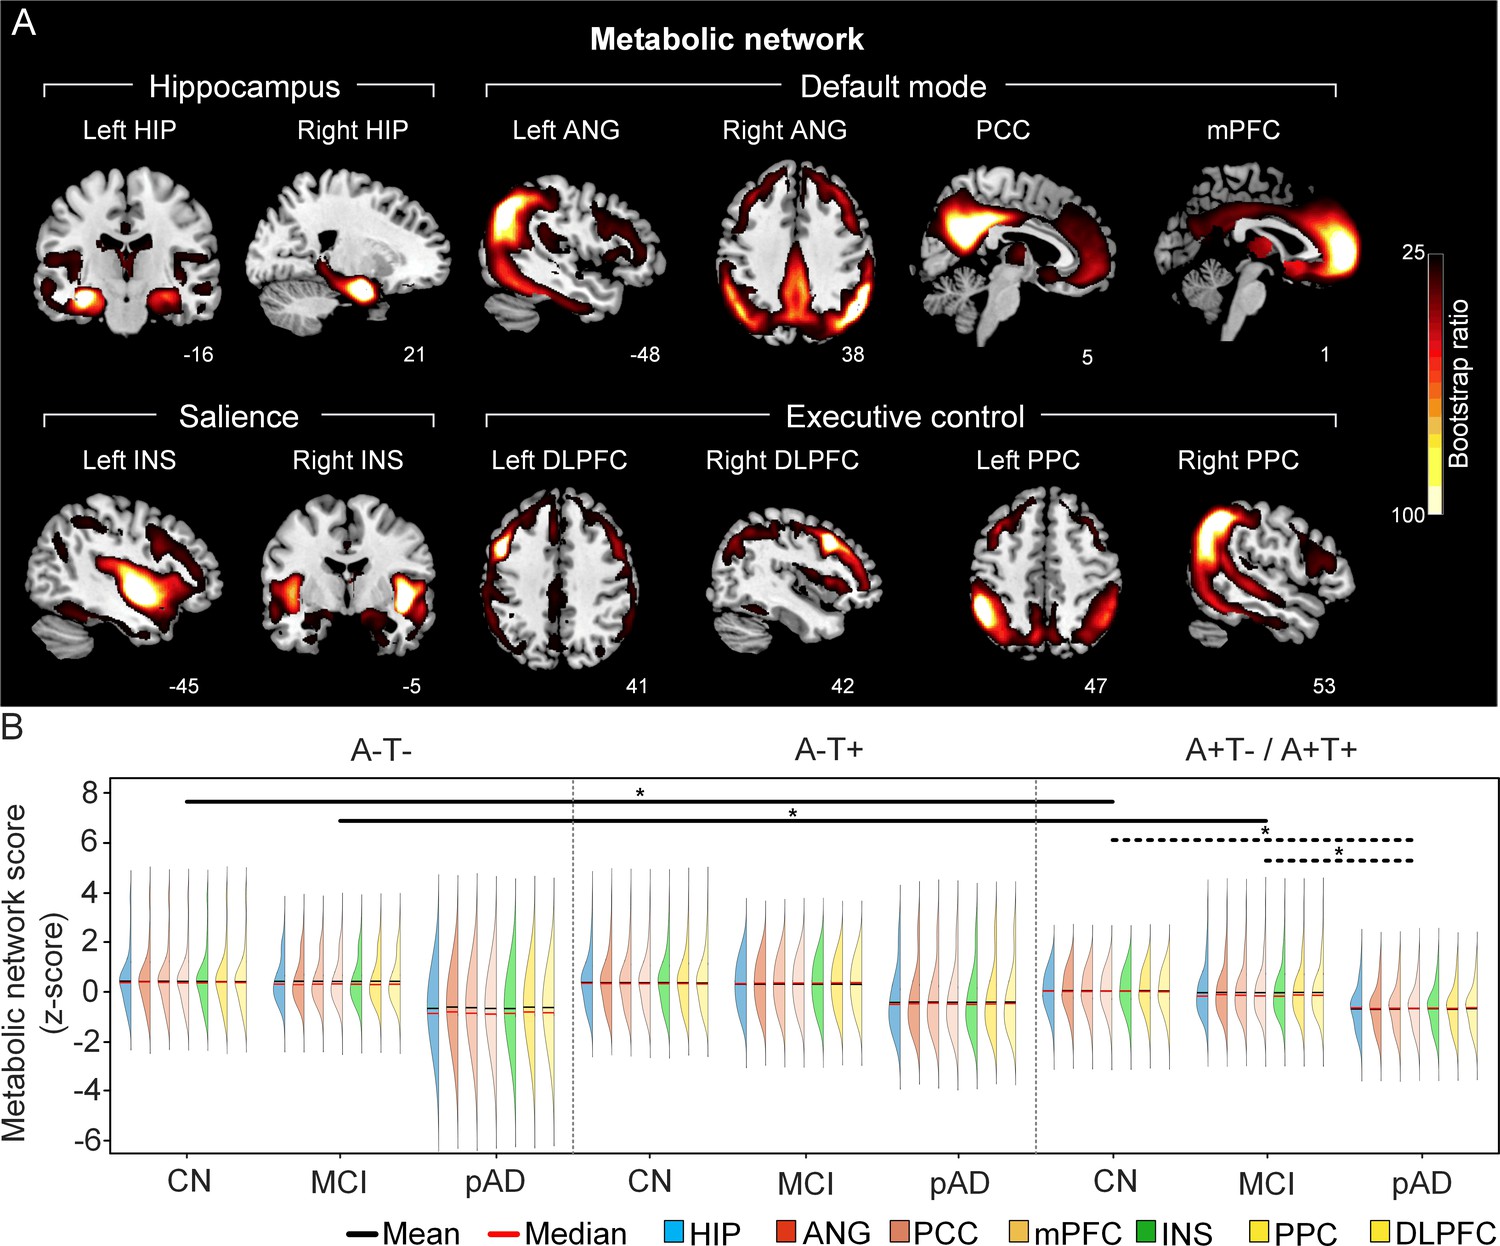
The integrity of brain metabolic networks in participants with and without amyloid pathology across cognitive stages.
(A) Brain slices of metabolic covariance networks associated with each brain seed. Brain metabolic network resemabled canonical brain networks. The intensity of colorbar represents bootstrap ratios, derived from dividing the weight of the singular-vector by the bootstrapped standard error. (B) Individual-level brain metabolic network scores (z-score) were lower in individuals with worse cognition and amyloid pathology. Z-scores were calculated within all the subjects. Summary of individual-level metabolic network scores (mean and median) were presented in half-violin plots. ‘*’ indicates significant group difference (p<0.05). Thick lines indicate group differences in brain scores of all the seven networks between different cognitive stages (grey dashed lines) or pathology groups (dark lines). Abbreviations: HIP = hippocampus; ANG = angular gyrus; PCC = posterior cingulate cortex; mPFC = media prefrontal cortex; INS = insular; DLPFC = dorsolateral prefrontal cortex; PPC = posterior parietal cortex; CN = cognitively normal; MCI = mild cognitive impairment; pAD = probable AD; A = β-amyloid; T=tau; ‘+’=positive; ‘-’=negative.
Figure 2—figure supplement 1
The integrity of brain metabolic networks in participants with and without amyloid pathology across cognitive stages (validation dataset 1).
(A) Brain slices of metabolic covariance networks associated with each brain seed defined from FDG-PET data highlighted in blue circles. Brain metabolic network resemabled canonical brain networks. The intensity of colorbar represents bootstrap ratios, derived from dividing the weight of the singular-vector by the bootstrapped standard error. (B) Individual-level brain metabolic network scores (z-score) were lower in individuals with worse cognition and amyloid pathology. Z-scores were calculated within all the subjects. Summary of individual-level metabolic network scores (mean and median) were presented in half-violin plots. ‘*’ indicates significant group difference (p<0.05). Thick lines indicate group differences in brain network scores between different cognitive stages (grey dashed) or pathology groups (dark). Abbreviations: HIP = hippocampus; ANG = angular gyrus; PCC = posterior cingulate cortex; mPFC = media prefrontal cortex; INS = insular; DLPFC = dorsolateral prefrontal cortex; PPC = posterior parietal cortex; CN = cognitively normal; MCI = mild cognitive impairment; pAD = probable AD; A = β-amyloid; T=tau; ‘+’ = positive; ‘-’ = negative.
Figure 3 with 1 supplement
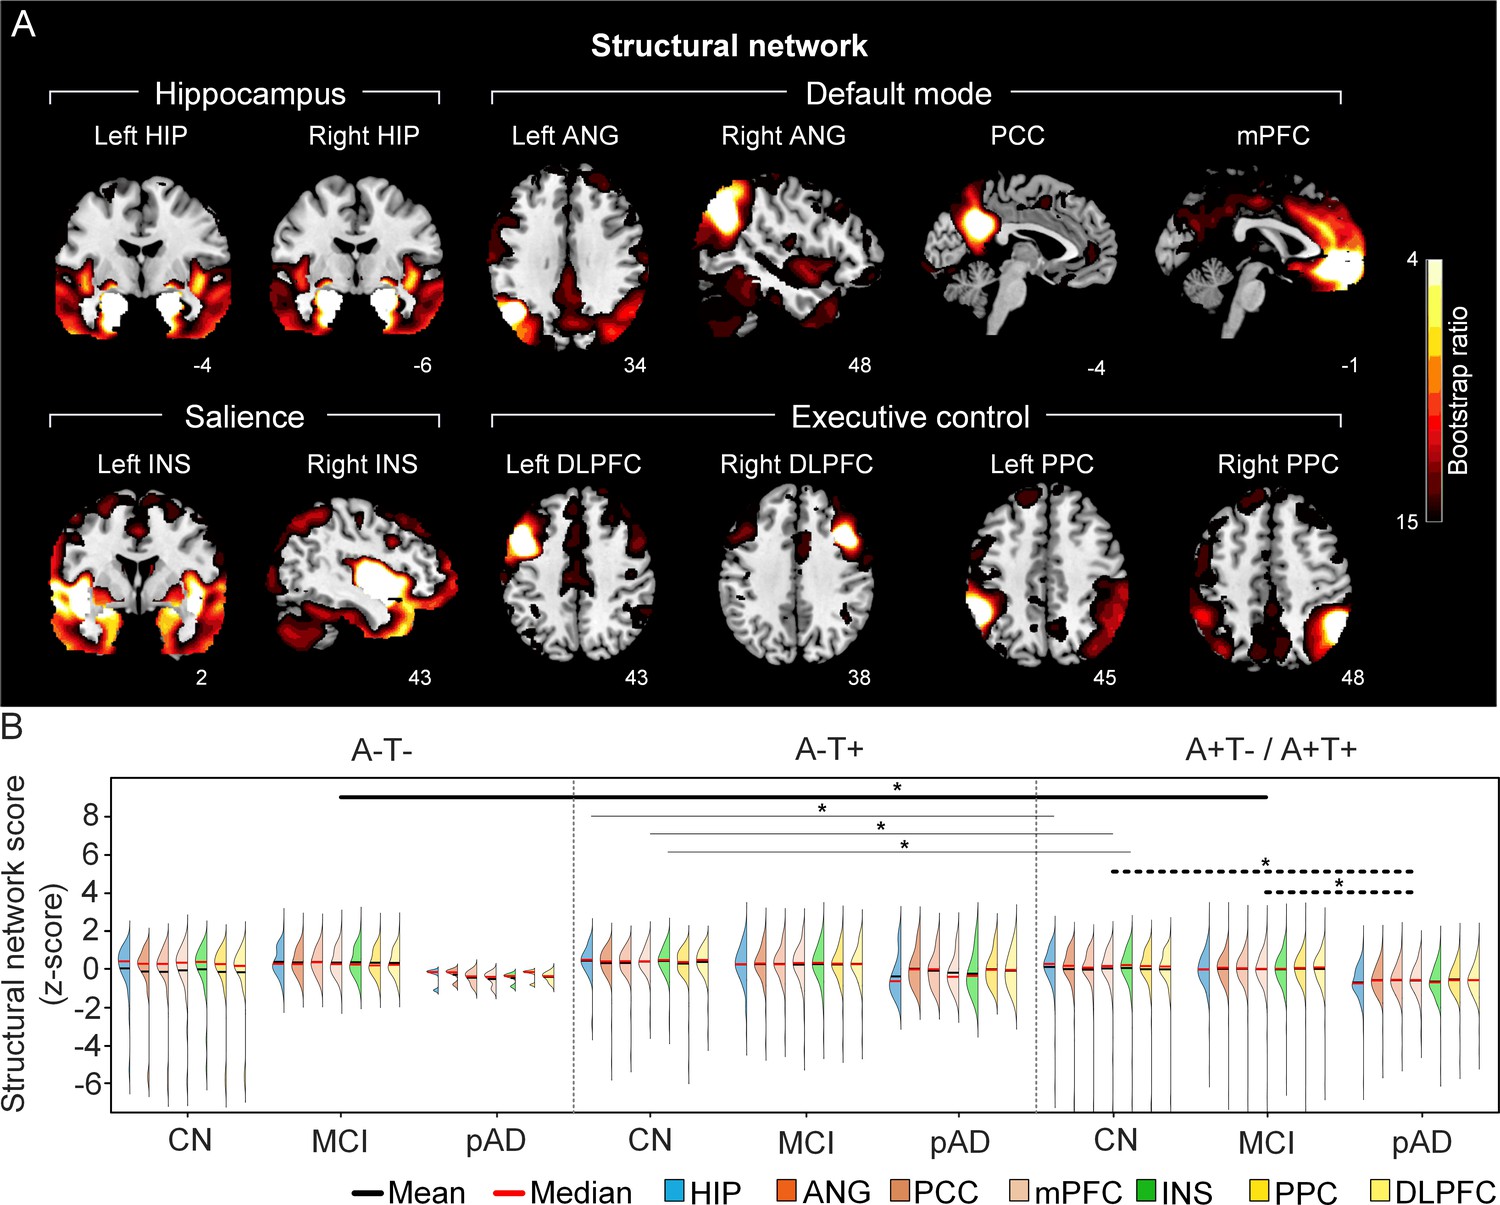
The integrity of brain structural networks in participants with and without amyloid pathology across cognitive stages.
(A) Brain slices of structural covariance networks associated with each brain seed. The intensity of colorbar represents bootstrap ratios, derived from dividing the weight of the singular-vector by the bootstrapped standard error. (B) Individual-level brain structural network scores (z-score) were lower in individuals with worse cognition and amyloid pathology. Z-scores were calculated within all the subjects. Summary of individual-level structural network scores (mean and median) were presented in half-violin plots. ‘*’ indicates significant group difference (p<0.05). Thick lines indicate group differences in brain scores of all the networks between different cognitive stages (grey dashed lines) or pathology groups (dark lines). Thin lines indicate group differences in brain scores of specific networks. Abbreviations: HIP = hippocampus; ANG = angular gyrus; PCC = posterior cingulate cortex; mPFC = media prefrontal cortex; INS = insular; DLPFC = dorsolateral prefrontal cortex; PPC = posterior parietal cortex; CN = cognitively normal; MCI = mild cognitive impairment; pAD = probable AD; A = β-amyloid; T=tau; ‘+’ = positive; ‘-’ = negative.
Figure 3—figure supplement 1
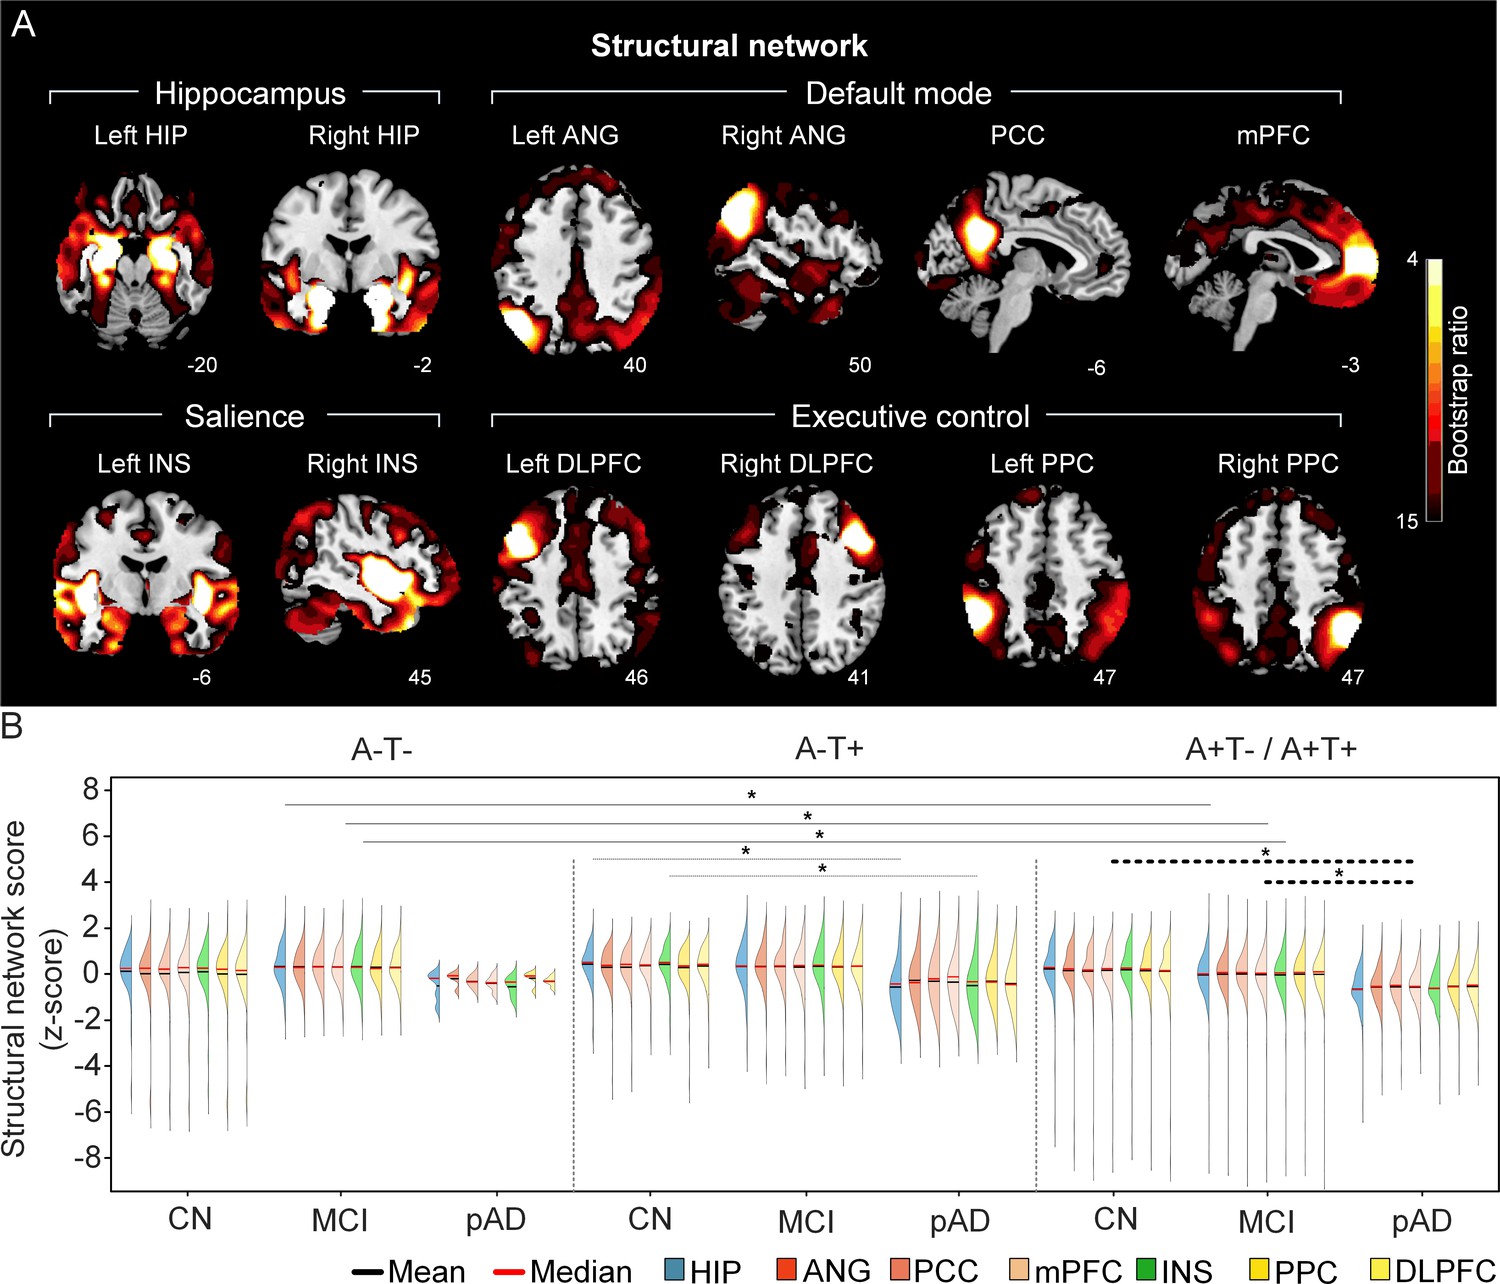
The integrity of brain structural networks in participants with and without amyloid pathology across cognitive stages (validation dataset 1).
(A) Brain slices of structural covariance networks associated with each brain seed defined from grey matter volume data highlighted in blue circles. The intensity of colorbar represents bootstrap ratios, derived from dividing the weight of the singular-vector by the bootstrapped standard error. (B) Individual-level brain structural network scores (z-score) were lower in individuals with worse cognition and amyloid pathology. z-scores were calculated within all the subjects. Summary of individual-level structural network scores (mean and median) were presented in half-violin plots. ‘*’ indicates significant group difference (p<0.05). Thick lines indicate group differences in all brain network scores between different cognitive stages (grey dashed) or pathology groups (dark). Thin lines indicate group differences in brain scores of specific networks. Abbreviations: HIP = hippocampus; ANG = angular gyrus; PCC = posterior cingulate cortex; mPFC = media prefrontal cortex; INS = insular; DLPFC = dorsolateral prefrontal cortex; PPC = posterior parietal cortex; CN = cognitively normal; MCI = mild cognitive impairment; pAD = probable AD; A = β-amyloid; T=tau; ‘+’ = positive; ‘-’ = negative.
Figure 4 with 1 supplement
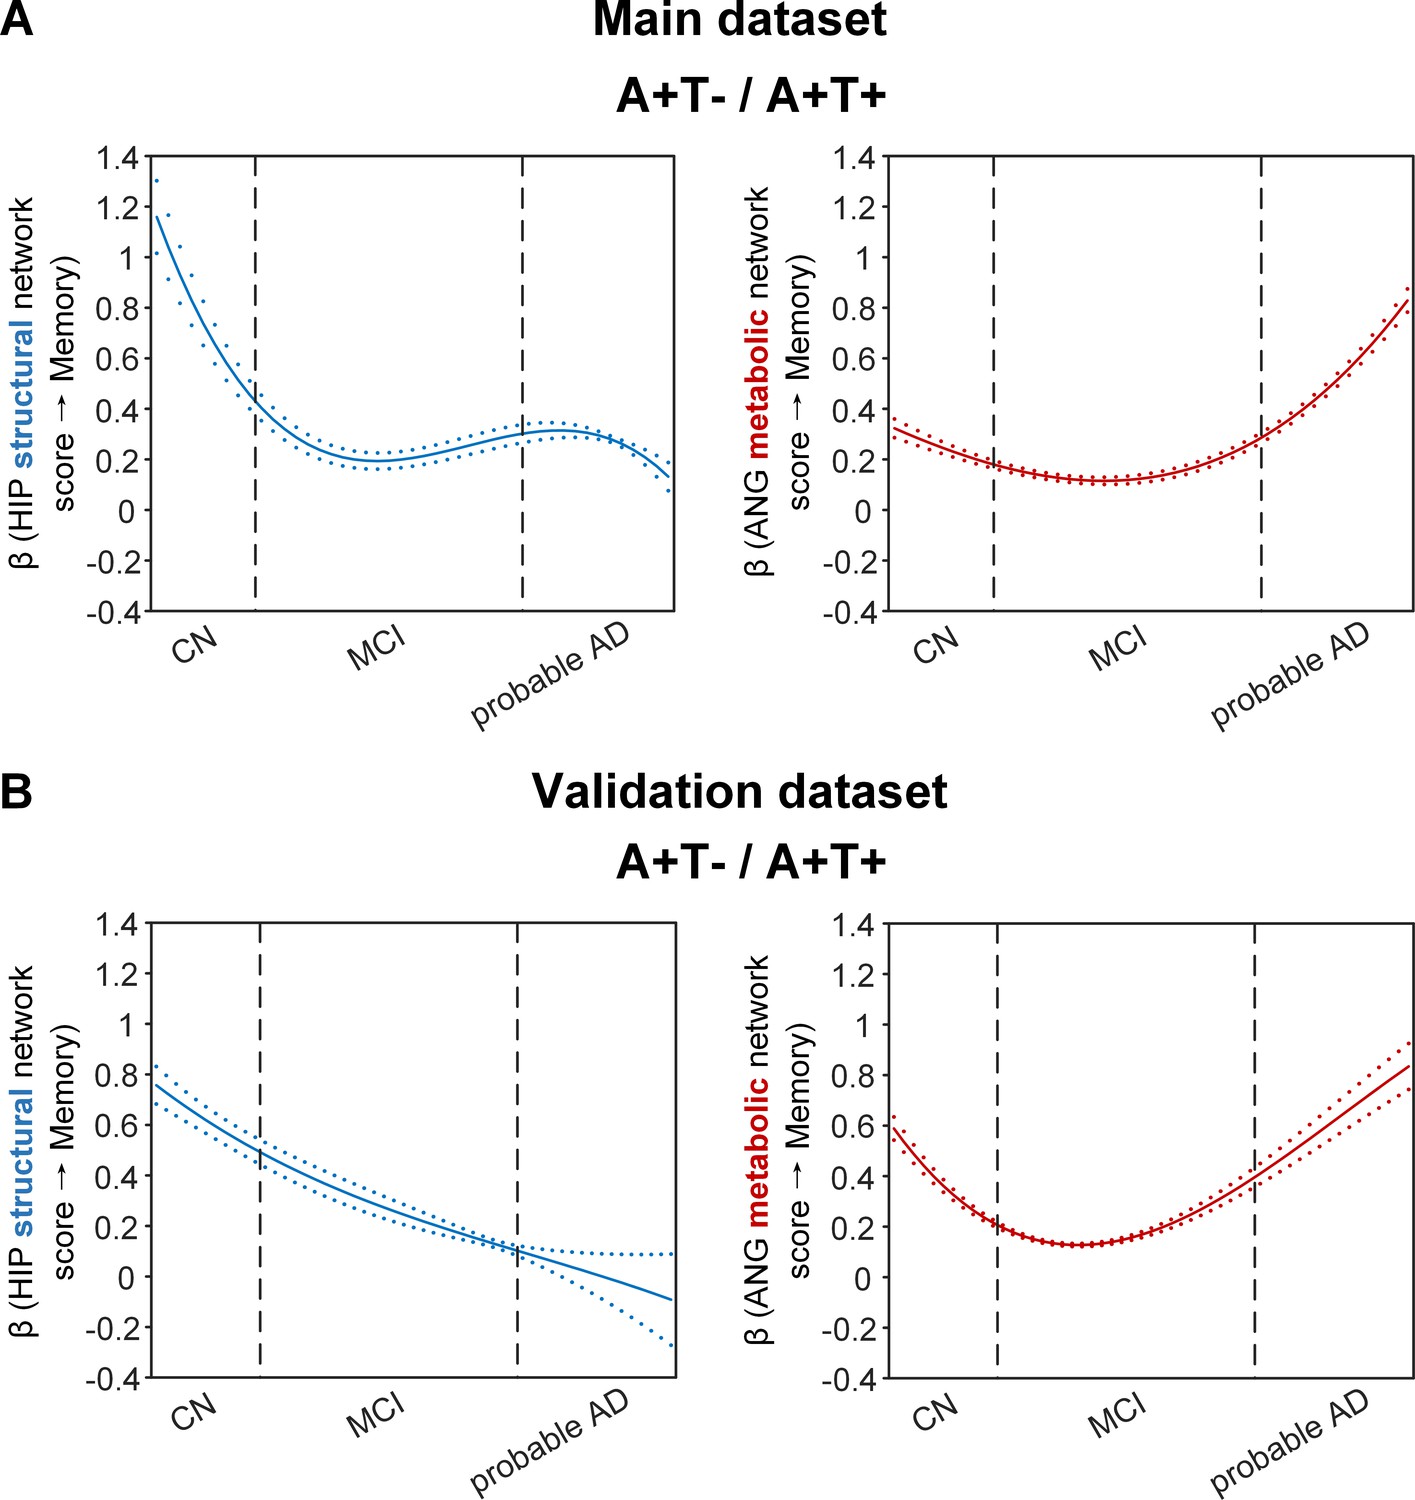
Brain metabolic and structural networks had differential stage-dependent associations with memory in amyloid positive individuals.
Data from the main dataset (panel A) and validation dataset 1 (panel B) exhibited consistent stage-dependent memory-network association trajectory from cognitively normal to dementia stage in participants with amyloid pathology (i.e. A+T-/A+T + group). Both hippocampal-seeded structural network (left, in blue) and angular gyrus-seeded default mode metabolic network (right, in red) integrity contributed significantly to memory performance in early cognitively normal stage. Such impact decreased in MCI stage for both metabolic and structural networks. In contrast, only the metabolic network had a major influence on memory in late dementia stage. Solid curves represent the mean associations (beta coefficients) of brain network scores with memory as a function of advancing AD continuum estimated from 100 replicates. The dashed curves represent the point-wise 2* standard errors of the solid curves estimated from 100 replicates. The participants were ordered by their cognitive stages (i.e. CN → MCI → probable AD). Within each cognitive stage, the participants were then ordered by general cognition (MMSE for CN) or dementia severity (CDR for MCI and dementia) (i.e. no impairment → severe impairment). Participants with the same level of impairment/severity were further ordered by increasing age (i.e. young → old). Ordered participants were distributed evenly into bins (i.e. 10 subjects/bin). Abbreviations: CN = cognitively normal; MCI = mild cognitive impairment; HIP = hippocampus; ANG = angular gyrus.
Figure 4—figure supplement 1
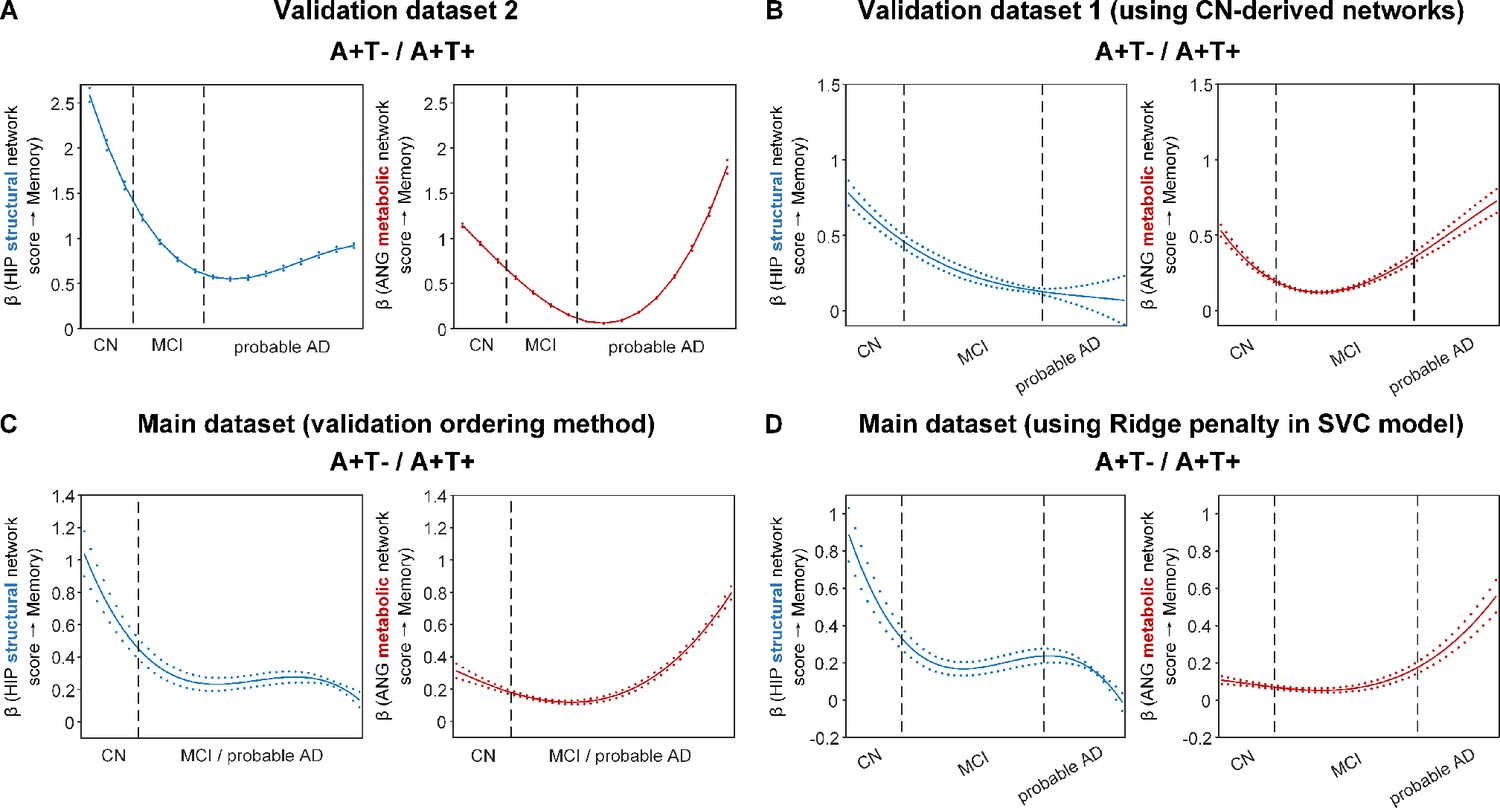
Differential stage-dependent associations of metabolic and structural network scores with memory impairment in amyloid positive individuals (validation analyses).
Solid curves represent the mean associations (beta coefficients) of brain network scores with memory as a function of advancing AD continuum estimated from 100 replicates (metabolic in red; structural in blue). The dashed curves represent the point-wise 2* standard errors of the solid curves estimated from 100 replicates. Main ordering method was used in panel A, B, and D where the participants were ordered by their cognitive stages (i.e. CN → MCI → probable AD). Validation ordering method was used in panel C which did not differentiate MCI and probable (i.e. CN → MCI/probable AD). Within each of the two stages, the participants were then ordered by general cognition or dementia severity (i.e. no impairment → severe impairment). Participants with the same cognitive impairment severity were further ordered by increasing age (i.e. young → old). Ordered participants were distributed evenly into bins (i.e. 10 subjects/bin). Abbreviations: CN = cognitively normal; MCI = mild cognitive impairment.
Figure 5 with 4 supplements
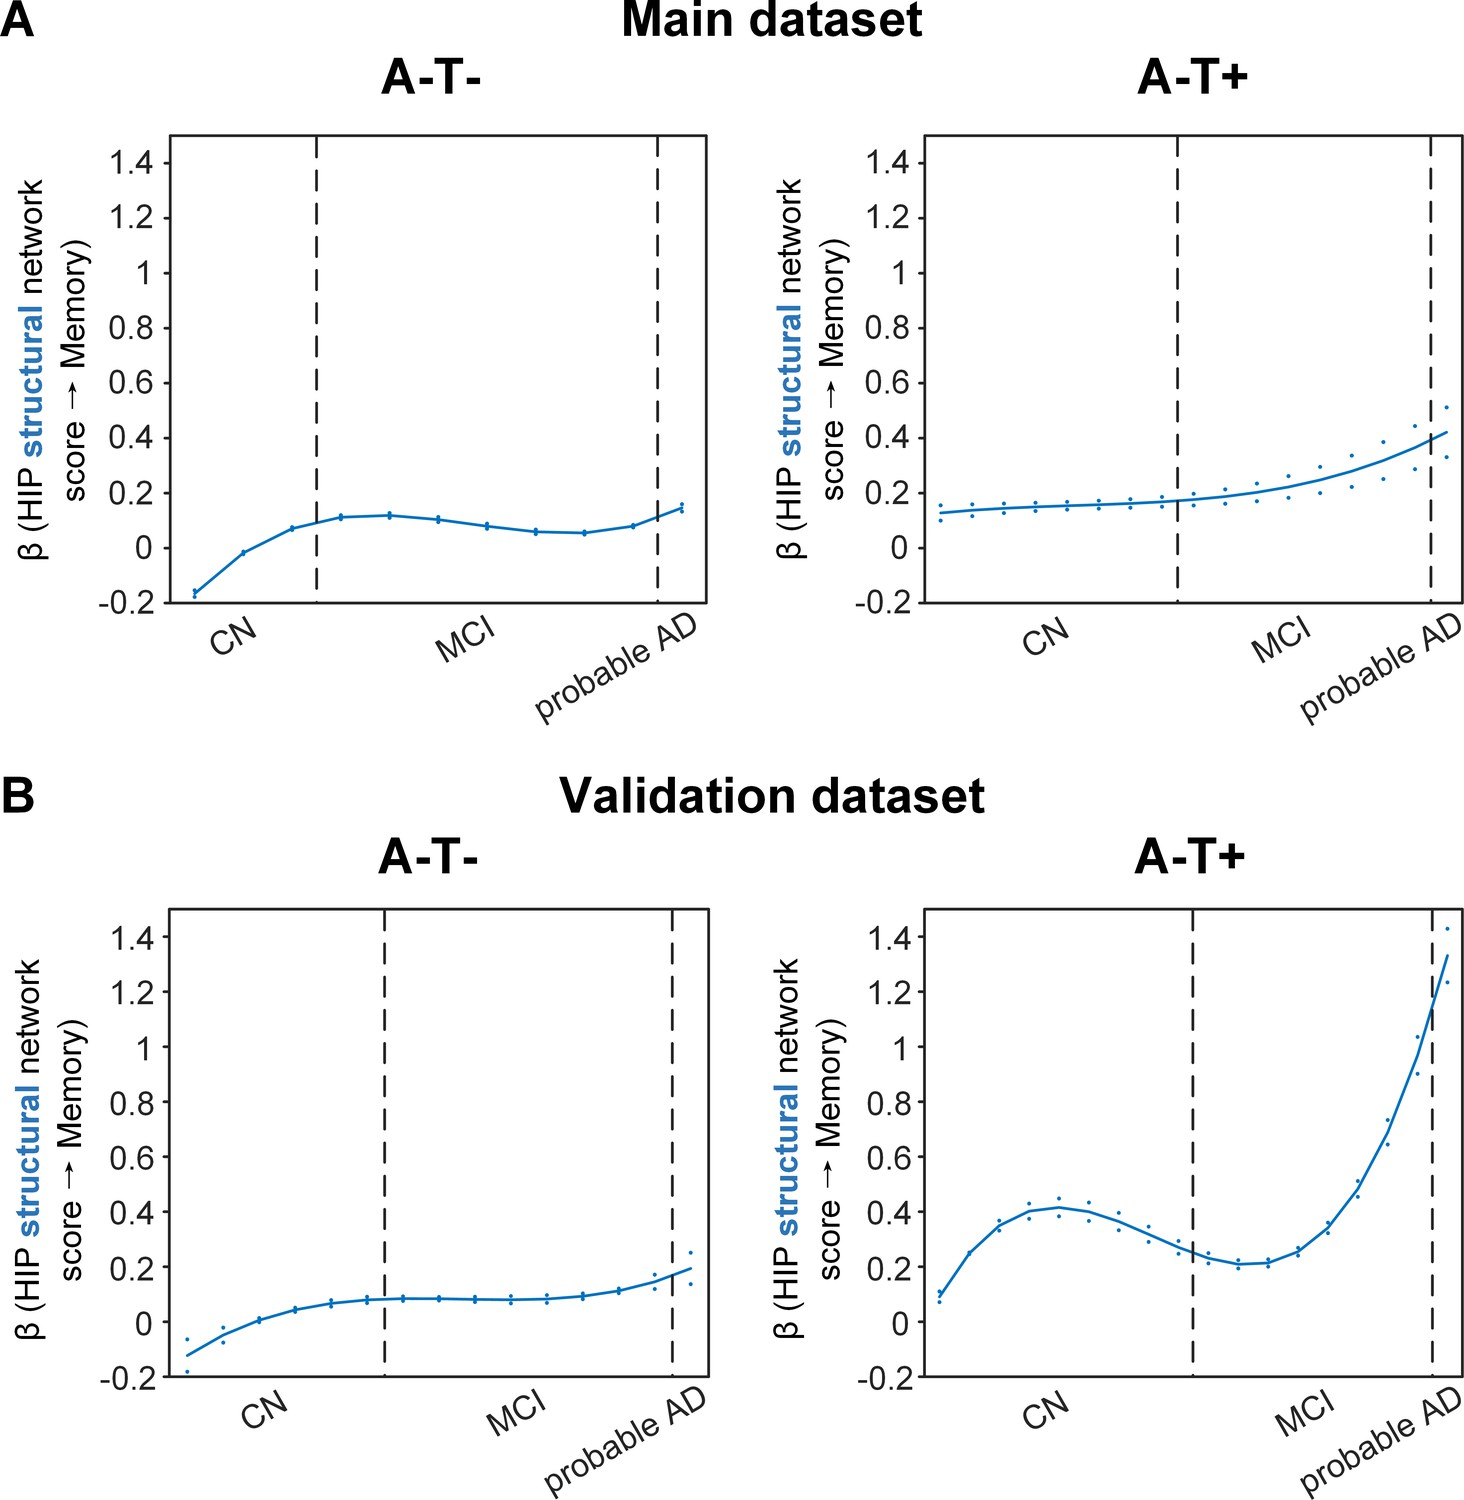
Stage-dependent association of brain hippocampal structural network with memory performance in A-T- and A-T +pathology groups.
Data from the main dataset (panel A) and validation dataset 1 (panel B) exhibited consistent stage-dependent memory-network association trajectory from cognitively normal stage to dementia stage in participants with A-T- and A-T +pathology. The hippocampus-memory association was much weaker overall in non-amyloid/non-tau and tau only groups compared to amyloid positive group (Figure 4). The memory-network association was the lowest in early cognitively normal stage and gradually increased with clinical progression in both groups, while the tau only group had stronger associations in dementia stage. Solid curves represent the mean associations (beta coefficients) of brain network scores with memory as a function of advancing AD continuum estimated from 100 replicates. The dashed curves represent the point-wise 2* standard errors of the solid curves estimated from 100 replicates. The participants were ordered by their cognitive stages (i.e. CN → MCI → probable AD). Within each cognitive stage, the participants were then ordered by general cognition (MMSE for CN) or dementia severity (CDR for MCI and dementia) (i.e. no impairment → severe impairment). Participants with the same level of impairment/severity were further ordered by increasing age (i.e. young → old). Ordered participants were distributed evenly into bins (i.e. 10 subjects/bin). Abbreviations: CN = cognitively normal; MCI = mild cognitive impairment; HIP = hippocampus.
Figure 5—figure supplement 1
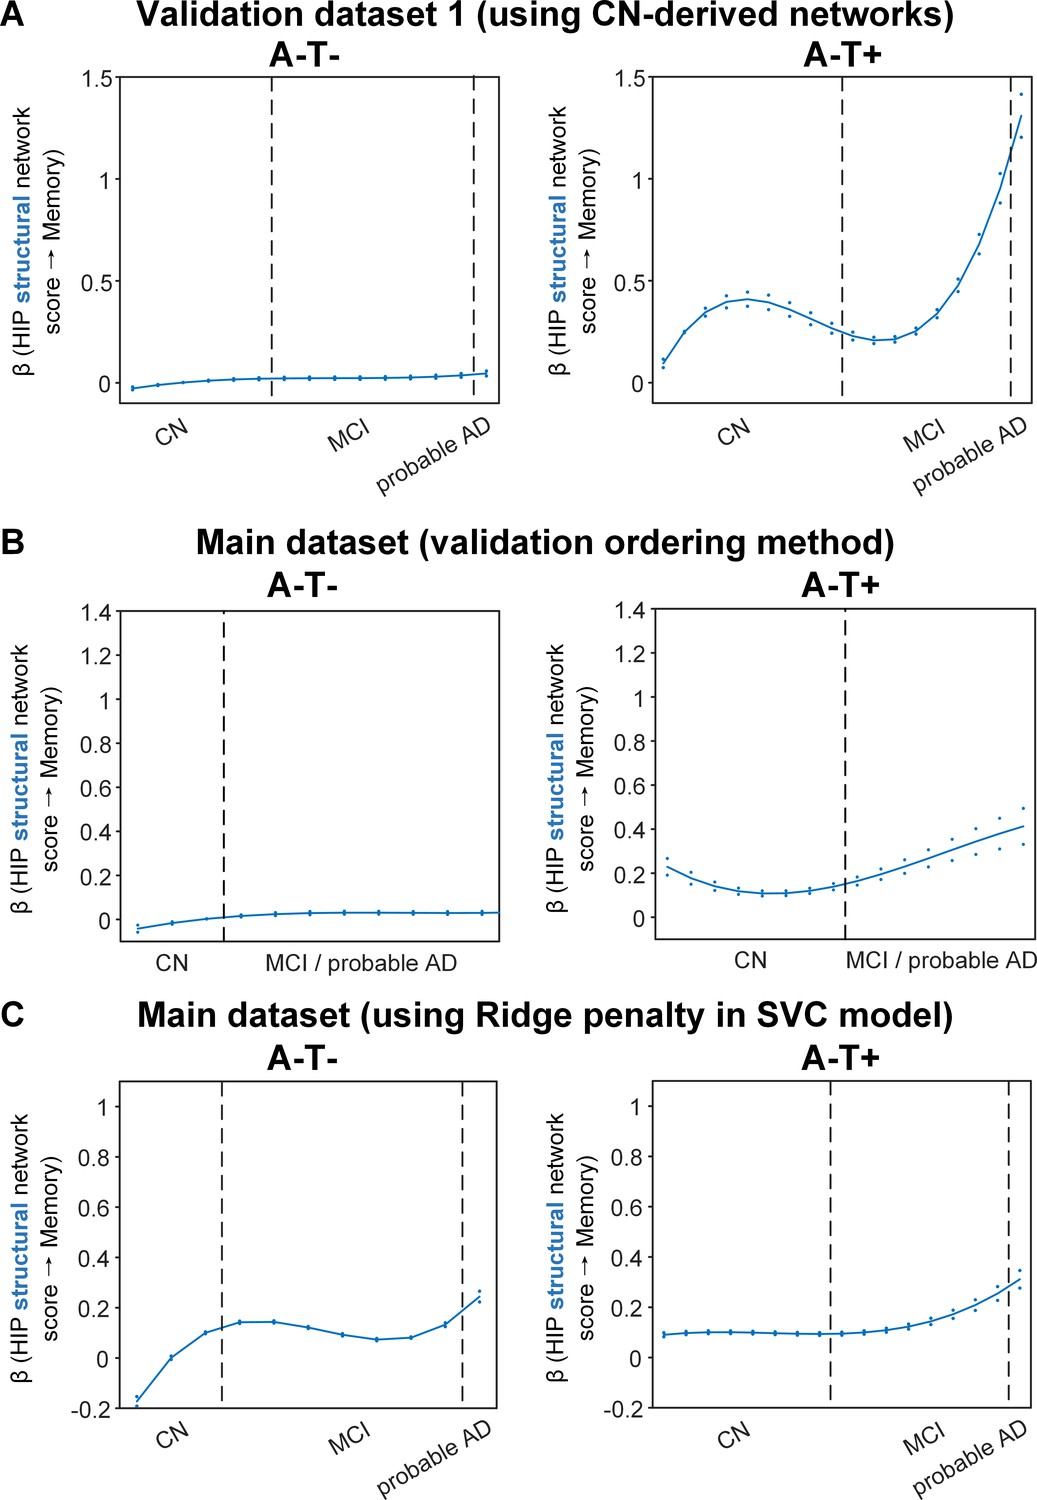
Differential stage-dependent associations of metabolic and structural network scores with memory impairment in A-T- and A-T +pathology groups (validation analyses).
Solid curves represent the mean associations (beta coefficients) of brain network scores with memory as a function of advancing AD continuum estimated from 100 replicates (metabolic in red; structural in blue). The dashed curves represent the point-wise 2* standard errors of the solid curves estimated from 100 replicates. Main ordering method was used in panel A and C where the participants were ordered by their cognitive stages (i.e. CN → MCI → probable AD). Validation ordering method was used in panel B which did not differentiate MCI and probable (i.e. CN → MCI/probable AD). Within each of the two stages, the participants were then ordered by general cognition or dementia severity (i.e. no impairment → severe impairment). Participants with the same cognitive impairment severity were further ordered by increasing age (i.e. young → old). Ordered participants were distributed evenly into bins (i.e. 10 subjects/bin). Abbreviations: CN = cognitively normal; MCI = mild cognitive impairment.
Figure 5—figure supplement 2
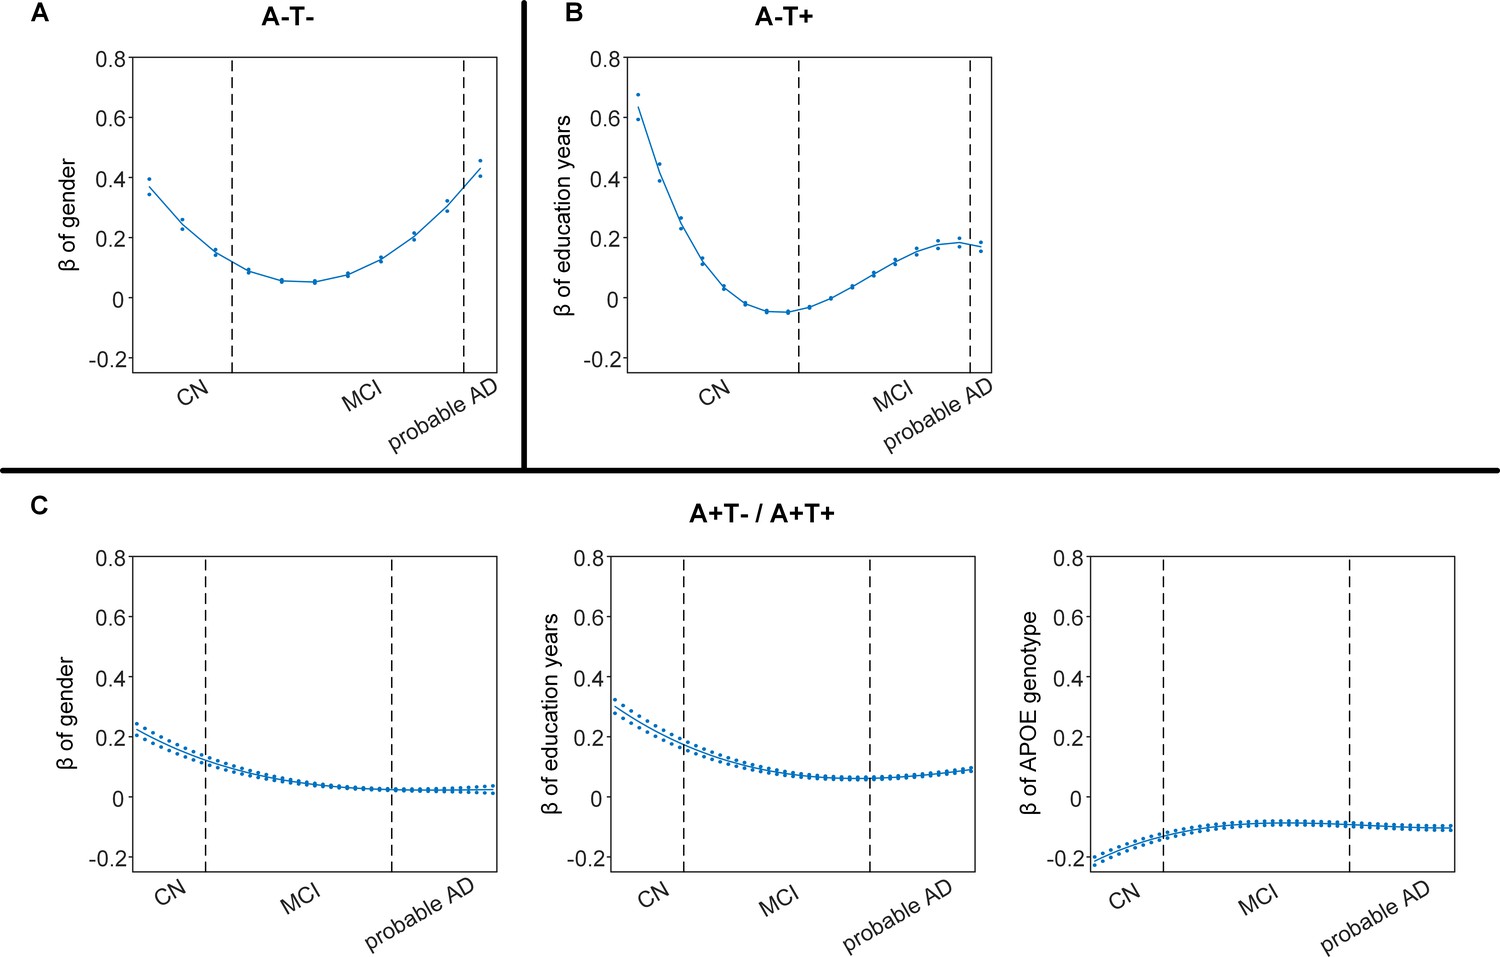
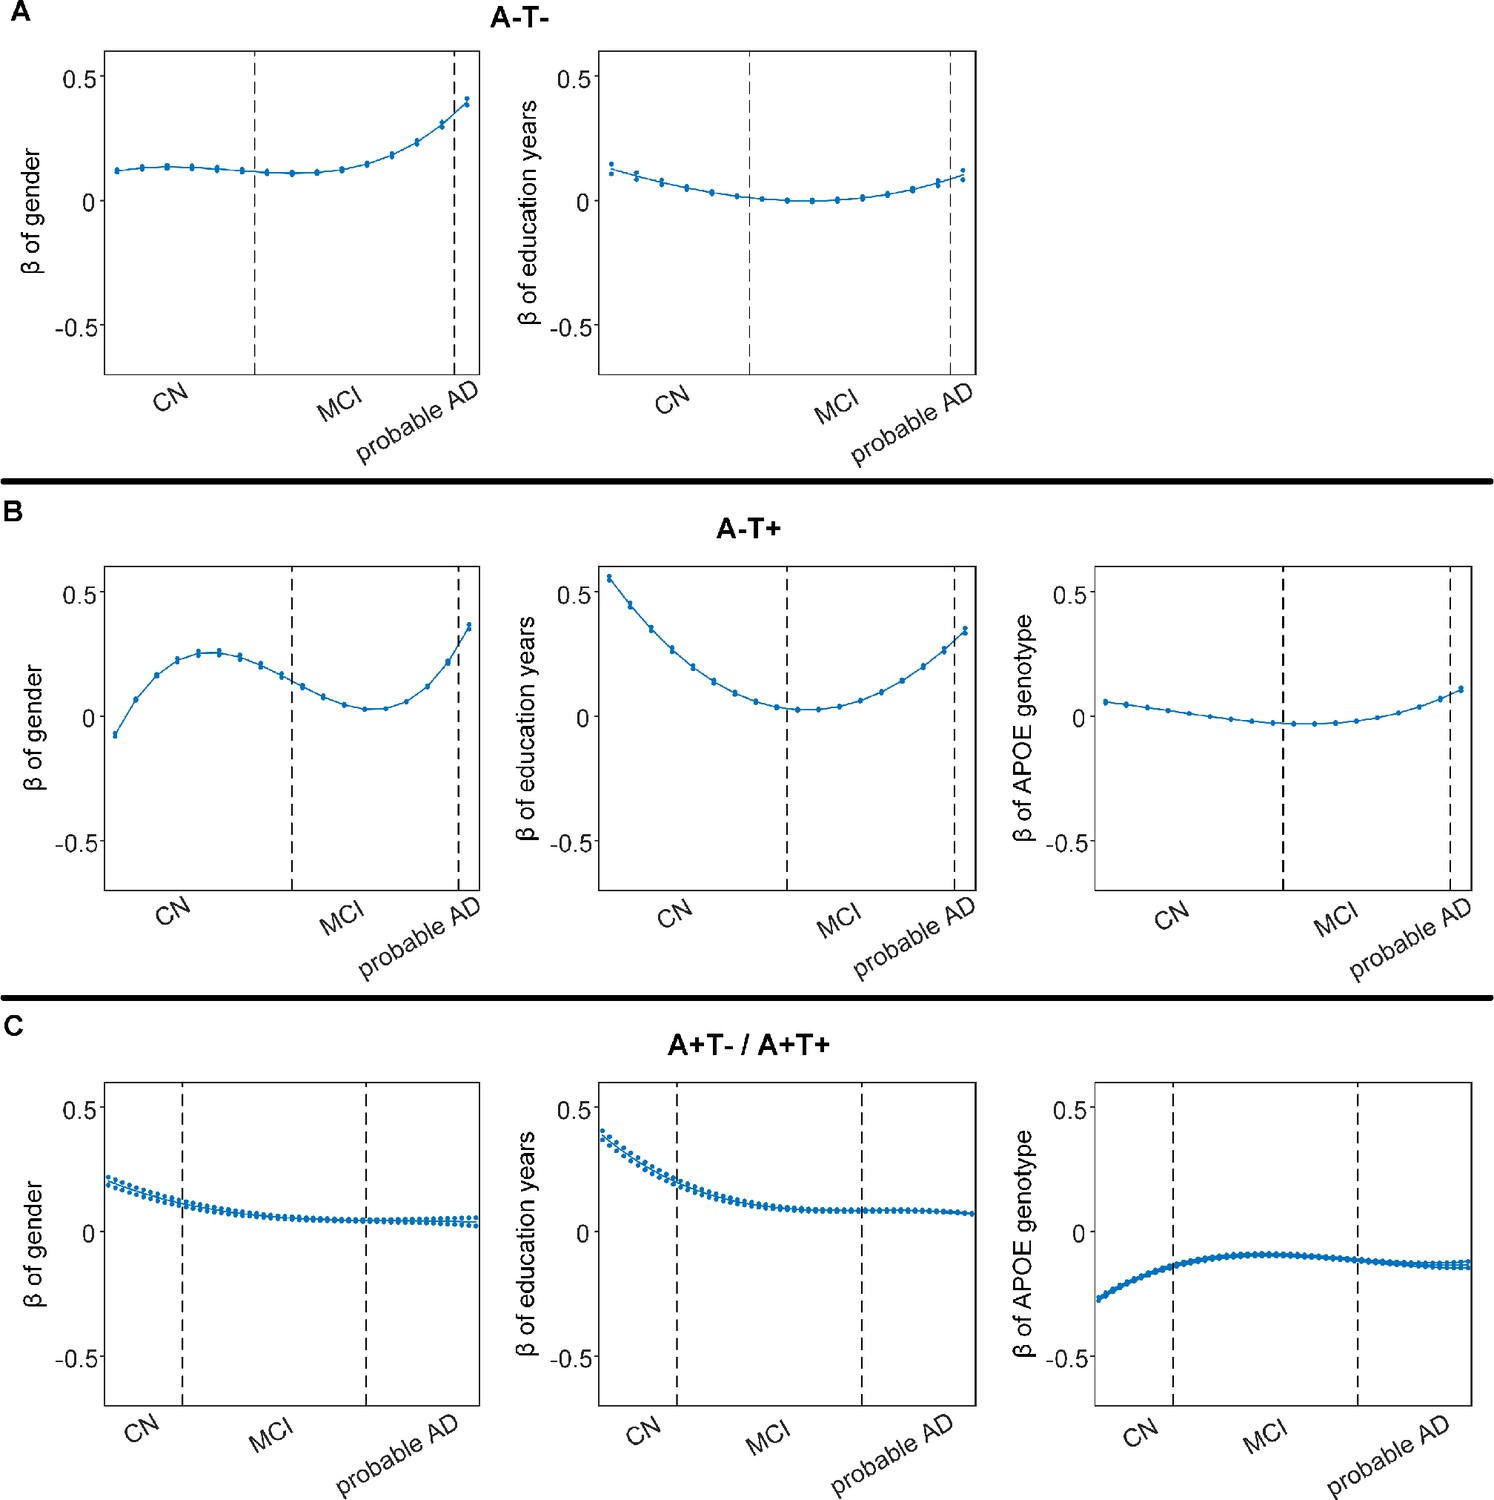
Differential stage-dependent associations of demographic variables with memory impairment in different pathology groups (main dataset).
Solid curves represent the mean associations (beta coefficients) of brain network scores with memory as a function of advancing AD continuum estimated from 100 replicates. The dashed curves represent the point-wise 2* standard errors of the solid curves estimated from 100 replicates. The participants were ordered by their cognitive stages (i.e. CN → MCI → probable AD). Within each diagnosis, the participants were then ordered by general cognition or dementia severity (i.e. no impairment → severe impairment). Participants with the same cognitive impairment severity were further ordered by increasing age (i.e. young → old). Ordered participants were distributed evenly into bins (i.e. 10 subjects/bin). Abbreviations: CN = cognitively normal; MCI = mild cognitive impairment.
Figure 5—figure supplement 3
Differential stage-dependent associations of demographical variables with memory impairment in different pathology group (validation dataset 1).
Solid curves represent the mean associations (beta coefficients) of brain network scores with memory as a function of advancing AD continuum estimated from 100 replicates. The dashed curves represent the point-wise 2* standard errors of the solid curves estimated from 100 replicates. The participants were ordered by their cognitive stages (i.e. CN → MCI → probable AD). Within each diagnosis, the participants were then ordered by general cognition or dementia severity (i.e. no impairment → severe impairment). Participants with the same cognitive impairment severity were further ordered by increasing age (i.e. young → old). Ordered participants were distributed evenly into bins (i.e. 10 subjects/bin). Abbreviations: CN = cognitively normal; MCI = mild cognitive impairment.
Figure 5—figure supplement 4
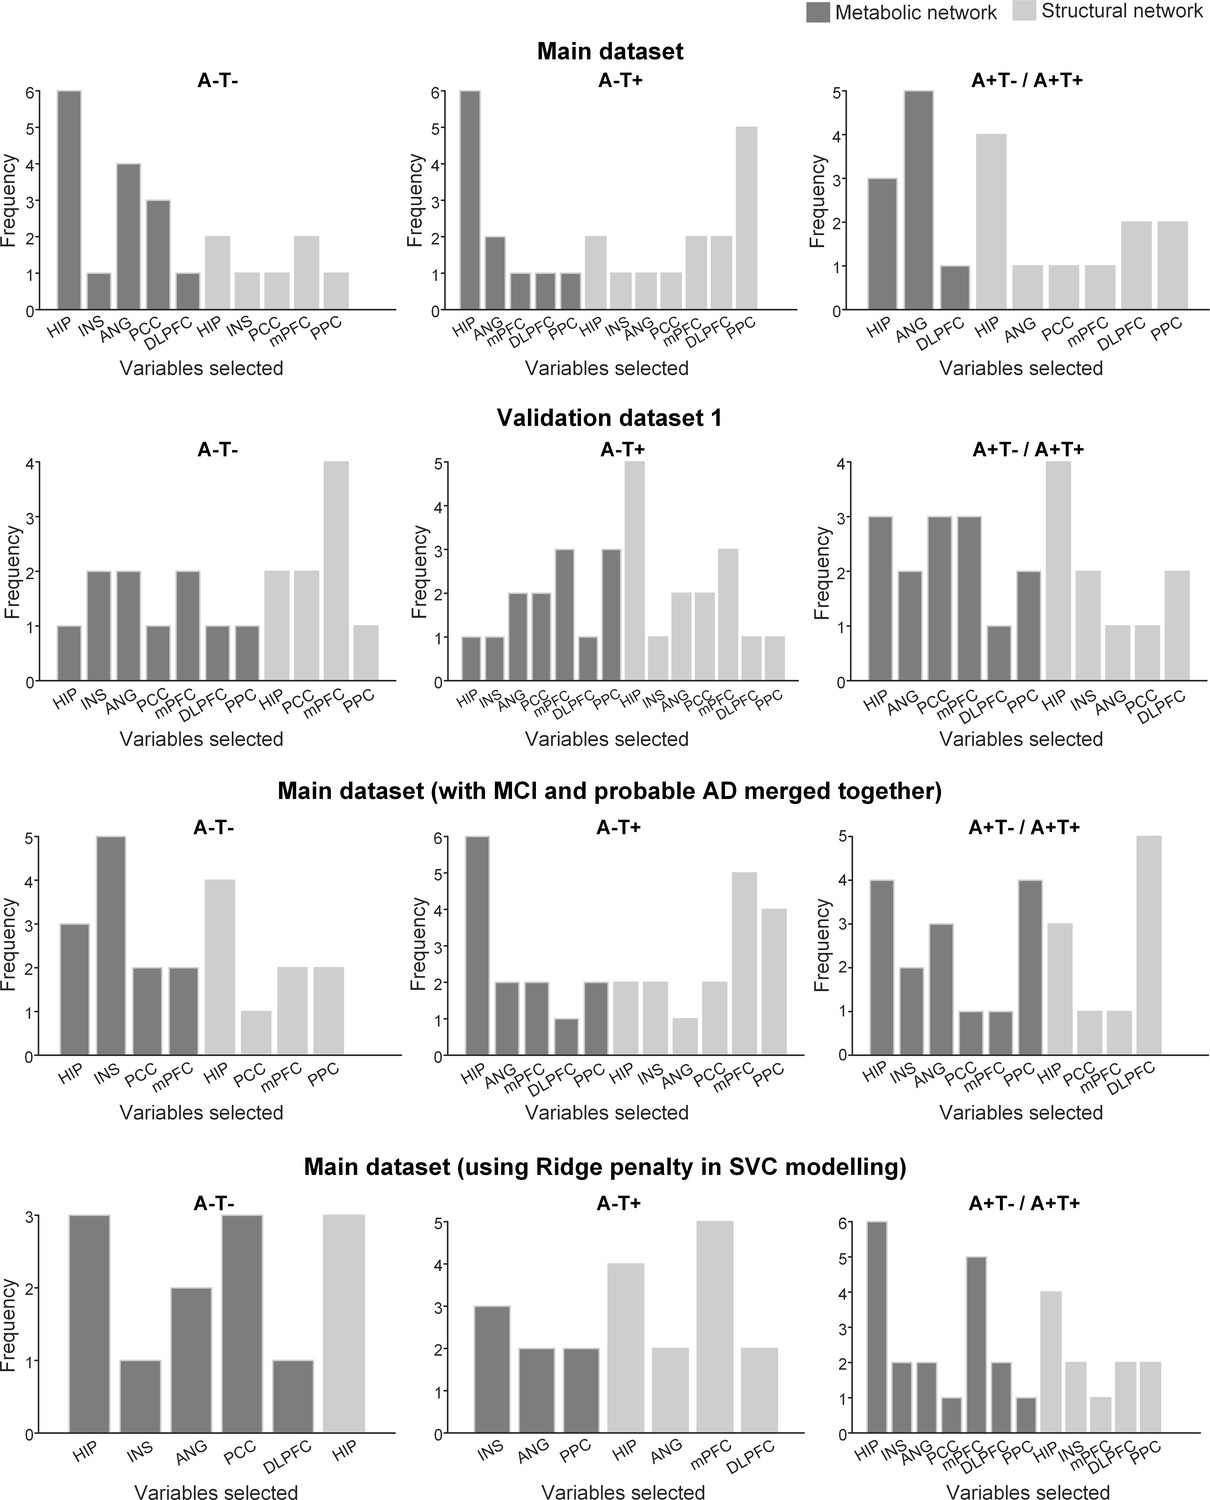
Variable selection frequency distribution for permuted datasets using sparse varying-coefficient (SVC) model.
To assess the specificity of the selected networks, we randomly permuted the memory scores 100 times across the participants. For each of the 100 permuted data sets, we repeated the SVC modelling 100 times and selected the key predictors of memory as those brain measures that consistently appeared for more than 90 repetitions. Y axis (Frequency) represented the total selection times in the 100 permuted datasets of each selected brain measure.
Author response image 1
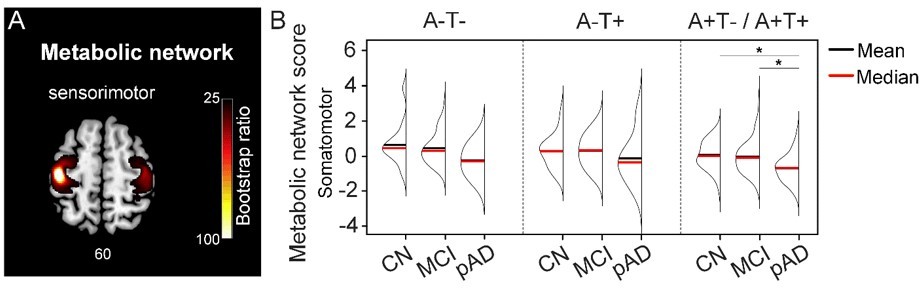
Metabolic sensorimotor network and the network scores.
A. Brain slice of metabolic covariance network associated with the primary motor cortex seed. B. The summary of individual-level metabolic network scores (mean and median) presented in half-violin plots. ‘*’ indicates significant group difference (p).
Tables
Table 1
Subject demographics for the main study cohort.
| A-T- | A-T+ | A+T-/A+T + | |||||||||
|---|---|---|---|---|---|---|---|---|---|---|---|
| CN | MCI | probable AD | CN | MCI | probable AD | CN | MCI | probable AD | |||
| N | 30 | 74 | 4 | 80 | 75 | 7 | 85 | 225 | 128 | ||
| Age, years | 65.12~85.16 | 56.08~88.51 | 69.56~90.50 | 56.53~84.47 | 55.15~88.83 | 60.79~80.76 | 60.19~90.08 | 55.38~91.57 | 55.96~90.46 | ||
| 72.24±4.54 | 69.78±7.20d | 77.37±9.11m | 71.95±5.87 | 70.21±8.16 | 74.57±7.70 | 75.37±6.59 | 73.17±6.93 | 74.12±8.19 | |||
| Gender (M/F) | 12/18 | 39/35 | 4/0 | 45/35 | 38/37 | 6/1 | 37/48 | 127/98 | 72/56 | ||
| Handedness (R/L) | 29/1 | 60/14 | 4/0 | 69/11 | 67/8 | 7/0 | 79/6 | 203/22 | 118/10 | ||
| Education, years | 16.63±2.68 | 16.45±2.59 | 17.50±1.29 | 16.88±2.67 | 16.00±2.65 | 16.71±2.43 | 16.34±2.36 | 16.12±2.74 | 15.78±2.71 | ||
| APOE e4 (+/-) | 6/24 | 16/58 | 0/4 | 16/64 | 17/58 | 1/6 | 38/47md | 140/85cd | 93/35cm | ||
| Memory | 1.28±0.66md | 0.75±0.64cd | –0.12±0.68cm | 1.17±0.57md | 0.55±0.62cd | –0.40±0.67cm | 0.97±0.63md | 0.20±0.63cd | –0.87±0.53cm | ||
| MMSE | 28.70±1.68d | 28.62±1.31d | 25.75±2.36cm | 29.15±0.99md | 28.29±1.64cd | 23.86±2.19cm | 29.02±1.17md | 27.81±1.86cd | 23.21±2.24cm | ||
| CDR-SOB | 0.02±0.09md | 1.22±0.60cd | 4.38±3.04cm | 0.05±0.15md | 1.20±0.76cd | 4.57±1.40cm | 0.05±0.17md | 1.53±0.90cd | 4.64±1.70cm | ||
| ICV | 1523.77±152.57 | 1520.05±127.78 | 1540.83±36.50 | 1554.01±128.10 | 1559.14±147.96 | 1566.75±221.76 | 1524.87±148.29 | 1558.61±148.25 | 1549.78±163.05 | ||
-
Note: Data on age are range and mean ± SD. Data on education, ICV, and memory are mean ± SD. Data on memory are in z-scores. Abbreviations: CN = cognitively normal; MCI = mild cognitive impairment; AD = Alzheimer's disease; A = β-amyloid; T = tau; ‘+’ = positive; ‘-’ = negative; y = years; M = male; F = female; R = right; L = left; MMSE = Mini-Mental State Exam; CDR-SOB = Clinical Dementia Rating Sum of Box; ICV = intracranial volume. Superscripts (‘c’, ‘m’, ‘d’) represent significant group difference with CN, MCI and probable AD, respectively.
Additional files
-
Supplementary file 1
Participants demographics for network seed definition step.
- https://cdn.elifesciences.org/articles/77745/elife-77745-supp1-v4.docx
-
Supplementary file 2
Study participant demographics of the validation dataset 1 for the PLS-SVC model.
- https://cdn.elifesciences.org/articles/77745/elife-77745-supp2-v4.docx
-
Supplementary file 3
Study participant demographics of the validation dataset 2 for the SVC model.
- https://cdn.elifesciences.org/articles/77745/elife-77745-supp3-v4.docx
-
Supplementary file 4
The coordinates of the peak foci of regions showing difference in metabolism and grey matter volume between probable AD and healthy controls.
- https://cdn.elifesciences.org/articles/77745/elife-77745-supp4-v4.docx
-
Transparent reporting form
- https://cdn.elifesciences.org/articles/77745/elife-77745-transrepform1-v4.docx
Download links
A two-part list of links to download the article, or parts of the article, in various formats.
Downloads (link to download the article as PDF)
Open citations (links to open the citations from this article in various online reference manager services)
Cite this article (links to download the citations from this article in formats compatible with various reference manager tools)
Stage-dependent differential influence of metabolic and structural networks on memory across Alzheimer’s disease continuum
eLife 11:e77745.
https://doi.org/10.7554/eLife.77745


