Immune dynamics in SARS-CoV-2 experienced immunosuppressed rheumatoid arthritis or multiple sclerosis patients vaccinated with mRNA-1273
- Department of Immunopathology, Sanquin Research and Landsteiner Laboratory, University of Amsterdam, Netherlands
- Department of Hematopoiesis, Sanquin Research and Landsteiner Laboratory, University of Amsterdam, Netherlands
- Department of Experimental Immunohematology, Sanquin Research and Landsteiner Laboratory, Netherlands
- Sydney Cytometry Core Research Facility, Charles Perkins Centre, Centenary Institute, and The University of Sydney, Australia
- School of Medical Sciences, Faculty of Medicine and Health, The University of Sydney, Australia
- Department of Neurology and Neurophysiology, Amsterdam Neuroscience, University of Amsterdam, Netherlands
- Department of Research Facilities, Sanquin Research, Netherlands
- Department of Microbiology and Immunology, University of Melbourne at the Peter Doherty Institute for Infection and Immunity, Australia
- Global Station for Zoonosis Control, Global Institution for Collaborative Research and Education (GI-CoRE), Hokkaido University, Japan
- Department of Rheumatology, Amsterdam Rheumatology and immunology Center, Netherlands
- Amsterdam Rheumatology and immunology Center, Department of Rheumatology and Clinical Immunology, University of Amsterdam, Netherlands
- Amsterdam UMC, Vrije Universiteit, Department of Neurology, Netherlands
- Department of Clinical Neurophysiology, St Antonius Hospital, Netherlands
- Department of Pediatric Immunology, Rheumatology and Infectious Disease, University of Amsterdam, Netherlands
- Swammerdam Institute for Life Sciences, University of Amsterdam, Netherlands
Figures
Figure 1 with 3 supplements

Dynamics of circulating immune populations after severe acute respiratory syndrome coronavirus 2 (SARS-CoV-2) mRNA vaccination.
(a) Overview of cohort (b) distribution of time since primary infection within the different groups and (c) longitudinal study design. SARS-CoV-2 mRNA vaccination was administrated in two doses to SARS-CoV-2 experienced RA patients on methotrexate (RA-MTX) treatment, MS patients on ocrelizumab (MS-OCR) treatment, and healthy controls (HCs). Whole blood (red) or serum (yellow) was collected at indicated time points. (d–e) UMAP and cluster identification from FlowSOM analysis of two high-dimensional flow cytometry panels. The UMAP is separated across groups and major adaptive immune populations were subclustered in individual projections. (f) Schematic overview of circulating immune populations and their interactions. (g) Representation of cell count of immune populations that are affected by first (T1) and second (T3) vaccination as compared to baseline (T0) in the different groups. Each immune population is represented by a single column of colored squares, and each time point-disease group combination is represented by a single row. Color squares represent the populations that are reduced (blue), increased (red), or not affected (white). Statistical significance was determined using a Wilcoxon signed-rank test with Bonferroni-Holm multiple comparison correction.
Figure 1—figure supplement 1
Spectre analysis of circulating immune populations after severe acute respiratory syndrome coronavirus 2 (SARS-CoV-2) mRNA vaccination.
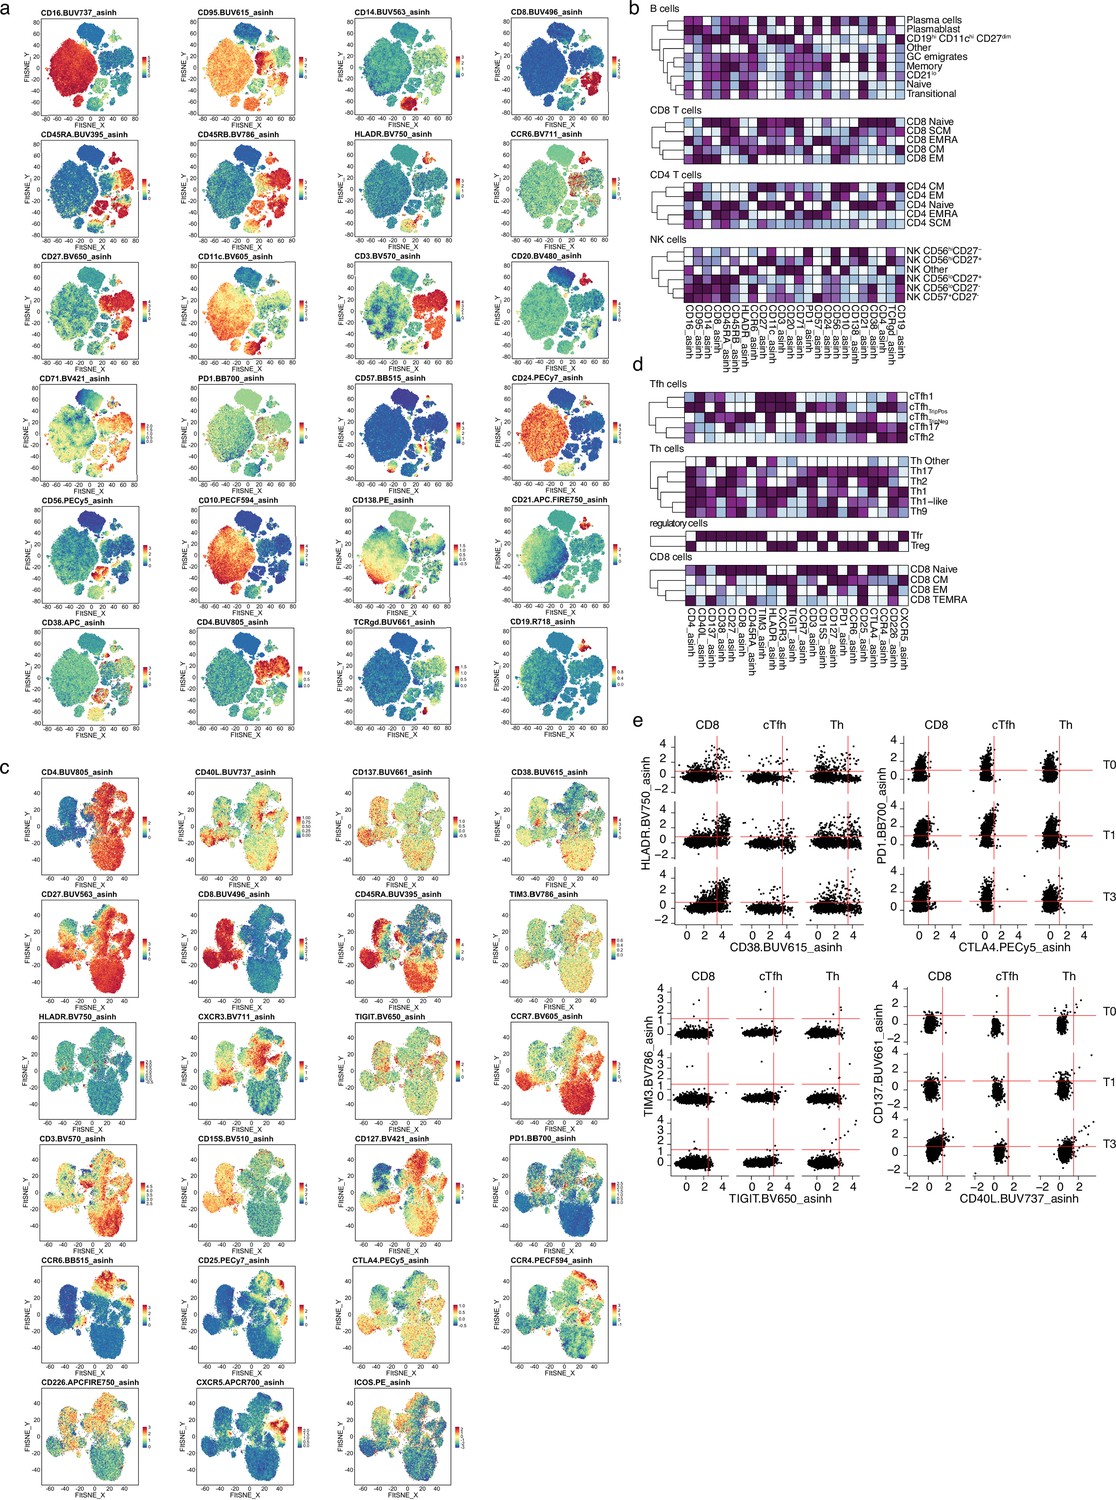
(a and c) UMAPs are colored based on the expression of surface markers included in the immune phenotype panel (a) or T cell activation panel that includes dynamic activation and exhaustion markers (c). (b and d) Heatmap representation of the surface marker expression of panel 1 (b) or panel 2 (d) within the major circulating immunocyte linages. (e) Representative flow cytometry plots showing the expression of HLA-DR, CD38, PD1, CTLA4, TIM3, TIGIT, CD137, and CD40L in CD8 T cells, circulating T follicular helper (Tfh) and T helper (Th) cells.
Figure 1—figure supplement 2
Circulating immune populations after severe acute respiratory syndrome coronavirus 2 (SARS-CoV-2) mRNA vaccination of SARS-CoV-2 experienced rheumatoid arthritis using methotrexate (RA-MTX), multiple sclerosis using ocrelizumab (MS-OCR), and healthy control (HC).
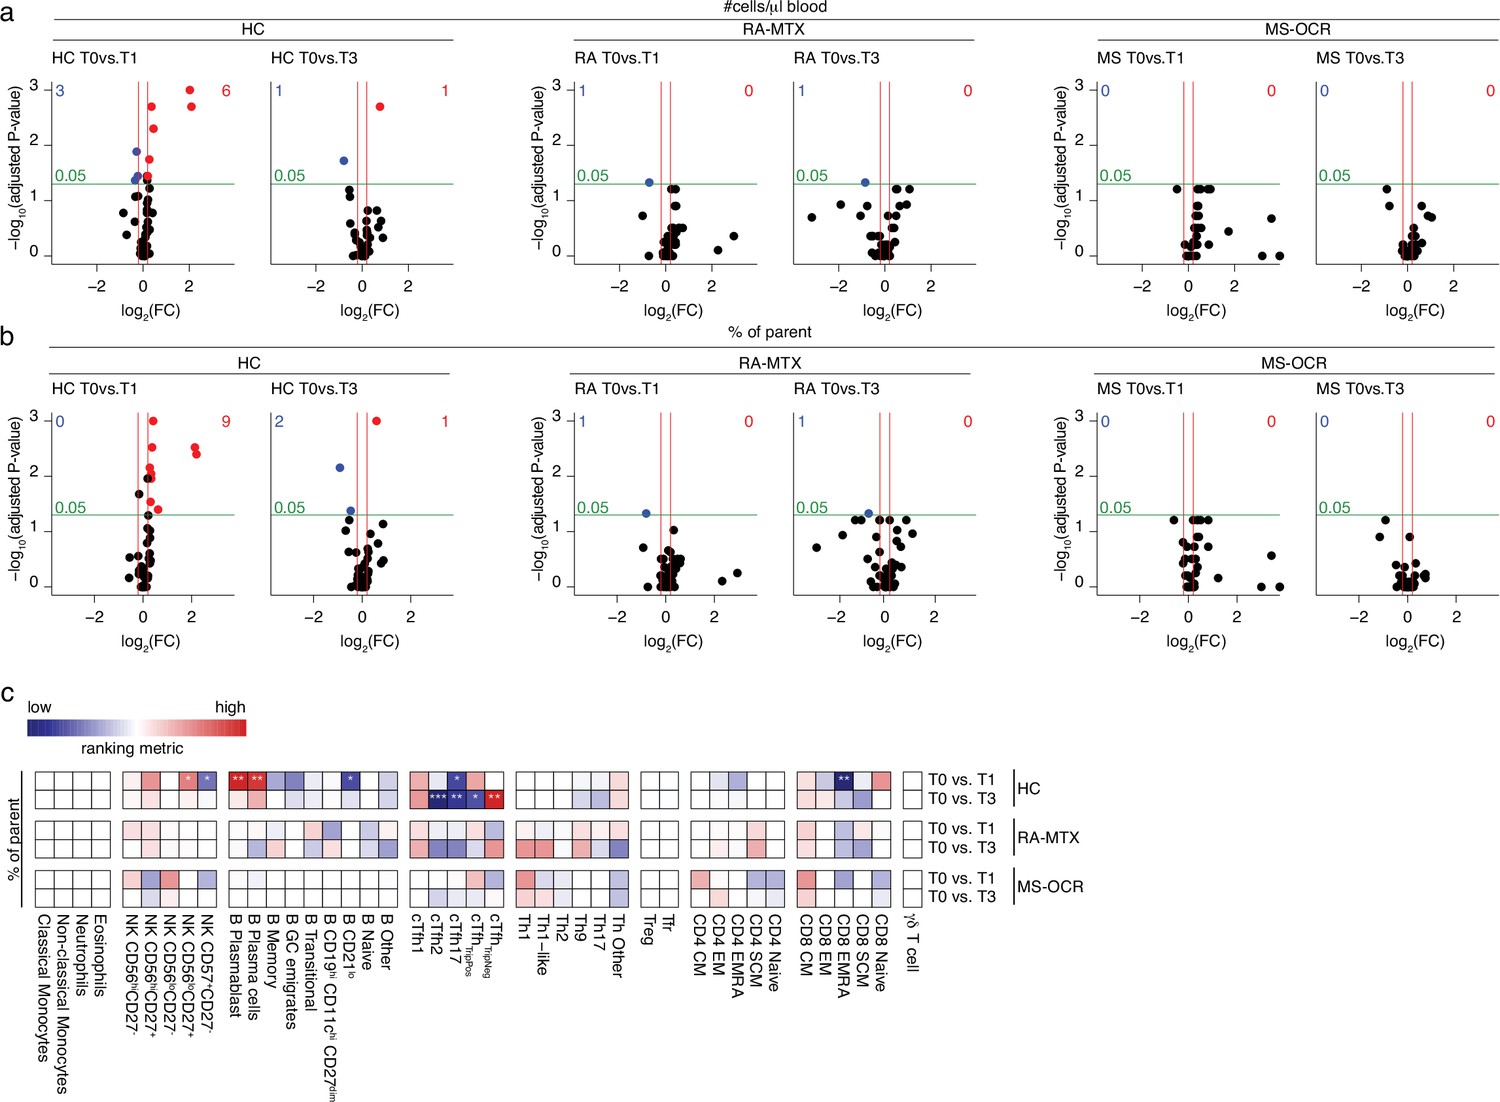
(a–d) Volcano plots represent fold-change (log2) on the x-axis and significance (p-value; log10) on the y-axis. Each dot represents a circulating immune population. Cell count per µl blood (a) and percentage (b) of circulating immune populations are analyzed after first (T1) and second (T3) vaccination as compared to baseline (T0) in the SARS-CoV-2 experienced HC, RA patients on MTX and MS patients on OCR. (c) Representation of percentage of immune populations that are affected by first (T1) and second (T3) vaccination as compared to baseline (T0). Each immune population is represented by a single column of colored squares, and each time point-disease group combination is represented by a single row. Color squares represent the populations that are significantly reduced (blue), increased (red), or not affected (white). Statistical significance was determined using a Wilcoxon matched-pairs signed-rank test with Bonferroni-Holm multiple comparison correction.
Figure 1—figure supplement 3
Innate immune cells in the blood of severe acute respiratory syndrome coronavirus 2 (SARS-CoV-2) mRNA vaccinated SARS-CoV-2 experienced rheumatoid arthritis using methotrexate (RA-MTX) and multiple sclerosis using ocrelizumab (MS-OCR) patients.
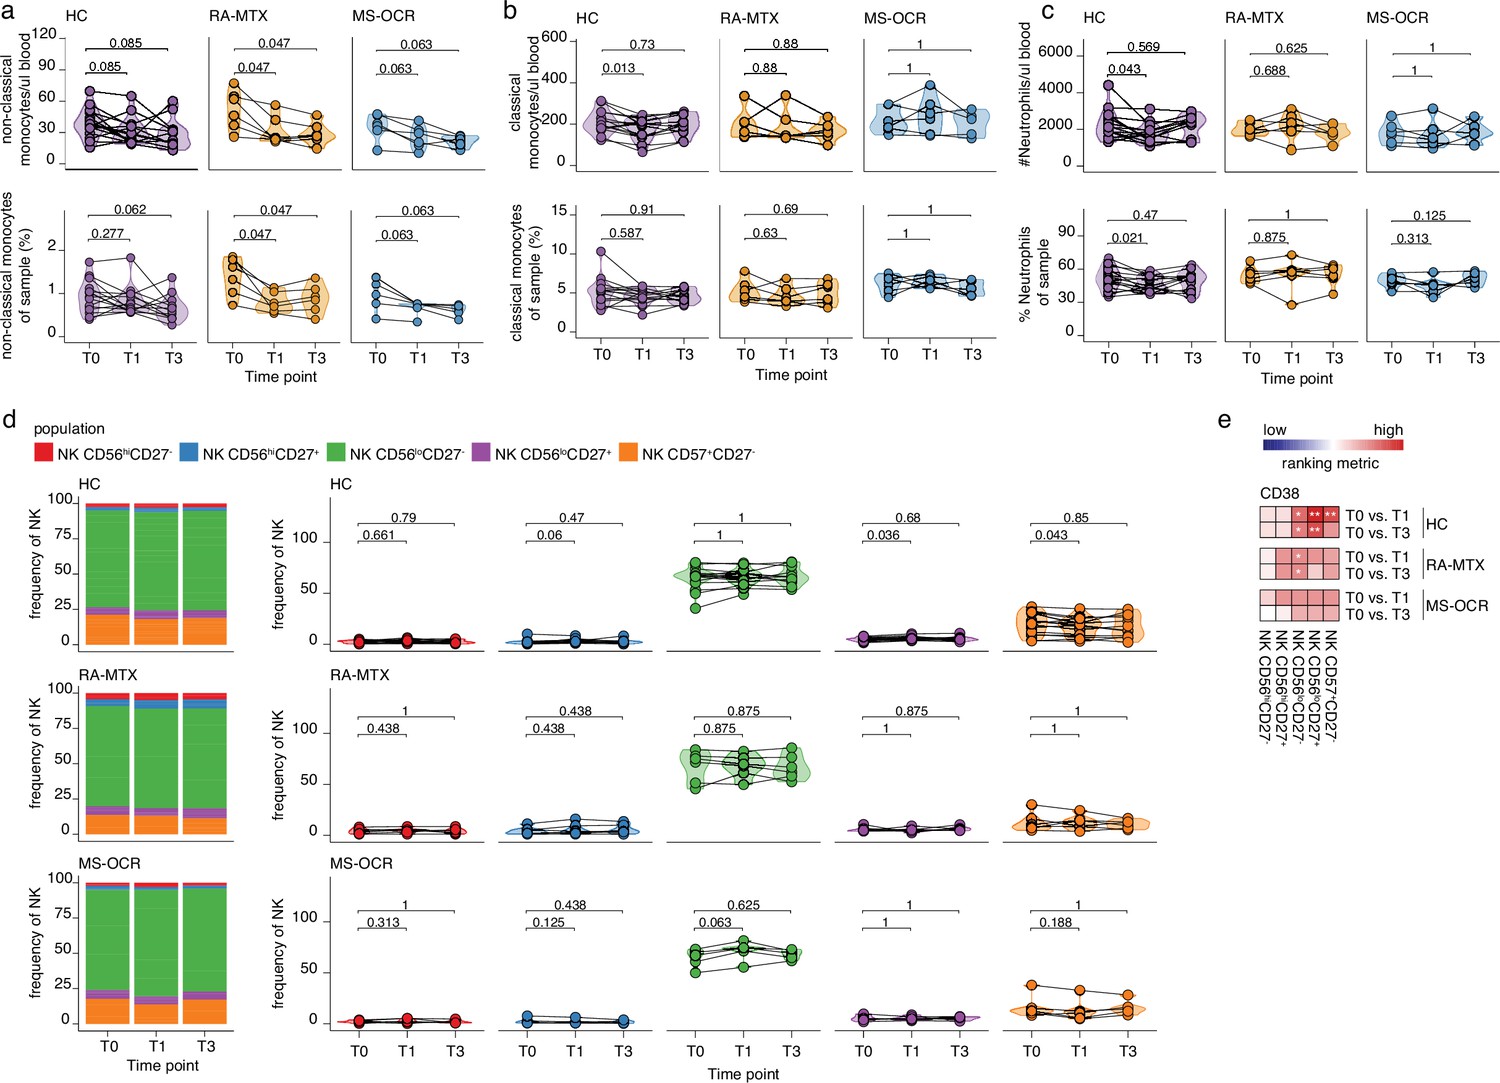
(a–c) Count per µl of blood (top) and frequency (bottom) of classical monocytes (a), non-classical monocytes (b), and neutrophils (c) before (T0) and 7 days after first (T1) and second vaccination (T3) in SARS-CoV-2 experienced RA-MTX patients, MS-OCR patients, and healthy controls (HCs). (d) Frequency of natural killer (NK) cell populations before (T0) and 7 days after first (T1) and second vaccination (T3) in SARS-CoV-2 experienced HCs, RA patients on MTX treatment and MS patients on OCR treatment. (e) Representation of the ranking metric (a score that combines fold-change and p-value) of CD38 expression within the different circulating NK cell populations after first (T1) and second (T3) vaccination as compared to baseline (T0). Each immune population is represented by a single column of colored squares, and each time point-disease group combination is represented by a single row. Color squares represent the populations in which CD38 expression is significantly reduced (blue), increased (red), or not affected (white). Statistical significance was determined using a Wilcoxon matched-pairs signed-rank test with Bonferroni-Holm multiple comparison correction.
Figure 2 with 1 supplement
Antibody and circulating B cells responses of severe acute respiratory syndrome coronavirus 2 (SARS-CoV-2) mRNA vaccinated SARS-CoV-2 experienced rheumatoid arthritis using methotrexate (RA-MTX) and multiple sclerosis using ocrelizumab (MS-OCR) patients.
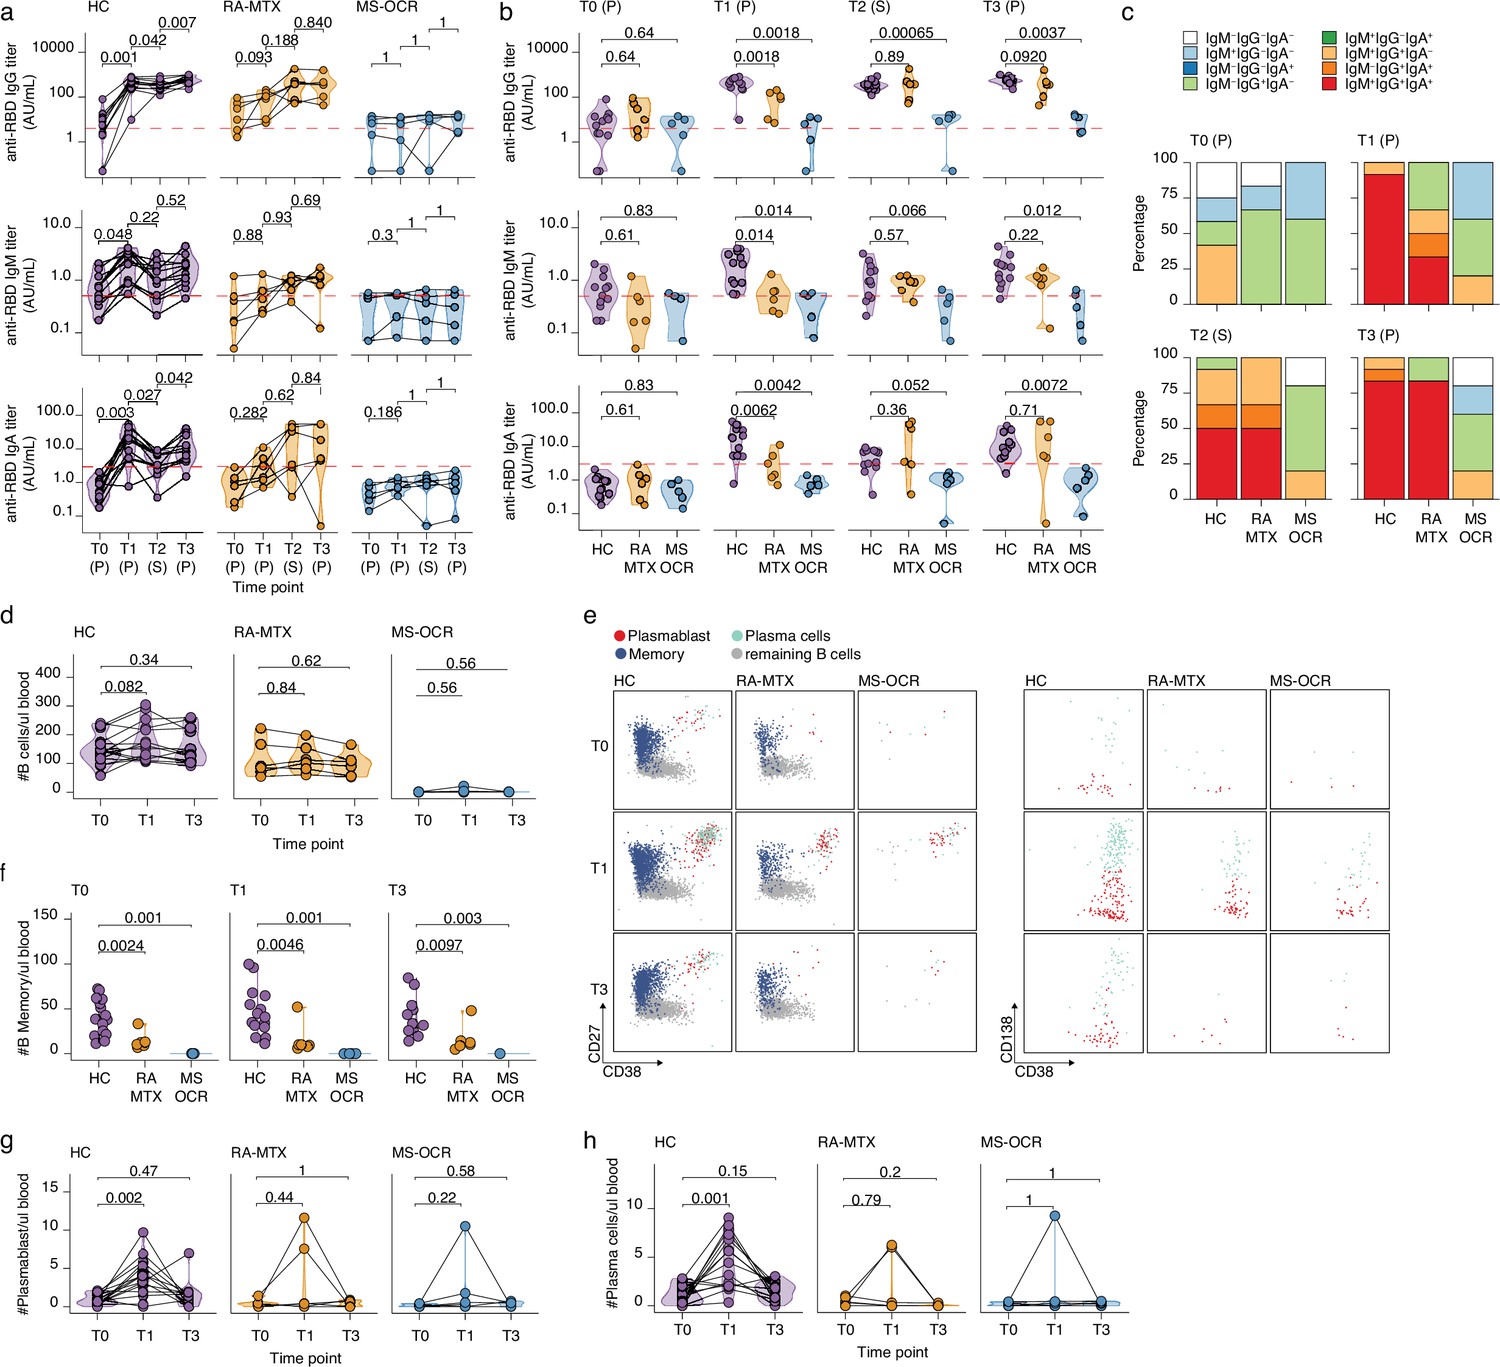
(a–c) Results of ELISAs measuring antibody reactivity to RBD before vaccination (T0), 7 days after the first vaccination (T1), before second vaccination (T2), and 7 days after the second vaccination (T3) in SARS-CoV-2 experienced RA-MTX and MMS-OCR and healthy controls (HCs). The antibody titers of the time points T0, T1, and T3 were determined in plasma (P) and for time point T2 in serum (S). Anti-RBD IgG (top), anti-RBD IgM (middle), and anti-RBD IgA (bottom) levels are plotted longitudinally (a) or separated by groups across time points (b). (c) Percentage of participants seropositive for anti-RBD of the IgG, IgA, and/or IgM isotypes. (d) Count per µl of blood of total B cells. (e) Representative flow cytometry plots for the quantification of circulating B cell populations. Colors represent the populations that were identified by unbiased analysis. (f–h) Count per µl of blood of memory B cells (f), plasmablast (g), and plasma cells (h) before (T0) and 7 days after first (T1) and second vaccination (T3). Statistical significance was determined using a Wilcoxon signed-rank test (a, d, g, and h) or a Mann-Whitney test (b and f) with Bonferroni-Holm multiple comparison correction.
Figure 2—figure supplement 1
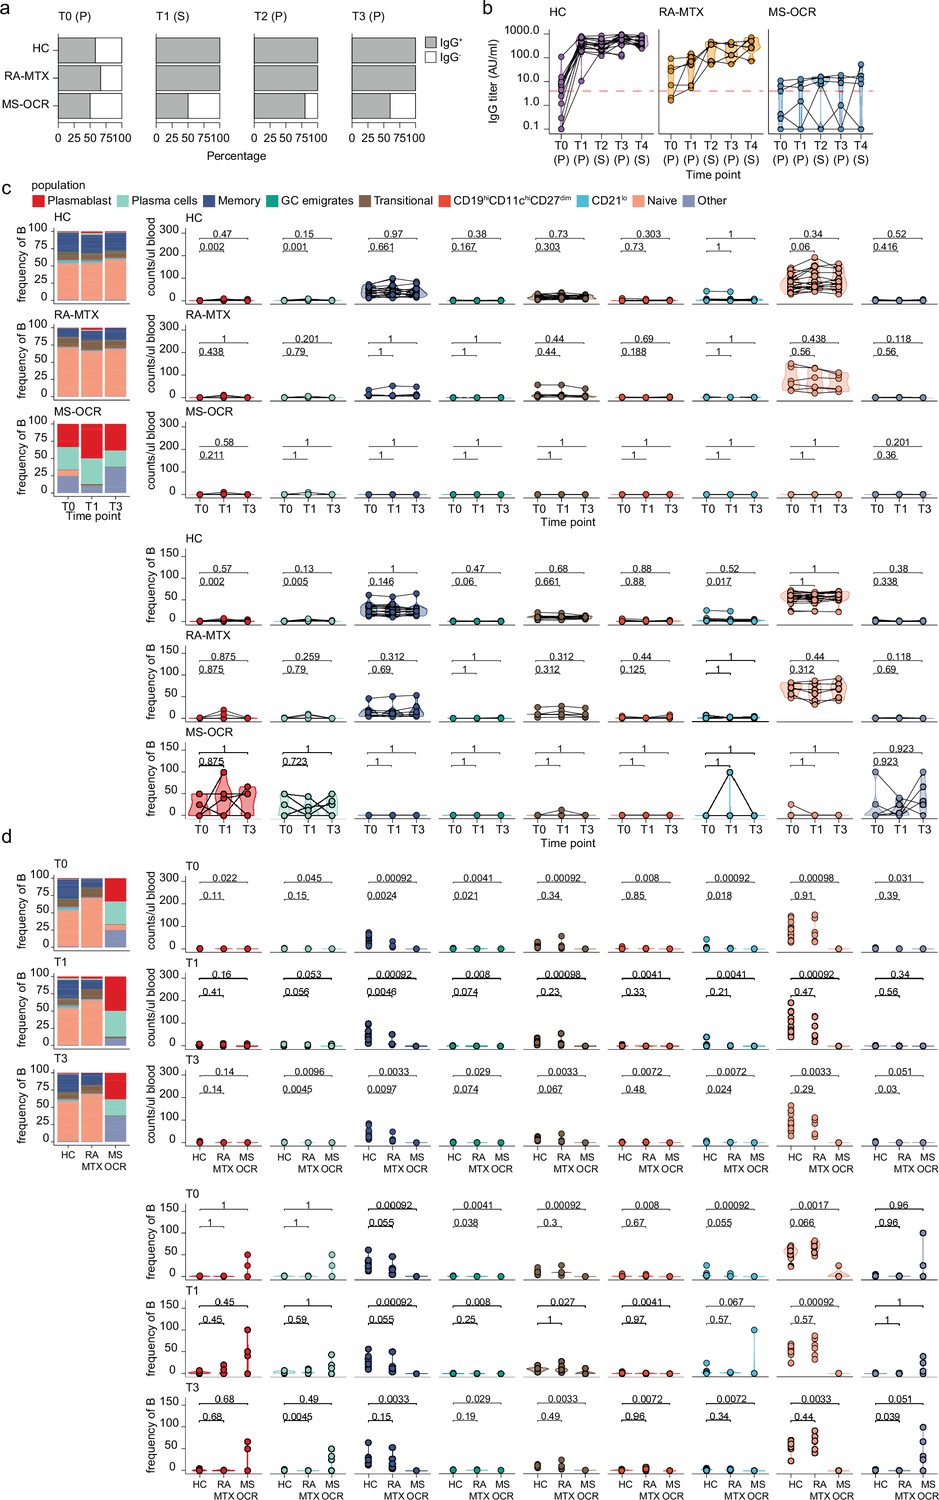
Antibody and circulating B cells responses in severe acute respiratory syndrome coronavirus 2 (SARS-CoV-2) mRNA vaccinated SARS-CoV-2 experienced rheumatoid arthritis using methotrexate (RA-MTX) and multiple sclerosis using ocrelizumab (MS-OCR) patients.
Results of ELISAs measuring antibody reactivity to RBD before vaccination (T0), 7 days after the first vaccination (T1), before second vaccination (T2), and 7 days (T3) and 28 days (T4) after the second vaccination in SARS-CoV-2 experienced RA-MTX patients, MS-OCR patients, and healthy controls (HCs). The antibody titers of the time points T0, T1, and T3 were determined in plasma (P) and for time point T2 and T4 in serum (S). (a) Percentage of participants seropositive for anti-RBD of the IgG isotypes and (b) IgG titer in time. (c–d) Count per µl of blood (top) and frequency (bottom) of B cell populations before (T0) and 7 days after first (T1) and second vaccination (T3) in SARS-CoV-2 experienced HC, RA-MTX, and MS-OCR. Statistical significance was determined using a Wilcoxon signed-rank test (c) and a Mann-Whitney test (d) with Bonferroni-Holm multiple comparison correction.
Figure 3 with 1 supplement
Circulating CD4+ T follicular helper (Tfh) cell responses of severe acute respiratory syndrome coronavirus 2 (SARS-CoV-2) mRNA vaccinated SARS-CoV-2 experienced rheumatoid arthritis using methotrexate (RA-MTX) and multiple sclerosis using ocrelizumab (MS-OCR) patients.
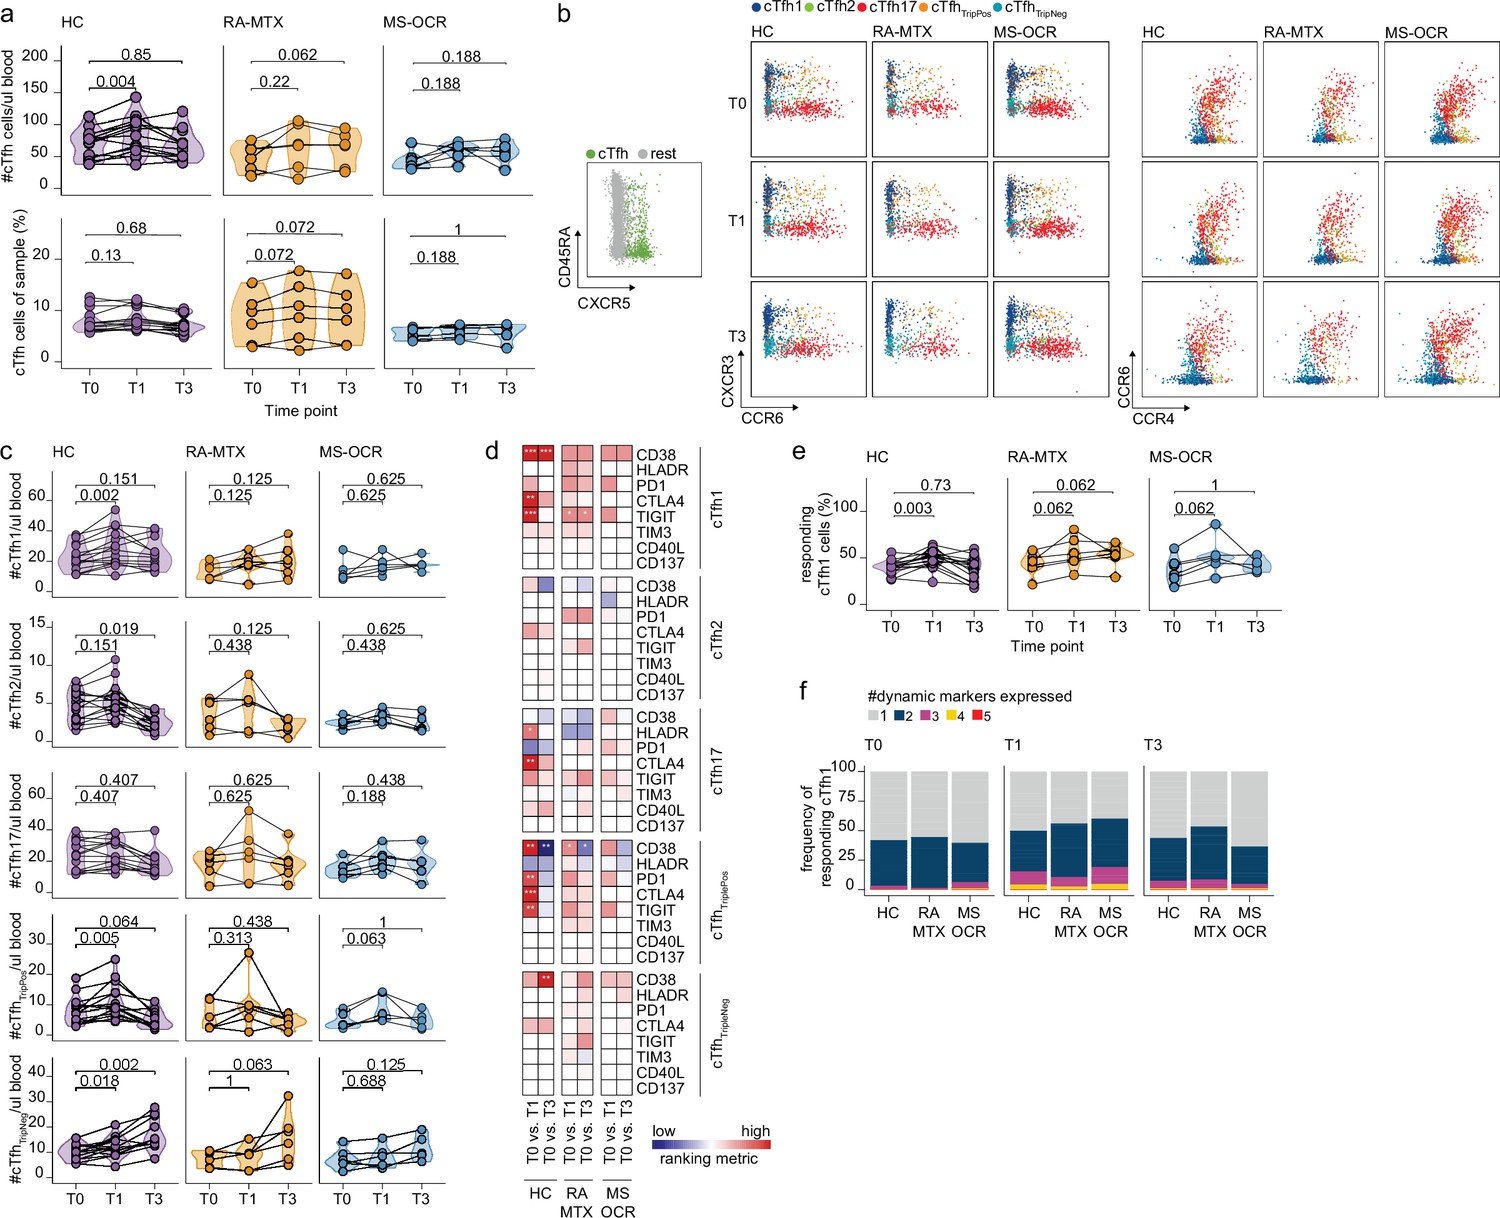
(a) Count per µl of blood (top) and frequency (bottom) of circulating CD4+ Tfh (cTfh) cells before (T0) and 7 days after first (T1) and second vaccination (T3). (b) Representative flow cytometry plots for the quantification of cTfh cell populations. Colors represent the populations that were identified by unbiased analysis. (c) Number of cTfh1, cTfh2, cTfh17, cTfhTriplePos, and cTfhTripNeg cells before (T0) and 7 days after first (T1) and second vaccination (T3). (d) Heatmap representation showing the overlap in up- and down-regulated dynamic markers expression in cTfh cell subpopulations subsequent first (T1) and second (T3) vaccination as compared to baseline (T0) in the different groups. Each dynamic marker is represented by a single row of colored squares, and each time point-disease group combination is represented by a single column. Color squares represent the dynamic marker expression that is reduced (blue), increased (red), or not affected (white). (e) Frequency of responding cTfh1 cells before (T0) and 7 days after first (T1) and second vaccination (T3). (f) Stacked bar charts representing average fractions of cTfh1 cell co-expressing different dynamic molecule combinations. Statistical significance was determined using Wilcoxon signed-rank test (a, c, d, and e) with Bonferroni-Holm multiple comparison correction.
Figure 3—figure supplement 1

Circulating CD4+ T follicular helper (cTfh) cells of severe acute respiratory syndrome coronavirus 2 (SARS-CoV-2) mRNA vaccinated SARS-CoV-2 experienced rheumatoid arthritis using methotrexate (RA-MTX) and multiple sclerosis using ocrelizumab (MS-OCR) patients.
(a–b) Count per µl of blood (top) and frequency (bottom) of CD4+ cTfh populations before (T0) and 7 days after first (T1) and second vaccination (T3) in SARS-CoV-2 experienced RA-MTX patients, MS-OCR patients, and healthy controls (HCs). (c) Frequency of responding cTfh2, cTfh17, cTfhTriplePos, and cTfhTripNeg cells before (T0) and 7 days after first (T1) and second vaccination (T3). (d) Stacked bar charts representing average fractions of Tfh cell subpopulations co-expressing different dynamic molecule combinations. Statistical significance was determined using a Wilcoxon signed-rank test (a, c) and a Mann-Whitney test (b) with Bonferroni-Holm multiple comparison correction.
Figure 4 with 1 supplement
Circulating CD4+ T helper (Th) cell responses of severe acute respiratory syndrome coronavirus 2 (SARS-CoV-2) mRNA vaccinated SARS-CoV-2 experienced rheumatoid arthritis using methotrexate (RA-MTX) and multiple sclerosis using ocrelizumab (MS-OCR) patients.
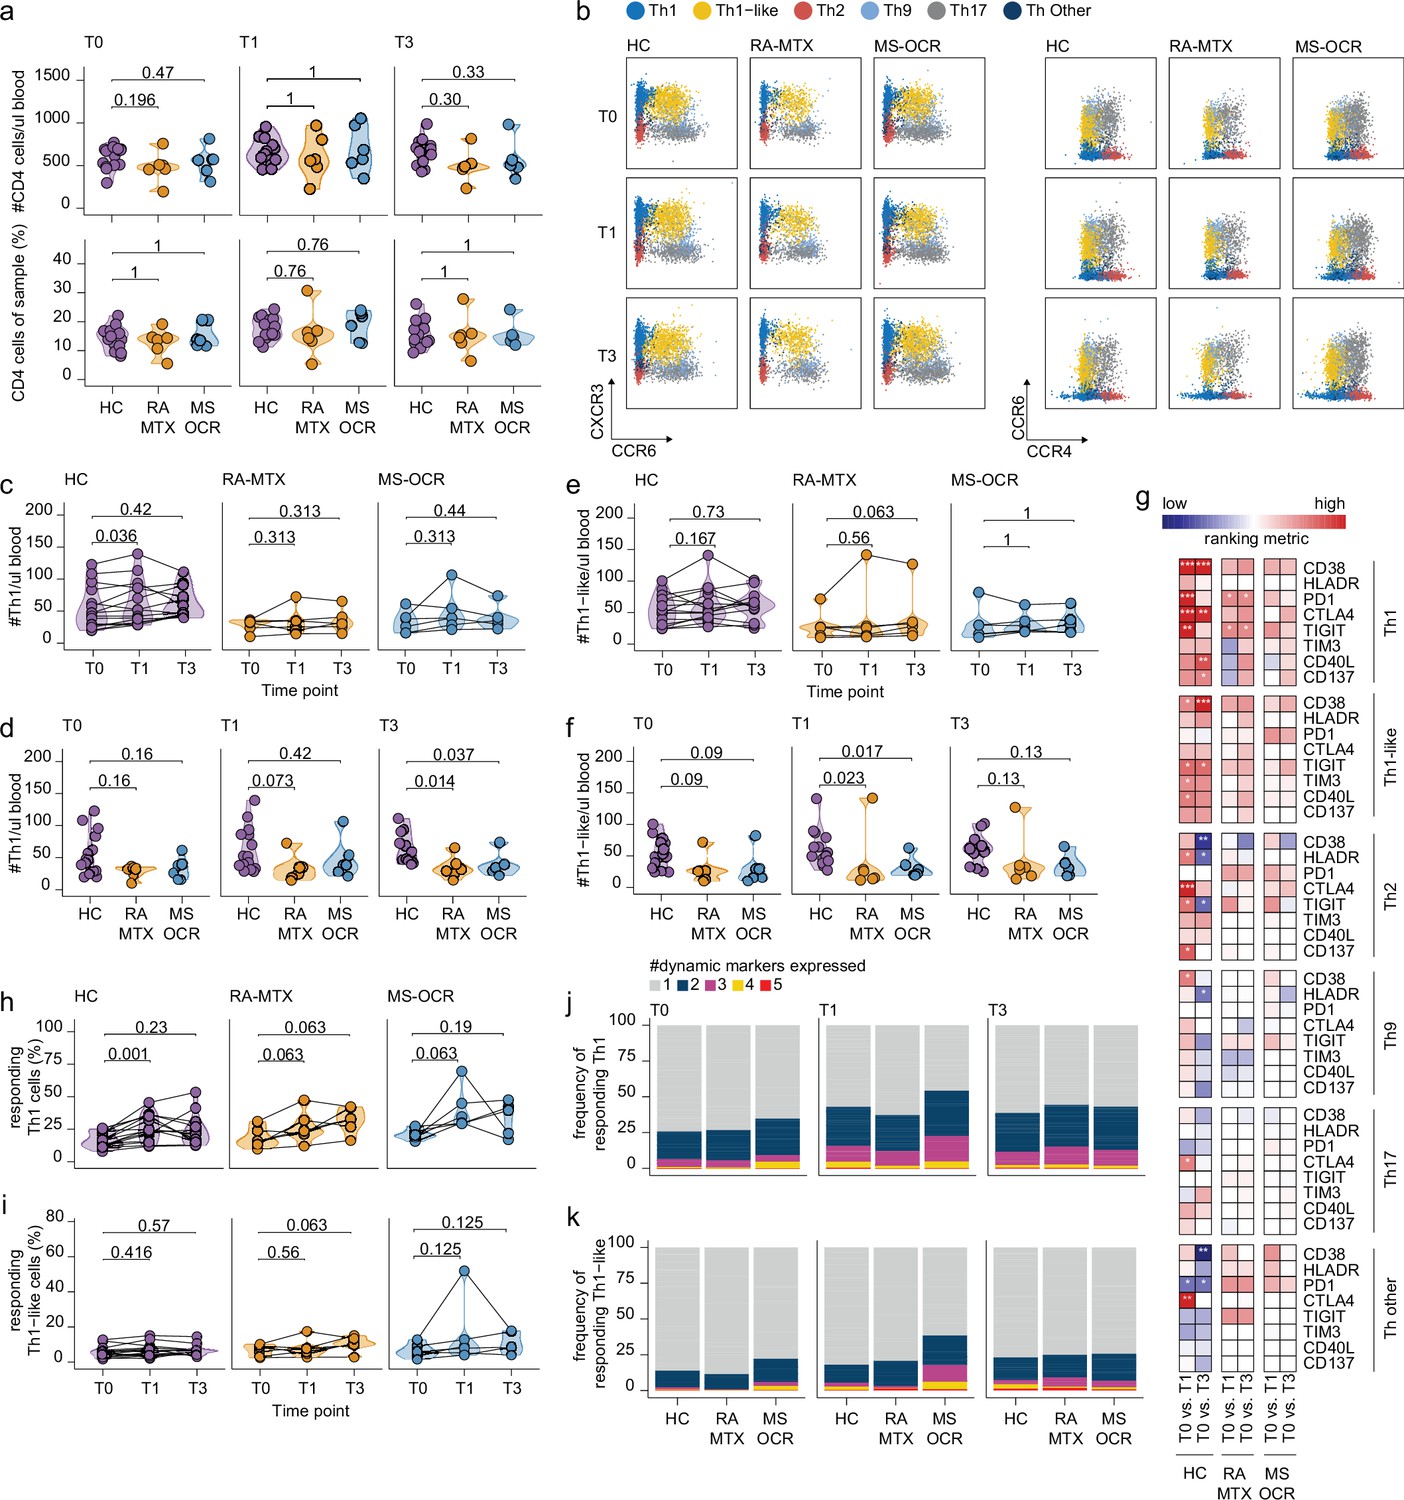
(a) Count per µl of blood and frequency of CD4+ T helper (Th) cells before (T0) and 7 days after first (T1) and second vaccination (T3). (b) Representative flow cytometry plots for the quantification of circulating Th cell populations. Colors represent the populations that were identified by unbiased analysis. (c–f) Count per µl of blood of Th1 (c and d) and Th1-like (e and f) cells before (T0) and 7 days after first (T1) and second vaccination (T3). (g) Heatmap representation showing the overlap in up- and down-regulated dynamic markers expression in Th cell subpopulations subsequent first (T1) and second (T3) vaccination as compared to baseline (T0) in the different groups. Each dynamic marker is represented by a single row of colored squares, and each time point-disease group combination is represented by a single column. Color squares represent the dynamic marker expression that is reduced (blue), increased (red), or not affected (white). (h–i) Frequency of responding Th1 (h) and Th-like cells (i) before (T0) and 7 days after first (T1) and second vaccination (T3). (j–k) Stacked bar charts representing average fractions of Th1 (j) and Th1-like (k) cells co-expressing different dynamic molecules combinations. Statistical significance was determined using a Mann-Whitney test (a, d, and f) and using a Wilcoxon signed-rank test (c, e, g–i) with Bonferroni-Holm multiple comparison correction.
Figure 4—figure supplement 1
Circulating CD4+ T helper (Th) cells of severe acute respiratory syndrome coronavirus 2 (SARS-CoV-2) mRNA vaccinated SARS-CoV-2 experienced rheumatoid arthritis using methotrexate (RA-MTX) and multiple sclerosis using ocrelizumab (MS-OCR) patients.
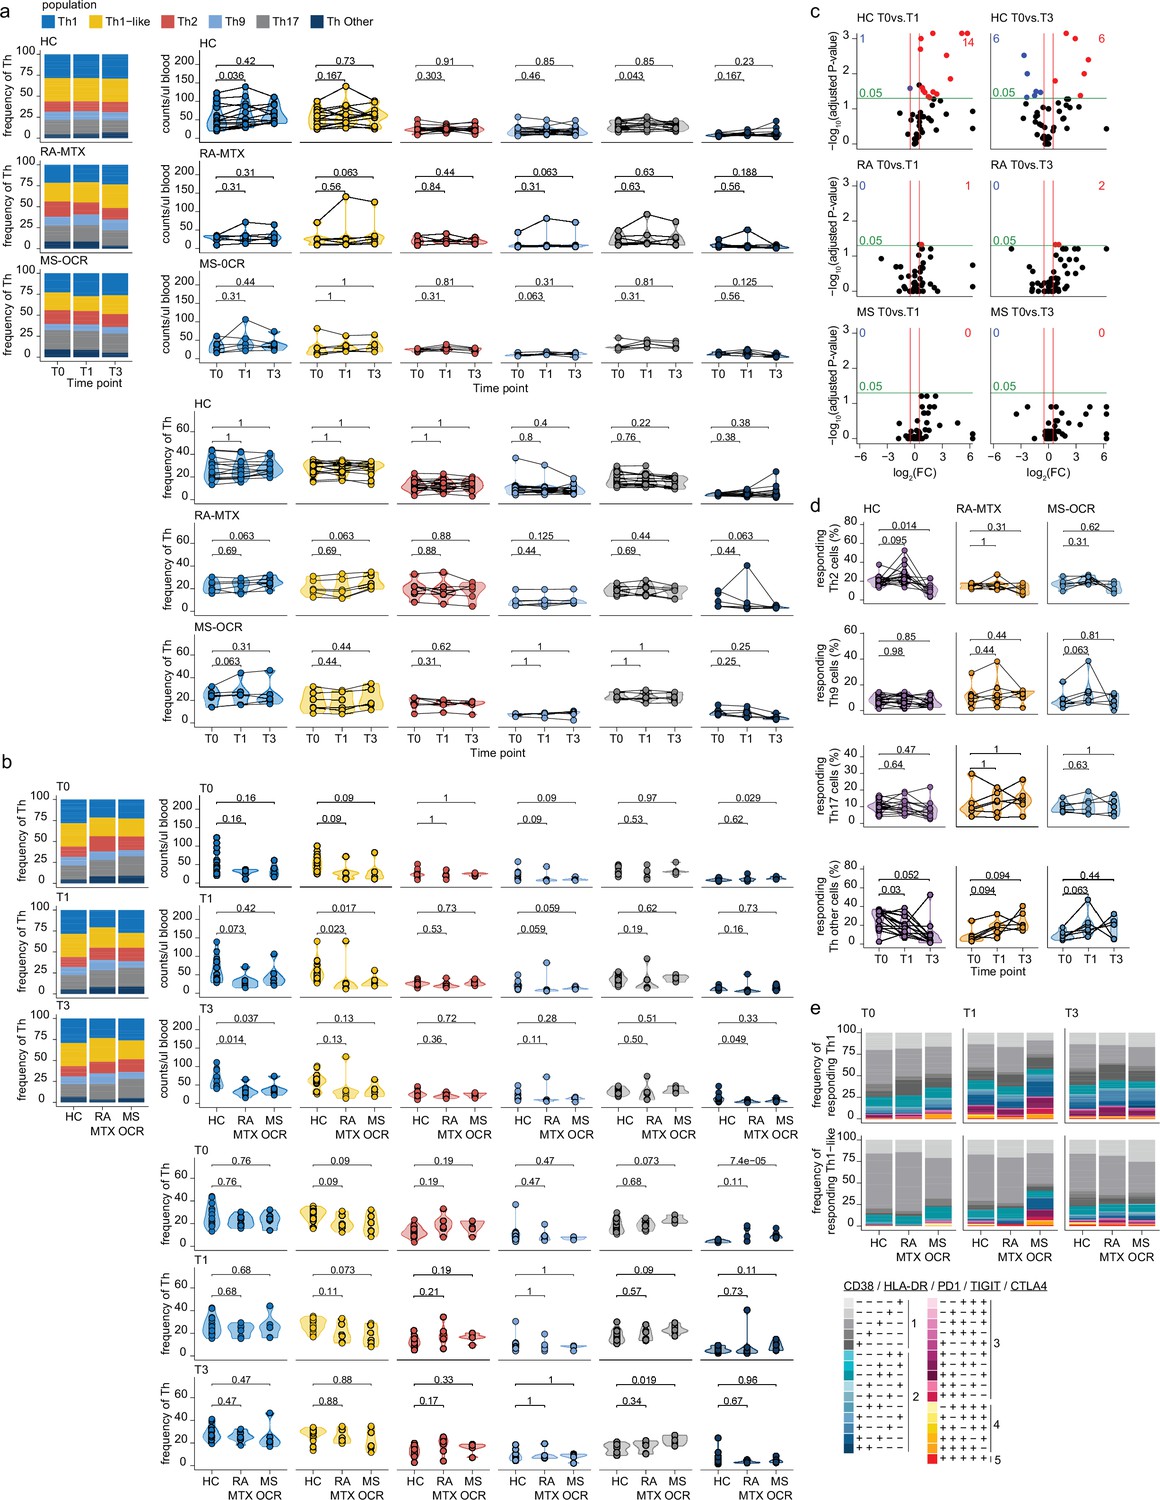
(a–b) Count per µl of blood (top) and frequency (bottom) of CD4+ Th populations before (T0) and 7 days after first (T1) and second vaccination (T3) in SARS-CoV-2 experienced RA-MTX patients, MS-OCR patients, and healthy controls (HCs). (c) Volcano plots representing fold-change (log2) on the x-axis and significance (adjusted p-value; log10) on the y-axis. Each dot represents dynamic marker expression by the circulating immune population after first (T1) and second (T2) vaccination as compared to baseline (T0) in the SARS-CoV-2 experienced HC, RA-MTX, and MS-OCR. (d) Frequency of responding Th2, Th9, Th17, and other Th cells before (T0) and 7 days after first (T1) and second vaccination (T3). (e) Stacked bar charts representing average fractions of Th cell subpopulations co-expressing different dynamic molecules combinations. Statistical significance was determined using a Wilcoxon signed-rank test (a, c, and d) and a Mann-Whitney test (b) with Bonferroni-Holm multiple comparison correction.
Figure 5 with 1 supplement
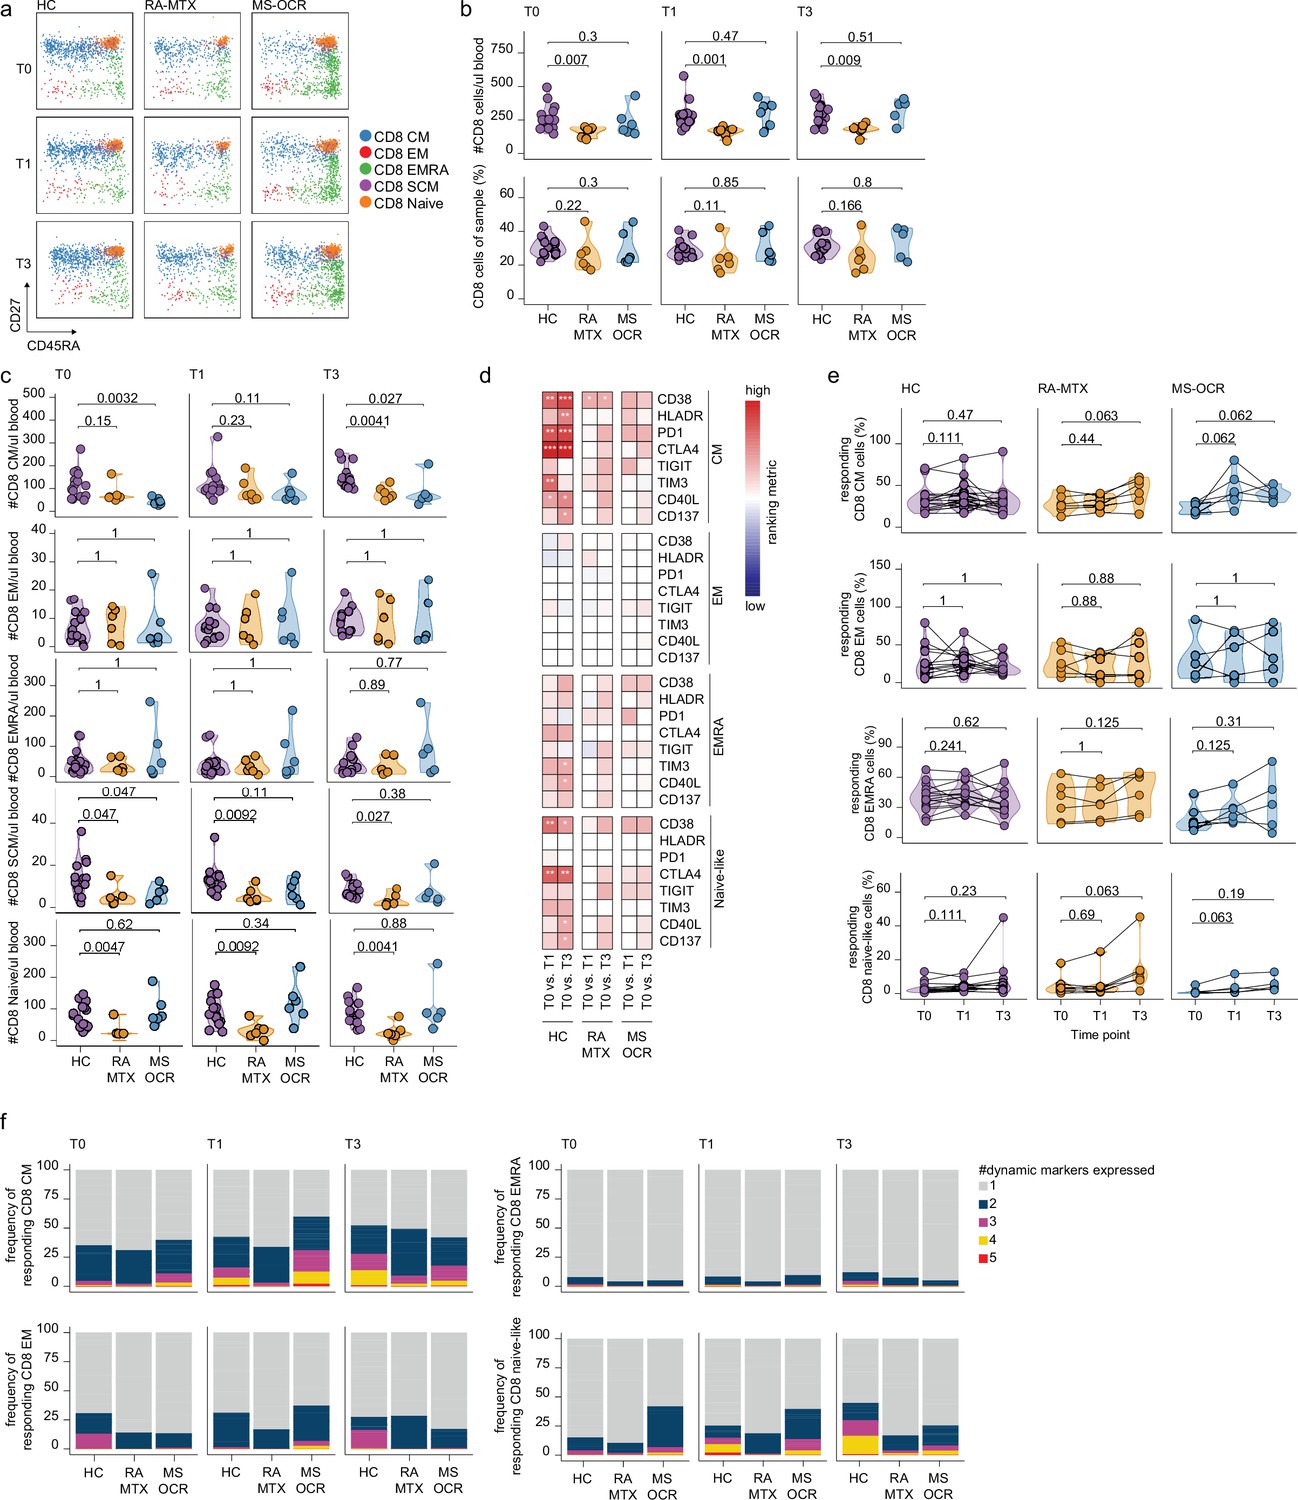
CD8+ T cell responses of severe acute respiratory syndrome coronavirus 2 (SARS-CoV-2) mRNA vaccinated SARS-CoV-2 experienced rheumatoid arthritis using methotrexate (RA-MTX) and multiple sclerosis using ocrelizumab (MS-OCR) patients.
(a) Representative flow cytometry plots for the quantification of circulating CD8+ T cell populations. Colors represent the populations that were identified by unbiased analysis. (b–c) Count per µl of blood and frequency of total CD8+ T cells (a) and central memory (CM), effector memory (EM), effector memory CD45RA+ (EMRA), stem cell memory (SCM), naïve CD8+ T cells (c) before (T0) and 7 days after first (T1) and second vaccination (T3) in SARS-CoV-2 experienced RA-MTX patients, MS-OCR patients, and healthy control (HC). (d) Heatmap representation showing dynamic marker expression by CD8+ T cell subpopulations that are affected by first (T1) and second (T3) vaccination as compared to baseline (T0) in the different groups. Each dynamic marker is represented by a single row of colored squares, and each time point-disease group combination is represented by a single column. Color squares represent the populations that are significantly reduced (blue) or increased (red) or not affected (white). (e) Frequency of CD8 T cell subpopulations before (T0) and 7 days after first (T1) and second vaccination (T3). (f) Stacked bar charts representing average fractions of CD8 T cell subpopulations co-expressing different dynamic molecules combinations. Statistical significance was determined using a Mann-Whitney test (b and c) and using a Wilcoxon signed-rank test (d-e) with Bonferroni-Holm multiple comparison correction.
Figure 5—figure supplement 1
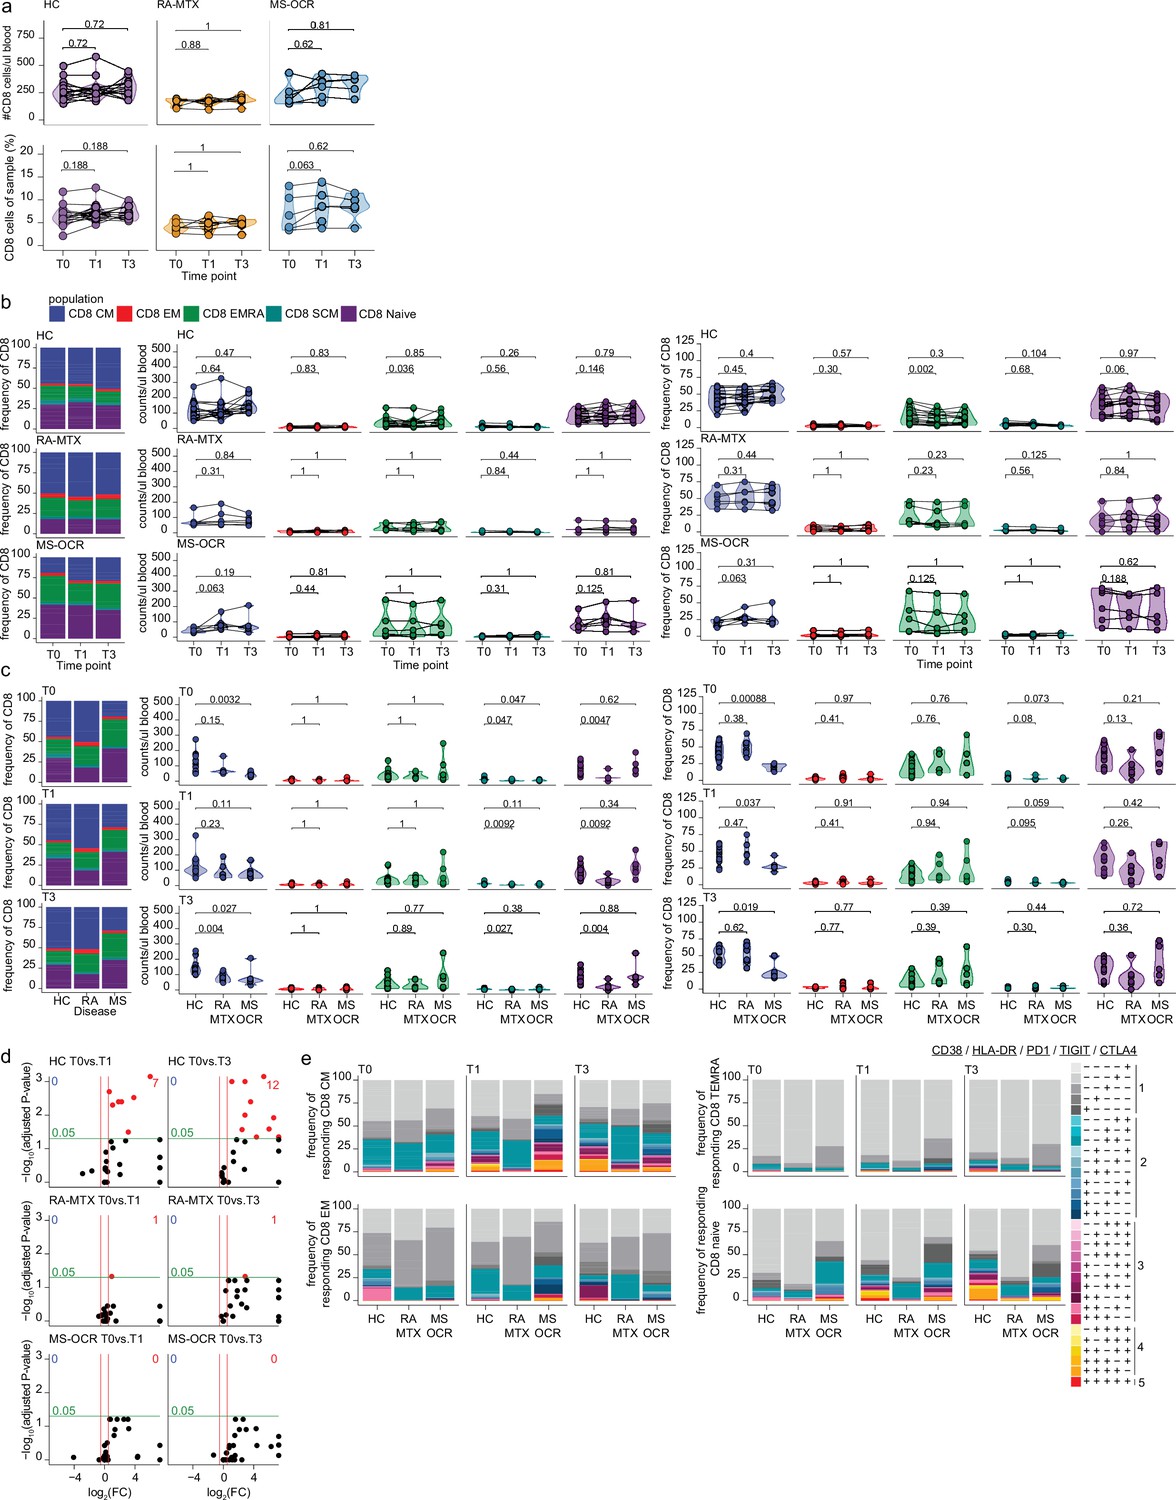
Circulating CD8+ T cells of severe acute respiratory syndrome coronavirus 2 (SARS-CoV-2) mRNA vaccinated SARS-CoV-2 experienced rheumatoid arthritis using methotrexate (RA-MTX) and multiple sclerosis using ocrelizumab (MS-OCR) patients.
(a–c) Count per µl of blood and frequency of total CD8+ T cell and CD8+ T cell subsets before (T0) and 7 days after first (T1) and second vaccination (T3) in SARS-CoV-2 experienced healthy controls (HCs), RA-MTX patients, MS-OCR patients, and HCs. (d) Volcano plots representing fold-change (log2) on the x-axis and significance (adjusted p-value; log10) on the y-axis. Each dot represents dynamic marker expression by CD8 T cell subsets after first (T1) and second (T3) vaccination as compared to baseline (T0) in HC, RA-MTX, and MS-OCR. (e) Stacked bar charts representing average fractions of CD8 T cell subpopulations co-expressing different dynamic molecules combinations. Statistical significance was determined using a Wilcoxon signed-rank test (a–b) and a Mann-Whitney test (c) with Bonferroni-Holm multiple comparison correction.
Additional files
-
Supplementary file 1
Characteristics of all participants.
Table showing characteristics of participants divided in to immune-mediated inflammatory disorder (IMID) patients with immunosuppressants and healthy controls.
- https://cdn.elifesciences.org/articles/77969/elife-77969-supp1-v2.docx
-
Supplementary file 2
Whole blood immunophenotyping and CD4 subtyping antibody panels.
- https://cdn.elifesciences.org/articles/77969/elife-77969-supp2-v2.docx
-
Transparent reporting form
- https://cdn.elifesciences.org/articles/77969/elife-77969-transrepform1-v2.docx
Download links
A two-part list of links to download the article, or parts of the article, in various formats.
Downloads (link to download the article as PDF)
Open citations (links to open the citations from this article in various online reference manager services)
Cite this article (links to download the citations from this article in formats compatible with various reference manager tools)
Immune dynamics in SARS-CoV-2 experienced immunosuppressed rheumatoid arthritis or multiple sclerosis patients vaccinated with mRNA-1273
eLife 11:e77969.
https://doi.org/10.7554/eLife.77969


