Macroscopic control of cell electrophysiology through ion channel expression
- Centro de Biotecnologıa y Genomica de Plantas (Universidad Politecnica de Madrid – Instituto Nacional de Investigacion y Tecnologıa Agraria y Alimentaria), Spain
Figures
Figure 1 with 5 supplements
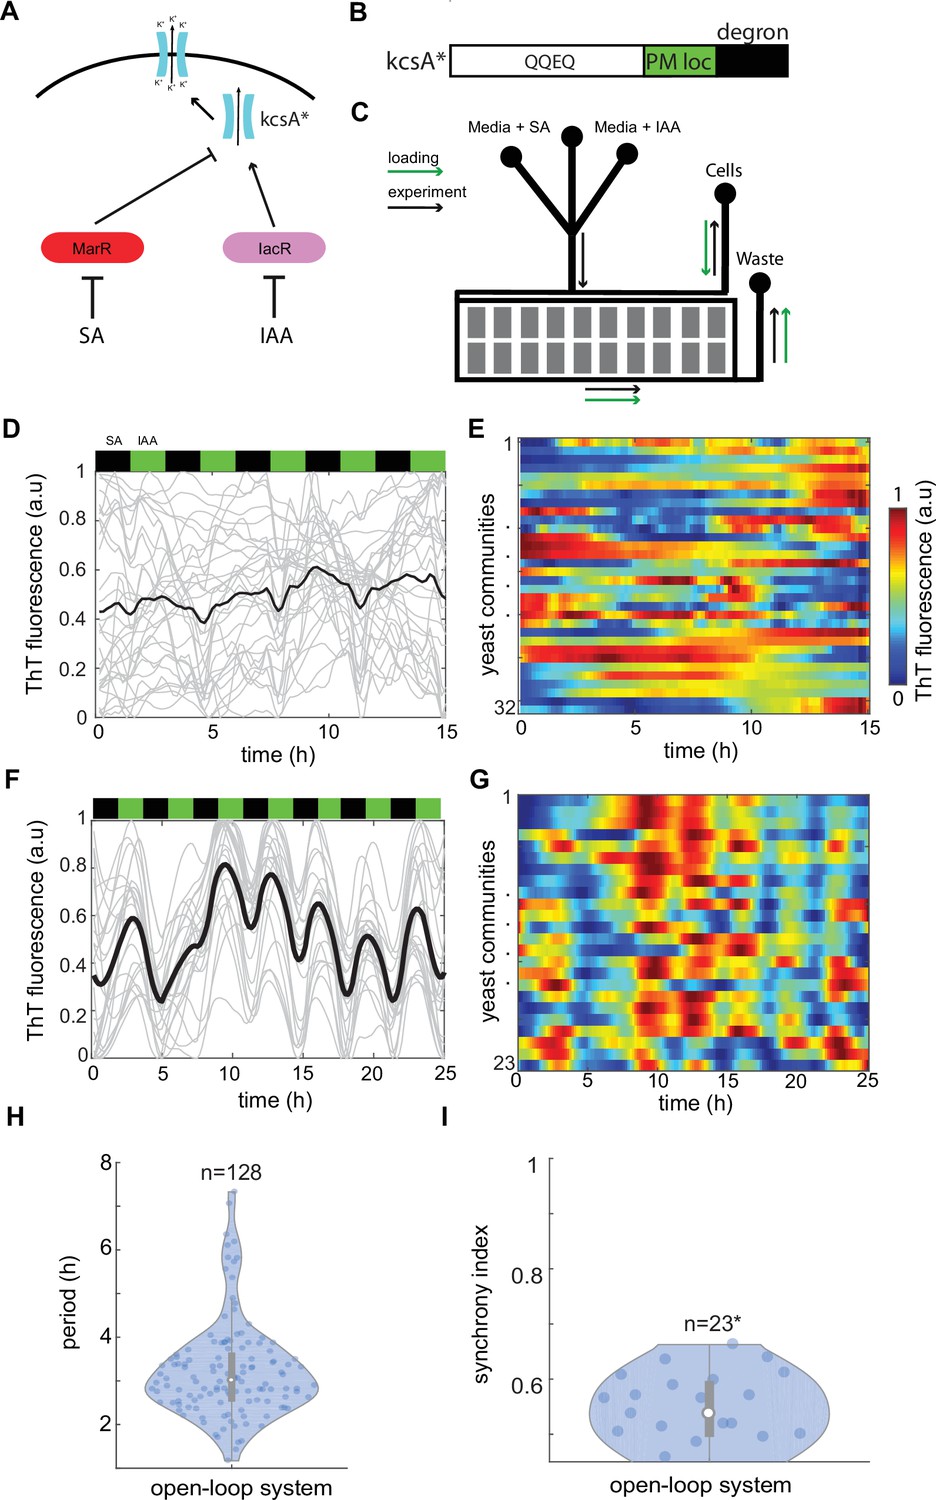
Control of ion channel expression through open-loop circuit.
(A) Schematic of open-loop system driving expression of constitutively open KcsA* bacterial potassium channel. Activator IacR and repressor MarR (tagged with ODC degron; Takeuchi et al., 2008) are induced by galactose and repressed by auxin and salicylate, respectively (Pérez-García et al., 2021). (B) KcsA* contains plasma membrane localization (PM loc, green) and c-terminus mouse ODC degron (degron, black) sequences. (C) Schematic of microfluidic device used in the study. Flow channels widths were 120 μm for in the mixer module and 500 μm in main channels. The approximate height of channels was 25 μm. Cell traps had 500 × 500 μm size and height of approximately 7 μm. Loading direction is marked with green arrows, while anticipated flow in the experiment with black arrows. Time traces (D) and heat map (E) of Thioflavin T (ThT) fluorescence in control yeast strain do not show any organized features under 3-hr periodic phytohormone stimuli. (F–I) ThT fluorescence changes in the open-loop circuit (A) under 3-hr periodic phytohormone stimuli show distinct fluctuations (F, G), yet broad period distribution (H) and low synchronicity of ~50% (I). Periods of peaks were measured for all measured trapping regions without averaging as shown in (H). (I) Synchrony index is measured for all n = 23 trapping regions (communities) each containing ~10,000 yeast cells. Positions of phytohormone stimuli are shown with black (SA) and green (IAA) boxes above the time traces. Each technical experiment has been repeated at least two times with similar results. Violin plots represent medians (white dots), interquartile zones (gray bars) and 95% confidence levels (solid gray line).
-
Figure 1—source data 1
Source data for Figure 1H, I.
- https://cdn.elifesciences.org/articles/78075/elife-78075-fig1-data1-v2.xlsx
Figure 1—figure supplement 1
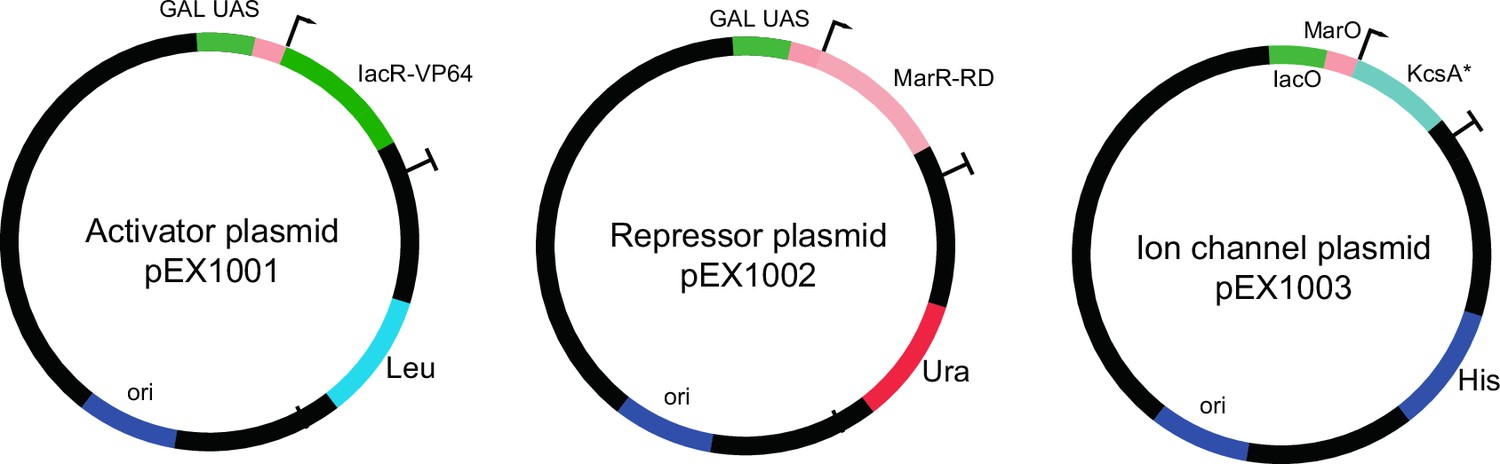
The plasmids used for open-loop circuit.
Galactose-inducible activator (IacR) and repressor (MarR) constructs are shown. The potassium channel (KcsA*) plasmid contains a synthetic minimal promoter with IacR and MarR operator sites.
Figure 1—figure supplement 2
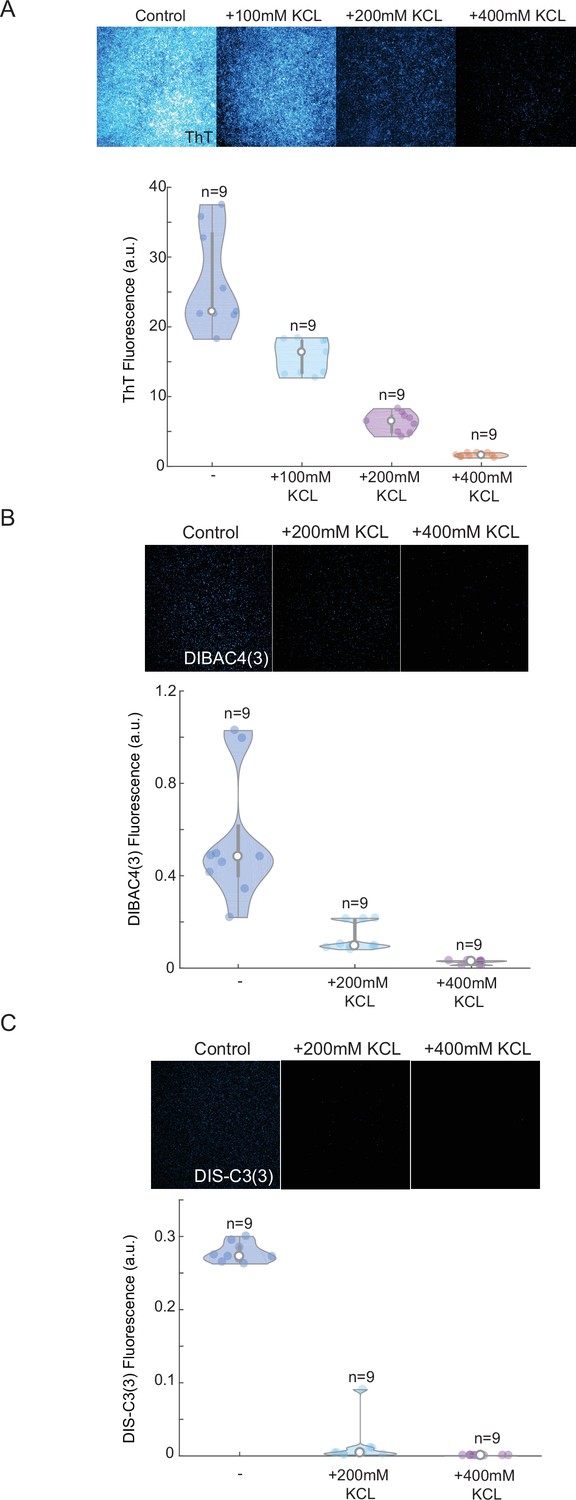
Thioflavin T (ThT) cationic dyes show linear response to external potassium applications and high stability compared to other plasma membrane potential (PMP) dyes.
Screenshots from microscopy imaging of yeast after 24 hr in different KCl concentrations, and quantification of mean ThT (A), DIBAC4(3) (B), and Dis-C3(3) (C) fluorescence (upper panels) for independent biological replicates (n = 9). Note, a near-linear drop in ThT fluorescence after excessive amounts of potassium have been applied. Other two commonly used PMP dyes show low signal after 24 hr (low stability) and more exponential decaying trend (lower dynamic range). Each experiment has been repeated at least two times with similar results. Violin plots represent medians (white dots), interquartile zones (gray bars) and 95% confidence levels (solid gray line).
-
Figure 1—figure supplement 2—source data 1
Source data for Figure 1—figure supplement 2A–C.
- https://cdn.elifesciences.org/articles/78075/elife-78075-fig1-figsupp2-data1-v2.xlsx
Figure 1—figure supplement 3
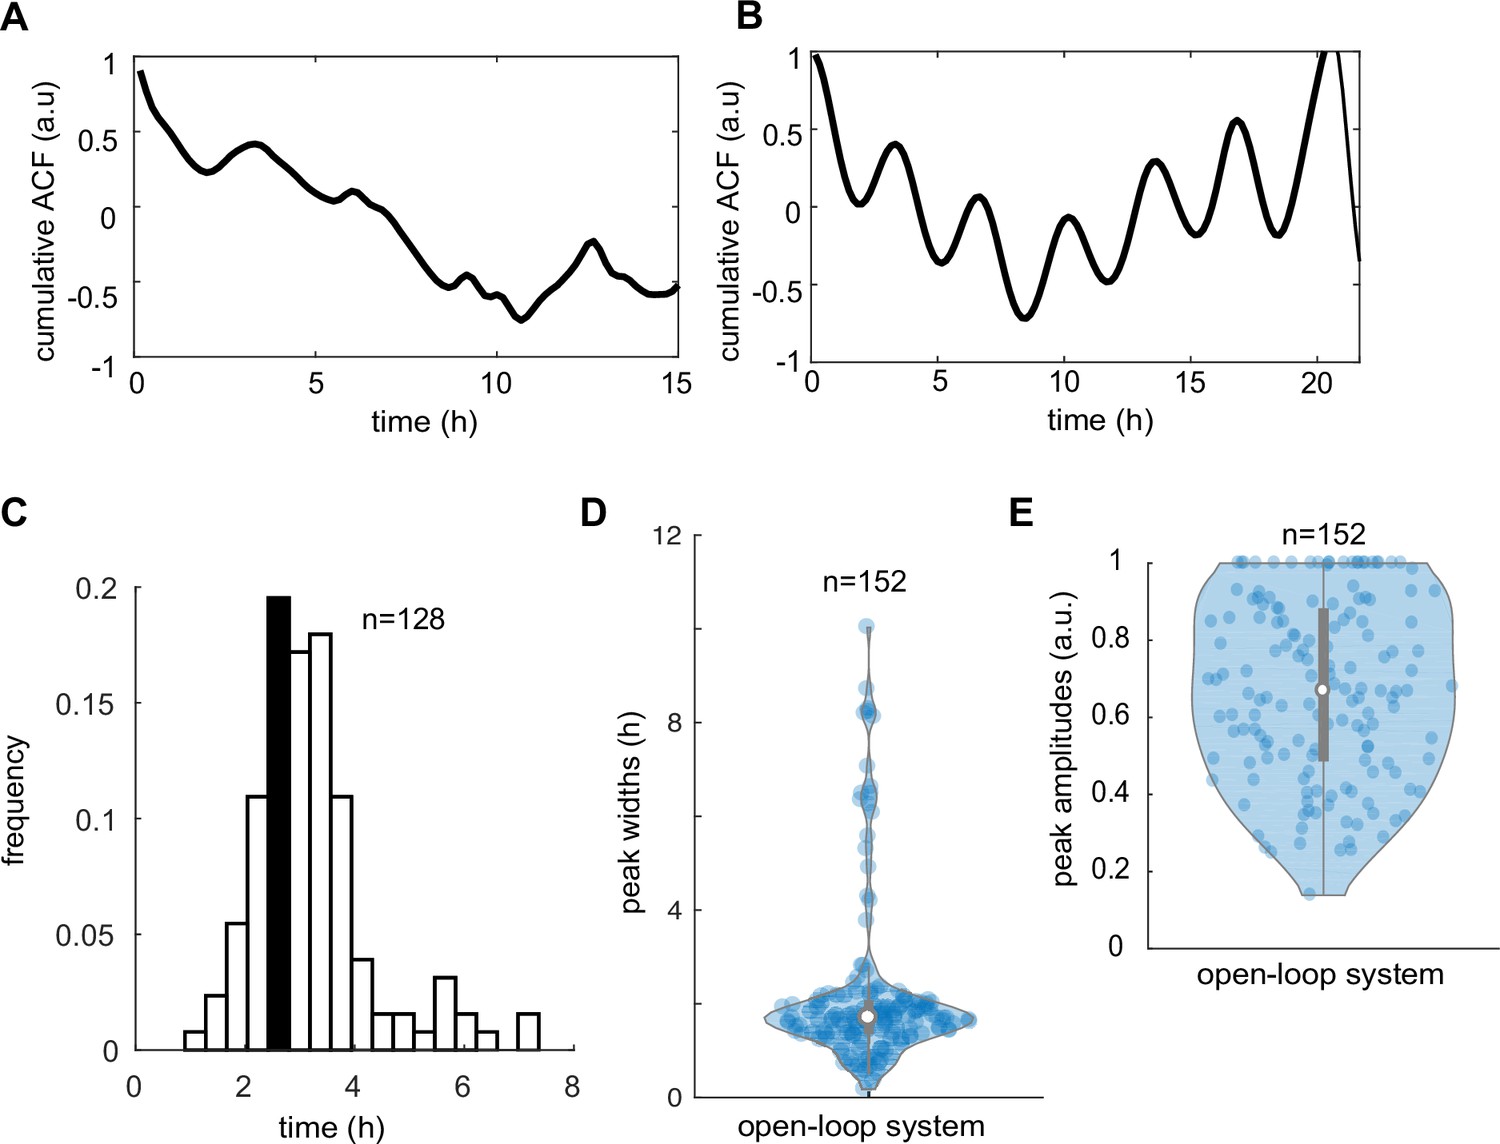
Autocorrelation and peak analysis of Thioflavin T (ThT) traces in control and open-loop system.
(A) Cumulative autocorrelation of ThT traces in control strain averaged across n = 33 (yeast communities) trapping regions show noisy, non-synchronized pattern. (B) Weak autocorrelation of ThT traces in the open-loop IacR–MarR circuit (n = 23 yeast communities). Broad period distribution (C), measured peak widths (D), and peak amplitudes (E) in the cells carrying the open-loop circuit. Violin plots represent medians (white dots), interquartile zones (gray bars) and 95% confidence levels (solid gray line).
-
Figure 1—figure supplement 3—source data 1
Source data for Figure 1—figure supplement 3C–E.
- https://cdn.elifesciences.org/articles/78075/elife-78075-fig1-figsupp3-data1-v2.xlsx
Figure 1—video 1
The absence of Thioflavin T (ThT) oscillations in the control strain.
Related to Figure 1D. Left panel, differential interference contrast (DIC), middle panel, ThT (cyan), and right panel, ThT color coded in heat map colors (blue [low signal], red [high signal]) of the sampled yeast colony grow in microfluidics device with 3-hr cycles of phytohormone stimuli.
Figure 1—video 2
Weakly coupled Thioflavin T (ThT) oscillations in the strain integrating the open-loop synthetic circuit.
Related to Figure 1F. Left panel, differential interference contrast (DIC), middle panel, ThT (cyan), and right panel, ThT color coded in heat map colors (blue [low signal], red [high signal]) of the sampled yeast colony grow in microfluidics device with 3-hr cycles of phytohormone stimuli.
Figure 2 with 9 supplements

A synthetic dual-feedback circuit coordinates ion channel expression in yeast communities.
(A) Schematic of dual-feedback circuit controlling downstream expression of bacterial potassium channel KcsA*. All components of the system are controlled by the same promoter to allow integration of both positive and negative feedbacks. (B) Computer model simulations of a synthetic dual-feedback circuit in the excitable regime. (C) Checking for a refractory period in dEGFP circuit reporter response under two long 12-hr pulses of auxin (green boxes). Time-lapse traces from microfluidic device are shown with the mean trend (black curve). Note inability of cell to respond to second pulse of IAA. (D) Computer model simulation of a circuit subjected to series of antithetic pulses of SA (black box inability) and IAA (green box). (E) Experimental time traces of dEGFP fluorescent marker under 2-hr antithetic pulses of SA and IAA. Note consistency of period between different yeast colonies and some level of variability in peak amplitudes. (F) Heat maps of time traces for n = 28 yeast communities reported simultaneously in the microfluidic device. (G) Cumulative autocorrelation trends for three different stimuli periods (2 hr [black], 1 hr [red], and 30 min [blue]). (H) Violin plot shows the consistency of dEGFP period for different stimuli shape and period. (I) Violin plot of synchrony index that was measured among all yeast communities (each containing ~10,000 cells) for different stimuli shape and period. Each experiment has been repeated at least two times with similar results. Violin plots represent medians (white dots), interquartile zones (gray bars) and 95% confidence levels (solid gray line).
-
Figure 2—source data 1
Source data for Figure 2H, I.
- https://cdn.elifesciences.org/articles/78075/elife-78075-fig2-data1-v2.xlsx
Figure 2—figure supplement 1
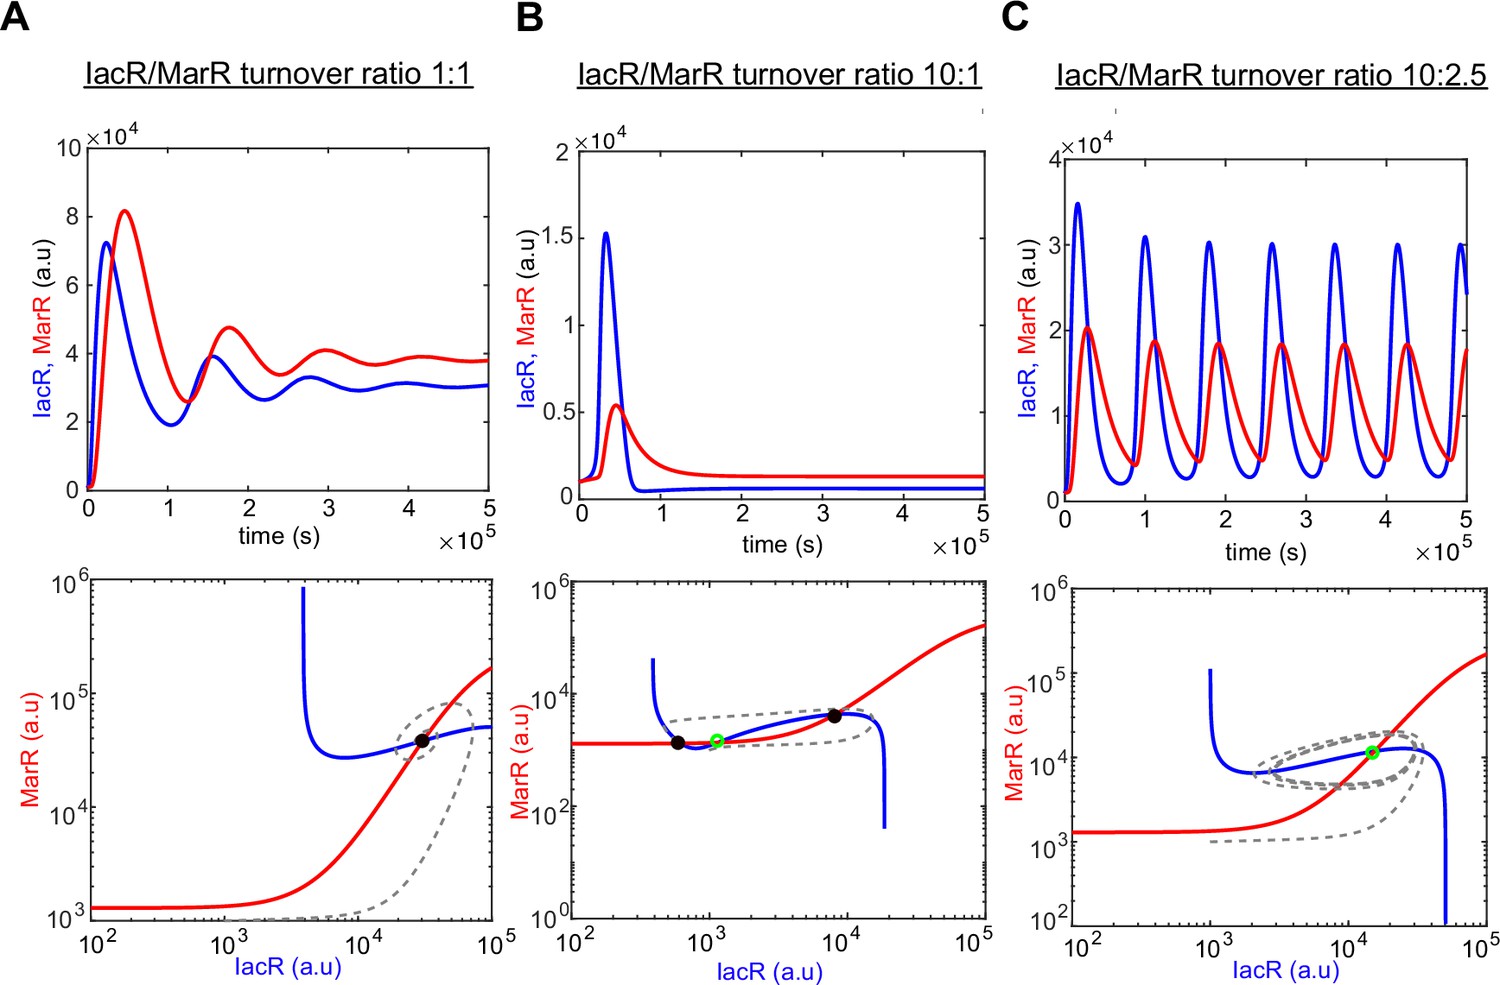
Computer model simulations of IacR–MarR feedback circuit.
Computer simulations of a dual-feedback circuit model (upper panel) and corresponding phase portraits with nullclines (lower panel) for the different ratio of IacR–MarR receptor turnover (1:1 (A), 10:1 (B), and 10:2 (C)). Stable states are marked with black-filled circles and unsteady states with a green empty circle, respectively. Note that a higher turnover ratio produces the transition into an excitable regime around the unstable state (B).
Figure 2—figure supplement 2
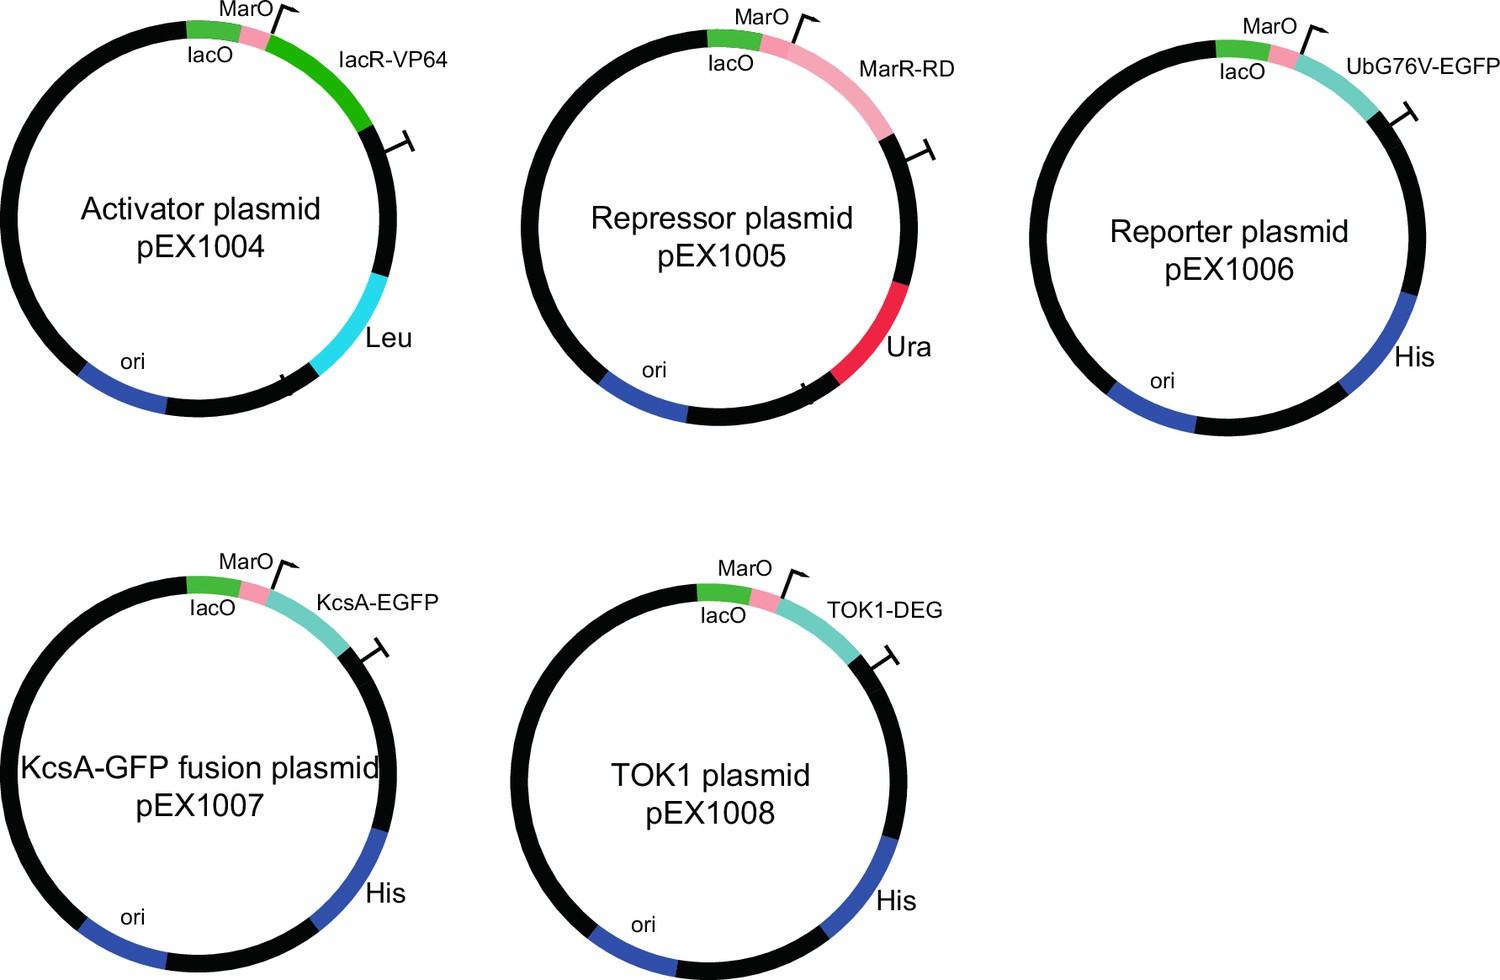
Plasmids used to construct dual-feedback circuit and engineered ion channels.
Activator (IacR), repressor (MarR), and destabilized reporter (dGFP) constructs are shown. All components are controlled from the same synthetic promoter containing IacR and MarR operator sites. The potassium channel (KcsA-EGFP) plasmid contains a synthetic minimal promoter with IacR and MarR operator sites driving c-terminal fusion of KcsA* with EGFP reporter. TOK1* channel was constructed by fusing degron to c-terminal of native S. cerevisiae TOK1 sequence under control of synthetic promoter with IacR and MarR operator sites.
Figure 2—figure supplement 3
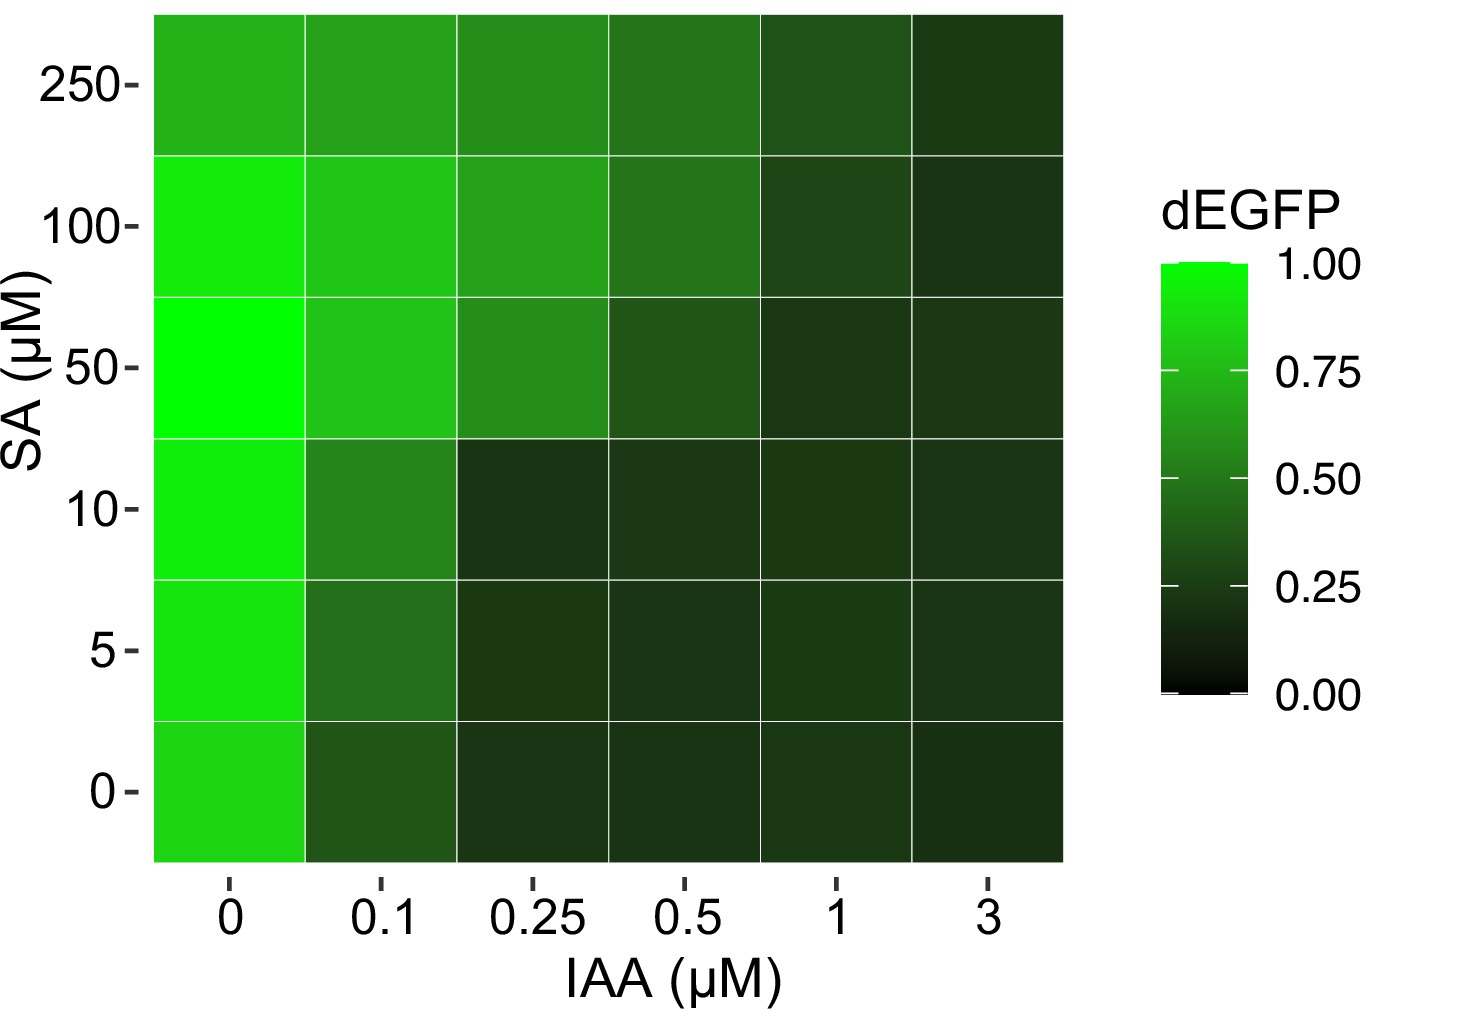
Excitable control of circuit output with the pair of phytohormones.
A heat map of circuit response recorder with dEGFP reporter (upper panel) to chemical gradients (lower panel). Note a precise control of circuit output is possible by using a dual phytohormone strategy. Mean measurements from three biological replicates (n = 3) are shown.
Figure 2—figure supplement 4
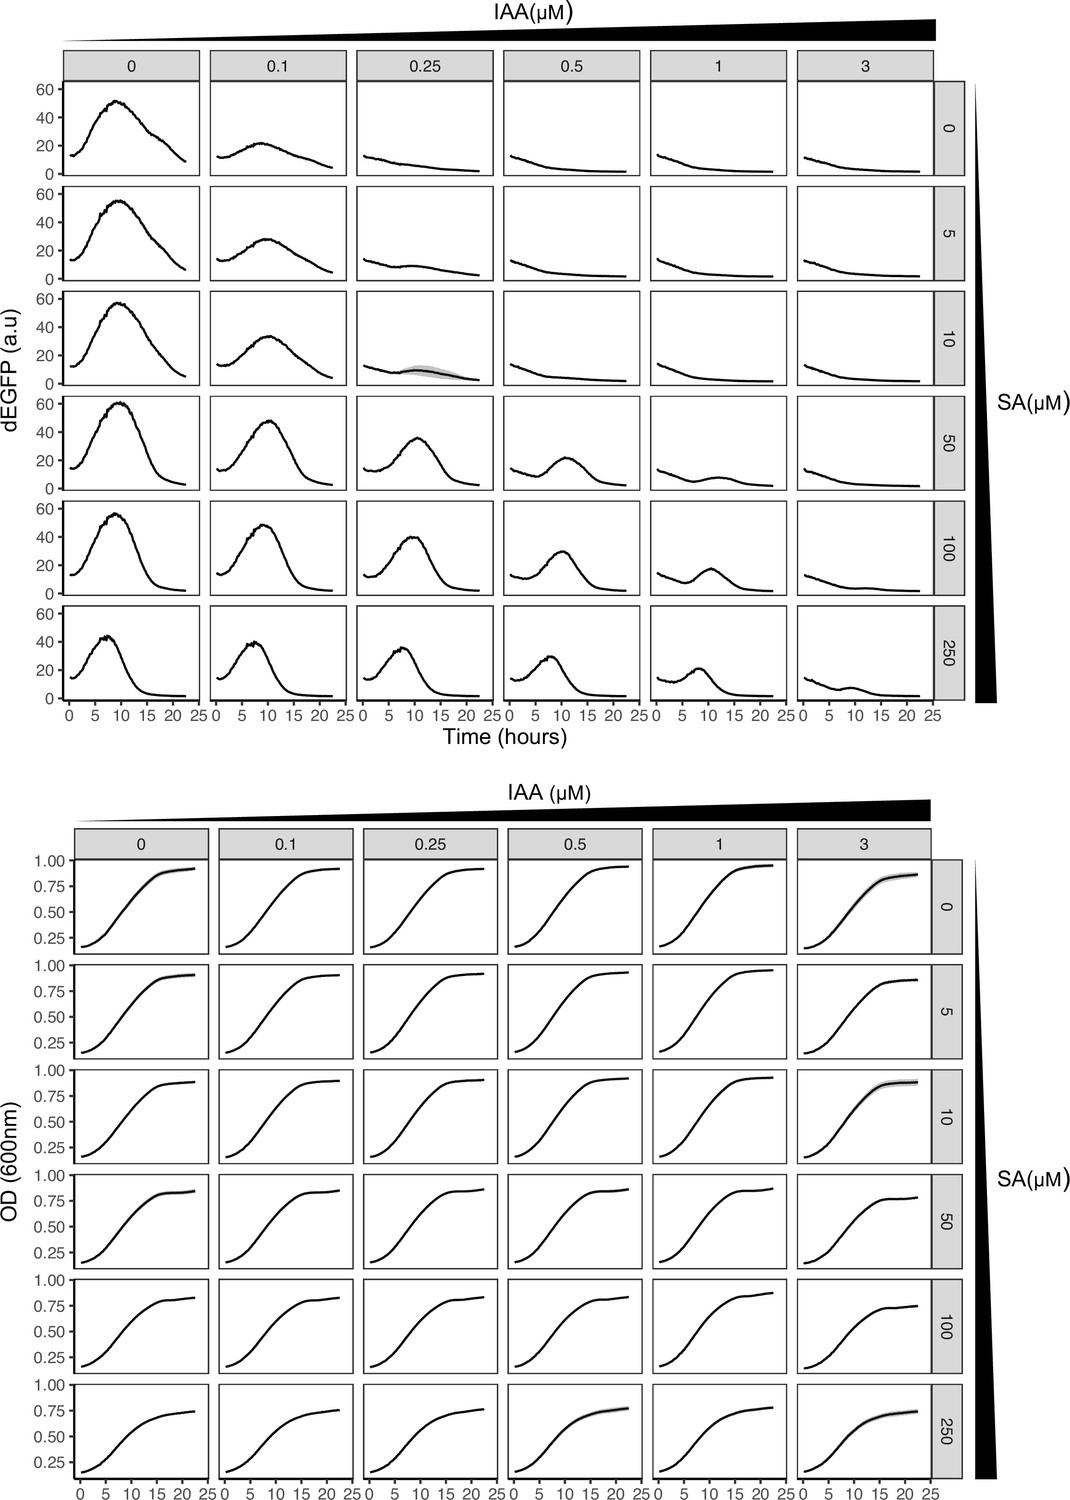
Time-lapse synthetic circuit characterization using high-throughput fluorescence assays.
dEGFP fluorescence normalized to OD600 (upper panel) and OD600 absorbance (lower panel) for 24-hr measurements using graded changes of phytohormones was used to analyze the excitable potential of the synthetic circuit. Mean measurements with variation (shaded regions) from three biological replicates (n = 3) are shown. Note transient pulse like response of circuit without cyclic hormone stimuli, indicative of putative excitability.
Figure 2—figure supplement 5
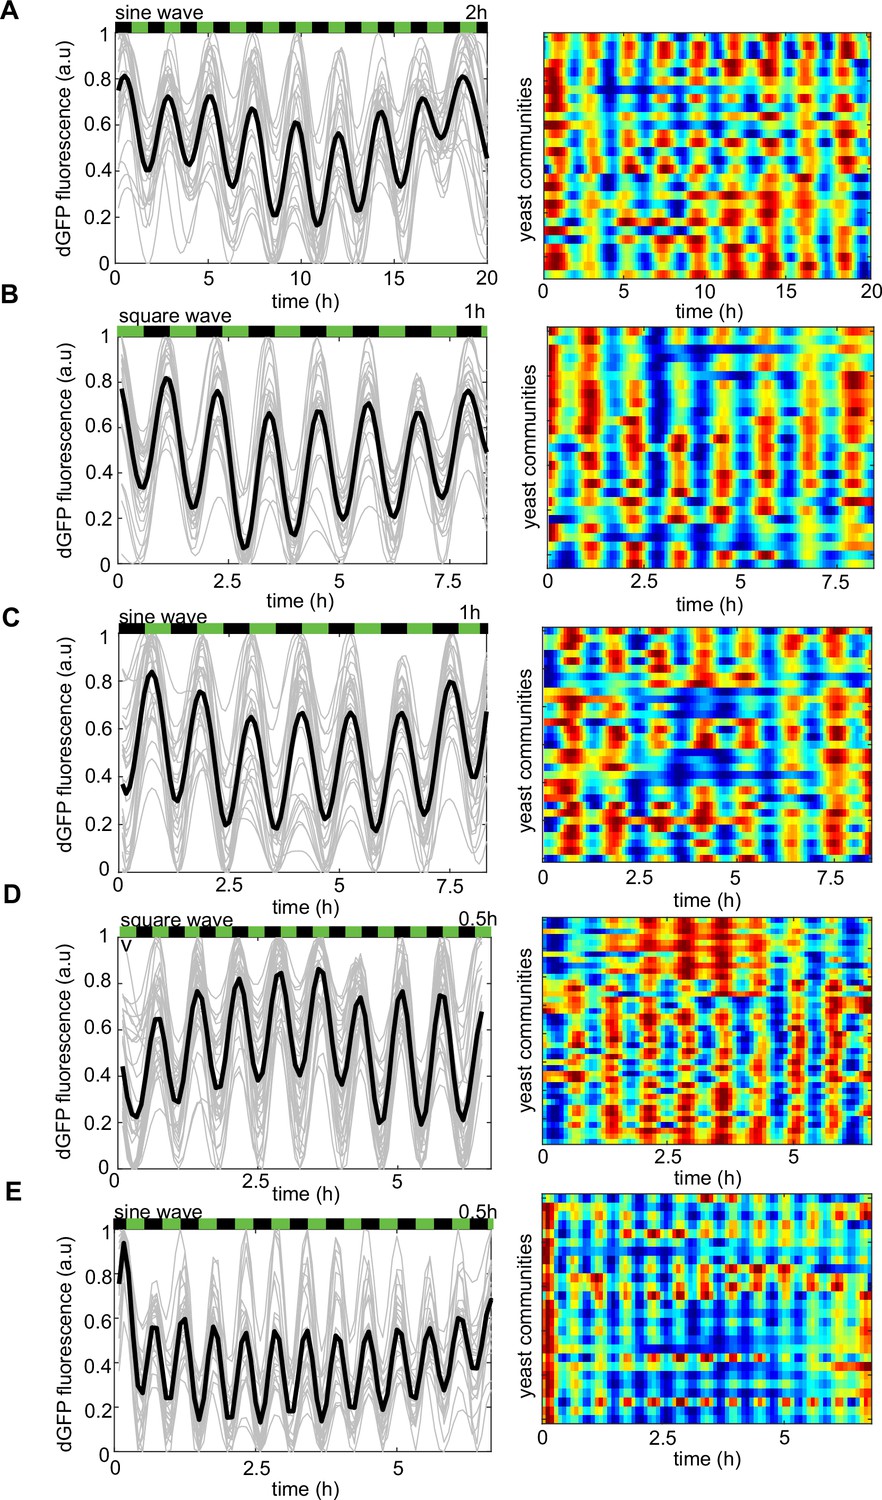
The frequency of phytohormone stimuli determines the dynamics of the reporter gene under different environmental drivers.
(A–E) Left panel, dEGFP time evolutions from all traps recorded in the microfluidic device. Right panel, the heat map of dEGFP fluorescence for each of the recorded trapping regions corresponds to time traces (left panel). (A) Periodic 2-hr phytohormone wave of sine shape, 1-hr periodic waves of square (B) and sine (C) shapes. Thirty minutes periodic wave of square (D) and sine (E) shapes, respectively. Note that the frequency of dEGFP firings mirrors exactly that of the chemical microenvironment. Color coding is as in Figure 2. Each experiment has been repeated at least two times with similar results.
Figure 2—figure supplement 6
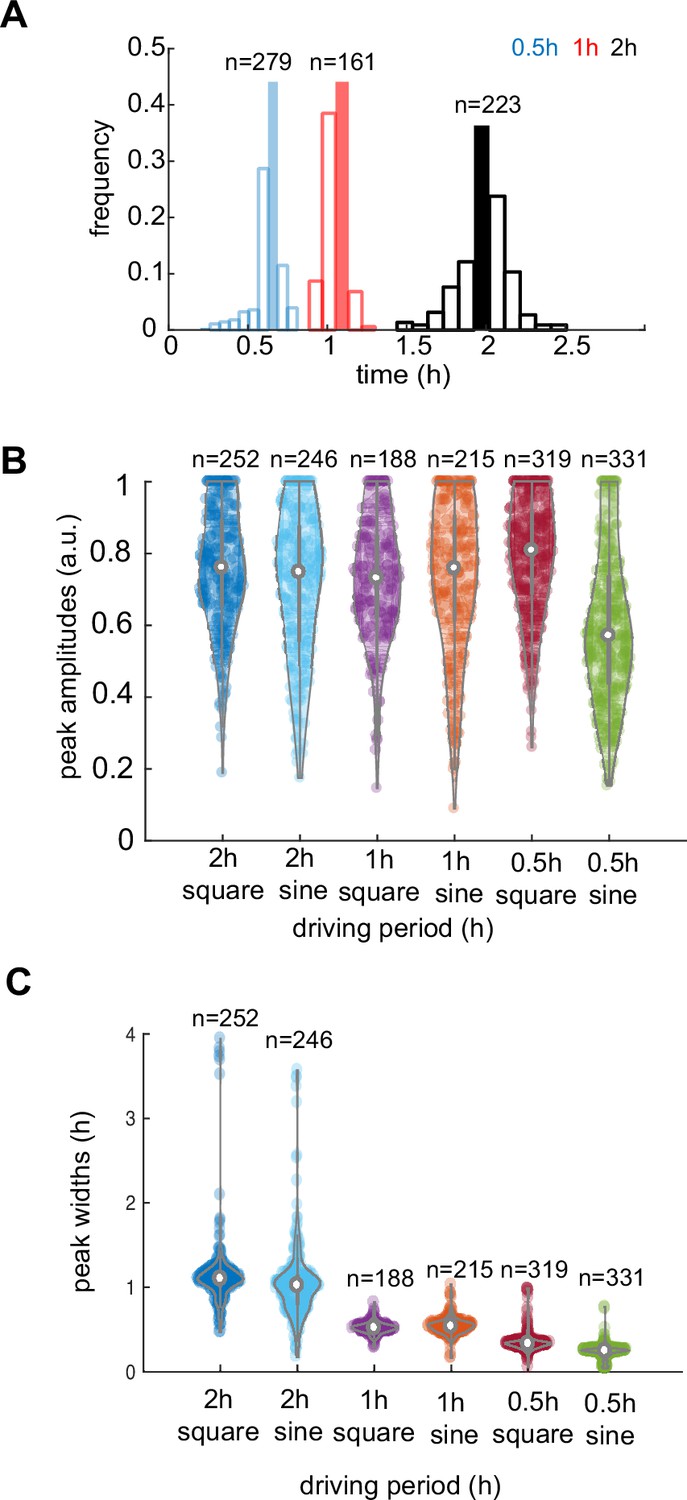
Analysis of response characteristics under different environments.
(A) A distribution of dGFP periods for three different frequencies of stimuli, as marked with corresponding colors. (B) Violin plot of peak amplitude distribution in all recorded yeast communities for different stimuli periods. (C) Peak widths variation decreases with higher frequencies of stimuli. Violin plots represent medians (white dots), interquartile zones (gray bars) and 95% confidence levels (solid gray line).
-
Figure 2—figure supplement 6—source data 1
Source data for Figure 2—figure supplement 6A–C.
- https://cdn.elifesciences.org/articles/78075/elife-78075-fig2-figsupp6-data1-v2.xlsx
Figure 2—figure supplement 7
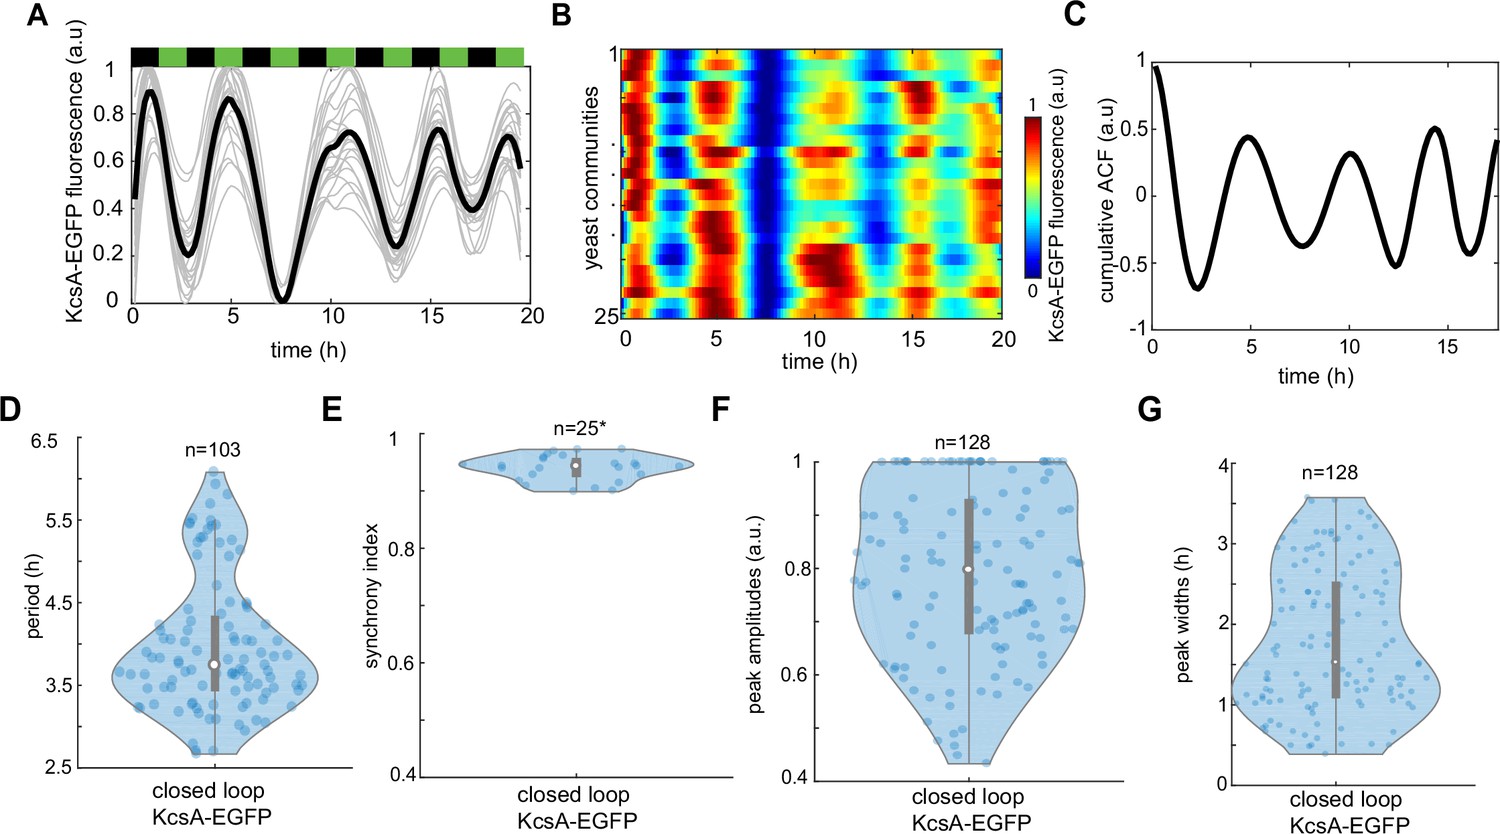
Tracking dynamics of KcsA* potassium channels under phytohormone rhythms.
(A) Time evolution of KcsA-EGFP reporter traces under indicated pulses of phytohormones (3-hr period). An average trace of n = 25 yeast communities is shown in black. (B) Kymograph (heat map) of KcsA-EGFP fluorescence across n = 25 yeast communities. (C) Cumulative autocorrelation of KcsA-EGFP signal for n = 25 yeast communities. (D) Period distribution of KcsA-EGFP marker. (E) Synchrony index measured across all recorded yeast communities. KcsA-EGFP peak amplitudes (F) and widths (G). Violin plots represent medians (white dots), interquartile zones (gray bars) and 95% confidence levels (solid gray line).
-
Figure 2—figure supplement 7—source data 1
Source data for Figure 2—figure supplement 7D–G.
- https://cdn.elifesciences.org/articles/78075/elife-78075-fig2-figsupp7-data1-v2.xlsx
Figure 2—video 1
Dual-feedback gene circuit shows coordinated oscillations of fluorescence marker.
Related to Figure 2E. Left panel, dfferential interference contrast (DIC), middle panel, dEGFP (cyan) and mCherry (cell marker), and right panel, dEGFP color coded in heat map colors (blue [low signal], red [high signal]) of the sampled yeast colony grow in microfluidics device with 2-hr cycles of phytohormone stimuli.
Figure 2—video 2
Dynamics of KcsA-EGFP fluorescent reporter in the dual-feedback circuit show coherent oscillations under 3-hour cycles of phytohormone stimuli related to Figure 2—figure supplement 7.
Left panel, differential interference contrast (DIC), middle panel, dEGFP (cyan) and mCherry (cell marker), and right panel, dEGFP color coded in heat map colors (blue [low signal], red [high signal]).
Figure 3 with 6 supplements
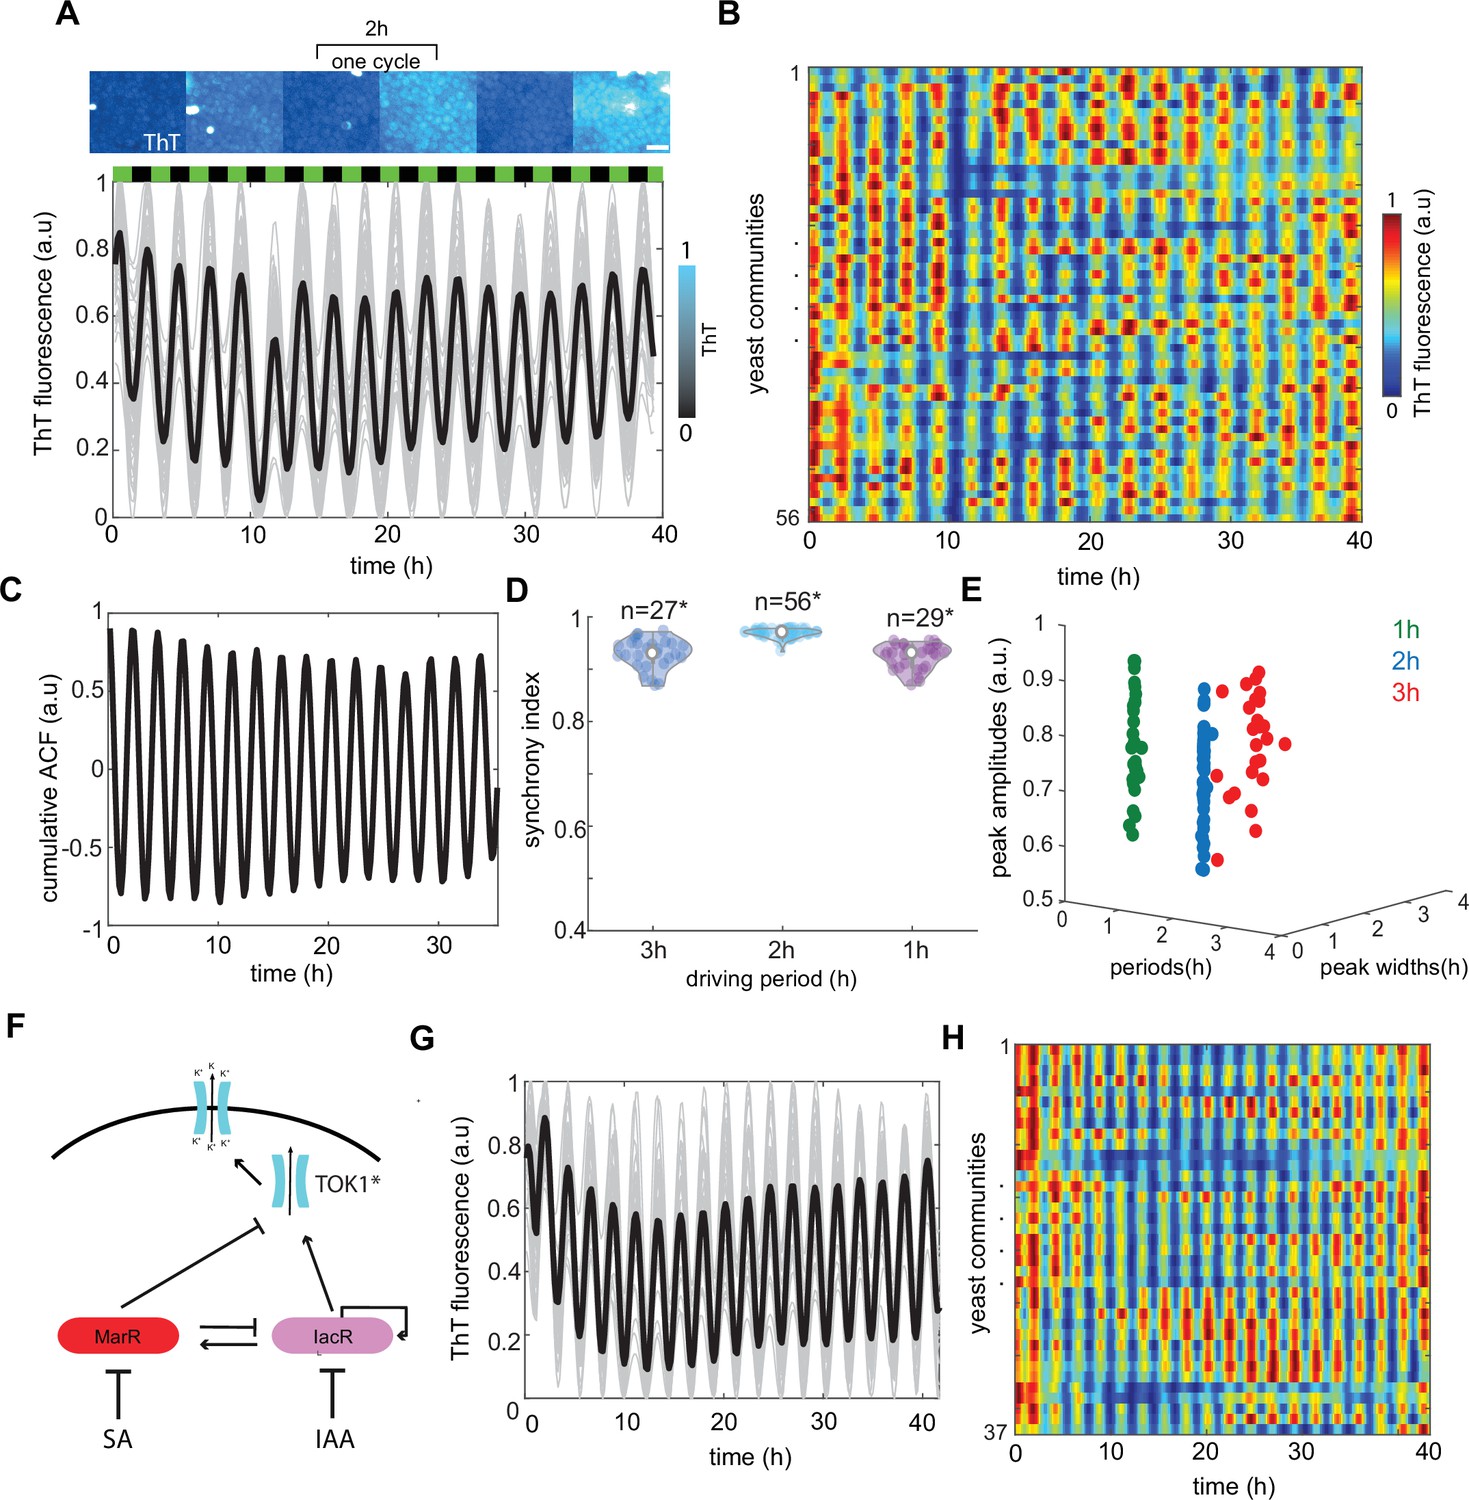
Global modulation of ion channel expression and plasma membrane potential (PMP) in yeast communities through phytohormones.
(A) Representative time traces of Thioflavin T (ThT) fluorescence per community (n = 56 yeast communities) under 2-hr hormone stimuli. Average trend is shown in black. SA and IAA peaks are shown as black and green boxes above the traces. Scale bar represents 20μm (B) Kymograph of ThT fluorescence equivalent to time traces (A) with color coded map. (C) Cumulative autocorrelation analysis for all n = 56 communities show clear periodic, synchronized ThT fluorescence changes across communities. (D) Synchrony index calculated for each of the communities for three different frequencies of phytohormone stimuli (1, 2, and 3 hr) show good agreement with autocorrelation analysis. (E) Variation in amplitudes of ThT fluorescence plotted against periods of ThT and ThT peak widths. (F) Schematic of dual-feedback circuit controlling the yeast potassium channel TOK1*. Time-lapse ThT fluorescence changes in TOK1* integrating synthetic circuit (G) and corresponding heat map (H). Violin plots represent medians (white dots), interquartile zones (gray bars) and 95% confidence levels (solid gray line).
-
Figure 3—source data 1
Source data for Figure 3D, E.
- https://cdn.elifesciences.org/articles/78075/elife-78075-fig3-data1-v2.xlsx
Figure 3—figure supplement 1
Characterization of synchronicity of Thioflavin T (ThT) fluorescence in dynamically changing environment.
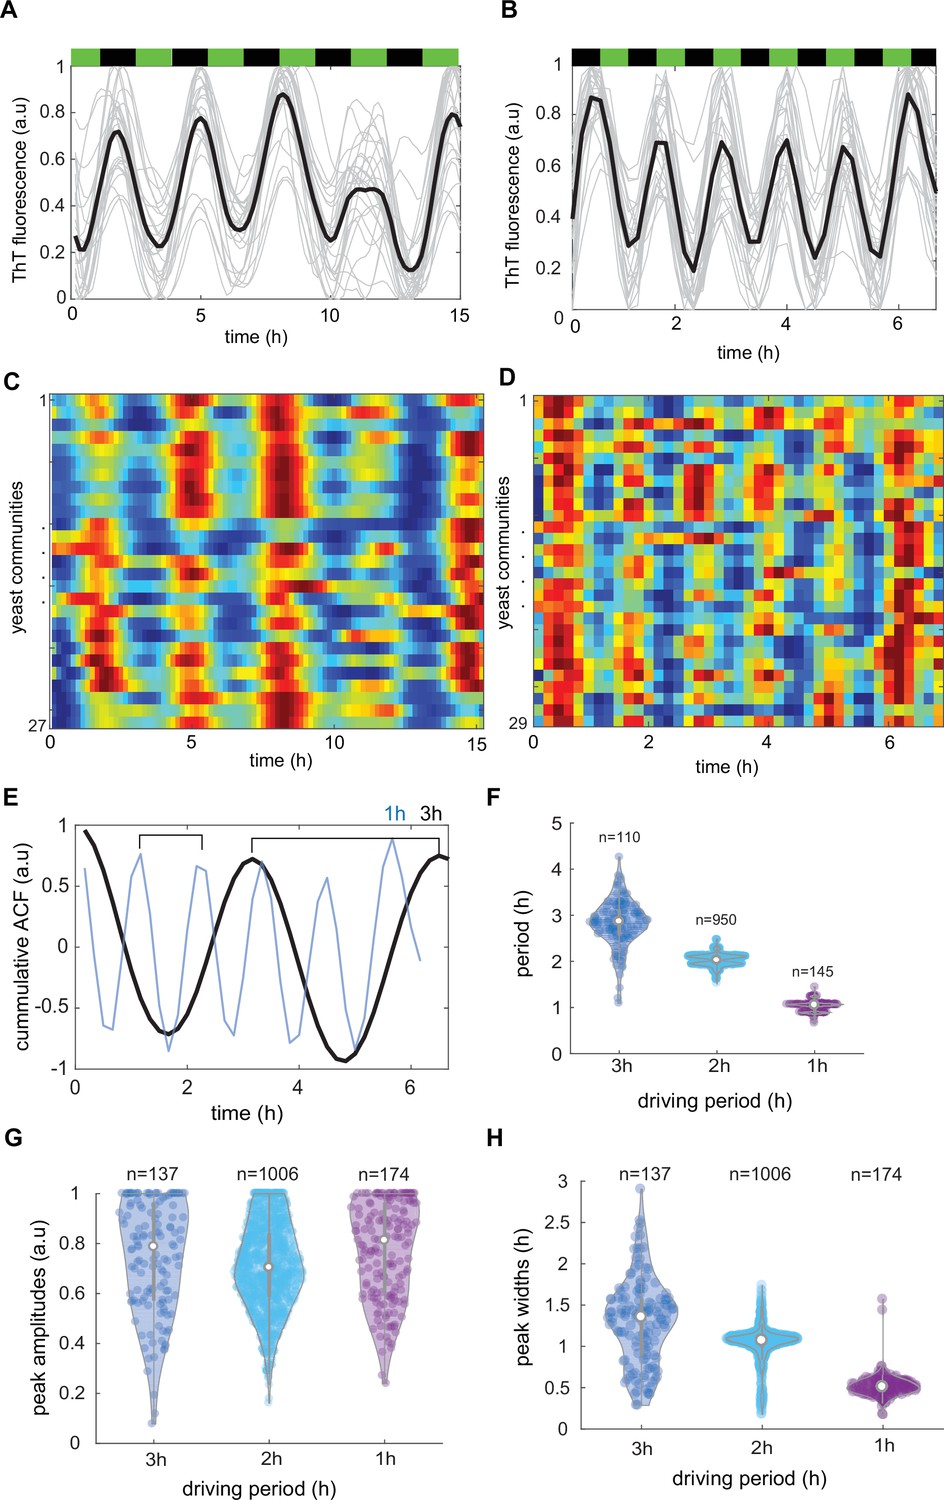
Time evolutions of ThT fluorescence across communities in 3 hr (A) and 1 hr (B) lasting phytohormone stimuli. Average traces are shown in black (C, D), kymographs related to (A) and (B) for n = 27 and n = 29 yeast communities, respectively. Color coding for ThT is as in Figure 3 (E) Autocorrelations analysis of cumulative trend across all measured communities for 3 hr (black line) and 1 hr (blue line) shows clear signs of synchronicity. (F) ThT fluorescence period as function of phytohormone period. ThT peak amplitudes (G) and widths (H) for three different driving periods. Violin plots represent medians (white dots), interquartile zones (gray bars) and 95% confidence levels (solid gray line).
-
Figure 3—figure supplement 1—source data 1
Source data for Figure 3—figure supplement 1F–H.
- https://cdn.elifesciences.org/articles/78075/elife-78075-fig3-figsupp1-data1-v2.xlsx
Figure 3—figure supplement 2
Synchronicity analysis of TOK1*-based circuit controlling plasma membrane potential (PMP) in yeast communities.
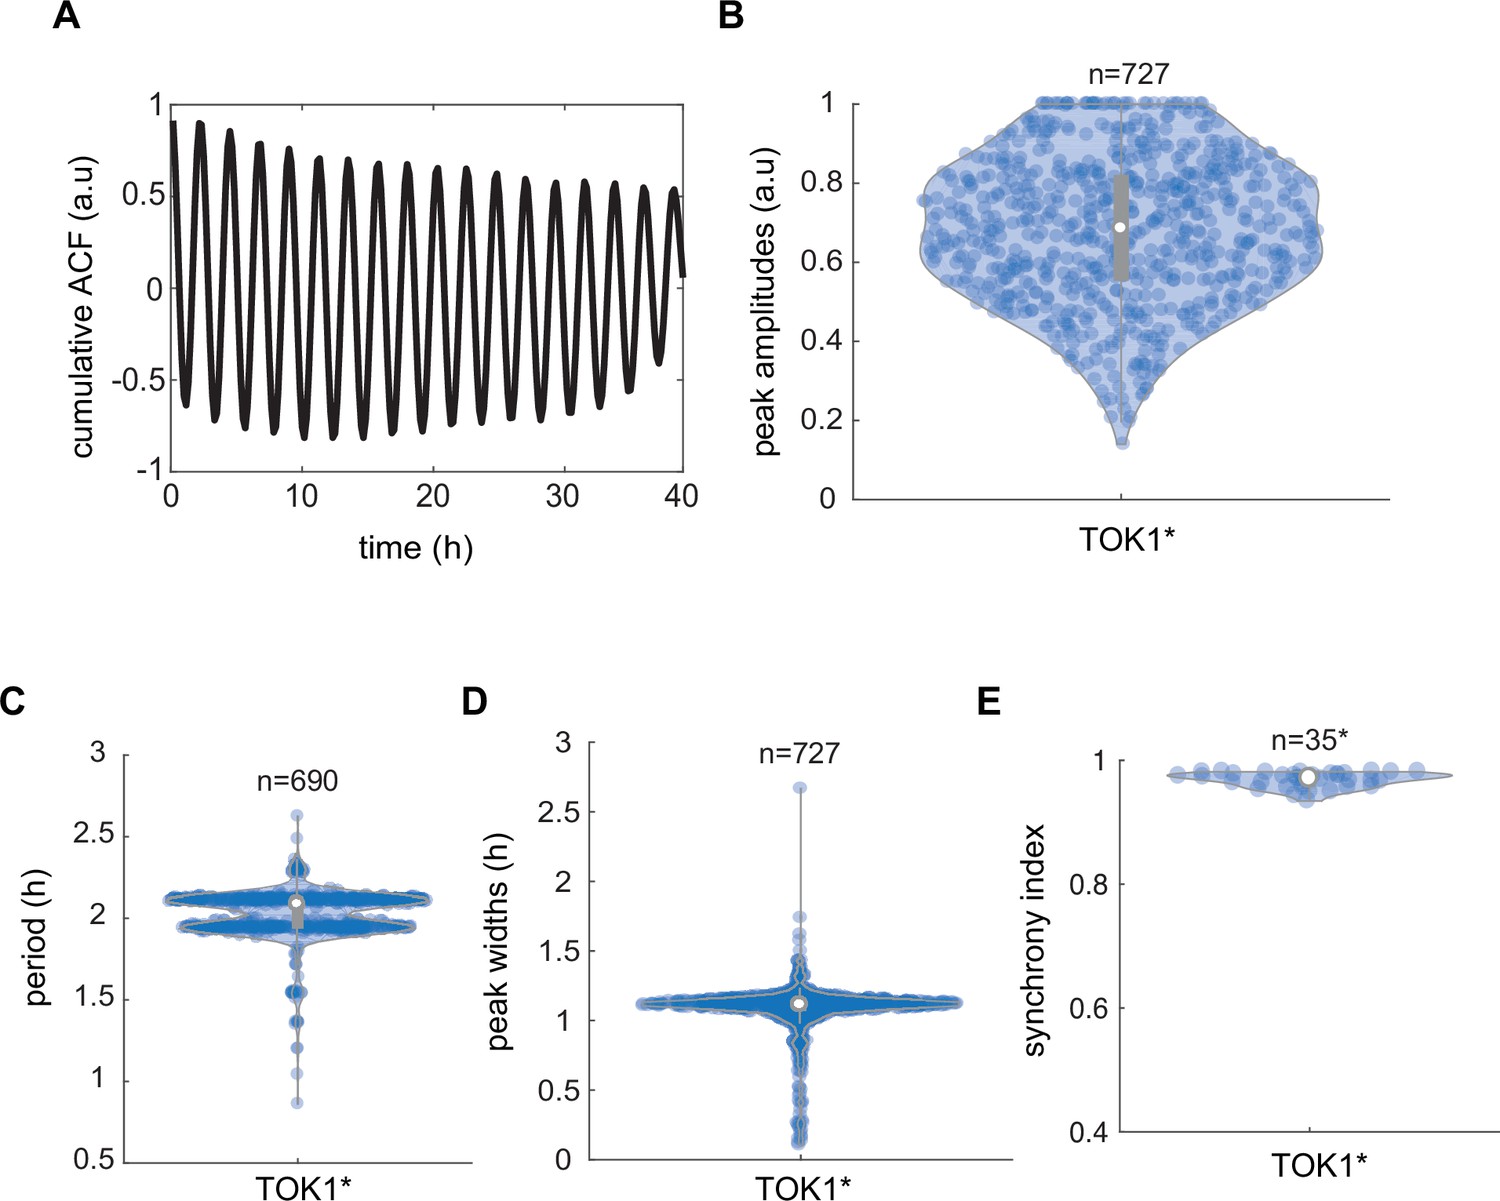
(A) Cumulative autocorrelation analysis of cumulative trend across all measured communities for 2 hr (black line) shows coherent oscillations in Thioflavin T (ThT) fluorescence. Peak amplitudes (B), periods (C), and widths (D) recorded in yeast communities that integrate the TOK1*-based synthetic circuit. (E) Synchrony index recorded for yeasts engineered with TOK1*-containing circuit in total (n = 35) recorded yeast communities. Violin plots represent medians (white dots), interquartile zones (gray bars) and 95% confidence levels (solid gray line).
-
Figure 3—figure supplement 2—source data 1
Source data for Figure 3—figure supplement 2B–E.
- https://cdn.elifesciences.org/articles/78075/elife-78075-fig3-figsupp2-data1-v2.xlsx
Figure 3—video 1
Thioflavin T (ThT) oscillations controlled by phytohormone rhythms (2-hr stimuli) for yeast transformed with KcsA*-based circuit.
Related to Figure 3A. Left panel, differential interference contrast (DIC), middle panel, ThT (cyan), and right panel, ThT color coded in heat map colors (blue [low signal], red [high signal]) of the sampled yeast colony grow in microfluidics device with 2-hr cycles of phytohormone stimuli.
Figure 3—video 2
Thioflavin T (ThT) oscillations controlled by phytohormone rhythms (3-hr stimuli) for yeast transformed with KcsA*-based circuit.
Related to Figure 3—figure supplement 1A. Left panel, differential interference contrast (DIC), middle panel, ThT (cyan), and right panel, ThT color coded in heat map colors (blue [low signal], red [high signal]) of the sampled yeast colony grow in microfluidics device with 3-hr cycles of phytohormone stimuli.
Figure 3—video 3
Thioflavin T (ThT) oscillations controlled by phytohormone rhythms (1-hr stimuli) for yeast transformed with KcsA*-based circuit.
Related to Figure 3—figure supplement 1B. Left panel, differential interference contrast (DIC), middle panel, ThT (cyan), and right panel, ThT color coded in heat map colors (blue [low signal], red [high signal]) of the sampled yeast colony grow in microfluidics device with 1-hr cycles of phytohormone stimuli.
Figure 3—video 4
Thioflavin T (ThT) oscillations controlled by phytohormone rhythms (2-hr stimuli) for yeast transformed with TOK1*-based circuit.
Related to Figure 3G. Left panel, differential interference contrast (DIC), middle panel, ThT (cyan), and right panel, ThT color coded in heat map colors (blue [low signal], red [high signal]) of the sampled yeast colony grow in microfluidics device with 2-hr cycles of phytohormone stimuli.
Tables
Appendix 1—key resources table
| Reagent type (species) or resource | Designation | Source or reference | Identifiers | Additional information |
|---|---|---|---|---|
| Strain, BY4741 MATa his3Δ1 leu2Δ0 met15Δ0 ura3Δ0 (Saccharomyces cerevisiae) | sRedM | Pérez-García et al., 2021 | BY4741 pGK1:: mCherry | Selection: KanMX (G418) |
| Strain, sRedM (Saccharomyces cerevisiae) | cLPdGFP | This study | sRedM pMarOIacO:: IacR-VP64 (pEX1004, ADDGENE_194950) pMarOIacO::MarR-RD (pEX1005, ADDGENE_ 194951) pMarOIacO::dEGFP (UbG76V-EGFP) (pEX1006, ADDGENE_194952) | Selection: KanMX (G418) -Leu, -Ura, -His |
| Strain, BY4741 MATa his3Δ1 leu2Δ0 met15Δ0 ura3Δ0 (Saccharomyces cerevisiae) | oLPKcsA* | This study | BY4741 MATa his3Δ1 leu2Δ0 met15Δ0 ura3Δ0 pGal7:: IacR-VP64 (pEX1001, ADDGENE_ 194713) pGal7::MarR-RD (pEX1002 ADDGENE_ 194714) pMarOIacO::KcsA*(pEX1003, ADDGENE_194949) | Selection: -Leu, -Ura, -His |
| Strain, BY4741 MATa his3Δ1 leu2Δ0 met15Δ0 ura3Δ0 (Saccharomyces cerevisiae) | sEmpty (control strain) | This study | BY4741 MATa his3Δ1 leu2Δ0 met15Δ0 ura3Δ0 Empty insert plasmids pGADT7 (Takara Bio) backbone with auxotrophic markers | Selection: -Leu, -Ura, -His |
| Strain, BY4741 MATa his3Δ1 leu2Δ0 met15Δ0 ura3Δ0 (Saccharomyces cerevisiae) | cLPKcsA* | This study | sRedM pMarOIacO:: IacR-VP64 (pEX1004, ADDGENE_194950) pMarOIacO::MarR-RD (pEX1005, ADDGENE_ 194951) pMarOIacO::KcsA*(pEX1003, ADDGENE_194949) | Selection: -Leu, -Ura, -His |
| Strain, BY4741 MATa his3Δ1 leu2Δ0 met15Δ0 ura3Δ0 (Saccharomyces cerevisiae) | cLPTOK1* | This study | pMarOIacO:: IacR-VP64 (pEX1004, ADDGENE_194950) pMarOIacO::MarR-RD (pEX1005, ADDGENE_ 194951) pMarOIacO::TOK1*(pEX1008, ADDGENE_194954) | Selection: -Leu, -Ura, -His |
| Strain, BY4741 MATa his3Δ1 leu2Δ0 met15Δ0 ura3Δ0 (Saccharomyces cerevisiae) | cLPKcsA-EGFP* | This study | sRedM pMarOIacO:: IacR-VP64 (pEX1004, ADDGENE_194950) pMarOIacO::MarR-RD (pEX1005, ADDGENE_ 194951) pMarOIacO::KcsA- GFP*(pEX1007, ADDGENE_194953) | Selection: KanMX (G418) -Leu, -Ura, -His |
| Other, PMP dye: Thioflavin T | ThT | Fisher Scientific, Thermo Scientific | CAS: 2390-54-7 | |
| Other, PMP dye: Bis-(1,3-Dibutylbarbituric Acid)Trimethine Oxonol | DIBAC4(3) | VWR INTERNATIONAL EUROLAB, S.L | CAS: 70363-83-6 | |
| Other, PMP dye: 3,3'-di-n-propylthiacarbocyanine iodide | DIS-C3(3) | FISHER SCIENTIFIC | CAS: 53336-12-2 |
Additional files
-
Supplementary file 1
Oligos and synthetic DNA sequences used in this study.
- https://cdn.elifesciences.org/articles/78075/elife-78075-supp1-v2.docx
-
Supplementary file 2
Computer model parameters.
- https://cdn.elifesciences.org/articles/78075/elife-78075-supp2-v2.docx
-
MDAR checklist
- https://cdn.elifesciences.org/articles/78075/elife-78075-mdarchecklist1-v2.docx
Download links
A two-part list of links to download the article, or parts of the article, in various formats.
Downloads (link to download the article as PDF)
Open citations (links to open the citations from this article in various online reference manager services)
Cite this article (links to download the citations from this article in formats compatible with various reference manager tools)
Macroscopic control of cell electrophysiology through ion channel expression
eLife 11:e78075.
https://doi.org/10.7554/eLife.78075


