Validation of a multi-ancestry polygenic risk score and age-specific risks of prostate cancer: A meta-analysis within diverse populations
- Department of Population and Public Health Sciences, University of Southern California, United States
- Public Health Sciences, Fred Hutchinson Cancer Research Center, United States
- Argonne National Laboratory, United States
- Yale School of Medicine, United States
- VA Connecticut Healthcare System, United States
- London School of Hygiene and Tropical Medicine, United Kingdom
- Harvard TH Chan School of Public Health and Division of Population Sciences, Dana Farber Cancer Institute, United States
- Laboratory of Human Carcinogenesis, Center for Cancer Research, National Cancer Institute, United States
- Department of Surgery, Urology Division, Brigham and Women’s Hospital, Harvard Medical School, United States
- Department of Epidemiology, Harvard T.H. Chan School of Public Health, United States
- VA Boston Healthcare System, United States
- Division of Aging, Brigham and Women's Hospital, United States
- Hôpital Général Idrissa Pouye, Senegal
- College of Medicine, University of Ibadan and University College Hospital, Nigeria
- College of Health Sciences, University of Abuja, University of Abuja Teaching Hospital and Cancer Science Center, Nigeria
- 37 Military Hospital, Ghana
- Korle-Bu Teaching Hospital, Ghana
- Laboratoires Bacteriologie et Virologie, Hôpital Aristide Le Dantec, Senegal
- School of Biological Sciences, Georgia Institute of Technology, United States
- Department of Medicine, Harvard Medical School, United States
Figures
Figure 1 with 1 supplement
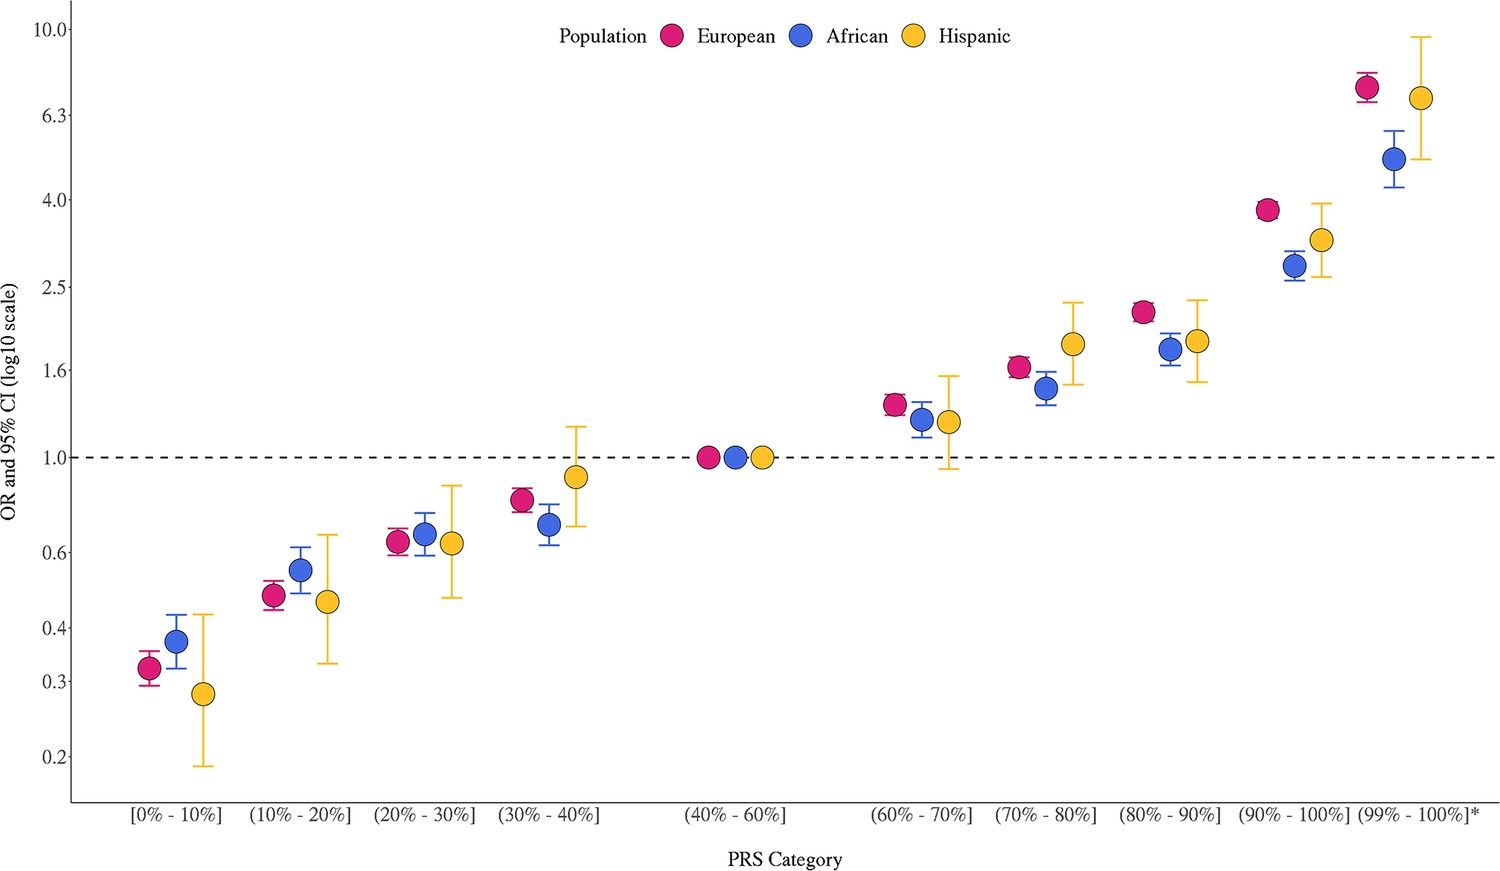
Association between the multi-ancestry polygenic risk score (PRS) of 269 variants and prostate cancer risk in men from European, African, and Hispanic populations.
The European ancestry replication studies included Million Veteran Program (MVP), UK Biobank (Conti, Darst et al., Nature Genetics, 2021), and Mass General Brigham (MGB) Biobank (Plym et al., JNCI, 2021). The African ancestry replication studies included MVP, California and Uganda Prostate Cancer Study (CA UG) (Conti, Darst et al., Nature Genetics, 2021), Men of African Descent and Carcinoma of the Prostate (MADCaP) Network, Maryland Prostate Cancer Case–Control Study (NCI-MD), and MGB Biobank (Plym et al., JNCI, 2021). Replication in Hispanic men was conducted in MVP. Results from individual replication studies are shown in Figure 1—figure supplement 1. The x-axis indicates the PRS category. Additional analysis was performed to evaluate the PRS association in men with extremely high genetic risk (99–100%). The y-axis indicates OR with error bars representing 95% CIs for each PRS category compared to the 40–60% PRS. The dotted horizontal line corresponds to an OR of 1. ORs and 95% CIs for each decile are provided in Figure 1—source data 1.
-
Figure 1—source data 1
Association between the multi-ancestry polygenic risk score (PRS) and prostate cancer risk replicated in men from European, African, and Hispanic populations.
Results in men of European ancestry were meta-analyzed across Million Veteran Program (MVP), UK Biobank, and Mass General Brigham (MGB) Biobank. Results in men of African ancestry were meta-analyzed across MVP, California and Uganda Prostate Cancer Study (CA UG), Maryland Prostate Cancer Case–Control Study (NCI-MD), Men of African Descent and Carcinoma of the Prostate (MADCaP) Network, and MGB Biobank. Results in Hispanic men were from MVP. The PRS association for men in the 99–100% category was not assessed in the MGB Biobank and therefore was not included in the meta-analysis. In each replication study, PRS categories were determined based on the distribution in controls. ORs and 95% CIs were estimated from logistic regression models adjusting for age and principal components of ancestry.
- https://cdn.elifesciences.org/articles/78304/elife-78304-fig1-data1-v2.docx
Figure 1—figure supplement 1
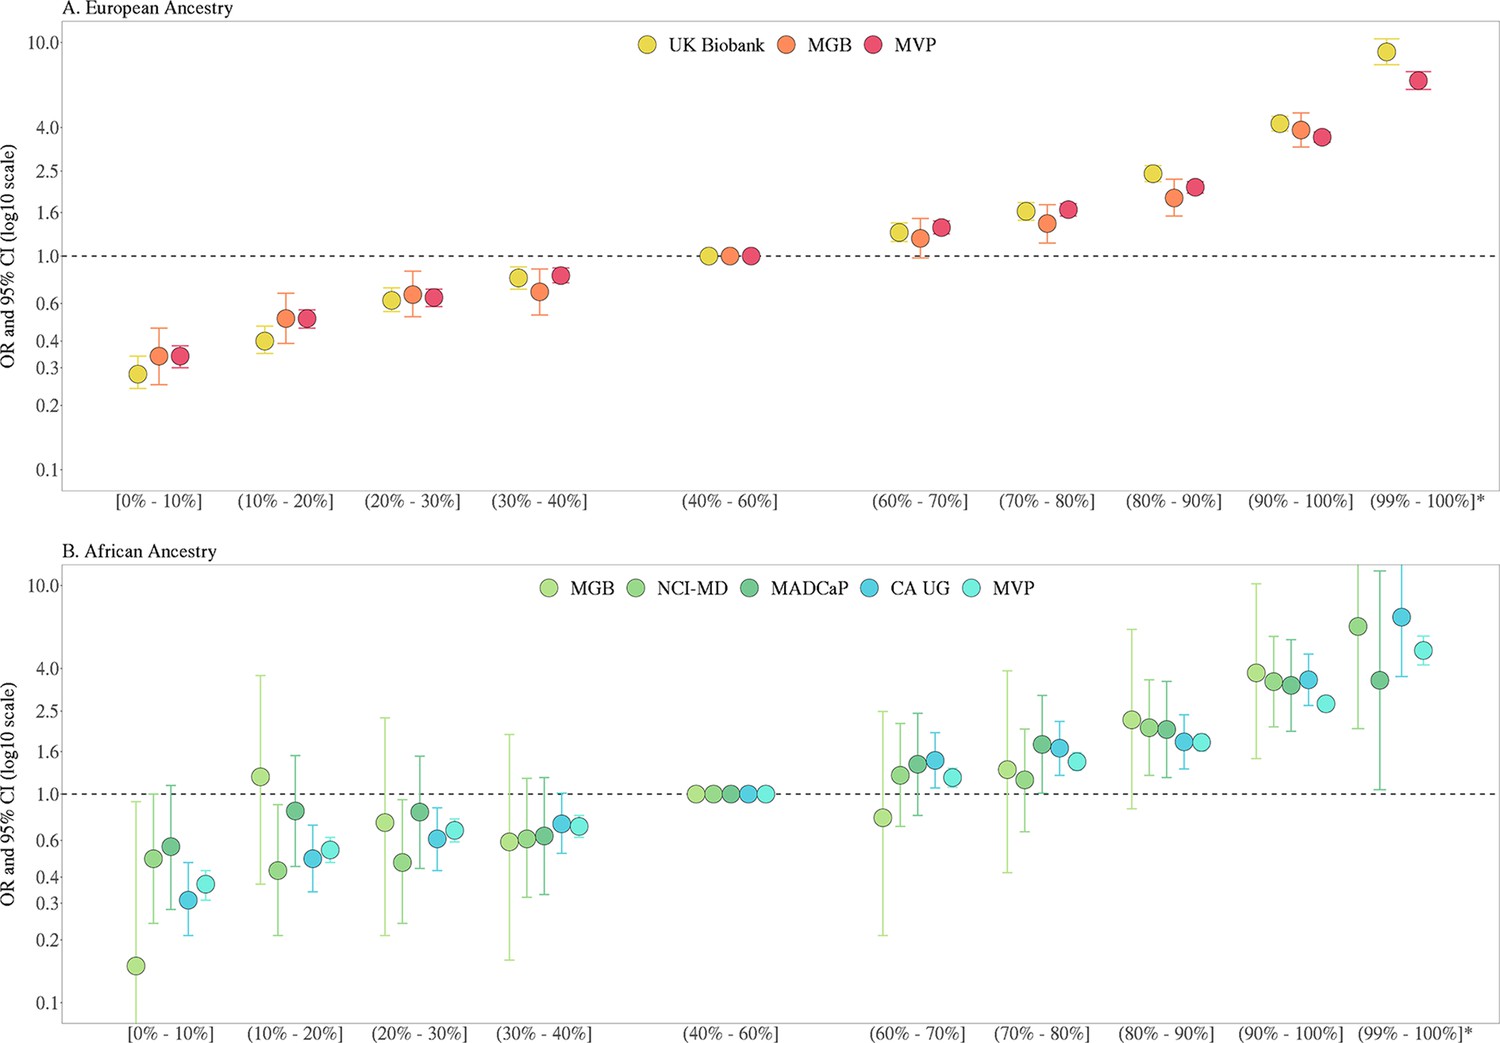
Association between the multi-ancestry polygenic risk score (PRS) of 269 variants and prostate cancer risk from individual replication studies of European (A) and African ancestry (B).
Replication studies in men of European and African ancestry included Million Veteran Program (MVP) (13,643 cases and 210,214 controls of European ancestry and 6353 cases and 53,362 controls of African ancestry), UK Biobank (6852 cases and 193,117 controls of European ancestry), Mass General Brigham (MGB) Biobank (67 cases and 457 controls of African ancestry and 1554 cases and 10,918 controls of European ancestry), California and Uganda Prostate Cancer Study (CA UG) (1586 cases and 1047 controls of African ancestry), Men of African Descent and Carcinoma of the Prostate (MADCaP) Network (405 cases and 396 controls of African ancestry), and Maryland Prostate Cancer Case–Control Study (NCI-MD) (383 cases and 395 controls of African ancestry). The x-axis indicates the PRS category. Additional analysis was performed to evaluate the PRS association in men with extremely high genetic risk (99–100%) in all individual studies except the MGB Biobank. The y-axis indicates OR with error bars representing the 95% CIs for each PRS category compared to the 40–60% PRS category. The dotted horizontal line corresponds to an OR of 1.
Figure 2 with 1 supplement
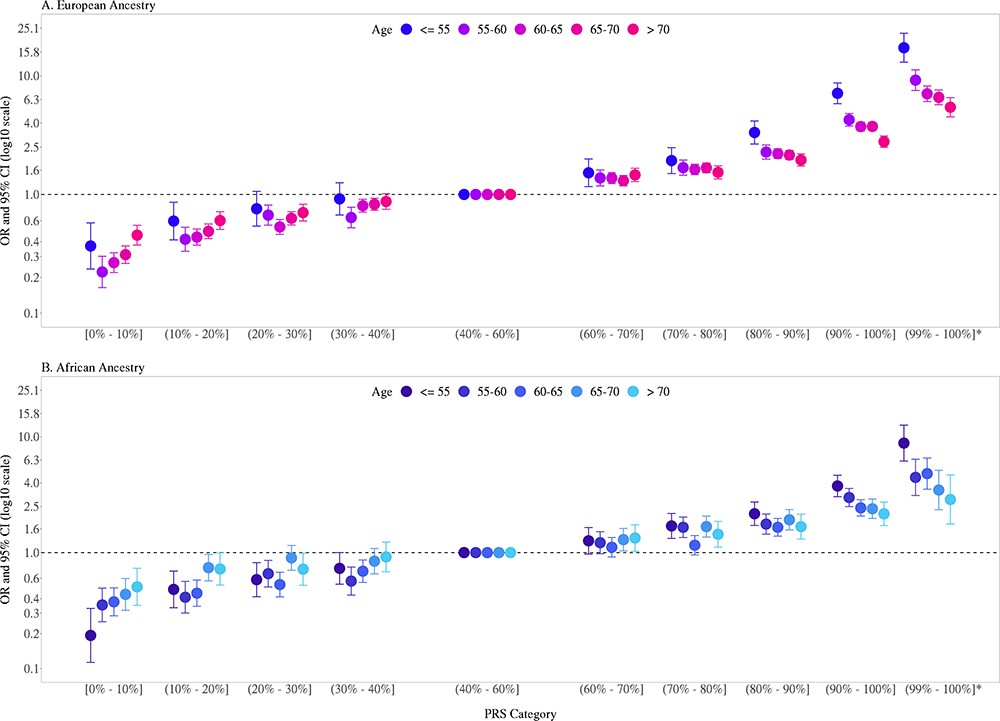
Association between the multi-ancestry polygenic risk score (PRS) of 269 variants and prostate cancer risk stratified by age.
PRS associations in men of European ancestry (A) were meta-analyzed from UK Biobank (6852 cases and 193,117 controls) and Million Veteran Program (MVP) (13,643 cases and 210,214 controls; Figure 2—figure supplement 1), whereas PRS associations in men of African ancestry (B) were estimated from MVP (6353 cases and 53,362 controls). The x-axis indicates the PRS category. Additional analyses were performed to evaluate the PRS association in men with extremely high genetic risk (top percentile, 99–100%). The y-axis indicates the OR with error bars representing the 95% CIs for each PRS category compared to the 40–60% PRS category. The dotted horizontal line corresponds to an OR of 1. The number of cases and controls, ORs, and 95% CIs for each PRS category in each age stratum are provided in Figure 2—source data 1.
-
Figure 2—source data 1
Association of multi-ancestry polygenic risk score (PRS) and prostate cancer risk stratified by age.
Results in men of European ancestry were meta-analyzed across UK Biobank and Million Veteran Program (MVP) while results in men of African and Hispanic ancestry were estimated in MVP only. In each replication study, PRS categories were determined based on the distribution in controls. ORs and 95% CIs were estimated from logistic regression models adjusting for age and principal components of ancestry.
- https://cdn.elifesciences.org/articles/78304/elife-78304-fig2-data1-v2.xlsx
Figure 2—figure supplement 1
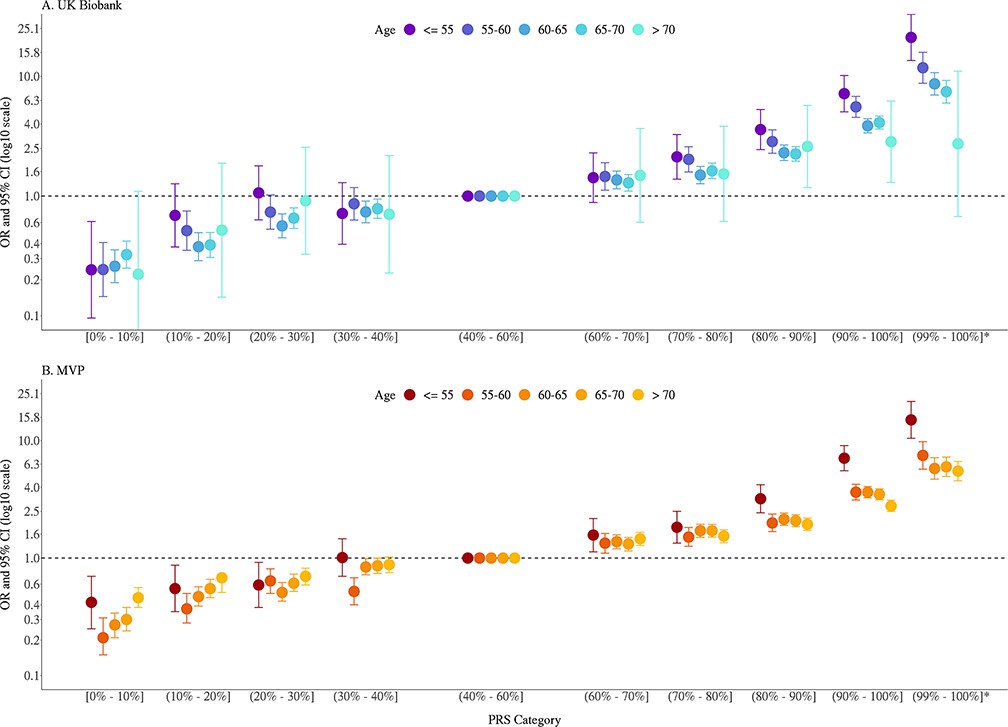
Association between the multi-ancestry polygenic risk score (PRS) of 269 variants and prostate cancer risk stratified by age in men of European ancestry from UK Biobank (A) and Million Veteran Program (MVP) (B).
The x-axis indicates the PRS category. Additional analysis was performed to evaluate the PRS association in men with extremely high genetic risk (99–100%). The y-axis indicates OR with error bars representing the 95% CIs for each PRS category compared to the 40–60% PRS category. The dotted horizontal line corresponds to an OR of 1.
Figure 3
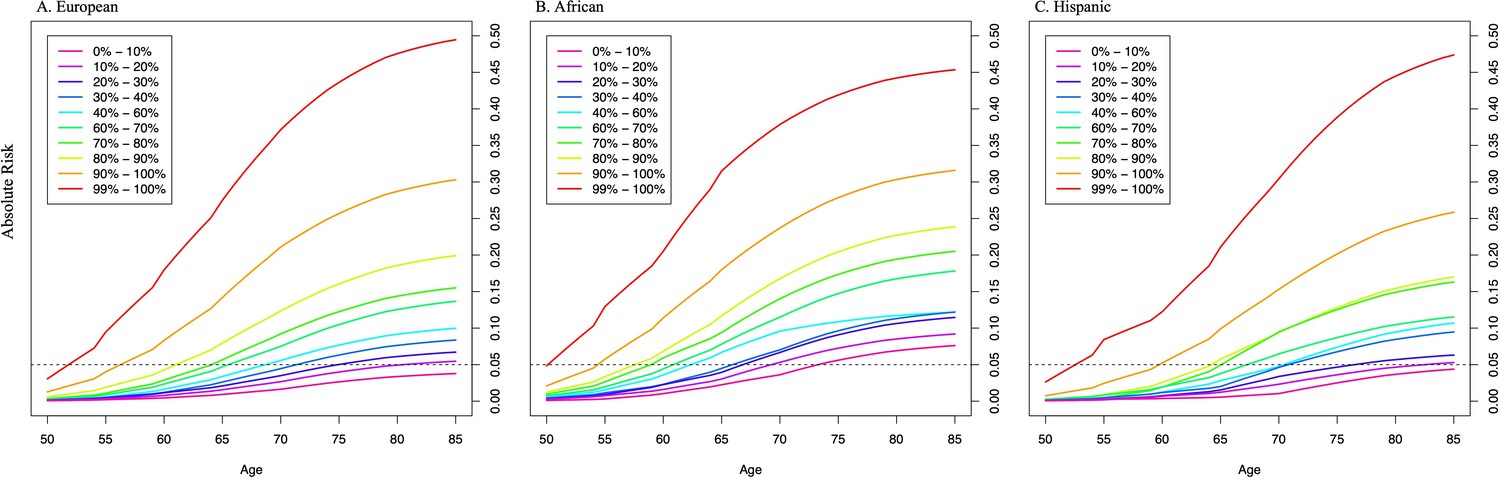
Absolute risk of prostate cancer by polygenic risk score (PRS) category in men from European (A), African (B), and Hispanic populations (C).
The absolute risks were estimated using the age- and population-specific PRS associations from Figure 2—source data 1, the Surveillance, Epidemiology, and End Results (SEER) incidence rates, and the CDC mortality rates corresponding to non-Hispanic White, Black, and Hispanic men. The dotted line indicates the 5% absolute risk of prostate cancer.
Appendix 1—figure 1
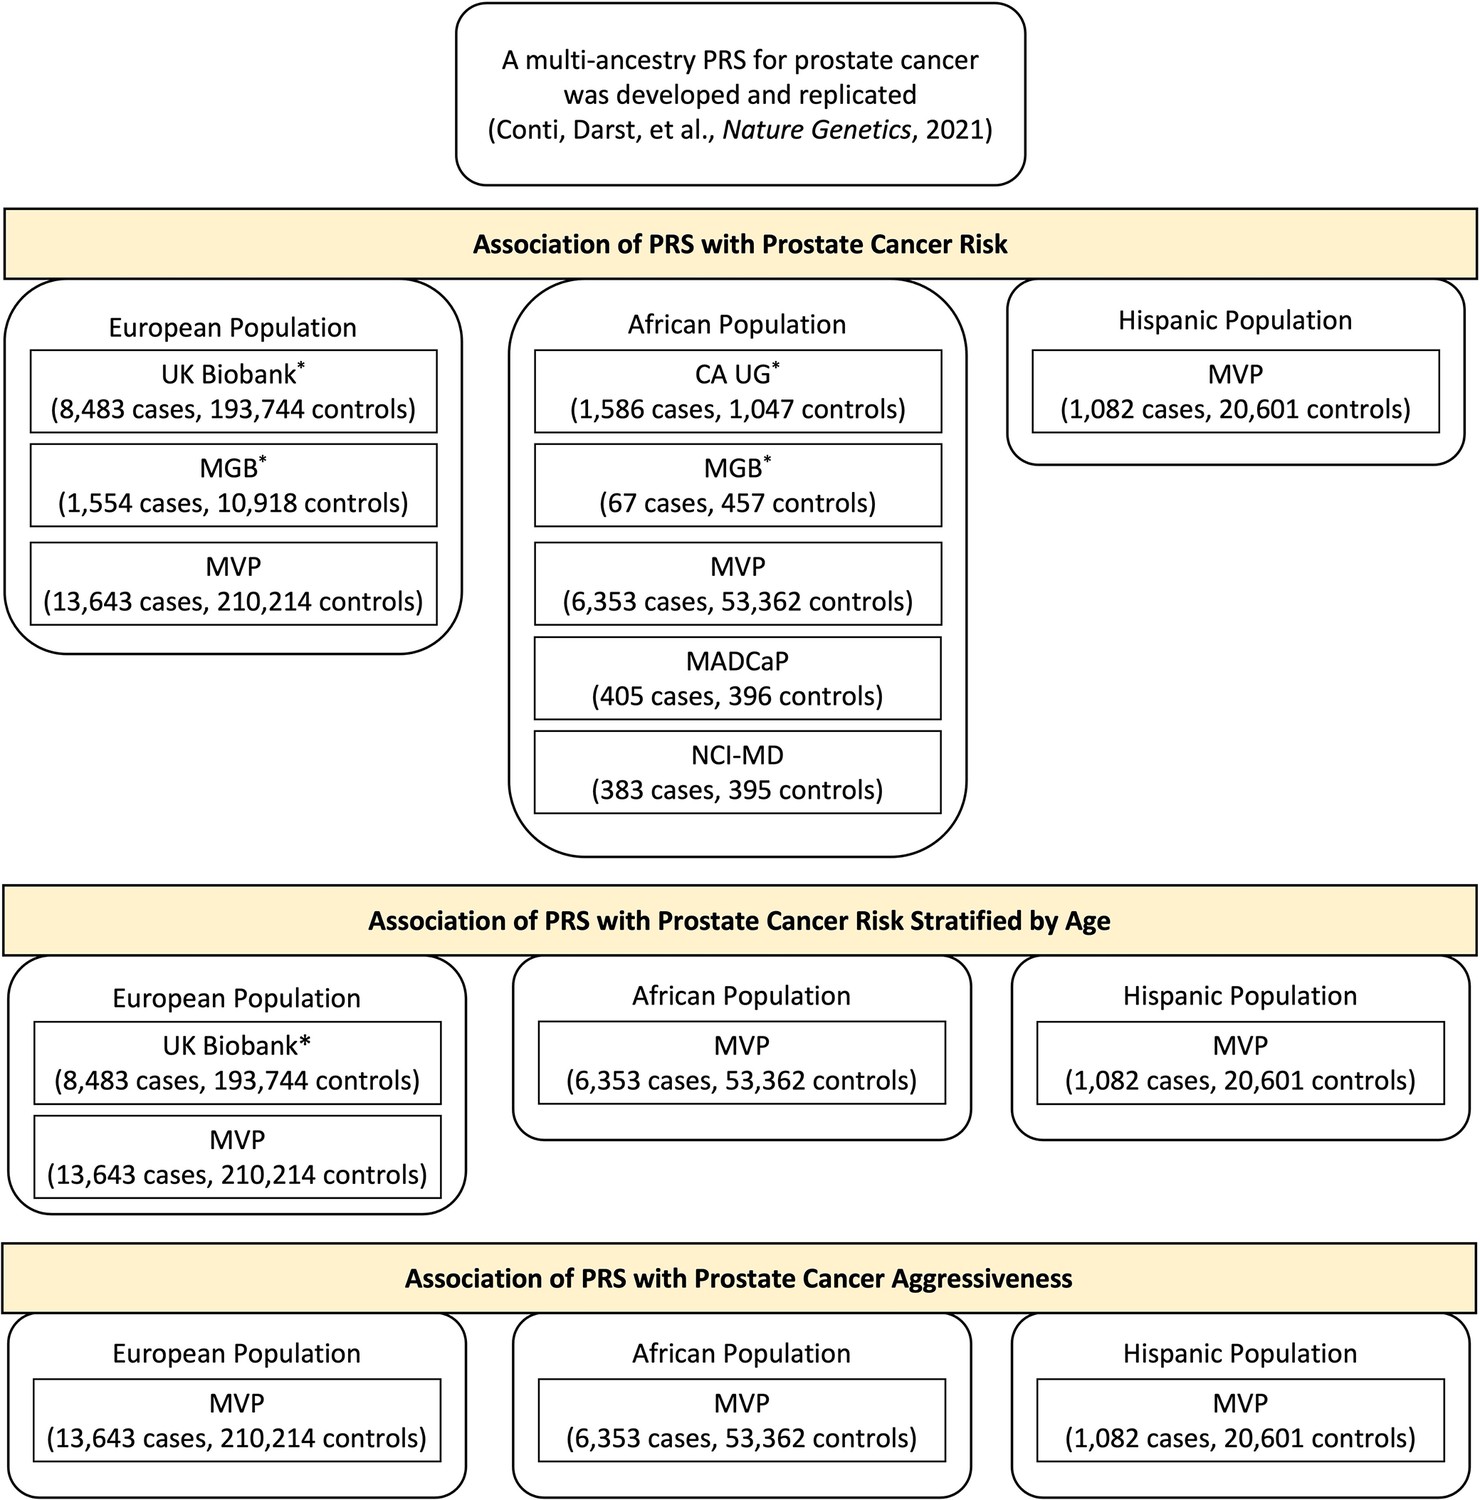
Individual studies of European, African, or Hispanic population included in the polygenic risk score (PRS) association analysis.
Results from previous replication studies (*) in UK Biobank, Mass General Brigham (MGB) Biobank, and California and Uganda Prostate Cancer Study (CA UG) were meta-analyzed with results from Million Veteran Program (MVP), Maryland Prostate Cancer Case–Control Study (NCI-MD), and Men of African Descent and Carcinoma of the Prostate (MADCaP) Network within each ancestry population.
Tables
Table 1
Age at which 5% absolute risk of prostate cancer is reached in men from European, African, and Hispanic populations.
Absolute risks of prostate cancer were estimated using age- and population-specific Surveillance, Epidemiology, and End Results (SEER) incidence rates, CDC National Center for Health Statistics mortality rates, and polygenic risk score (PRS) associations from Figure 2—source data 1 based on Million Veteran Program (MVP) and the UK Biobank.
| PRS category | European | African | Hispanic |
|---|---|---|---|
| [0–10] | >85 | 74 | >85 |
| (10–20%] | 81 | 70 | 83 |
| (20–30%] | 75 | 67 | 77 |
| (30–40%] | 72 | 66 | 71 |
| (40–60%] | 69 | 63 | 71 |
| (60–70%] | 66 | 61 | 68 |
| (70–80%] | 65 | 59 | 66 |
| (80–90%] | 62 | 58 | 65 |
| (90–100%] | 57 | 55 | 60 |
| (99–100%] | 52 | 51 | 53 |
Appendix 1—table 1
Model discrimination and improvement estimated with area under the curve (AUC) upon adding the multi-ancestry polygenic risk score (PRS) to a base model in the Million Veteran Program (MVP) study populations.
| Age and PCs | Age, PCs, and PRS | AUC Change | ||||
|---|---|---|---|---|---|---|
| Population | Sample | AUC | 95% CI | AUC | 95% CI | |
| European ancestry | All cases and controls | 0.582 | (0.578–0.587) | 0.694 | (0.690–0.699) | +0.112 |
| Aggressive cases and controls | 0.533 | (0.521–0.545) | 0.666 | (0.655–0.677) | +0.133 | |
| Nonaggressive cases and controls | 0.603 | (0.598–0.608) | 0.703 | (0.698–0.708) | +0.100 | |
| African ancestry | All cases and controls | 0.512 | (0.505–0.520) | 0.656 | (0.649–0.663) | +0.144 |
| Aggressive cases and controls | 0.547 | (0.531–0.564) | 0.681 | (0.665–0.697) | +0.134 | |
| Nonaggressive cases and controls | 0.522 | (0.514–0.529) | 0.657 | (0.649–0.665) | +0.135 | |
| Hispanic | All cases and controls | 0.530 | (0.513–0.547) | 0.683 | (0.667–0.699) | +0.153 |
| Aggressive cases and controls | 0.568 | (0.531–0.607) | 0.674 | (0.636–0.712) | +0.106 | |
| Nonaggressive cases and controls | 0.514 | (0.495–0.534) | 0.685 | (0.667–0.702) | +0.171 | |
-
Abbreviation: PCs, principal components of ancestry.
Appendix 1—table 2
The association between the multi-ancestry polygenic risk score (PRS) and prostate cancer aggressiveness in Million Veteran Program (MVP) participants from European, African, and Hispanic populations.
PRS categories were determined based on the distribution in controls in each replication study. ORs and 95% CIs were estimated from logistic regression models adjusting for age and principal components of ancestry. Heterogeneity was assessed via a Q statistic between effects estimates with corresponding tests of significance.
| Aggressive cases vs. controls | Nonaggressive cases vs. controls | ||||||||||
|---|---|---|---|---|---|---|---|---|---|---|---|
| PRS category | Controls | Cases | OR | 95% CI | p-Value | Controls | Cases | OR | 95% CI | p-Value | P-heterogeneity |
| European ancestry | |||||||||||
| [0–10%] | 21,022 | 82 | 0.47 | (0.37–0.59) | 5.16E-10 | 21,022 | 258 | 0.31 | (0.27–0.36) | 4.43E-66 | 4.86E-03 |
| (10–20%] | 21,021 | 96 | 0.55 | (0.44–0.68) | 1.63E-07 | 21,021 | 423 | 0.51 | (0.46–0.57) | 6.29E-34 | 0.61 |
| (20–30%] | 21,021 | 118 | 0.67 | (0.54–0.83) | 1.76E-04 | 21,021 | 520 | 0.63 | (0.57–0.70) | 1.45E-19 | 0.60 |
| (30–40%] | 21,022 | 156 | 0.89 | (0.73–1.07) | 2.14E-01 | 21,022 | 656 | 0.79 | (0.72–0.87) | 8.87E-07 | 0.30 |
| (40–60%] | 42,042 | 352 | 1.00 (ref.) | 42,042 | 1658 | 1.00 (ref.) | |||||
| (60–70%] | 21,022 | 245 | 1.39 | (1.18–1.64) | 7.32E-05 | 21,022 | 1120 | 1.35 | (1.25–1.45) | 6.55E-14 | 0.71 |
| (70–80%] | 21,021 | 272 | 1.55 | (1.32–1.82) | 7.13E-08 | 21,021 | 1392 | 1.67 | (1.55–1.79) | 1.84E-42 | 0.41 |
| (80–90%] | 21,021 | 335 | 1.91 | (1.64–2.22) | 4.51E-17 | 21,021 | 1801 | 2.15 | (2.00–2.30) | 5.69E-105 | 0.16 |
| (90–100%] | 21,022 | 554 | 3.17 | (2.77–3.63) | 2.72E-63 | 21,022 | 3151 | 3.71 | (3.48–3.94) | <4.35E-283 | 0.04 |
| (99–100%] | 2,103 | 112 | 6.49 | (5.22–8.07) | 1.08E-63 | 2103 | 589 | 6.77 | (6.10–7.51) | 4.35E-283 | 0.73 |
| African ancestry | |||||||||||
| [0–10%] | 5,337 | 29 | 0.35 | (0.24–0.53) | 2.96E-07 | 5337 | 163 | 0.35 | (0.30–0.42) | 2.50E-33 | 0.98 |
| (10–20%] | 5,336 | 45 | 0.55 | (0.40–0.77) | 4.23E-04 | 5336 | 247 | 0.54 | (0.46–0.62) | 2.28E-17 | 0.88 |
| (20–30%] | 5,336 | 45 | 0.55 | (0.40–0.77) | 4.98E-04 | 5336 | 306 | 0.66 | (0.58–0.76) | 1.74E-09 | 0.33 |
| (30–40%] | 5,336 | 70 | 0.86 | (0.65–1.14) | 3.05E-01 | 5336 | 318 | 0.69 | (0.61–0.79) | 3.43E-08 | 0.16 |
| (40–60%] | 10,672 | 163 | 1.00 (ref.) | 10,672 | 920 | 1.00 (ref.) | |||||
| (60–70%] | 5,336 | 121 | 1.50 | (1.18–1.90) | 8.14E-04 | 5336 | 556 | 1.21 | (1.08–1.35) | 7.65E-04 | 0.11 |
| (70–80%] | 5,336 | 131 | 1.62 | (1.28–2.04) | 4.97E-05 | 5336 | 659 | 1.43 | (1.29–1.59) | 1.88E-11 | 0.36 |
| (80–90%] | 5,336 | 151 | 1.89 | (1.51–2.36) | 2.59E-08 | 5336 | 819 | 1.78 | (1.61–1.97) | 9.21E-30 | 0.64 |
| (90–100%] | 5,337 | 262 | 3.31 | (2.71–4.03) | 4.66E-32 | 5337 | 1,224 | 2.66 | (2.43–2.92) | 8.99E-97 | 0.05 |
| (99–100%] | 534 | 45 | 5.840 | (4.14–8.22) | 5.79E-24 | 534 | 220 | 4.77 | (4.02–5.66) | 1.62E-71 | 0.30 |
| Hispanic | |||||||||||
| [0–10%] | 2061 | 2 | 0.12 | (0.03–0.50) | 3.69E-03 | 2061 | 21 | 0.31 | (0.20–0.50) | 8.67E-07 | 0.21 |
| [10–20%] | 2060 | 6 | 0.36 | (0.15–0.87) | 2.23E-02 | 2060 | 31 | 0.46 | (0.31–0.69) | 1.29E-04 | 0.61 |
| (20–30%] | 2060 | 6 | 0.36 | (0.15–0.86) | 2.12E-02 | 2060 | 47 | 0.70 | (0.50–0.98) | 4.00E-02 | 0.16 |
| (30–40%] | 2060 | 17 | 1.04 | (0.58–1.87) | 9.04E-01 | 2060 | 59 | 0.88 | (0.65–1.21) | 4.39E-01 | 0.64 |
| (40–60%] | 4,120 | 33 | 1.00 (ref.) | 4120 | 133 | 1.00 (ref.) | |||||
| (60–70%] | 2060 | 20 | 1.21 | (0.69–2.11) | 5.05E-01 | 2060 | 85 | 1.28 | (0.97–1.68) | 8.50E-02 | 0.87 |
| (70–80%] | 2060 | 24 | 1.47 | (0.86–2.49) | 1.55E-01 | 2060 | 136 | 2.06 | (1.61–2.63) | 7.82E-09 | 0.26 |
| (80–90%] | 2060 | 22 | 1.33 | (0.77–2.29) | 3.01E-01 | 2060 | 136 | 2.05 | (1.61–2.62) | 8.69E-09 | 0.15 |
| (90–100%] | 2060 | 31 | 1.92 | (1.17–3.15) | 9.37E-03 | 2060 | 217 | 3.30 | (2.64–4.12) | 7.46E-26 | 0.05 |
| (99–100%] | 206 | 4 | 2.580 | (0.91–7.38) | 7.61E-02 | 206 | 46 | 7.15 | (4.96–10.3) | 3.99E-26 | 0.07 |
Author response table 1
Association of the Multi-ancestry PRS with Prostate Cancer Risk in men of European and African Ancestry.
The PRS association on prostate cancer risk estimated from individual replication studies within each ancestry population were meta-analyzed using (a) a fixed-effects method and (b) a random-effects method.
| European Ancestry | African Ancestry | |||||||||||||
|---|---|---|---|---|---|---|---|---|---|---|---|---|---|---|
| 22,049 cases, 414,249 controls | 8,794 cases, 55,657 controls | |||||||||||||
| Fixed-Effects Meta-analysis | Random-Effects Meta-analysis | Fixed-Effects Meta-analysis | Random-Effects Meta-analysis | |||||||||||
| PRS Category | OR | (95% CI) | P value | OR | (95% CI) | P value | OR | (95% CI) | P value | OR | (95% CI) | P value | ||
| [0–10%] | 0.32 | (0.29–0.35) | 5.67E-126 | 0.32 | (0.28–0.36) | 3.72E-60 | 0.37 | (0.32–0.43) | 4.17E-41 | 0.39 | (0.27–0.54) | 6.49E-08 | ||
| (10%–20%] | 0.48 | (0.44–0.51) | 5.74E-77 | 0.47 | (0.40–0.55) | 2.49E-20 | 0.55 | (0.48–0.62) | 9.75E-22 | 0.58 | (0.41–0.81) | 1.58E-03 | ||
| (20%–30%] | 0.64 | (0.59–0.68) | 9.81E-35 | 0.64 | (0.59–0.68) | 6.29E-34 | 0.66 | (0.59–0.74) | 1.61E-12 | 0.65 | (0.54–0.79) | 6.85E-06 | ||
| (30%–40%] | 0.79 | (0.75–0.85) | 2.47E-12 | 0.78 | (0.71–0.87) | 1.12E-06 | 0.7 | (0.62–0.78) | 1.16E-10 | 0.7 | (0.62–0.78) | 8.81E-10 | ||
| (40%–60%] | 1.00 (reference) | 1.00 (reference) | 1.00 (reference) | 1.00 (reference) | ||||||||||
| (60%–70%] | 1.33 | (1.26–1.40) | 8.90E-24 | 1.32 | (1.23–1.42) | 5.44E-15 | 1.23 | (1.11–1.35) | 3.01E-05 | 1.26 | (1.05–1.51) | 1.09E-02 | ||
| (70%–80%] | 1.62 | (1.54–1.71) | 3.26E-72 | 1.61 | (1.48–1.75) | 5.21E-29 | 1.45 | (1.32–1.59) | 6.00E-16 | 1.47 | (1.27–1.70) | 3.13E-07 | ||
| (80%–90%] | 2.18 | (2.08–2.29) | 2.28E-216 | 2.16 | (1.88–2.48) | 4.28E-27 | 1.79 | (1.64–1.95) | 7.51E-40 | 1.8 | (1.62–2.00) | 3.36E-27 | ||
| (90%–100%] | 3.78 | (3.62–3.96) | <5.00E-324 | 3.86 | (3.52–4.23) | 2.30E-184 | 2.8 | (2.59–3.03) | 1.38E-144 | 2.97 | (2.57–3.44) | 1.46E-49 | ||
| (99%–100%] | 7.32 | (6.76–7.92) | <5.00E-324 | 7.7 | (5.74–10.33) | 3.28E-42 | 4.98 | (4.27–5.79) | 5.02E-95 | 5.17 | (3.87–6.92) | 1.57E-28 | ||
Author response table 2
| Sample Size | % AFR Ancestry | |||
|---|---|---|---|---|
| No. Case | No. Control | Mean | SD | |
| CA UG | 1,586 | 1,047 | 79.2 | 13.5 |
| MADCaP Network | 405 | 396 | 95.7 | 4.6 |
| NCI-MD | 383 | 395 | 77.3 | 10.2 |
Additional files
Download links
A two-part list of links to download the article, or parts of the article, in various formats.
Downloads (link to download the article as PDF)
Open citations (links to open the citations from this article in various online reference manager services)
Cite this article (links to download the citations from this article in formats compatible with various reference manager tools)
Validation of a multi-ancestry polygenic risk score and age-specific risks of prostate cancer: A meta-analysis within diverse populations
eLife 11:e78304.
https://doi.org/10.7554/eLife.78304


