Glycine inhibits NINJ1 membrane clustering to suppress plasma membrane rupture in cell death
- Program in Neuroscience and Mental Health, Hospital for Sick Children, Canada
- Centre of Molecular Inflammation Research, Department of Clinical and Molecular Medicine, Faculty of Medicine and Health Sciences, Norwegian University of Science and Technology, Norway
- Program in Cell Biology, Hospital for Sick Children, Canada
- Division of Gastroenterology, Boston Children's Hospital and Harvard Medical School, United States
- Ragon Institute of MGH, MIT and Harvard, United States
- Department of Anesthesia and Pain Medicine, Hospital for Sick Children, Canada
- Department of Anesthesiology and Pain Medicine, University of Toronto, Canada
Figures
Figure 1 with 2 supplements
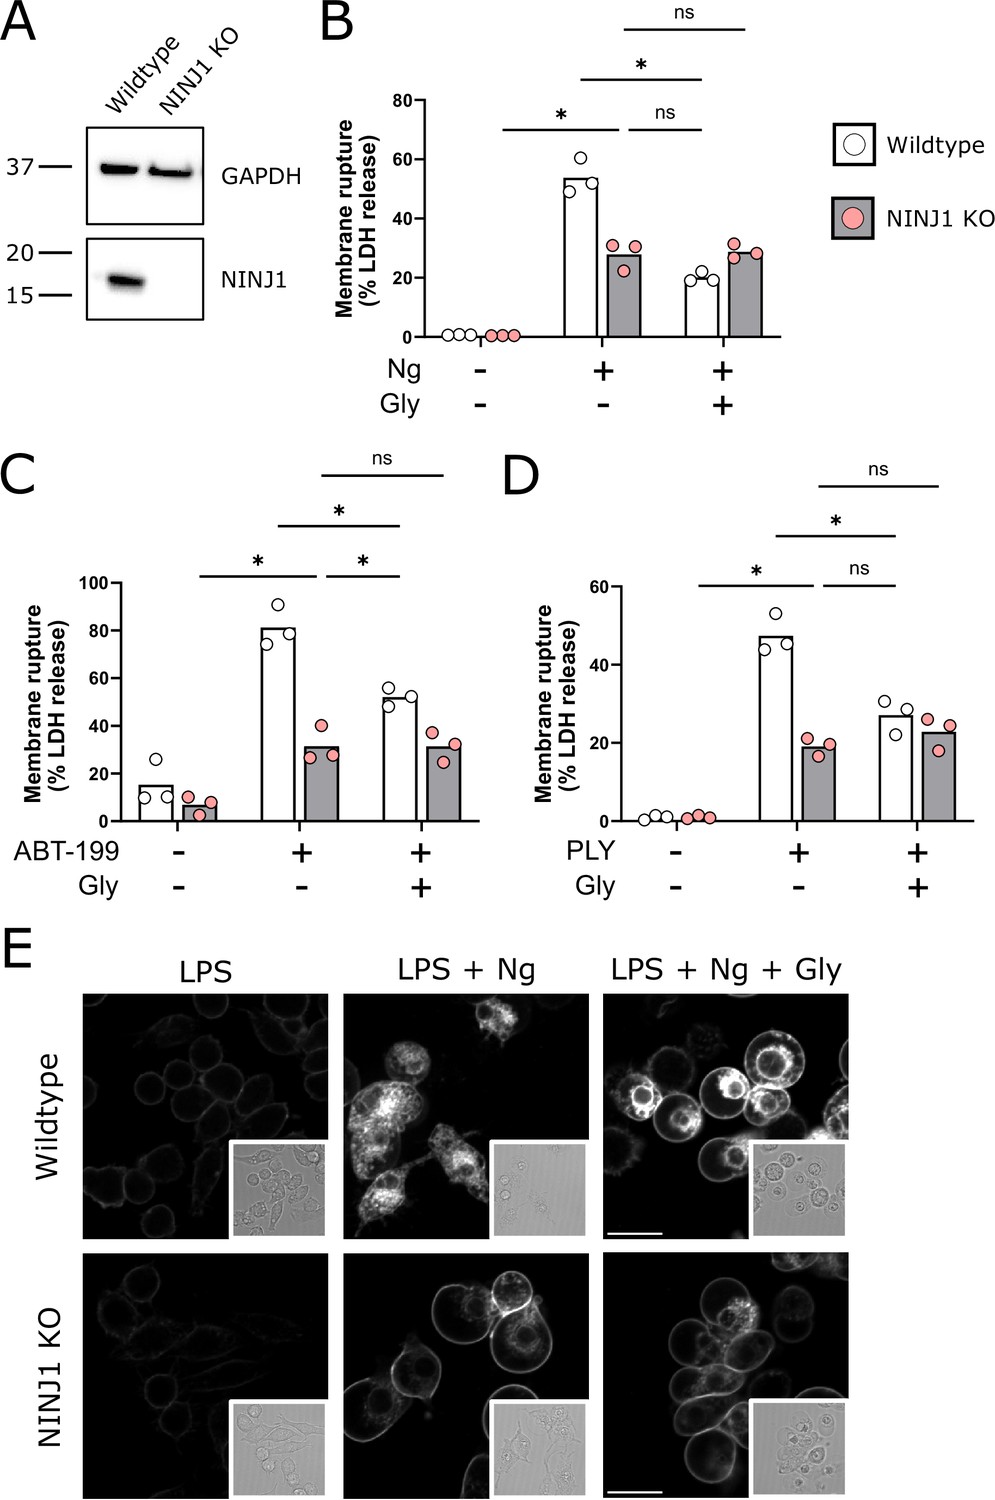
NINJ1 knockout functionally and morphologically phenocopies glycine cytoprotection.
(A) Immunoblot analysis demonstrating NINJ1 knockout in immortalized bone marrow-derived macrophage (iBMDM). GAPDH(glyceraldehyde-3-phosphate dehydrogenase) is presented as a loading control. (B–D) Wildtype and NINJ1 knockout iBMDM were induced to undergo pyroptosis (LPS + nigericin), post-apoptosis lysis (secondary necrosis; venetoclax, ABT-199), or necrosis (pneumolysin) with or without 5 mM glycine treatment. Cytotoxicity was evaluated by measuring the levels of LDH in the supernatant. Cytotoxicity decreased in glycine-treated wildtype cells comparably to NINJ1 knockout across each of (B) pyroptosis, (C) post-apoptosis lysis, and (D) necrosis. Glycine treatment of NINJ1 KO cells provided no additional protection to knockout cells treated without glycine. Data are expressed as supernatant LDH as a % of total LDH from lysates and supernatants, from n = 3 independent experiments for each cell death type. Individual data points are shown along with their mean. * p<0.05 by ANOVA with Tukey’s multiple comparison correction. (E) LPS-primed wildtype iBMDM induced to undergo pyroptosis in the presence of glycine demonstrate similar plasma membrane ballooning to NINJ1 knockout iBMDM induced to undergo pyroptosis. Membrane ballooning is shown in live cells labeled with the plasma membrane dye FM4-64. The corresponding brightfield image is shown in the inset. Scale bar 15 µm.
-
Figure 1—source data 1
Numerical values for experimental data plotted in Figure 1.
- https://cdn.elifesciences.org/articles/78609/elife-78609-fig1-data1-v3.xlsx
Figure 1—figure supplement 1
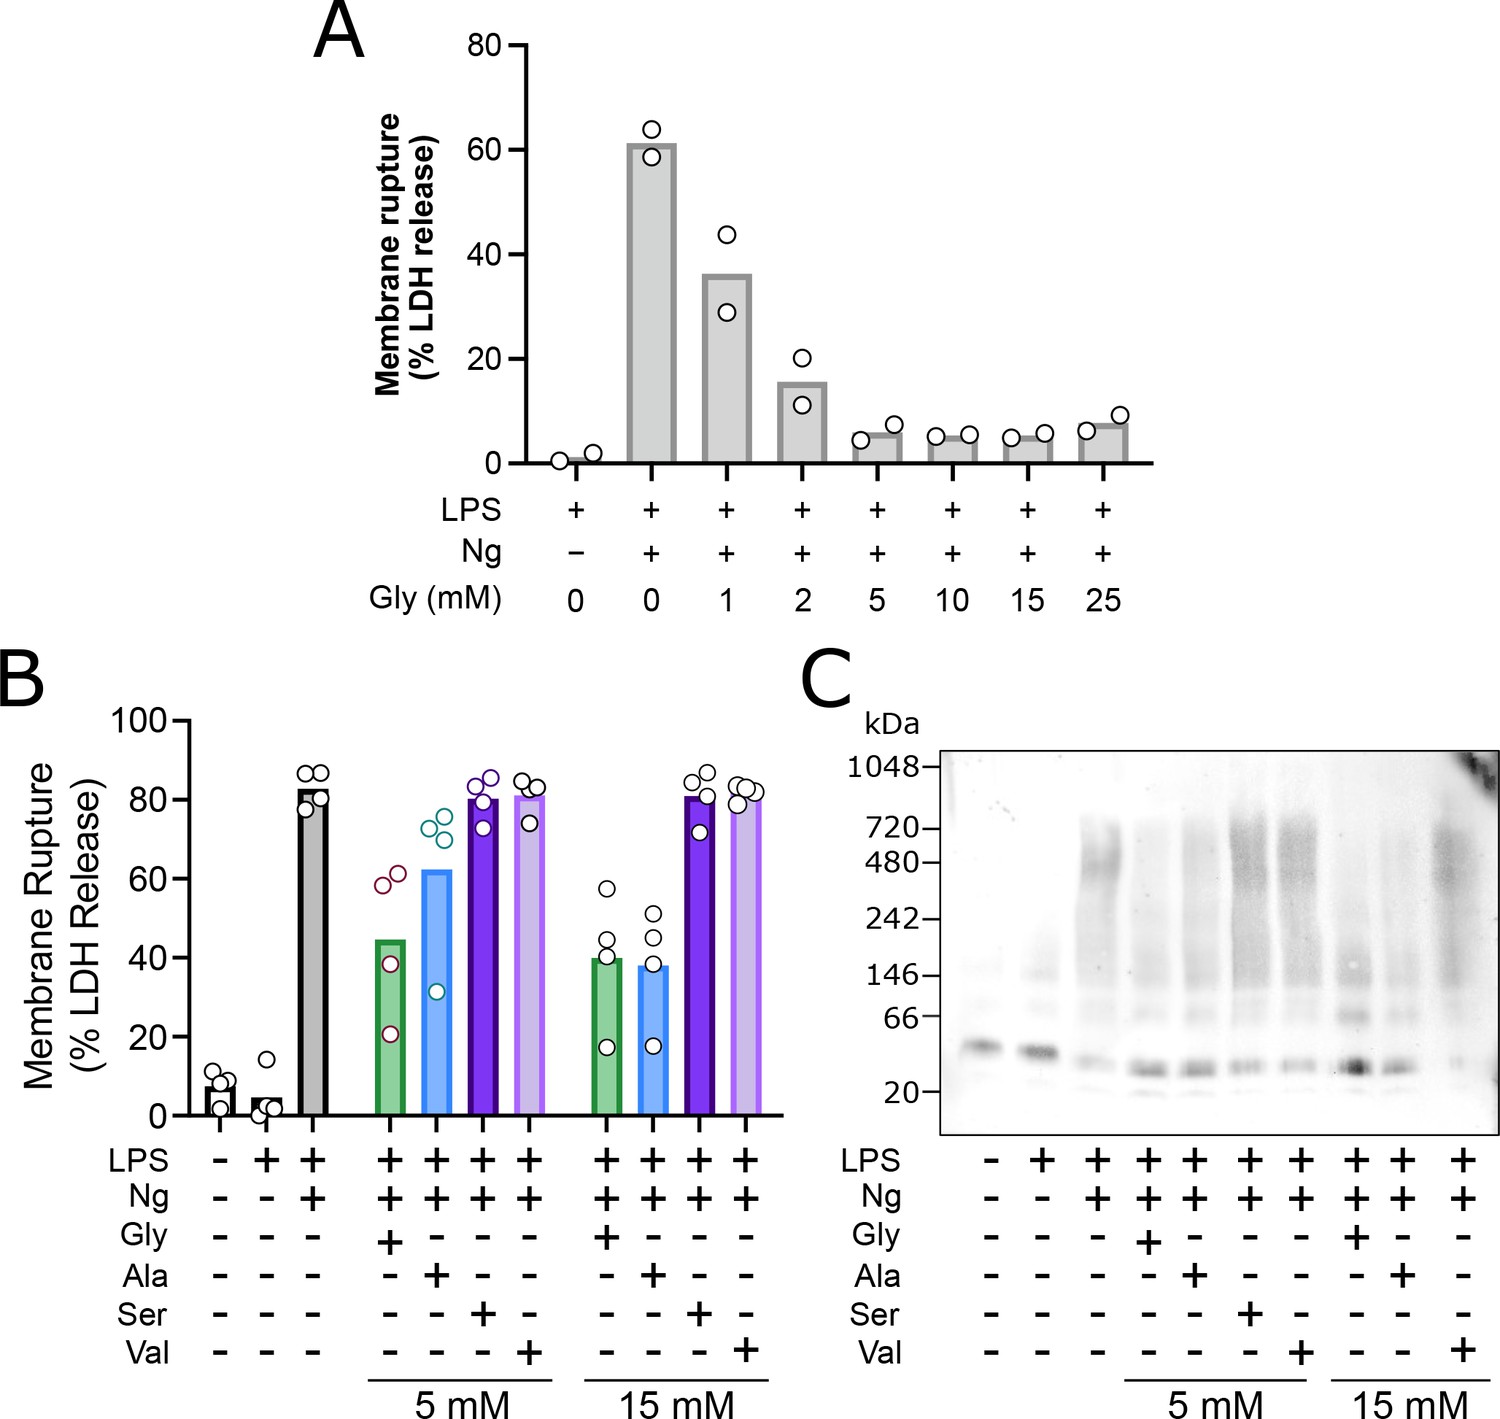
Glycine dose-dependently inhibits rupture of pyroptotic mouse macrophages with greater potency than structurally similar amino acids through inhibition of NINJ1 clustering.
Primary LPS-primed mouse bone marrow-derived macrophage (BMDM) were treated for 90 min with increasing concentrations of glycine or the indicated concentrations of alanine, serine, or valine prior to induction of pyroptosis with nigericin as described in the main text. Supernatant LDH levels were measured 30 min later as a marker of cytotoxicity. (A) Glycine dose-dependently inhibits rupture of pyroptotic mouse BMDM with an IC50 between 1 and 2 mM, consistent with the published literature (Loomis et al., 2019). Experiment done in duplicate. (B) Glycine confers greater cytoprotection compared with alanine >> serine, valine as measured by LDH release. (C) BN-PAGE for NINJ1 shows that amino acid treatment limits NINJ1 aggregation in pyroptosis with a similar hierarchy of glycine > alanine > serine, valine.
-
Figure 1—figure supplement 1—source data 1
Numerical values for experimental data plotted in Figure 1—figure supplement 1.
- https://cdn.elifesciences.org/articles/78609/elife-78609-fig1-figsupp1-data1-v3.xlsx
Figure 1—figure supplement 2
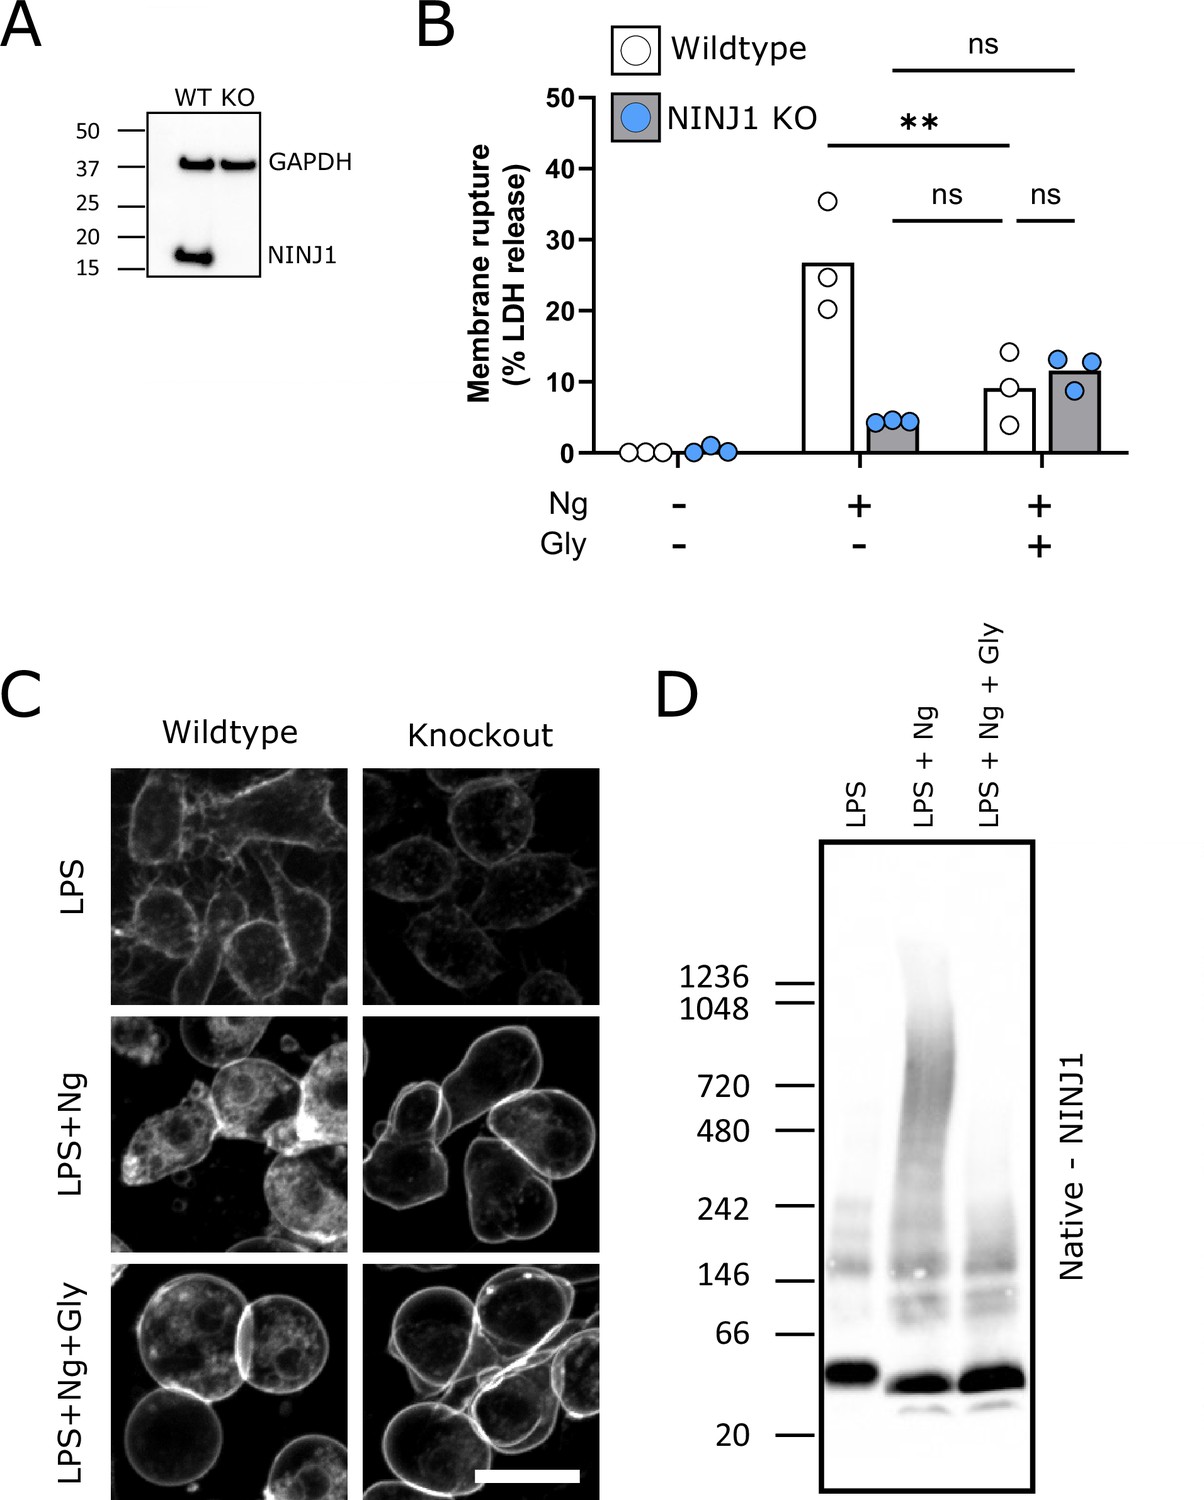
Glycine cytoprotection phenocopies NINJ1 knockout and prevents NINJ1 aggregation in a mouse macrophage cell line.
Using a CRISPR-Cas9 system, Ninj1 was knocked out of a RAW mouse macrophage cell line engineered to constitutively express ASC (RAW-ASC) and therefore have the capacity to undergo pyroptosis. (A) Western blot demonstrating NINJ1 knockout compared with the parental line. GAPDH is shown as a loading control. (B) Wildtype and NINJ1 knockout cells were induced to undergo pyroptosis with LPS + nigericin treatment with or without glycine. Supernatant LDH was evaluated as a marker of cytotoxicity by colorimetric assay. Cytotoxicity was decreased in glycine-treated (5 mM) wildtype cells comparably to NINJ1 knockout. Glycine (5 mM) treatment of NINJ1 KO cells provided no additional protection to knockout cells without glycine. * p<0.05 by two-sided ANOVA with Tukey’s multiple comparison correction. (C) LPS-primed wildtype RAW-ASC induced to undergo pyroptosis in the presence of glycine demonstrate similar plasma membrane ballooning to NINJ1 knockout RAW-ASC cells induced to undergo pyroptosis. Membrane ballooning is shown in live cells labeled with the plasma membrane dye FM4-64. Scale bar 20 µm. (D) Native-PAGE analysis of endogenous NINJ1 in RAW-ASC macrophages demonstrates a shift to high molecular weight aggregate upon pyroptosis stimulation, which is abrogated by glycine treatment.
-
Figure 1—figure supplement 2—source data 1
Numerical values for experimental data plotted in Figure 1—figure supplement 2.
- https://cdn.elifesciences.org/articles/78609/elife-78609-fig1-figsupp2-data1-v3.xlsx
Figure 2 with 3 supplements

NINJ1 silencing in primary human monocyte-derived macrophages (hMDMs) functionally and morphologically phenocopies glycine cytoprotection.
Primary hMDMs were treated with siRNA targeting NINJ1 (siNINJ1) or non-targeted control (siCtrl). (A) Wildtype and NINJ1-silenced hMDMs were LPS-primed and induced to undergo pyroptosis (nigericin) with or without 50 mM glycine. LDH release in the supernatants was measured to assess cytotoxicity. Cytotoxicity was reduced in glycine-treated wildtype cells, as well as in NINJ1-silenced cells. Glycine treatment did not yield additional protection from pyroptotic cell death in NINJ1-silenced cells. Data are expressed as % of LDH in supernatant from siCtrl-treated cells stimulated to undergo pyroptosis from n=4 independent donors. Data points from each donor are shown along with their mean and SD. **** p<0.0001 by two-way ANOVA with Tukey’s multiple comparison correction. (B) Nigericin- and glycine-treated LPS-primed wildtype hMDMs show similar ballooning morphology as nigericin-treated LPS-primed NINJ1-silenced hMDMs. Membrane ballooning is shown in live cells labeled with the plasma membrane dye FM1-43. The corresponding brightfield image is shown in the inset. Scale bar 20 μm.
-
Figure 2—source data 1
Numerical values for experimental data plotted in Figure 2.
- https://cdn.elifesciences.org/articles/78609/elife-78609-fig2-data1-v3.xlsx
Figure 2—figure supplement 1
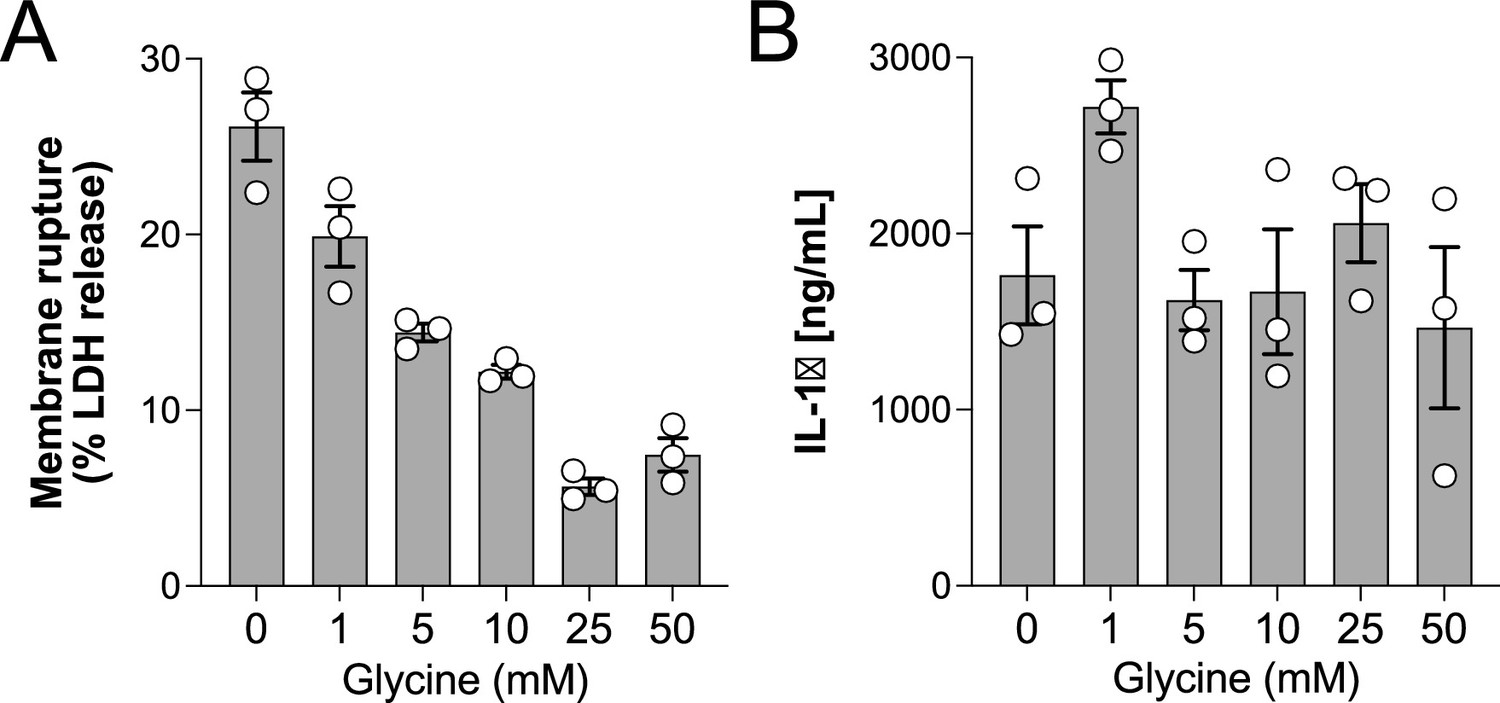
Glycine dose-dependently inhibits rupture of pyroptotic human monocyte-derived macrophages (hMDMs).
Primary human macrophages were pre-incubated with increasing doses of glycine and primed with LPS (1 µg/mL) for 3 hr before addition of nigericin (20 µM). Levels of LDH and IL-1β in supernatants were measured 2 hr later as described in the main text. Experiment done in triplicate.
-
Figure 2—figure supplement 1—source data 1
Numerical values for experimental data plotted in Figure 2—figure supplement 1.
- https://cdn.elifesciences.org/articles/78609/elife-78609-fig2-figsupp1-data1-v3.xlsx
Figure 2—figure supplement 2
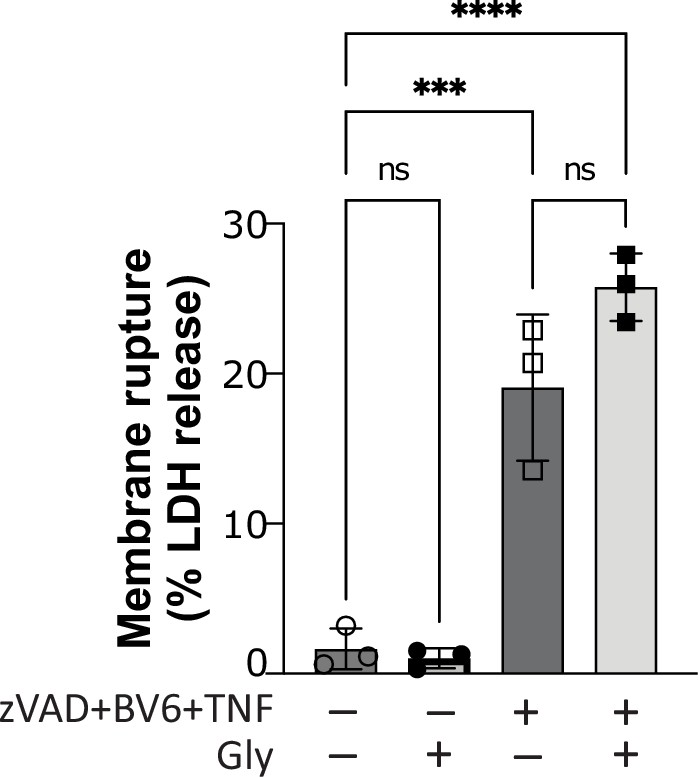
Glycine does not confer cytoprotection in necroptotic human macrophages.
Primary human macrophages pre-treated or not with glycine (50 mM), pan-caspase inhibitor zVAD (25 µM), and SMAC mimetic BV6 (10 µM) for 30 min before stimulation with TNF (10 ng/mL). Supernatant LDH levels were measured 4 hr later as a measure of cytotoxicity. **** p<0.0001, *** p<0.001 by two-way ANOVA with Tukey’s multiple comparison correction. ns = not significant.
-
Figure 2—figure supplement 2—source data 1
Numerical values for experimental data plotted in Figure 2—figure supplement 2.
- https://cdn.elifesciences.org/articles/78609/elife-78609-fig2-figsupp2-data1-v3.xlsx
Figure 2—figure supplement 3

Glycine preserves membrane integrity but not cell viability in human macrophages undergoing pyroptosis.
Human monocyte-derived macrophages (hMDMs) were either left untreated or pre-treated with glycine (50 mM) and primed with 1 μg/mL LPS before stimulation with nigericin (20.7 µM). To assay cell viability, the mitochondrial membrane potential sensitive dye tetramethylrhodamine ethyl ester (TMRE) perchlorate was added, and images were taken every 30 min overnight. (A) Representative images of TMRE staining (green) from two independent experiments where the second includes CellTracker Deep Red dye as a cellular marker (red, lower panel). Scale bars 100 µm. (B) TMRE intensity decreases, and cells die prior to ballooning in cells undergoing pyroptosis (30 min between images shown, except last image which shows the same cell at 18 hr). (C) Frequency of TMRE positive cells, (D) LDH release, and (E) ATP content at indicated time points. Results from two to three independent experiments are shown in (C–E) with different symbols for individual donors.
-
Figure 2—figure supplement 3—source data 1
Numerical values for experimental data plotted in Figure 2—figure supplement 3.
- https://cdn.elifesciences.org/articles/78609/elife-78609-fig2-figsupp3-data1-v3.xlsx
Figure 3 with 1 supplement
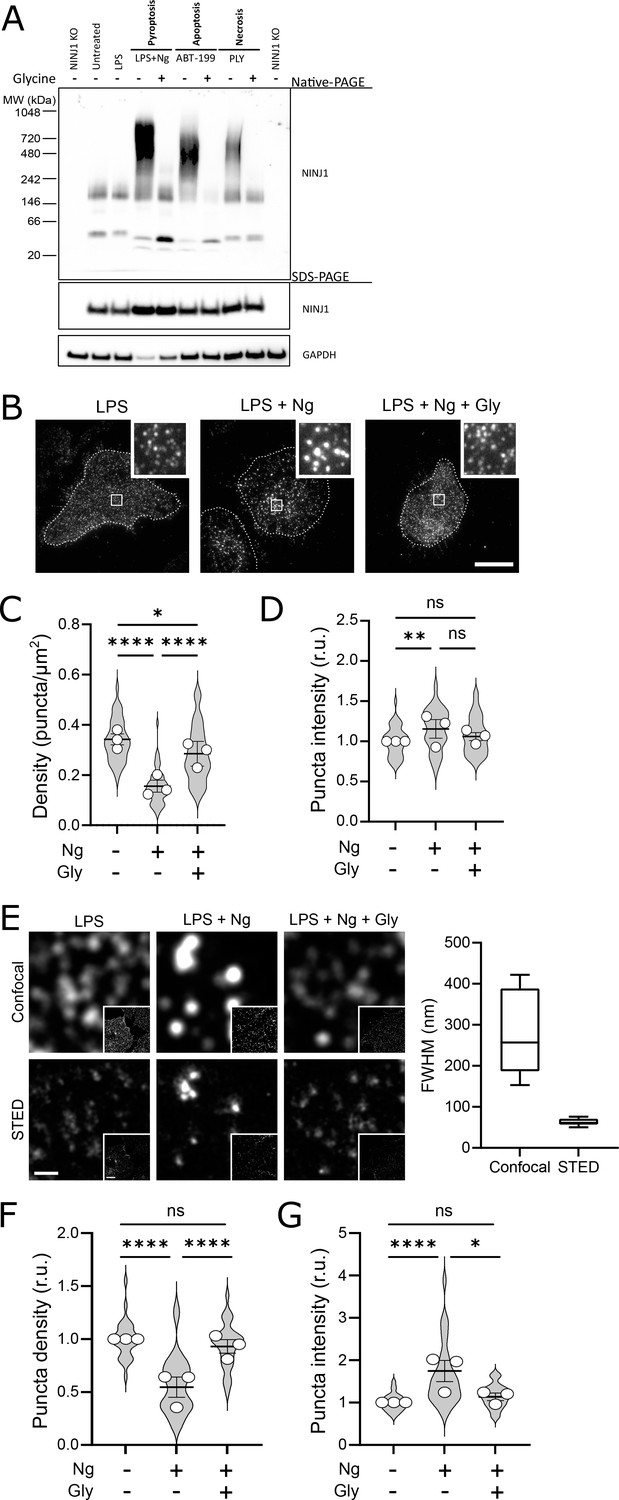
Glycine targets NINJ1 oligomerization to prevent membrane rupture in primary mouse macrophages.
(A) Primary bone marrow-derived macrophage (BMDM) was induced to undergo pyroptosis (nigericin), apoptosis (venetoclax, ABT-199), or necrosis (pneumolysin) with or without glycine treatment. Native-PAGE analysis of endogenous NINJ1 demonstrates a shift to high molecular weight aggregate upon cell death stimulation, which is abrogated by glycine treatment. (B) Total internal reflection microscopy of NINJ1 in LPS-primed primary BMDM reveals that endogenous NINJ1 resides in discrete puncta within the plasma membrane. Cell membrane outline (dotted white line) was determined using fluorescently labeled cholera toxin subunit B (not shown) as a plasma membrane marker. Scale bar 20 µm. Inset shows magnified area demarcated by the white box. Anti-mouse NINJ1 antibody validation for immunofluorescence is provided in Figure 3—figure supplement 1. Quantification of the density (C) and mean fluorescence intensity (D) of NINJ1 puncta in LPS-primed primary macrophages at baseline or stimulated to undergo pyroptosis (nigericin 20 µM for 30 min) without or with glycine (5 mM). NINJ1 puncta become less dense and brighter upon pyroptosis induction, consistent with NINJ1 plasma membrane clustering. Glycine limits this redistribution. Violin plot of NINJ1 puncta density from three pooled independent experiments. Data points superimposed on the violin plots are the mean NINJ1 puncta densities for the three independent experiments (10–23 cells measured per replicate with >675 NINJ1 puncta identified per replicate). Bars represent mean ± SEM of the NINJ1 densities for the n=3 independent experiments. * p<0.05, ** p<0.01, and **** p<0.0001 by Kruskal–Wallis test with Dunn’s multiple comparison correction. (E) Representative confocal (top) and stimulated emission depletion (STED; bottom) images of LPS-primed primary mouse bone marrow-derived macrophage (BMDM) at baseline or stimulated to undergo pyroptosis (nigericin 20 µM for 30 min) without or with glycine (5 mM). Full-width at half maximum of identified NINJ1 puncta shows a resolution of 271±98 nm and 63±8 nm (mean ± SD) for standard confocal and STED microscopy, respectively. Scale bar 0.5 µm; inset scale bar 20 µm. (F–G) Quantification of the normalized NINJ1 puncta density (F) and mean fluorescence intensity (G) from the STED images. The NINJ1 puncta become less dense with a corresponding increase in fluorescence intensity upon pyroptosis induction, consistent with NINJ1 plasma membrane clustering. Glycine limits these effects. Violin plot of the individual NINJ1 puncta from three pooled independent experiments (8–14 cells per replicate with >4964 NINJ1 puncta identified per replicate). Bars represent mean ± SEM of the NINJ1 densities for the n=3 independent experiments. * p<0.05 and **** p<0.0001 by Kruskal–Wallis test with Dunn’s multiple comparison correction.
-
Figure 3—source data 1
Numerical values for experimental data plotted in Figure 3.
- https://cdn.elifesciences.org/articles/78609/elife-78609-fig3-data1-v3.xlsx
Figure 3—figure supplement 1
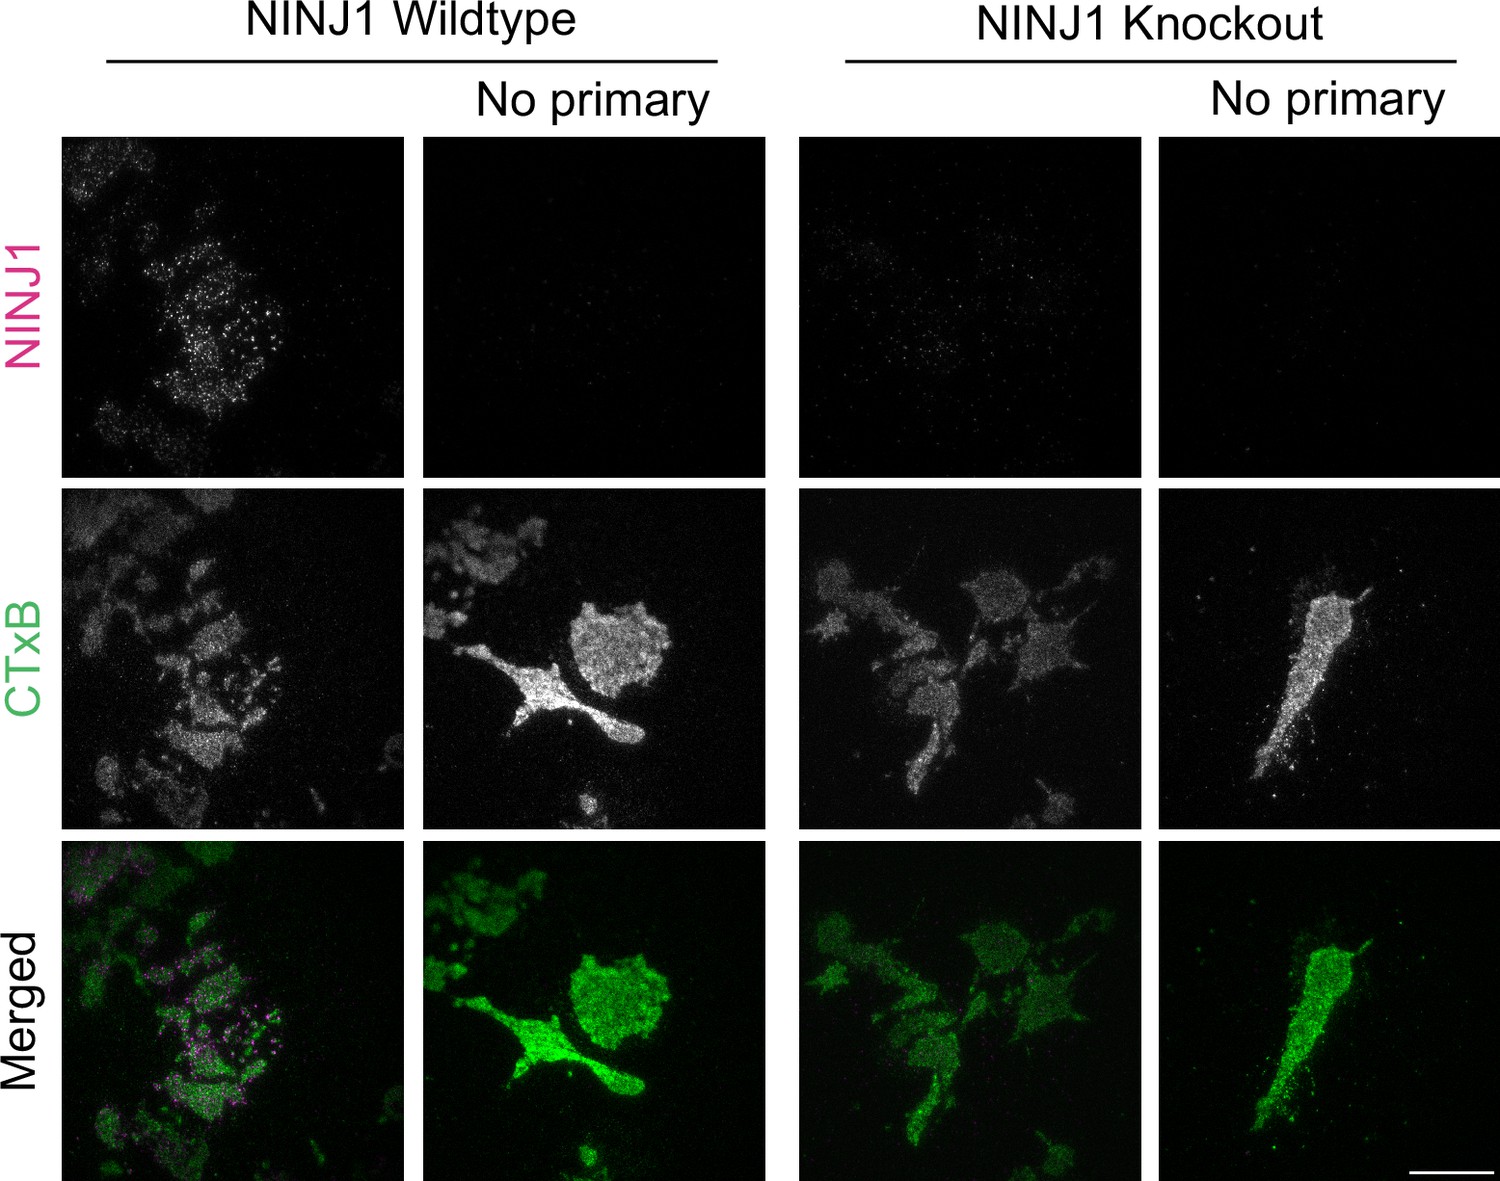
Rabbit anti-mouse NINJ1 monoclonal antibody validation.
Wildtype and Ninj1 knockout primary mouse bone marrow-derived macrophage (BMDM) were fixed and stained with or without the rabbit anti-mouse NINJ1 monoclonal antibody as described in the main text prior to imaging by total internal reflection fluorescence (TIRF) microscopy. The cell plasma membrane was stained using fluorescent cholera toxin subunit B (CTxB). Scale bar 15 μm.
Figure 4 with 2 supplements
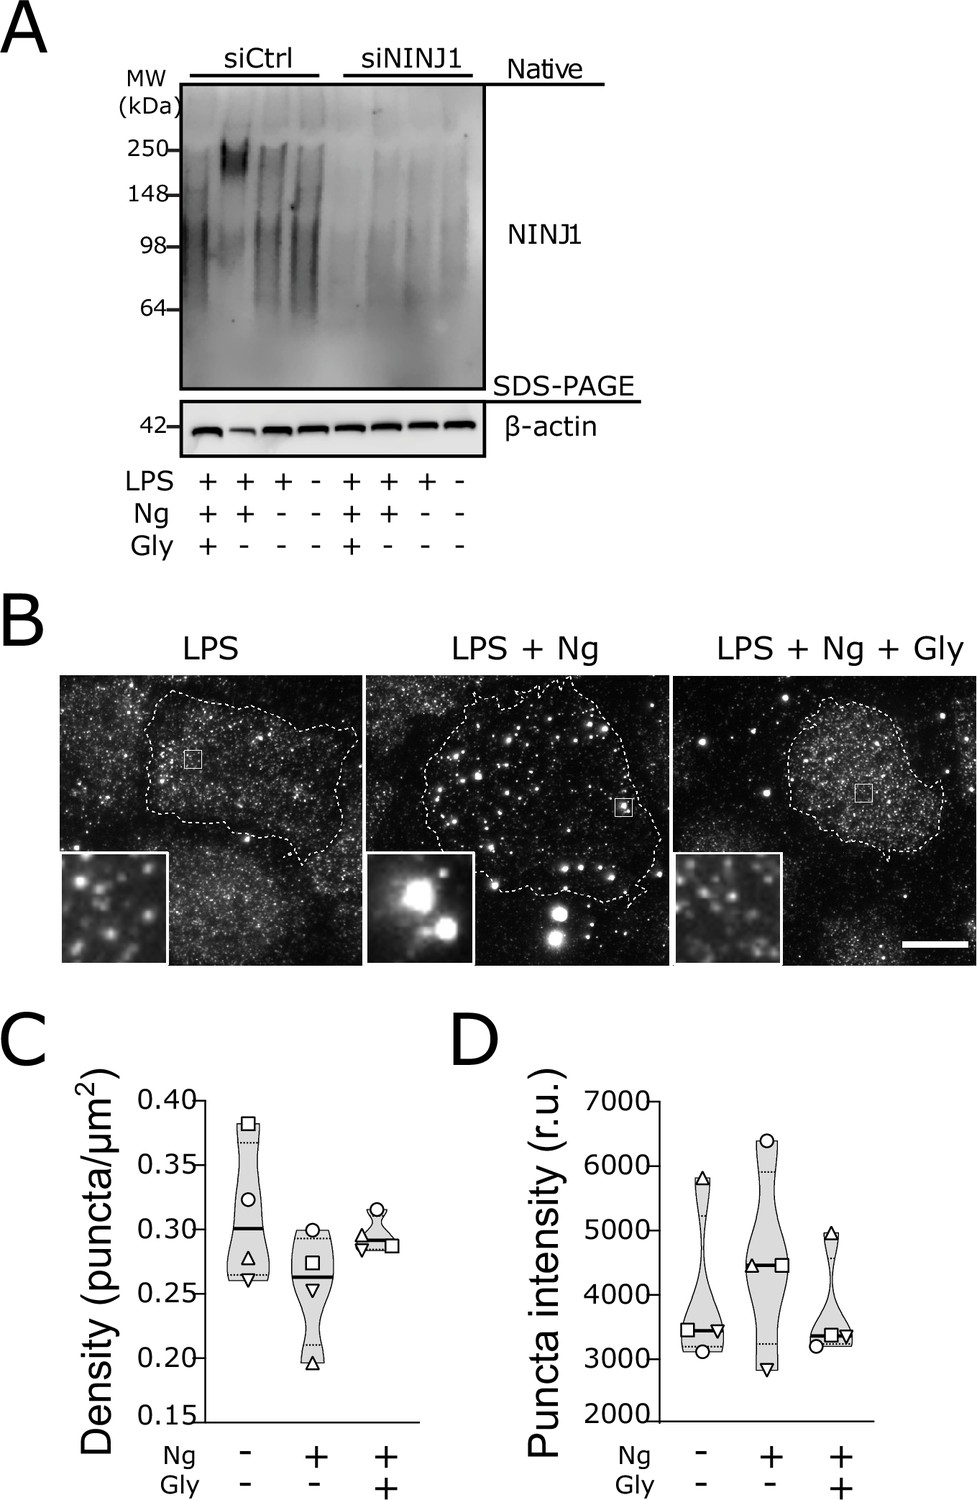
Glycine targets NINJ1 oligomerization to prevent membrane rupture in primary human macrophages.
(A) Native-PAGE analysis of endogenous NINJ1 from human monocyte-derived macrophages (hMDMs) stimulated to undergo pyroptosis displays a shift to higher molecular weight, which is abrogated by glycine treatment. NINJ1 levels are almost absent in siNINJ1-treated cells (quantification in Figure 4—figure supplement 2A), and no shift is seen after LPS and nigericin treatment. (B) Total internal reflection fluorescence (TIRF) microscopy of LPS-primed primary hMDMs shows endogenous NINJ1 in discrete plasma membrane puncta. Cell membrane outline (dotted white line) was determined using fluorescently labeled cholera toxin subunit B (not shown) as a plasma membrane marker. Scale bar 20 μm. Anti-human NINJ1 antibody validation for immunofluorescence is provided in Figure 4—figure supplement 1. Quantification of the NINJ1 puncta density (C) and fluorescence intensity (D) in LPS-primed hMDMs at baseline or stimulated to undergo pyroptosis (nigericin 20.7 μM for 2 hr) without or with glycine (50 mM). Violin plot of NINJ1 puncta density and intensity quantified from images of cells from four independent donors. Mean of NINJ1 puncta densities from three cells per donor per condition shown as superimposed datapoints (different symbols are used for individual donors) along with median and quartiles for each condition.
-
Figure 4—source data 1
Numerical values for experimental data plotted in Figure 4.
- https://cdn.elifesciences.org/articles/78609/elife-78609-fig4-data1-v3.xlsx
Figure 4—figure supplement 1
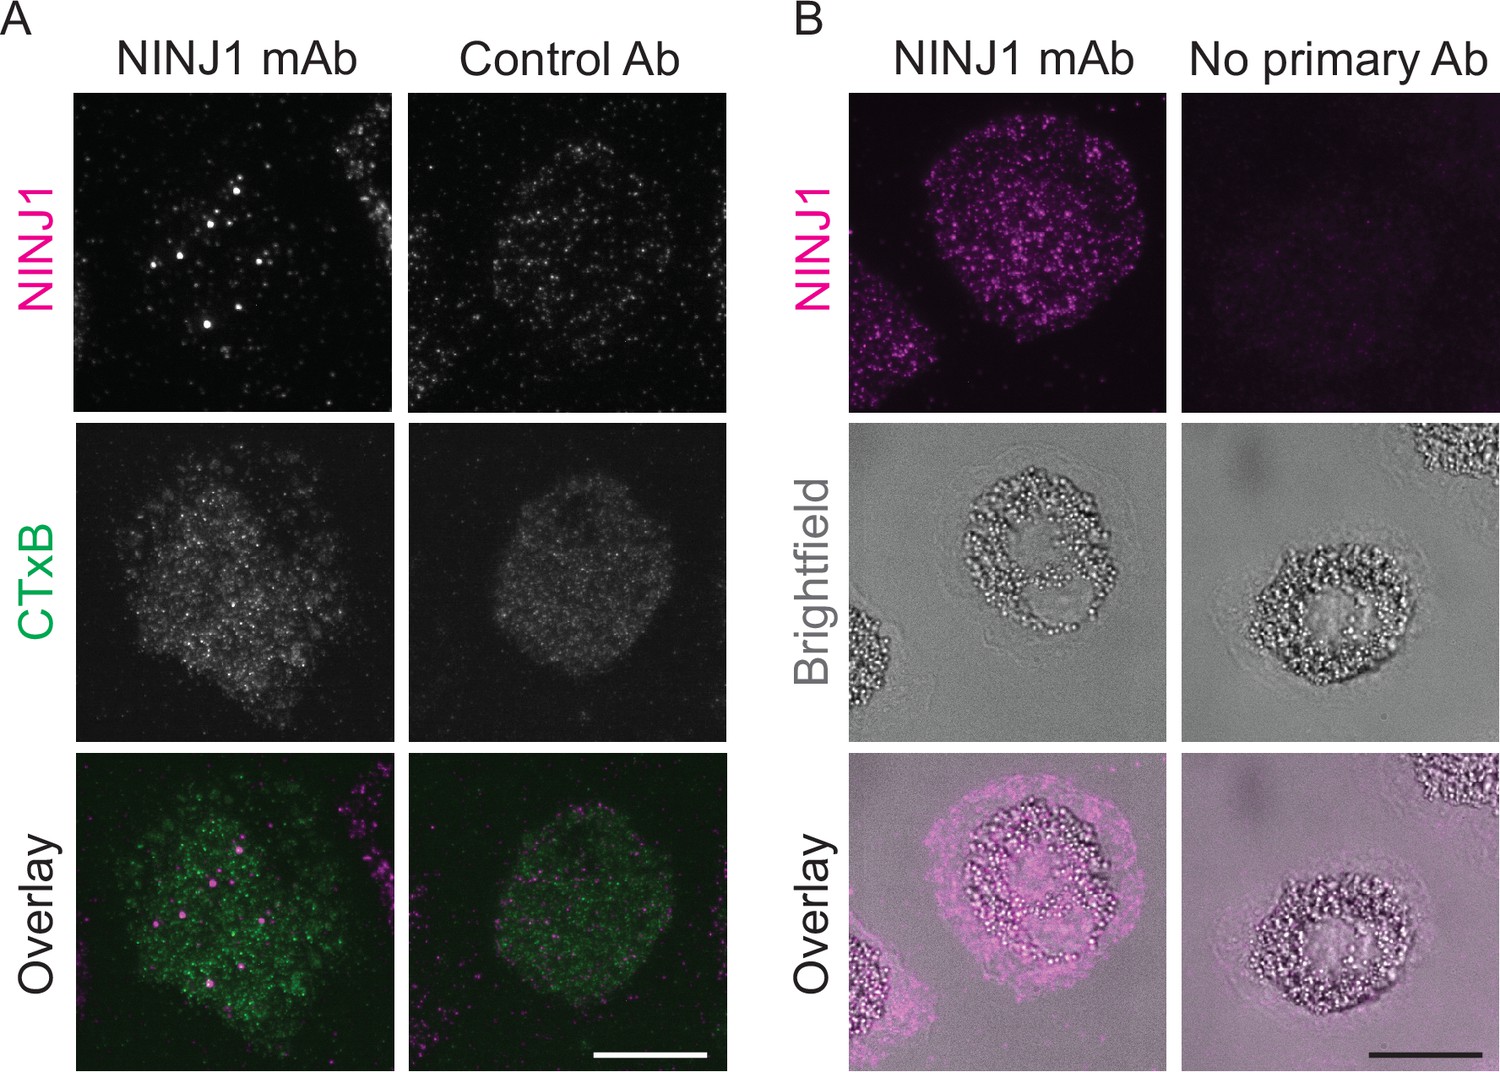
Mouse anti-human NINJ1 monoclonal antibody validation.
LPS and nigericin treated human monocyte-derived macrophages (hMDMs) were fixed and stained with the indicated antibodies as described in the main text prior to imaging by total internal reflection fluorescence (TIRF) microscopy. (A) Cells were stained with mouse anti-human NINJ1 (IgG2b) Ab or a control Ab (mouse IgG2a) followed by fluorescent rabbit anti-mouse Ab. The cell plasma membrane was stained using fluorescent cholera toxin subunit B (CTxB). (B) In a separate experiment, cells were stained with mouse anti-human NINJ1 (IgG2b) Ab or no primary Ab, followed by fluorescent rabbit anti-mouse Ab. Scale bars 20 μm.
Figure 4—figure supplement 2

Glycine prevents NINJ1 aggregation and pyroptotic lysis in induced pluripotent stem-cell (iPSC) derived human macrophages (iPSDMs) without affecting IL-1β secretion.
(A) Quantification of NINJ1 native-PAGE signal from unstimulated human monocyte-derived macrophage (hMDM) lysates confirm NINJ1 silencing in siNINJ1-treated cells compared to siCtrl-treated cells. (B–D) iPSDMs were LPS-primed and stimulated to undergo pyroptosis with nigericin in the presence or absence of 50 mM glycine. (B) Native-PAGE analysis of endogenous NINJ1 in iPSDMs display a shift to higher molecular weight when cells are stimulated to undergo pyroptosis, which is abrogated by glycine pretreatment. (C) LDH release was measured in the supernatants to assess cell rupture and was reduced with glycine co-treatment. Data are expressed as % of LDH in supernatant from LPS and nigericin-treated cells in n=3 independent experiments. Data points from each experiment is shown along with their mean and SD. (D) IL-1β release from pyroptotic cells was not altered by the presence of glycine. Data points from three technical replicates from one experiment are shown along with their mean and SD.
-
Figure 4—figure supplement 2—source data 1
Numerical values for experimental data plotted in Figure 4—figure supplement 2.
- https://cdn.elifesciences.org/articles/78609/elife-78609-fig4-figsupp2-data1-v3.xlsx
Figure 5 with 2 supplements
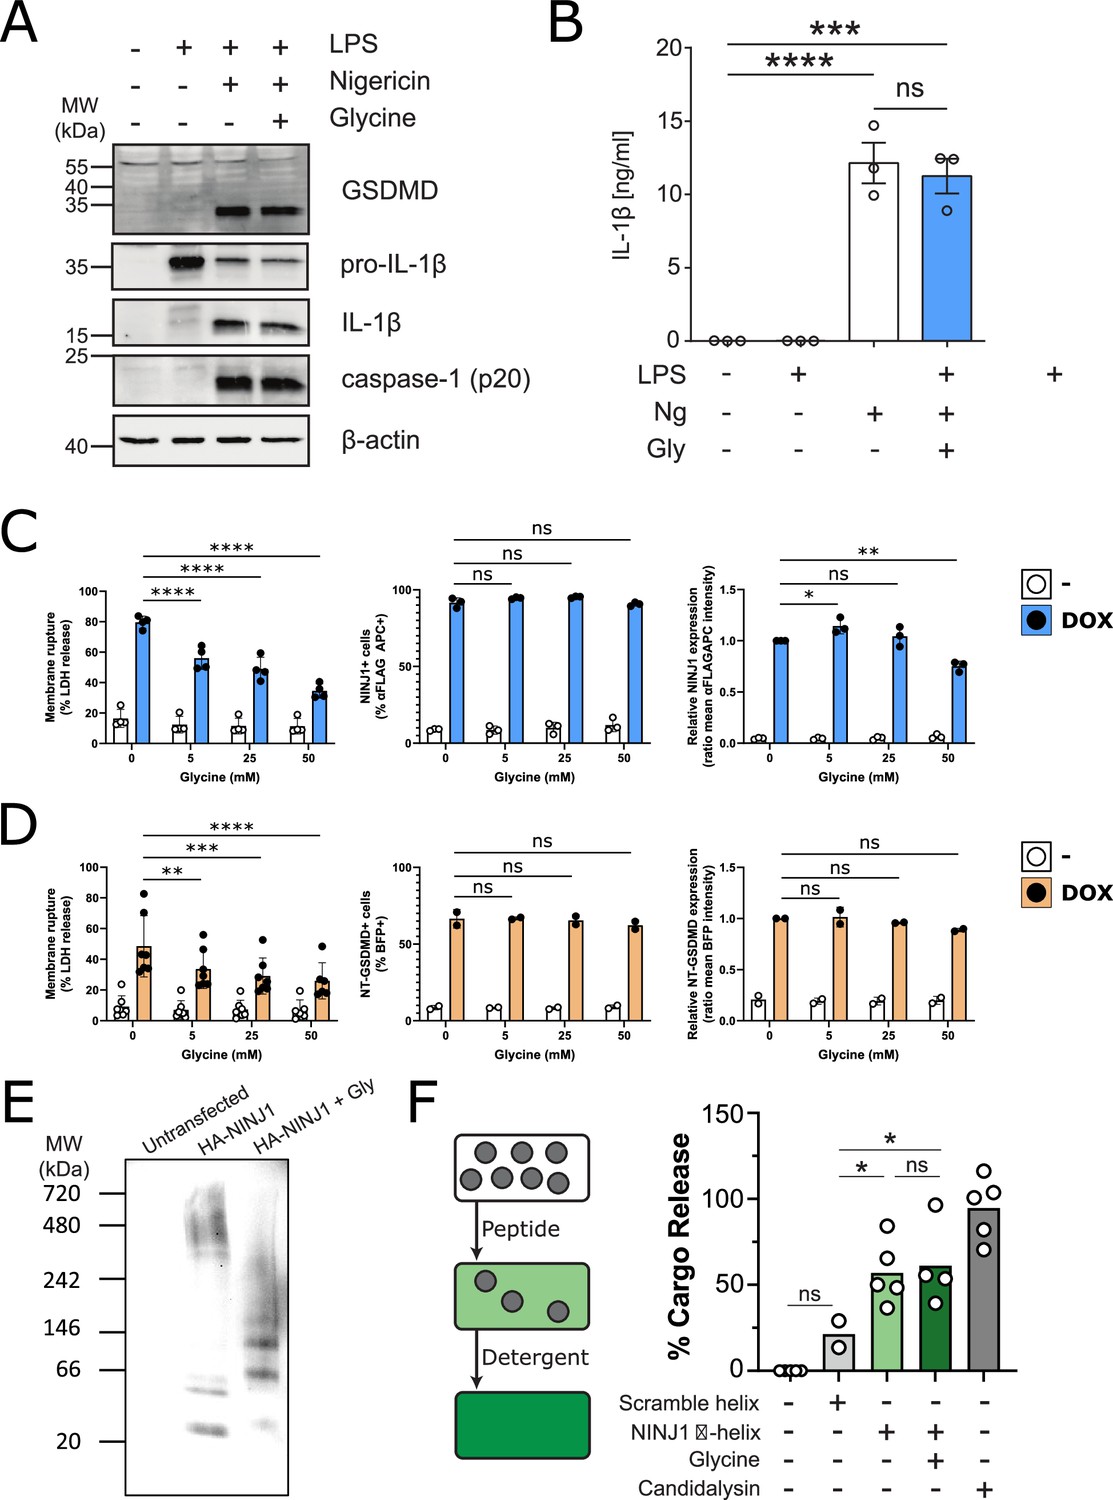
Glycine inhibits NINJ1 clustering but not upstream pyroptosis signaling to confer cytoprotection.
(A–B) Wildtype immortalized bone marrow-derived macrophage (iBMDM) was primed with 1 μg/mL LPS for 4 hr or left unprimed before stimulation of primed cells with 20 μM nigericin for 2 hr in the presence or absence of 5 mM glycine. (A) Processing of GSDMD, caspase-1, and IL-1β was assessed by western blot. (B) Release of IL-1β into the cell culture supernatant was quantified by ELISA. ELISA results show mean ± SEM of three independent experiments. Western blots are representative of three independent experiments. ***p<0.001 and ****p<0.0001 by one-way ANOVA with Tukey’s multiple comparison correction. (C–D) Glycine dose-dependently inhibits plasma membrane rupture in mouse macrophages overexpressing NINJ1 or the N-terminal fragment of GSDMD. iBMDMs with doxycycline-inducible expression of FLAG-tagged NINJ1 (C) or the N-terminal fragment of GSDMD fused to BFP(blue fluorescent protein) (D) were incubated with 2 µg/mL doxycycline and increasing concentrations of glycine for 12 hr or 8 hr, respectively, before analyses of cell rupture (LDH release) and protein expression. Left: LDH release in supernatants relative to full lysis controls. Middle: frequencies of NINJ1-FLAG-positive or GSDMD-NT-BFP-positive cells. Right: surface expression of NINJ1-FLAG or GSDMD-NT-BFP by mean fluorescence intensity. * p<0.05, **p<0.01, ***p<0.001, and ****p<0.0001 by two-sided ANOVA with Tukey’s multiple comparison correction. (E) HeLa cells were transiently transfected with HA-tagged mouse NINJ1 in the presence or absence of glycine (5 mM). Native-PAGE analysis of ectopically expressed NINJ1 demonstrates a shift to high molecular weight aggregate, which is abrogated by glycine treatment. (F) Large unilamellar vesicles (LUVs; gray circles) were made containing 25 mM carboxyfluorescein (CF) at which the CF fluorescence self-quenches. NINJ1 α-helix peptide (corresponding to amino acids 40–69 of human NINJ1) is added to the LUV suspension. Ruptured LUV release CF, which no longer self-quenches. The resulting increase in fluorescence is monitored using a spectrofluorometer. Detergent is added to rupture all remaining liposomes to capture the maximum attainable fluorescence. LUV rupture by N-terminus NINJ1 α-helix without and with glycine (50 mM), scrambled NINJ1 α-helix peptide, or the cytolytic yeast peptide candidalysin compared to vehicle. Glycine does not prevent LUV rupture by the N-terminal NINJ1 α-helix. * p<0.05 by ANOVA with Tukey’s multiple comparison correction.
-
Figure 5—source data 1
Numerical values for experimental data plotted in Figure 5.
- https://cdn.elifesciences.org/articles/78609/elife-78609-fig5-data1-v3.xlsx
Figure 5—figure supplement 1
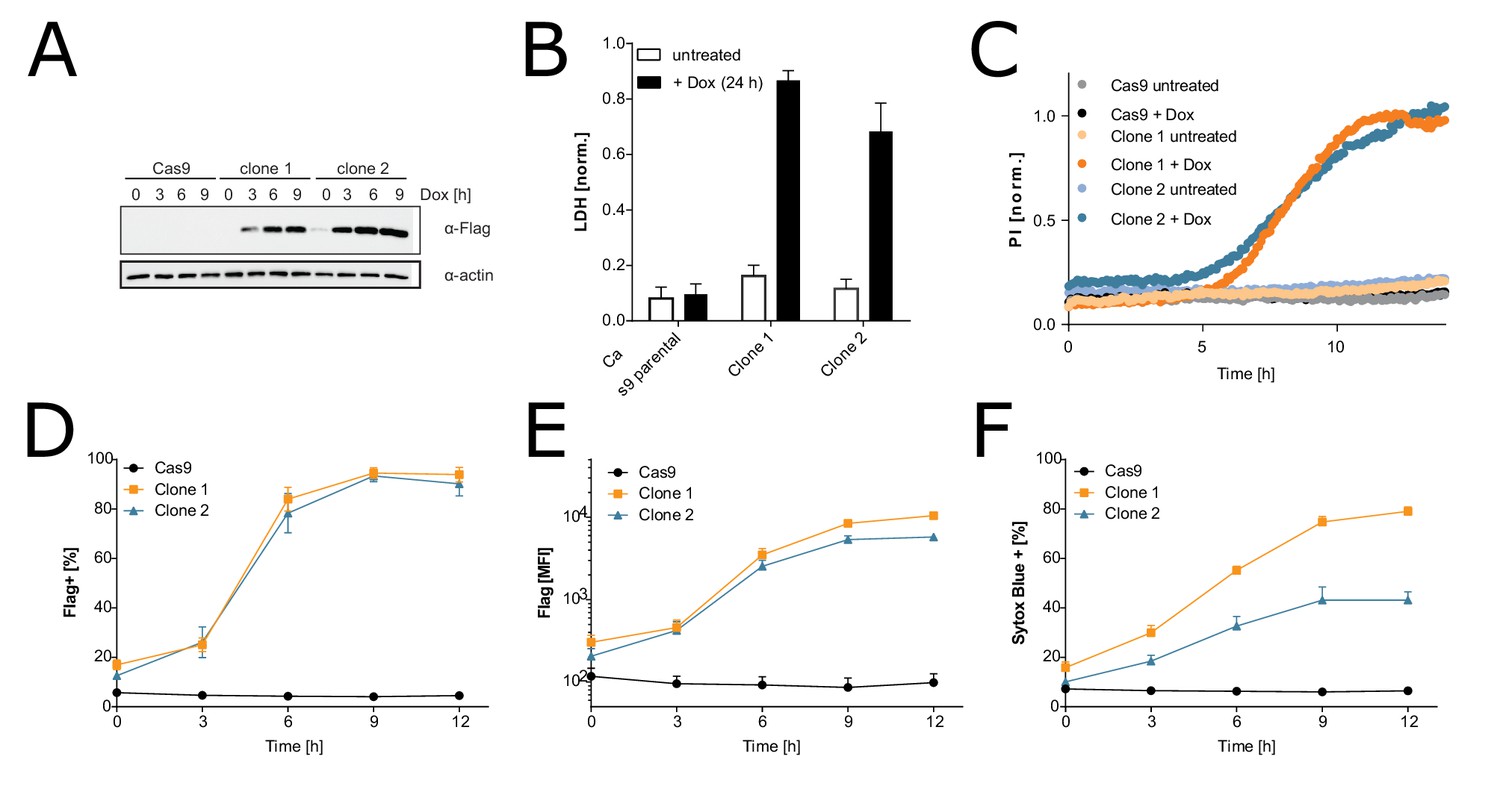
Characterization of the inducible immortalized bone marrow-derived macrophage (iBMDM)-doxy-moNINJ1 system.
Two clonal cell lines expressing FLAG-NINJ1 under a doxy-inducible promoter or the parental Cas9 + iBMDM cell line were treated with 2 µg/mL of doxycycline for the indicated times. (A) Expression of FLAG-NINJ1 in whole cell lysates was analyzed by western blot. (B) Cell membrane rupture was assessed by LDH assay. (C) Membrane permeabilization over time was analyzed by PI(propidium iodide) staining. (D–F) Cell surface expression of FLAG-NINJ1 and plasma membrane permeabilization (Sytox Blue positive) was analyzed by flow cytometry.
-
Figure 5—figure supplement 1—source data 1
Numerical values for experimental data plotted in Figure 5—figure supplement 1.
- https://cdn.elifesciences.org/articles/78609/elife-78609-fig5-figsupp1-data1-v3.xlsx
Figure 5—figure supplement 2

Circular dichroism (CD) spectroscopy of human NINJ1 peptide reveals a stable α-helical secondary structure insensitive to glycine.
(A) CD spectrum of NINJ1 amino acids 40–69 (HYASKKSAAESMLDIALLMANASQLKAVVE) shows the characteristic pattern of an α-helix with two downward deflections at 207 nm and 222 nm. (B) CD spectra of the human NINJ1 α-helix co-incubated with glycine titrated between 0 and 20 mM indicate that the helical secondary structure is generally insensitive to glycine.
-
Figure 5—figure supplement 2—source data 1
Numerical values for experimental data plotted in Figure 5—figure supplement 2.
- https://cdn.elifesciences.org/articles/78609/elife-78609-fig5-figsupp2-data1-v3.xlsx
Author response image 1
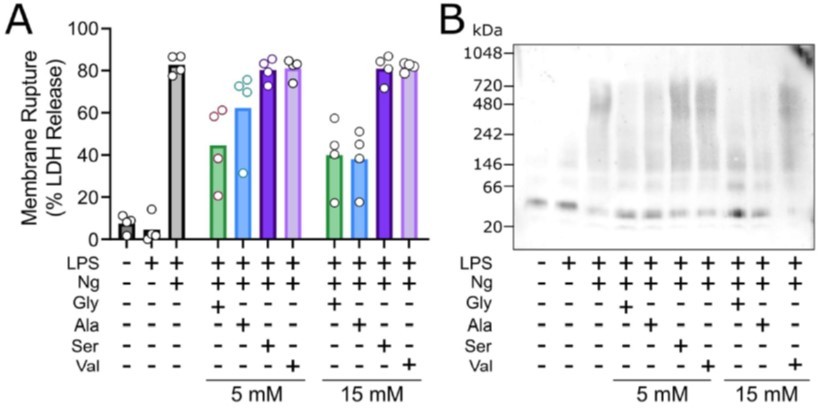
Glycine exhibits cytoprotection as compared to similar amino acisa through inhibition of NINK1 aggregation.
Primary wildtype bone marrow-derived macrophages where induced to undergo pyroptosis in the presence of glycine, alanine, serine or valine at either 5 or 15 mM. (A) Similar to the work of Loomis et al. (Cell Death and Disease 2019), glycine exhibits a greater extent of cytoprotection compared with alanine >> serine, valine as measured by LDH release. (B) BN-PAGE for NINJ1 shows that amino acid treatment limits NINJ1 aggregation in pyroptossi with a similar hierarchy glycine > alanine > serine, valine.
Tables
Appendix 1—key resources table
| Reagent type (species) or resource | Designation | Source or reference | Identifiers | Additional information |
|---|---|---|---|---|
| Gene (Mus musculus) | Ninj1 | GenBank | ID: 18081 | |
| Gene (Homo sapiens) | Ninj1 | GenBank | ID: 4814 | |
| Strain and strain background (Escherichia coli) | Stellar Competent Cells | TarakaBio | Strain HST08 | |
| Genetic reagent (Mus musculus) | Ninj1 knockout | Kayagaki et al., 2021 | C57Bl/6 strain background; Mixed-sex cohorts | |
| Cell line (Mus musculus) | RAW-asc | InvivoGen | raw-asc | |
| Cell line (Mus musculus) | iBMDM TET3G | Evavold et al., 2018 | ||
| Cell line (Mus musculus) | iBMDM inducible doxy-moNINJ1-FLAG | This paper | Jonathan Kagan laboratory; described in the Methods section | |
| Cell line (Mus musculus) | iBMDM inducible doxy-NT-GSDMD-BFP | Evavold et al., 2021 | ||
| Cell line (Homo sapiens) | HeLa | ATCC | CCL-2 | |
| Cell line (Homo sapiens) | Platinum GP | Cell biolabs | RV-103 | |
| Transfected construct (human) | siRNA to NINJ1 | Thermo Scientific | HSS107188, HSS107190, HSS181529 | 20 nM |
| Transfected construct (mouse) | HA-NINJ1 | This paper | Steinberg laboratory; described in the Methods section | |
| Biological sample (Mus musculus) | Primary bone marrow-derived macrophages (wildtype BMDM) | This paper | Freshly prepared from C57Bl/6 J mice; male and female donors; Steinberg laboratory | |
| Biological sample (Mus musculus) | Primary bone marrow-derived macrophages (Ninj1 KO BMDM) | This paper | Freshly prepared from Ninj1 knockout mice; male and female donors; Steinberg laboratory | |
| Biological sample (Homo sapiens) | Primary human macrophages (human MDM) | This paper | Female and male donors; information not disclosed; Flo laboratory | |
| Biological sample (Homo sapiens) | Induced pluripotent stem-cell (iPSC) derived macrophages (iPSDM) | This paper | iPSCs were obtained from European Bank for induced pluripotent Stem Cells; Male origin; Flo laboratory | |
| Antibody | Anti-human NINJ1 (Mouse monoclonal) | R&D Systems | MAB5105, RRID: AB_11128852 | Immunofluorescence: 10 µg/mL; Western blot: 2 µg/mL |
| Antibody | Anti-mouse NINJ1 (Rabbit monoclonal) | Other; Kayagaki et al., 2021 | Gift from Dr Vishva Dixit and Dr Nobuhiko Kayagaki (Genentech, Inc, South San Francisco, USA); 10 µg/mL | |
| Antibody | Anti-β-Actin (Rabbit monoclonal) | Cell Signaling Technology | 8457, RRID: AB_10950489 | Western blot: 1:1000 |
| Antibody | Anti-β-Actin (Mouse monoclonal) | Sigma | A5441; RRID: AB_476744 | Western blot 1:5000 |
| Antibody | Caspase-1 (Mouse monoclonal) | Adipogen | AG-20B-0042-C100; RRID: #AB_2755041 | Western blot 1:1000 |
| Antibody | Gasdermin D (Rabbit monoclonal) | Abcam | ab209845; RRID: #AB_2783550 | Western blot 1:1000 |
| Antibody | Anti-pro-IL1B (Rabbit polyclonal) | Genetex | GTX74034; RRID: #AB_378141 | Western blot 1:1000 |
| Antibody | Anti-HA (Rabbit monoclonal) | Cell Signaling Technology | 3724; RRID: AB_1549585 | Western blot: 1:1000 |
| Antibody | HRP conjugated anti-mouse IgG (H+L) (Goat polyclonal) | Jackson ImmunoResearch | 115-035-003 | Western blot: 1:3000 |
| Antibody | HRP conjugated anti-rabbit IgG (H+L) (Goat polyclonal) | Jackson ImmunoResearch | 111–035003 | Western blot: 1:3000 |
| Antibody | Anti-GAPDH (Rabbit polyclonal) | Santa Cruz Biotechnology | sc-25778; RRID: AB_10167668 | Western blot 1:1000 |
| Antibody | Anti-GAPDH (Mouse monoclonal) | Cell Signaling Technology | 97166; RRID: AB_2756824 | Western blot: 1:1000 |
| Antibody | Anti-FLAG APC (Mouse monoclonal) | Abcam | Ab72569; RRID: AB_1310127 | Flow cytometry 1:100 |
| Antibody | Rabbit anti-Mouse IgG (H+L) Recombinant Secondary Antibody, Alexa Fluor 647 (Rabbit polyclonal) | Invitrogen | A27029, RRID: AB_2536092 | 2 µg/mL |
| Antibody | Cy3-conjugated AffiniPure Donkey Anti-Rabbit IgG (H+L) (Donkey polyclonal) | Jackson ImmunoResearch | 711-165-152 | STED: 1:100; TIRF 1:1000 |
| Antibody | Mouse IgG2a isotype control (Mouse polyclonal) | Serotec | MCA929F; RRID: AB_322271 | 10 µg/mL |
| Recombinant DNA reagent | pRETROX-TRE3G | TakaraBio | 631188 | |
| Recombinant DNA reagent | pRETROX-TRE3G-Flag-NINJ1 | This paper. | Jonathan Kagan laboratory; described in the Methods section | |
| Recombinant DNA reagent | pMSCV-Flag-NINJ1 IRES EGFP | This paper. | Jonathan Kagan laboratory; described in the Methods section | |
| Recombinant DNA reagent | pCMV-VSVG | Addgene | Addgene #8454 | |
| Recombinant DNA reagent | NINJ1 (Myc-DDK tagged) cDNA clone | Origene | MR225037 | |
| Recombinant DNA reagent | pcDNA3.1-HA | Addgene | Addgene #128034 | |
| Peptide, recombinant protein | Human NINJ1 residues 40–69 | GenScript BioTech Corp | HYASKKSAA ESMLDIALLM ANASQLKAVVE | |
| Peptide, recombinant protein | Sequence-scrambled analog of human NINJ1 (residues 40–69) | GenScript BioTech Corp | IAAAAMKMY LANSLEHAK SLKVVLASQDS | |
| Peptide, recombinant protein | Candidalysin | Peptide Protein Research | SIIGIIMGILG NIPQVIQIIM SIVKAFKGNK | |
| Peptide, recombinant protein | TNF | PeproTech | 300–01 A | 10 ng/mL |
| Peptide, recombinant protein | Pneumolysin | Other | Gift from Dr John Brumell (The Hospital for Sick Children, Toronto, Canada) | |
| Peptide, recombinant protein | IL-3 | PeptroTech | 200–03 | 25 ng/mL |
| Peptide, recombinant protein | M-CSF | PeproTech | 300–25 | MDM: 10 ng/mL iPSDM: 100 ng/mL |
| Peptide, recombinant protein | VEGF | R&D Systems | 293-VE-050 | 50 ng/mL |
| Peptide, recombinant protein | SCF | R&D Systems | 255-SC-050 | 20 ng/mL |
| Peptide, recombinant protein | BMP-4 | R&D Systems | 315 BP-010 | 50 ng/mL |
| Peptide, recombinant protein | Cholera toxin subunit B Alexa Fluor 488 conjugate | Invitrogen | C34775 | 1 µg/mL |
| Commercial assay or kit | CyQuant LDH cytotoxicity assay kit | ThermoFisher Scientific | C20301 | |
| Commercial assay or kit | Human IL-1β ELISA | R&D Systems | DY201 | |
| Commercial assay or kit | Mouse IL-1β ELISA | Invitrogen | 88–7013 | |
| Commercial assay or kit | CellTiterGlo Luminescent Cell Viability Assay | Promega | G7570 | |
| Chemical compound and drug | Glycine | Sigma | G7126 or 67126 (Sigma); 104201 (Millipore) | |
| Chemical compound and drug | FM1-43 | Invitrogen | T3163 | 5 µg/mL |
| Chemical compound and drug | FM4-64 | Invitrogen | T3166 | 5 µg/mL |
| Chemical compound and drug | CellTracker Deep Red Dye | Invitrogen | C34565 | 0.5 µM |
| Chemical compound and drug | Tetramethylrhodamine ethyl ester perchlorate (TMRE) | Sigma | 87917 | 10 nM |
| Chemical compound and drug | 1,2-dioleoyl-sn-glycero-3-phosphocholine (DOPC) | Avanti Polar Lipids | #850375 | |
| Chemical compound and drug | 1,2-dioleoyl-sn-glycero-3-phospho-l-serine (DOPS) | Avanti Polar Lipids | #840035 | |
| Chemical compound and drug | zVAD | InvivoGen | tlrl-vad | 25 µM |
| Chemical compound and drug | BV6 | InvivoGen | inh-bv6 | 10 µM |
| Chemical compound and drug | Nigericin | InvivoGen or Sigma | tlrl-nig (InvivoGen); N7146 (Sigma) | 20 µM |
| Chemical compound and drug | ABT-199 | Tocris | 6960 | 25 µM |
| Chemical compound and drug | Lipopolysaccharide from E. coli serotype 0111:B4 or serotype O55:B5 (LPS) | Sigma | LPS25; L6529 | 0.5 or 1 µg/mL |
| Chemical compound and drug | Y-27632 | StemCell Technologies | 72302 | 10 µM |
| Chemical compound and drug | Doxycycline | Sigma | D3447 | 2 µg/mL |
| Software and algorithm | Imaris | Oxford Instruments | RRID: SCR_007370 | |
| Software and algorithm | FIJI v2.0.0 | imagej.net/ software/fiji | RRID: SCR_002285 | |
| Software and algorithm | CellProfiler v.4.2.4 | cellprofiler.org/ | RRID: SCR_007358 | |
| Software and algorithm | PRISM v8.3.1 or v9.0 | GraphPad Software Inc | RRID: SCR_002798 | |
| Other | ProLong Diamond Antifade Mountant | Invitrogen | P36961 | Mountant for immunofluorescnece studies as described in the Methods section |
Additional files
-
MDAR checklist
- https://cdn.elifesciences.org/articles/78609/elife-78609-mdarchecklist1-v3.docx
-
Source data 1
This file contains the images of the full western blots with the relevant bands used in the figures highlighted in boxes.
- https://cdn.elifesciences.org/articles/78609/elife-78609-data1-v3.zip
-
Source data 2
This file contains images of the full western blots used in the figures.
- https://cdn.elifesciences.org/articles/78609/elife-78609-data2-v3.zip
Download links
A two-part list of links to download the article, or parts of the article, in various formats.
Downloads (link to download the article as PDF)
Open citations (links to open the citations from this article in various online reference manager services)
Cite this article (links to download the citations from this article in formats compatible with various reference manager tools)
Glycine inhibits NINJ1 membrane clustering to suppress plasma membrane rupture in cell death
eLife 11:e78609.
https://doi.org/10.7554/eLife.78609


