Mapping the single-cell landscape of acral melanoma and analysis of the molecular regulatory network of the tumor microenvironments
- Department of Dermatology, The First Medical General Hospital of People's Liberation Army, China
- Beijing Institute of Genomics & China National Center for Bioinformation, Chinese Academy of Sciences, China
- University of Chinese Academy of Science, China
- Beijing Key Laboratory of Genome and Precision Medicine Technologies, China
- Senior Department of Orthopedics, The Fourth Medical Center of General Hospital of People’s Liberation Army, China
Figures
Figure 1 with 1 supplement
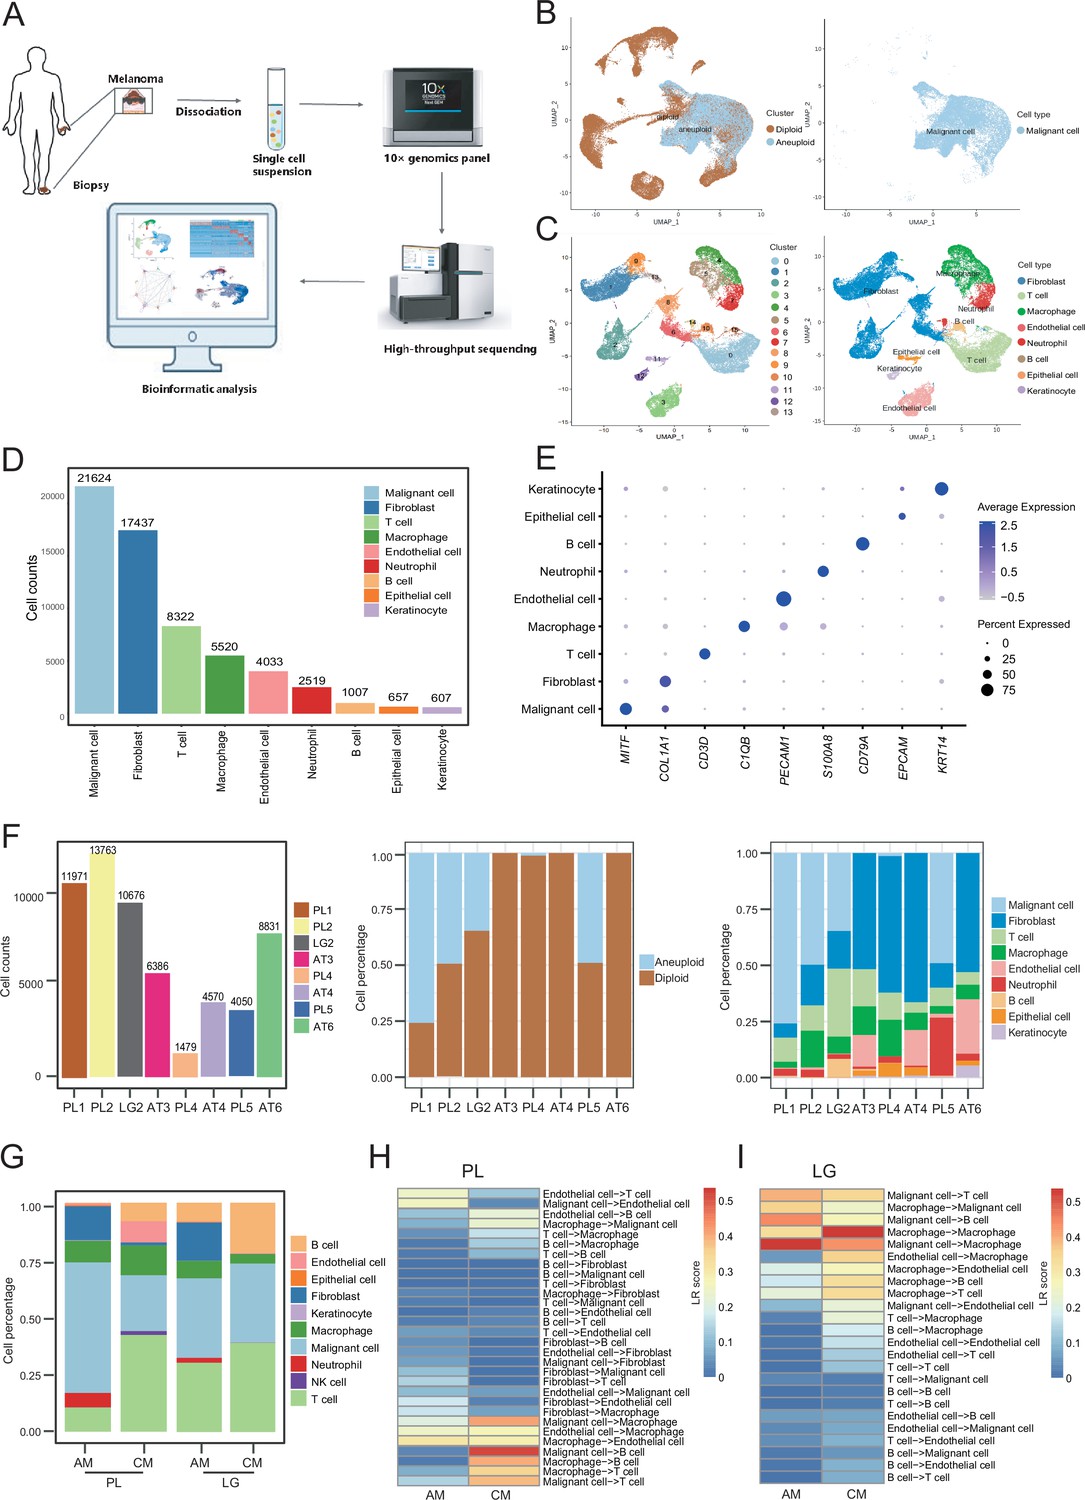
Cell composition and heterogeneity in acral melanomas (AMs).
(A) The technical route of this study, includes sample preparation, sequencing, and bioinformatics analytical process. (B) Uniform manifold approximation and projection(UMAP) plot showing the CopyKAT results. The brown dots indicate diploidy and the blue dots indicate aneuploid. The aneuploid cells are considered as malignant, while the diploid cells are considered as stromal cells. (C) UMAP plot of nonmalignant cells labeled by cell cluster and cell type. (D) Cell count bar plot of each cell type. Malignant cells were the most abundant among all cell types and fibroblasts were the most abundant cells among all stromal cells. (E) Marker gene expression of each cell type, including dot size and color representing the characteristics of gene expression (pct.exp) and average scaling expression (avg.exp.scale) values. (F) The bar plot depicts the cell number and the ratio of cell types per sample after quality control. (G) Differences in the proportion of cell types between AMs and cutaneous melanomas (CMs). (H) Differences in cell interactions in primary lesions (PLs) of AMs and CMs. (I) Differences in cell interactions in LGs of AM and CMs.
Figure 1—figure supplement 1
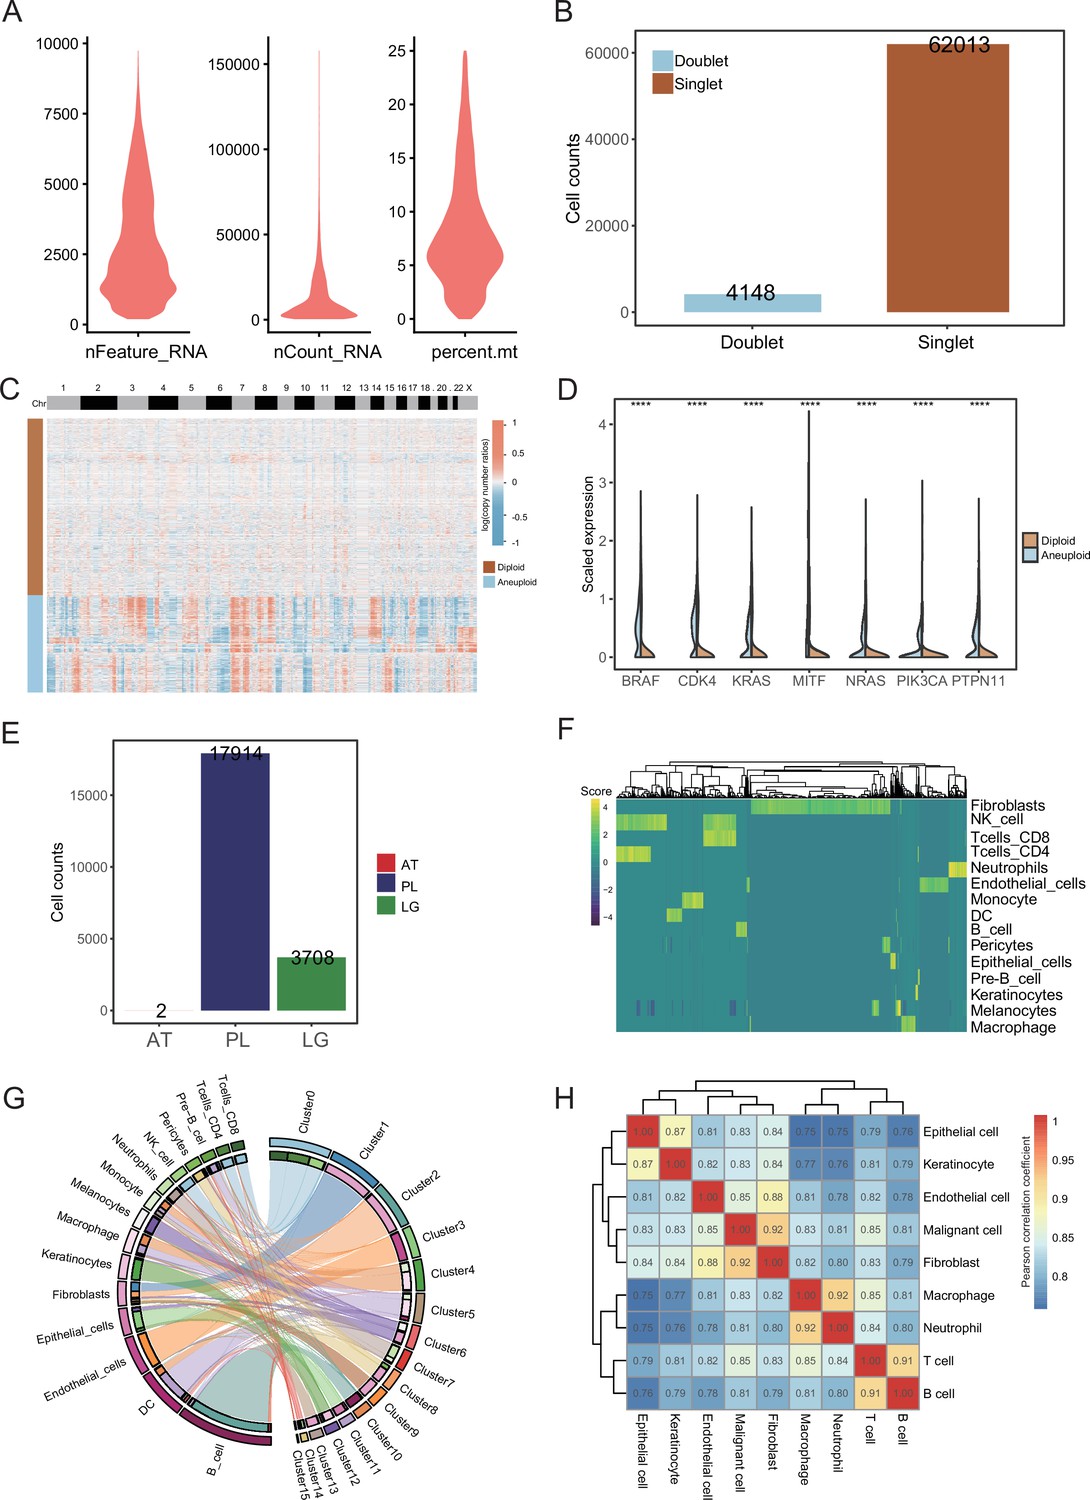
Data quality control and cell type annotation.
(A) Vlnplot of feature counts, unique molecular identifier (UMI) counts, and percentage of mitochondrial genes in cells after quality control. (B) Bar plot of doublet and singlet number. (C) Clustered heatmap of all cells copy number profiles estimated by CopyKAT. Warm colors represent the increase of copy number, while cold colors represent the loss of copy number. Columns represent genomic positions. In aneuploid cells, the copy number amplifications and deletions are more frequent: these are more consistent with the characteristics of malignant cells. (D) The aneuploid cells more highly expressed oncogenic markers than the diploid cells. ****p value < 0.0001. (E) The number of malignant cells of ATs, primary lesions (PLs), and lymph gland (LG). (F) Heatmap plot showing the SingleR result, higher score means higher Spearman correlations of the cells to be annotated with the expression levels of known cells in the reference set. (G) Chord diagram shows the correspondence between cell annotation results and cell cluster results. (H).Cell type Pearson’s correlation coefficient heatmap.
Figure 2 with 1 supplement
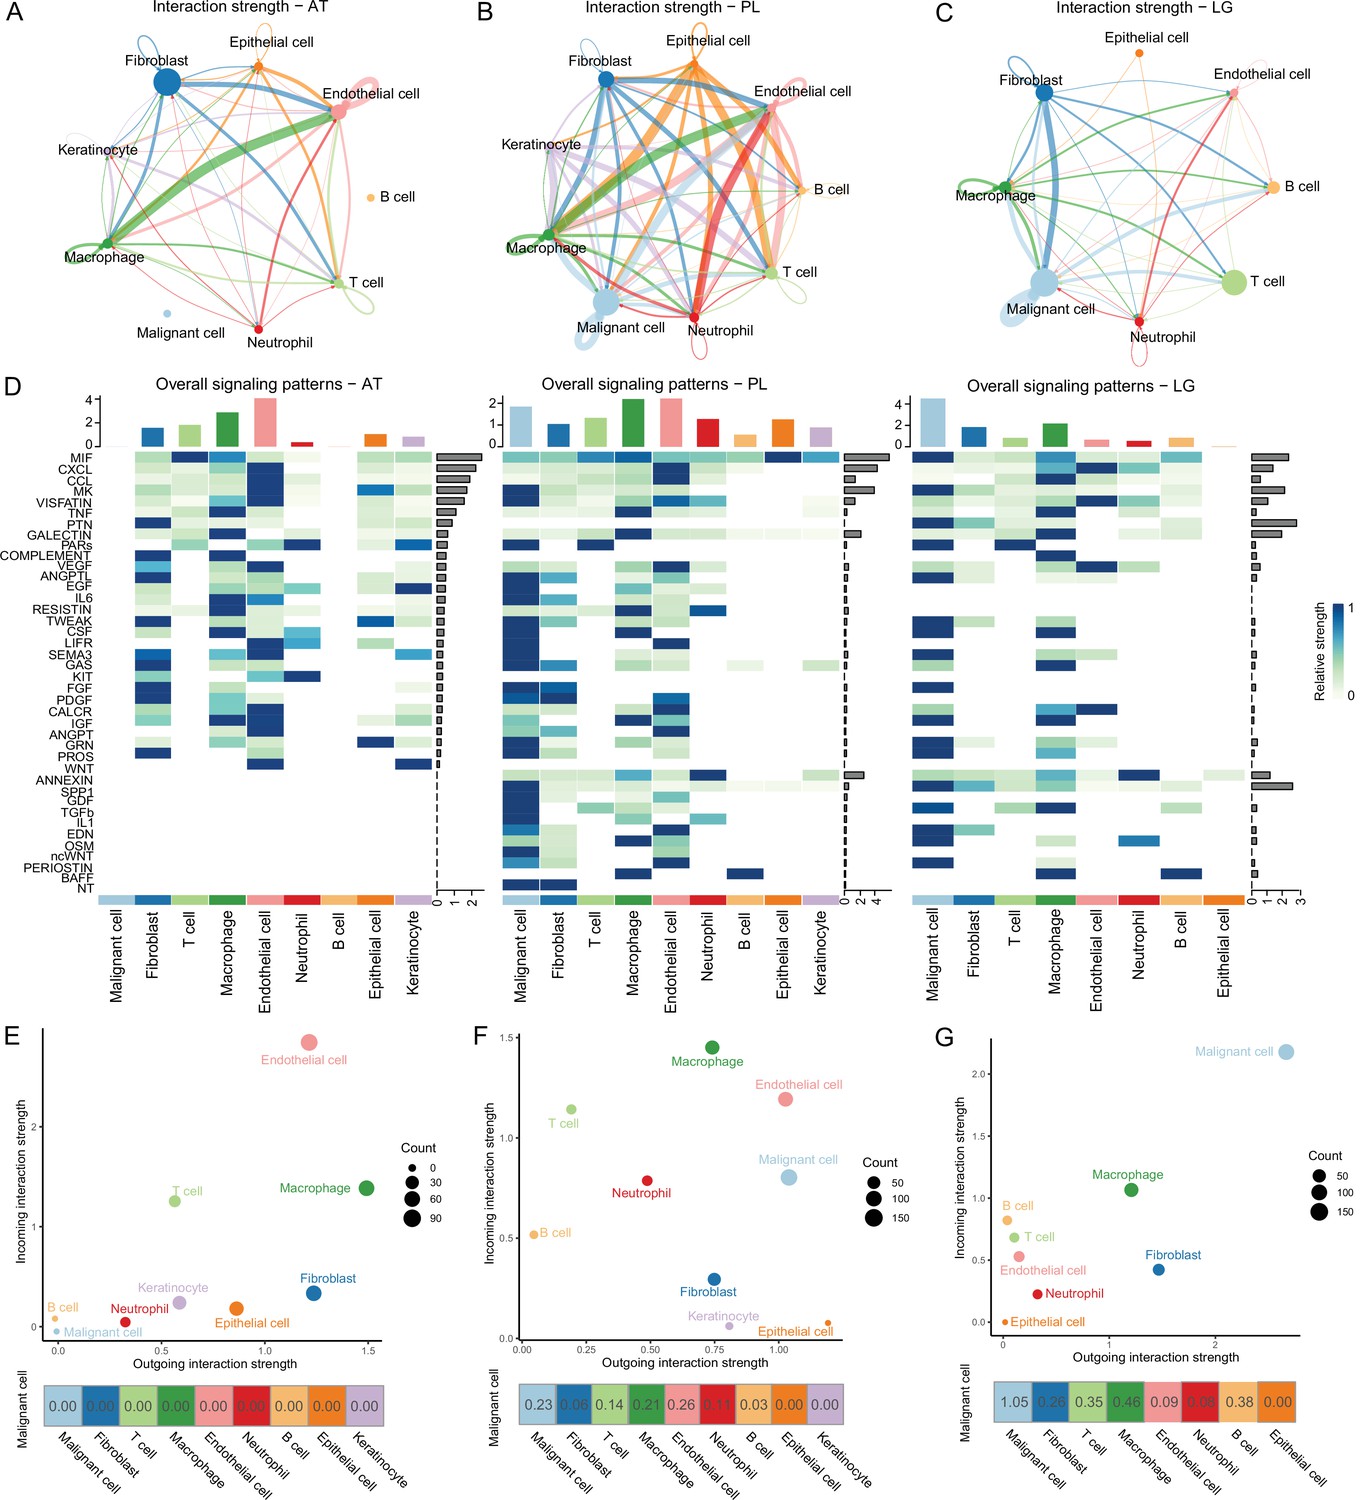
Cell-cell communication analysis.
(A) Adjacent tissue (AT) cell communication network. The interactions between endothelial cells and macrophages were the strongest, while malignant cells did not interact with other types of cells. (B) Primary lesion (PL) cell communication network. Different colors represent different cell types. The thickness of the line represents the strength of cell interaction, and the thicker the line, the stronger cell interaction. There are strong and complex interaction signals among different types of cells. (C) Lymph gland metastasis sample (LG) cell communication network. There was still the strongest signal interaction between malignant cells and fibroblasts. (D) The heatmap shows ATs, primary acral melanoma (AM) lesions, and lymph gland metastasis cell interaction pathways identified according to each cell type. The height of the top bar chart represents the interaction strength of each cell type, and the height of the bar on the right represents the strength of the signaling pathway. (E) The outgoing and incoming interaction strength of each cell type in ATs. Outgoing means cells secrete signals or have ligands, while incoming means cells receive signals or have receptors. The corresponding outgoing and incoming interaction strength of the cell is obtained through the statistics of expression levels of ligand and receptor coding genes in the cell. The bottom number represents the strength of the malignant cell’s interactions with other cell types. (F) The outgoing and incoming interaction strength of each cell type in primary AM lesions. (G) The outgoing and incoming interaction strength of each cell type in the lymph gland metastasis sample.
Figure 2—figure supplement 1
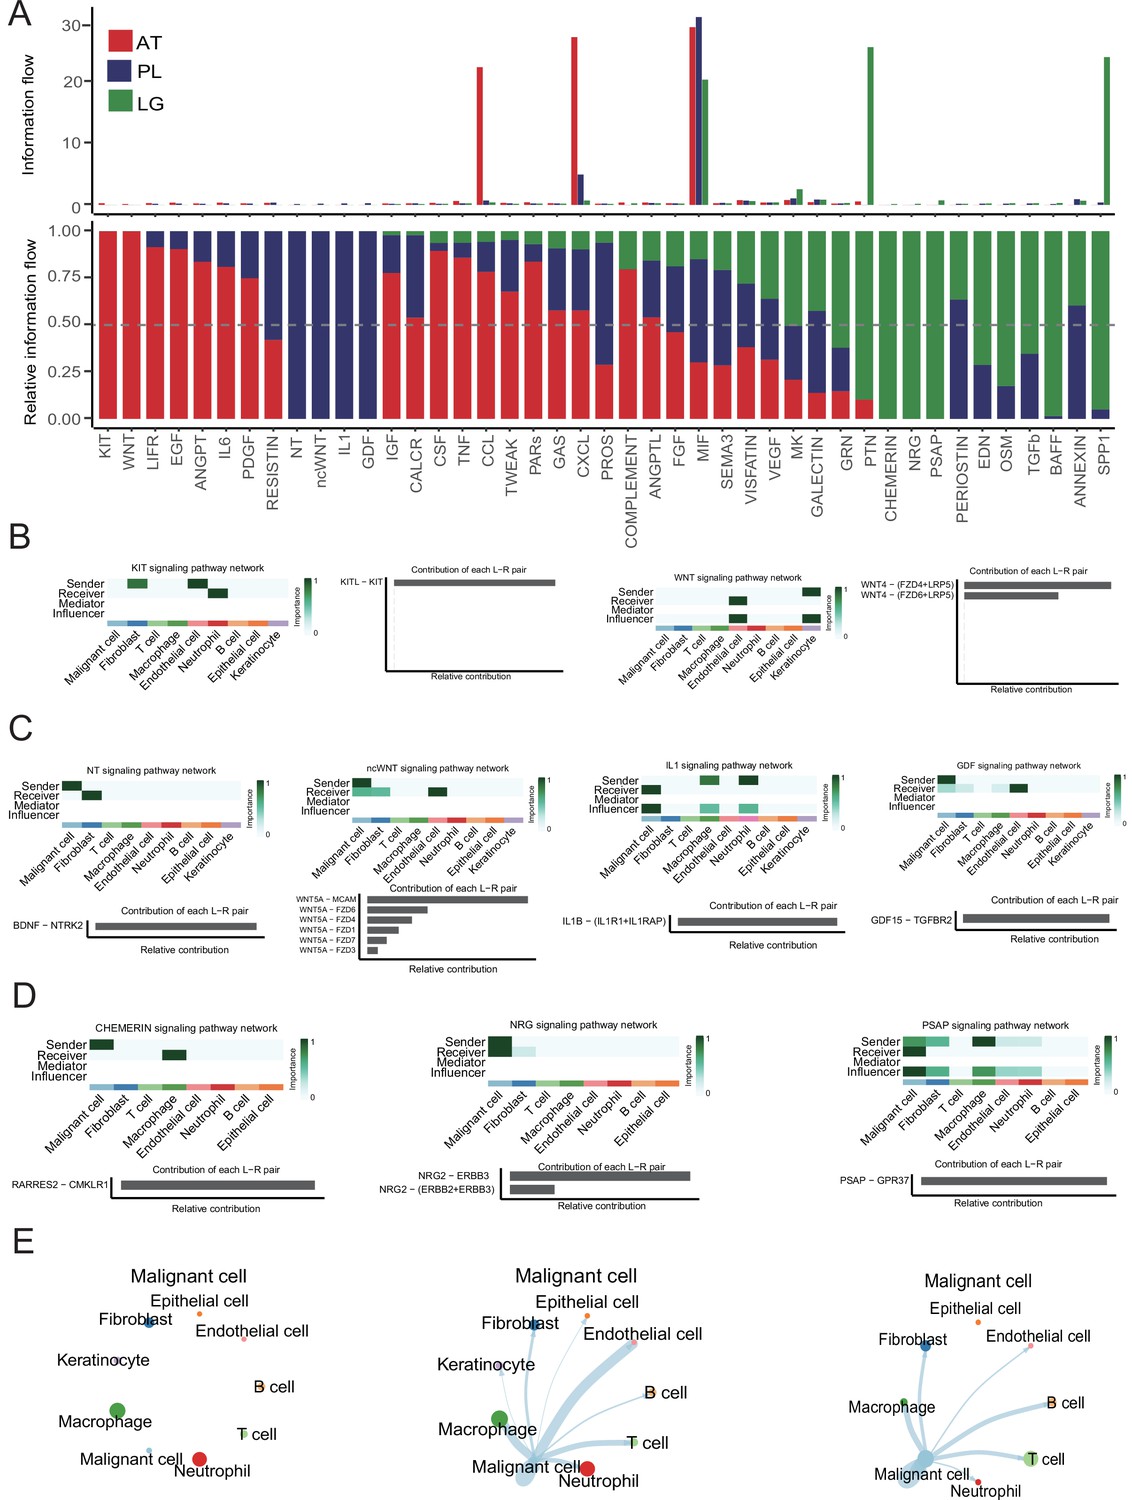
Cell-cell interaction network analysis.
(A) The bar graph shows the conserved and context-specific signaling pathways. (B) The role of each cell type in the KIT and WNT signaling pathways of adjacent tissue (AT) samples. (C) The role of each cell type in the NT, ncWNT, IL1, and GDF signaling pathways of primary lesion (PL) samples. (D) The role of each cell type in the CHEMERIN, NRG, and PSAP signaling pathways of lymph gland (LG) metastasis sample. (E) Interaction strength between the malignant cells and the other cell types.
Figure 3 with 1 supplement
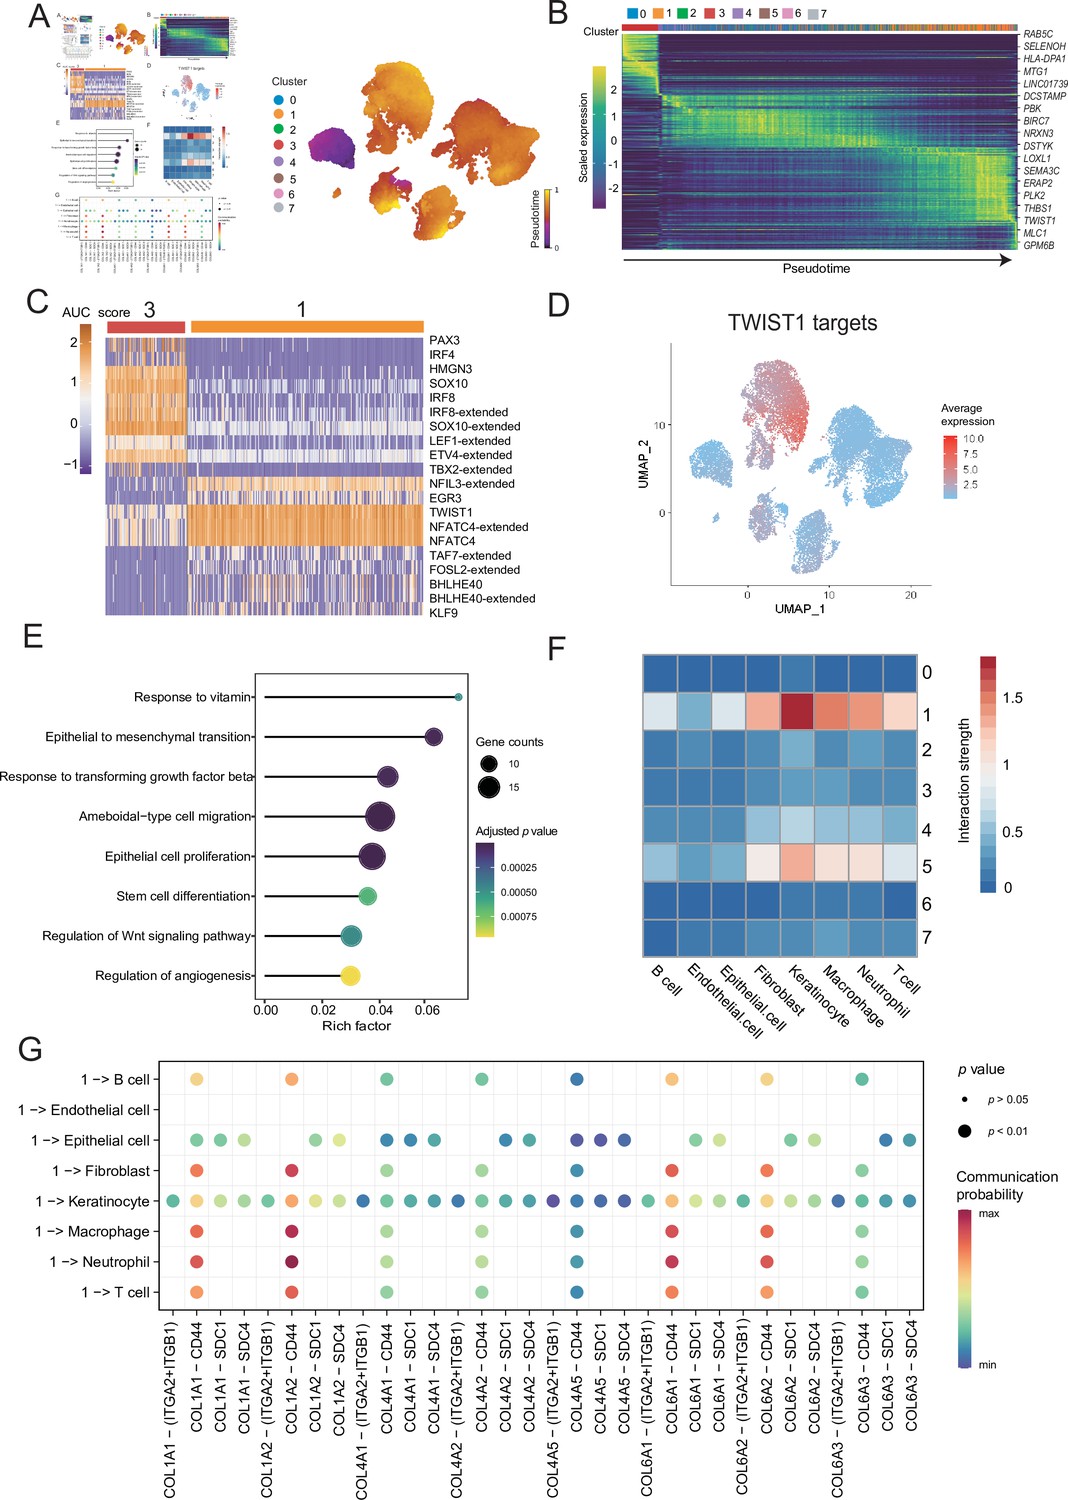
Malignant cells acquire the ability to invade presumably via epithelial-mesenchymal transition (EMT) and extracellular matrix (ECM) pathways.
(A) UMAP plot shows the RNA velocities and latent time of malignant cells. (B) Heatmap shows the dynamic gene expression patterns accompanying the evolution of malignant cells. (C) Heatmap of the area under curve (AUC) scores of transcription factor (TF) motifs estimated by SCENIC for each cell in subclusters 1 and 3. (D) TWIST1 target expression levels in UMAP plot. (E) GO term enrichment results of TWIST1 targets genes in coexpression module. (F) Heatmap shows the interaction between the different malignant cell subclusters and the other cell types. (G) Bubble chart shows ligand-receptor pairs secreted by subcluster 1 to stroma cells.
Figure 3—figure supplement 1
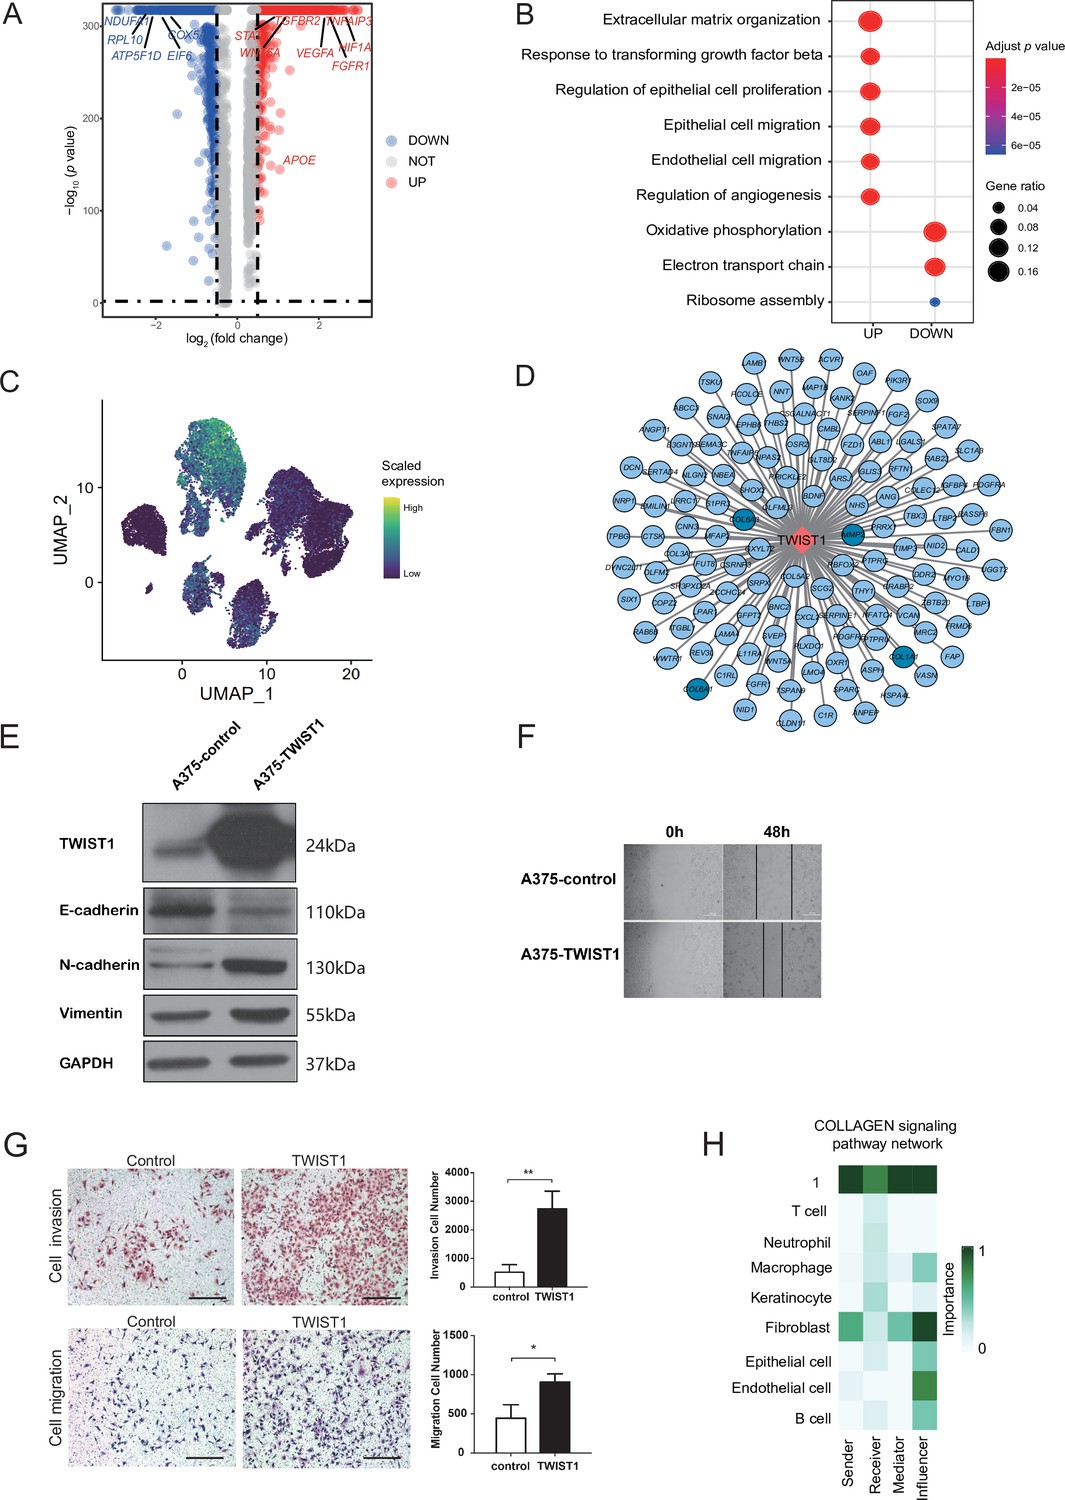
Malignant cell subcluster analysis.
(A) The volcano map shows the gene difference analysis between malignant subclusters 1 and 3. (B) GO term enrichment of differentially expressed genes (DEGs) between malignant subclusters 1 and 3. (C) UMAP plot of TWIST1 expression levels in each malignant cell. (D) Network of TWIST1 and its target genes. Targets in deep blue are associated with extracellular matrix (ECM). (E) Western blot results of TWIST1 and epithelial-mesenchymal transition (EMT)-related proteins in A375 cells overexpressing TWIST1. (F) Wound-healing assay on A375 cells overexpressing TWIST1. The line graph shows the cell migration rate at 0, 24, and 48 hr. (G) Transwell assay using A375 cells overexpressing TWIST1. The bar plot shows the number of migrated and invaded cells. Scale bar, 20μm. *p value < 0.05, **p value < 0.01. (H) The role of each cell type in the COLLAGEN signaling pathways.
-
Figure 3—figure supplement 1—source data 1
Original data records and pictures of Western blot, Wound-healing assay and Transwell assay.
- https://cdn.elifesciences.org/articles/78616/elife-78616-fig3-figsupp1-data1-v2.zip
Figure 4 with 1 supplement
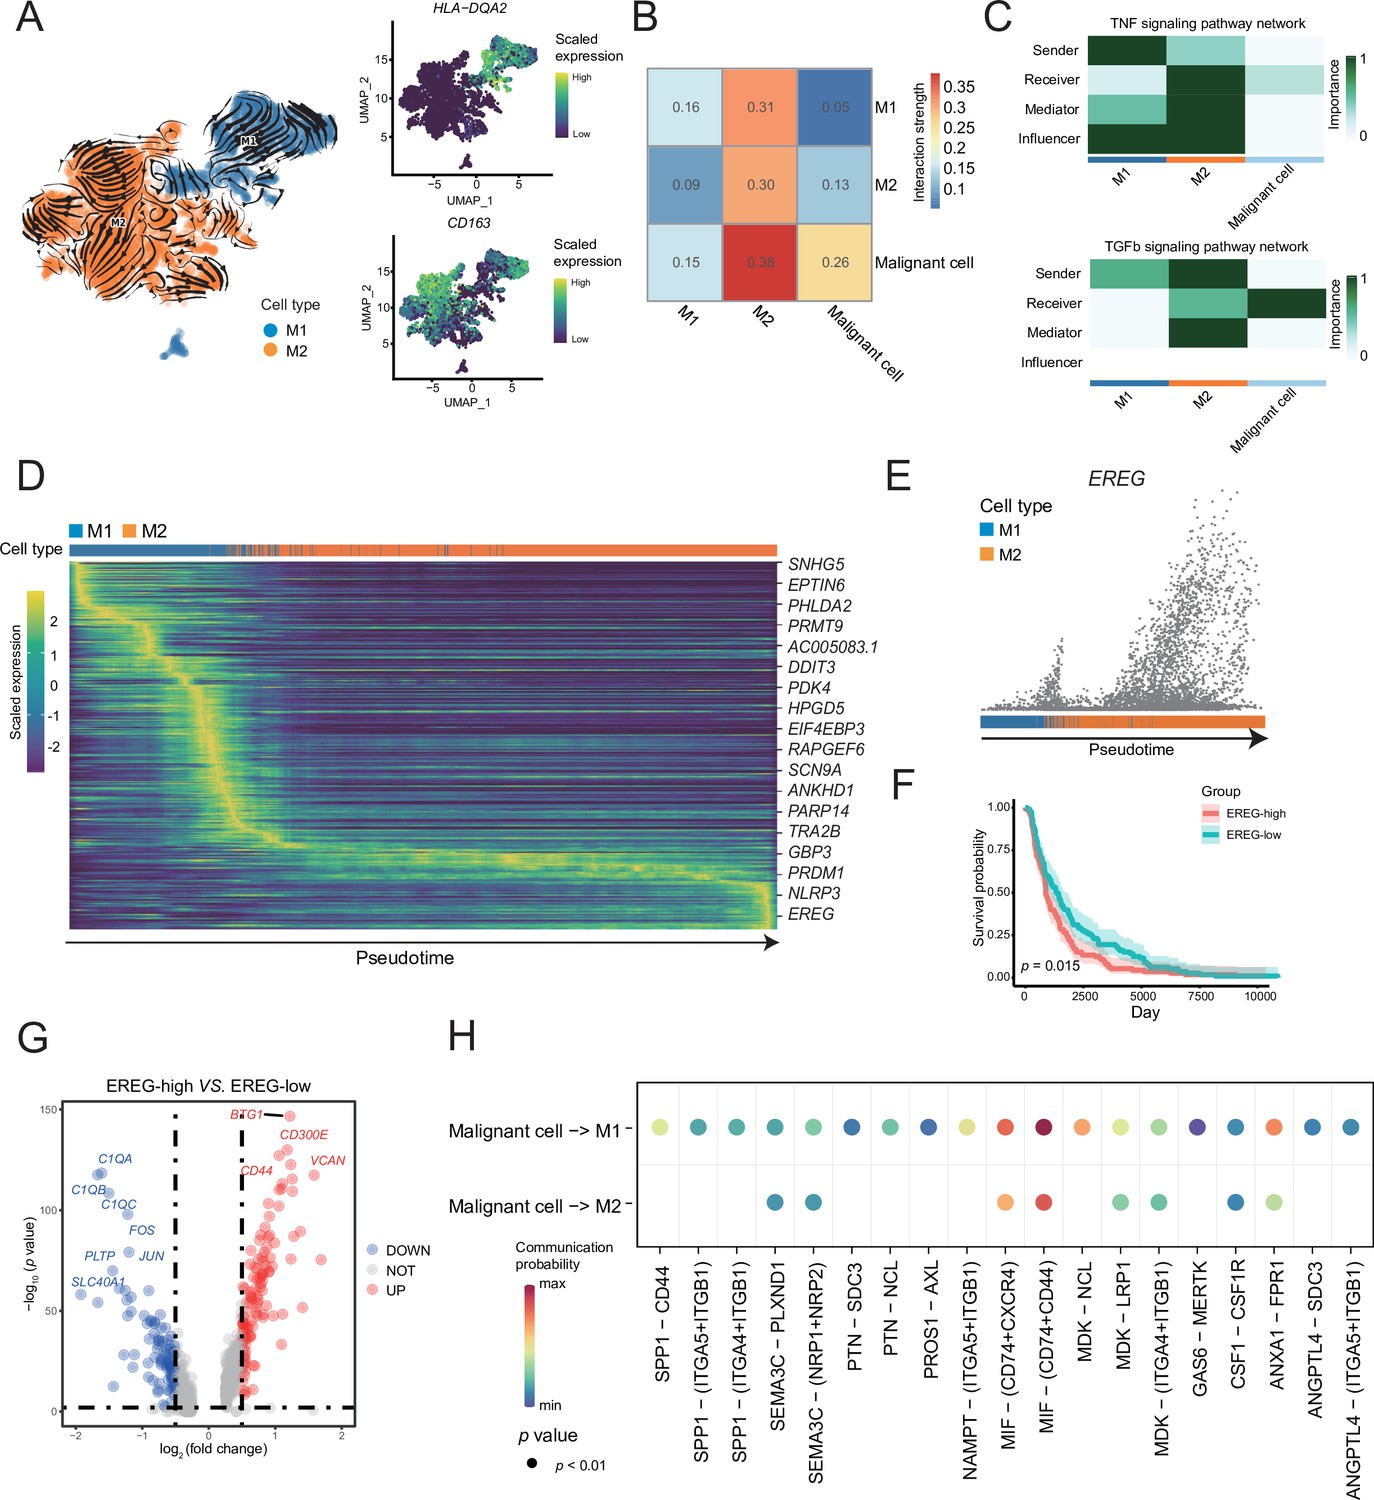
M1 and M2 macrophages were found in the macrophage subclusters.
(A) UMAP plot shows the RNA velocities, HLA-DQA2 and CD163 expression patterns of macrophage subclusters. (B) Heatmap of the cell-cell interaction scores was analyzed using CellChat. The M2 cells had the strongest signal interaction with malignant cells. (C) The role of each macrophage subcluster cells in the tumor necrosis factor (TNF) and transforming growth factor β (TGF-β) signaling pathways. (D) The heatmap shows the dynamic gene expression patterns accompanying the evolution of macrophages. The blue columns represent M1 cells, while the orange columns represent M2 cells. (E) Scatter plot shows the EREG expression levels in macrophages. The direction of arrow is consistent with the direction of pseudotime trajectory. (F) Statistics of EREG KM survival curve using the melanoma cohort data in The Cancer Genome Atlas (TCGA). (G) The volcano map shows the gene difference analysis between the high- and low-expressing EREG cells in the M2 subclusters. (H) Bubble chart shows ligand-receptor pairs secreted by the malignant cells to the macrophages.
Figure 4—figure supplement 1
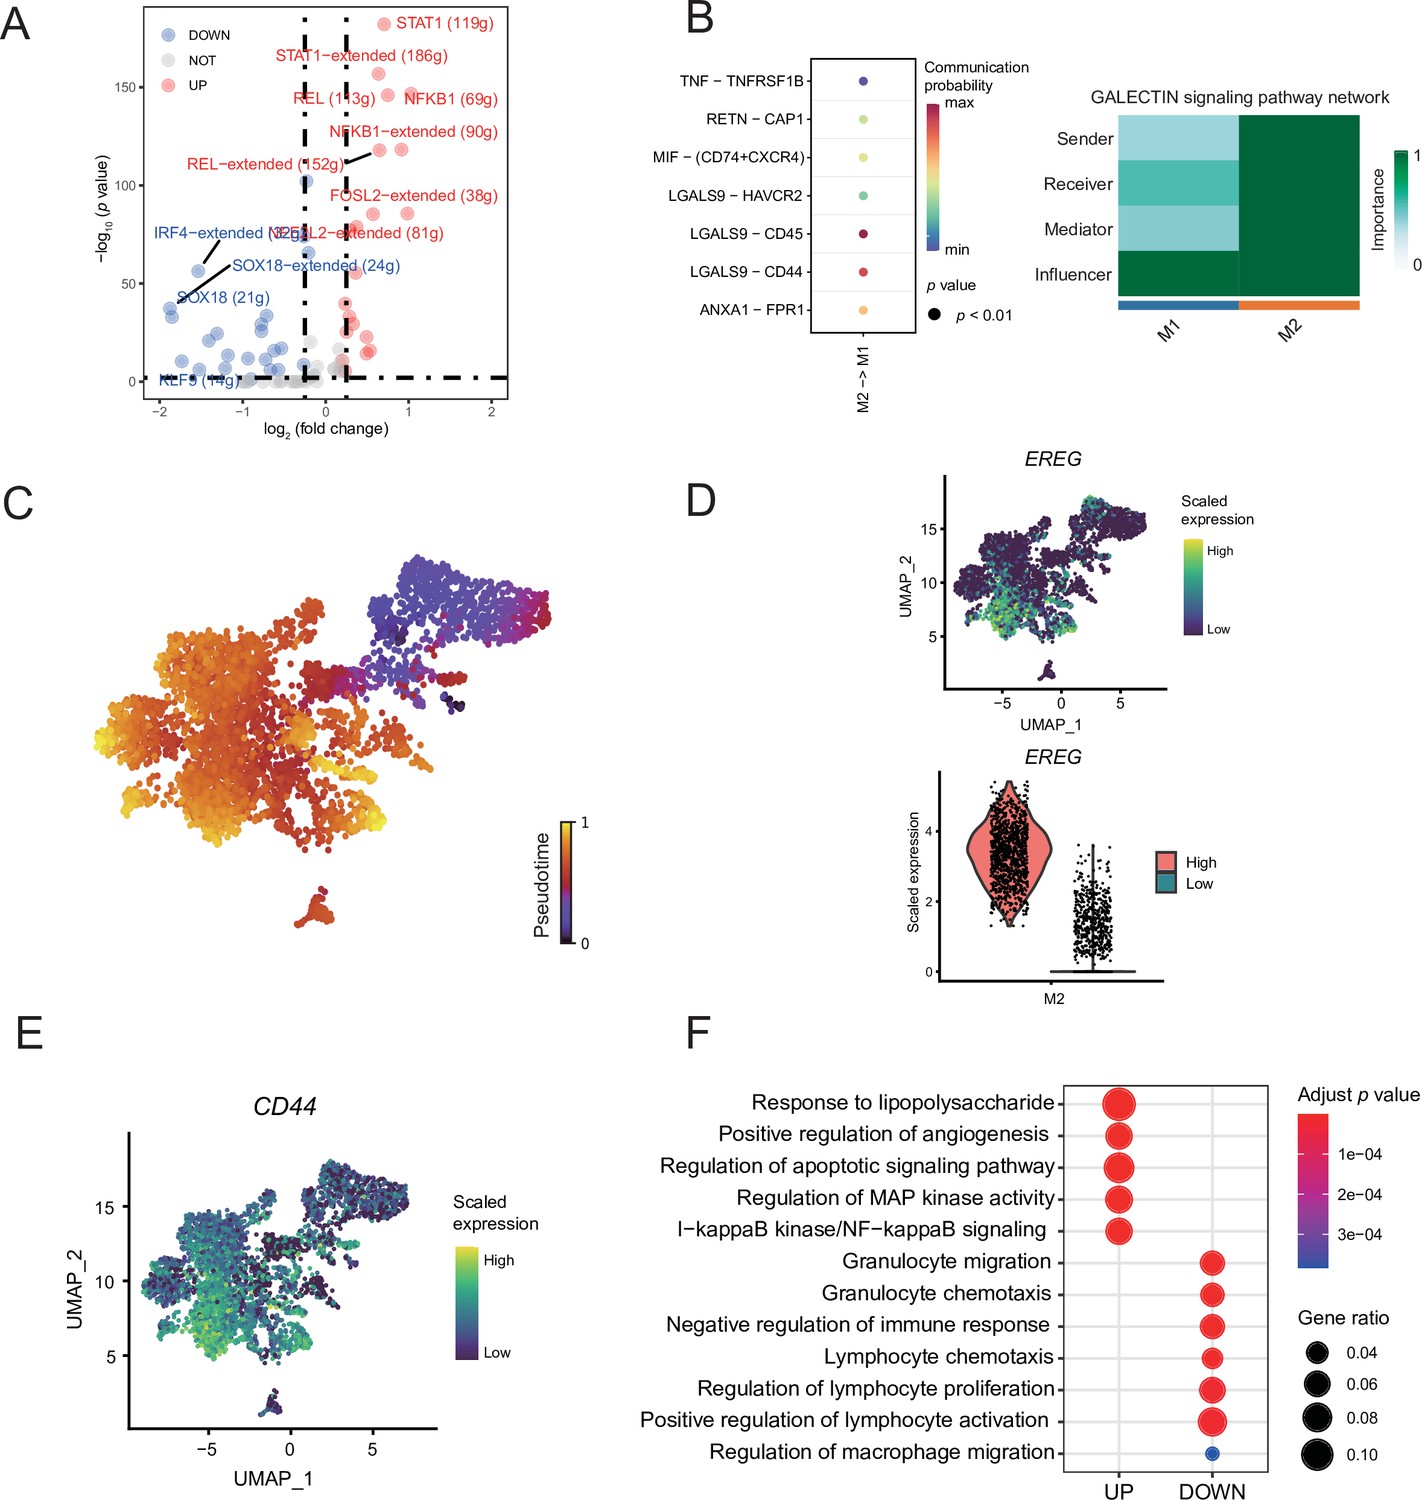
Macrophage subcluster analysis.
(A) The volcano map shows the different regulators of macrophage subclusters. (B) Bubble chart showing ligand-receptor pairs secreted by M2 cells to M1 cells. (C) The latent time of macrophages. (D) UMAP plot of EREG expression levels for each macrophage and Vlnplot showing that M2 can be divided into two groups of high and low expression of EREG. (E) UMAP plot of CD44 expression levels for each macrophage. (F) The GO enrichment results of differentially expressed genes (DEGs) by gene difference analysis between the high- and low- EREG expressing cells in M2 subclusters.
Figure 5 with 2 supplements
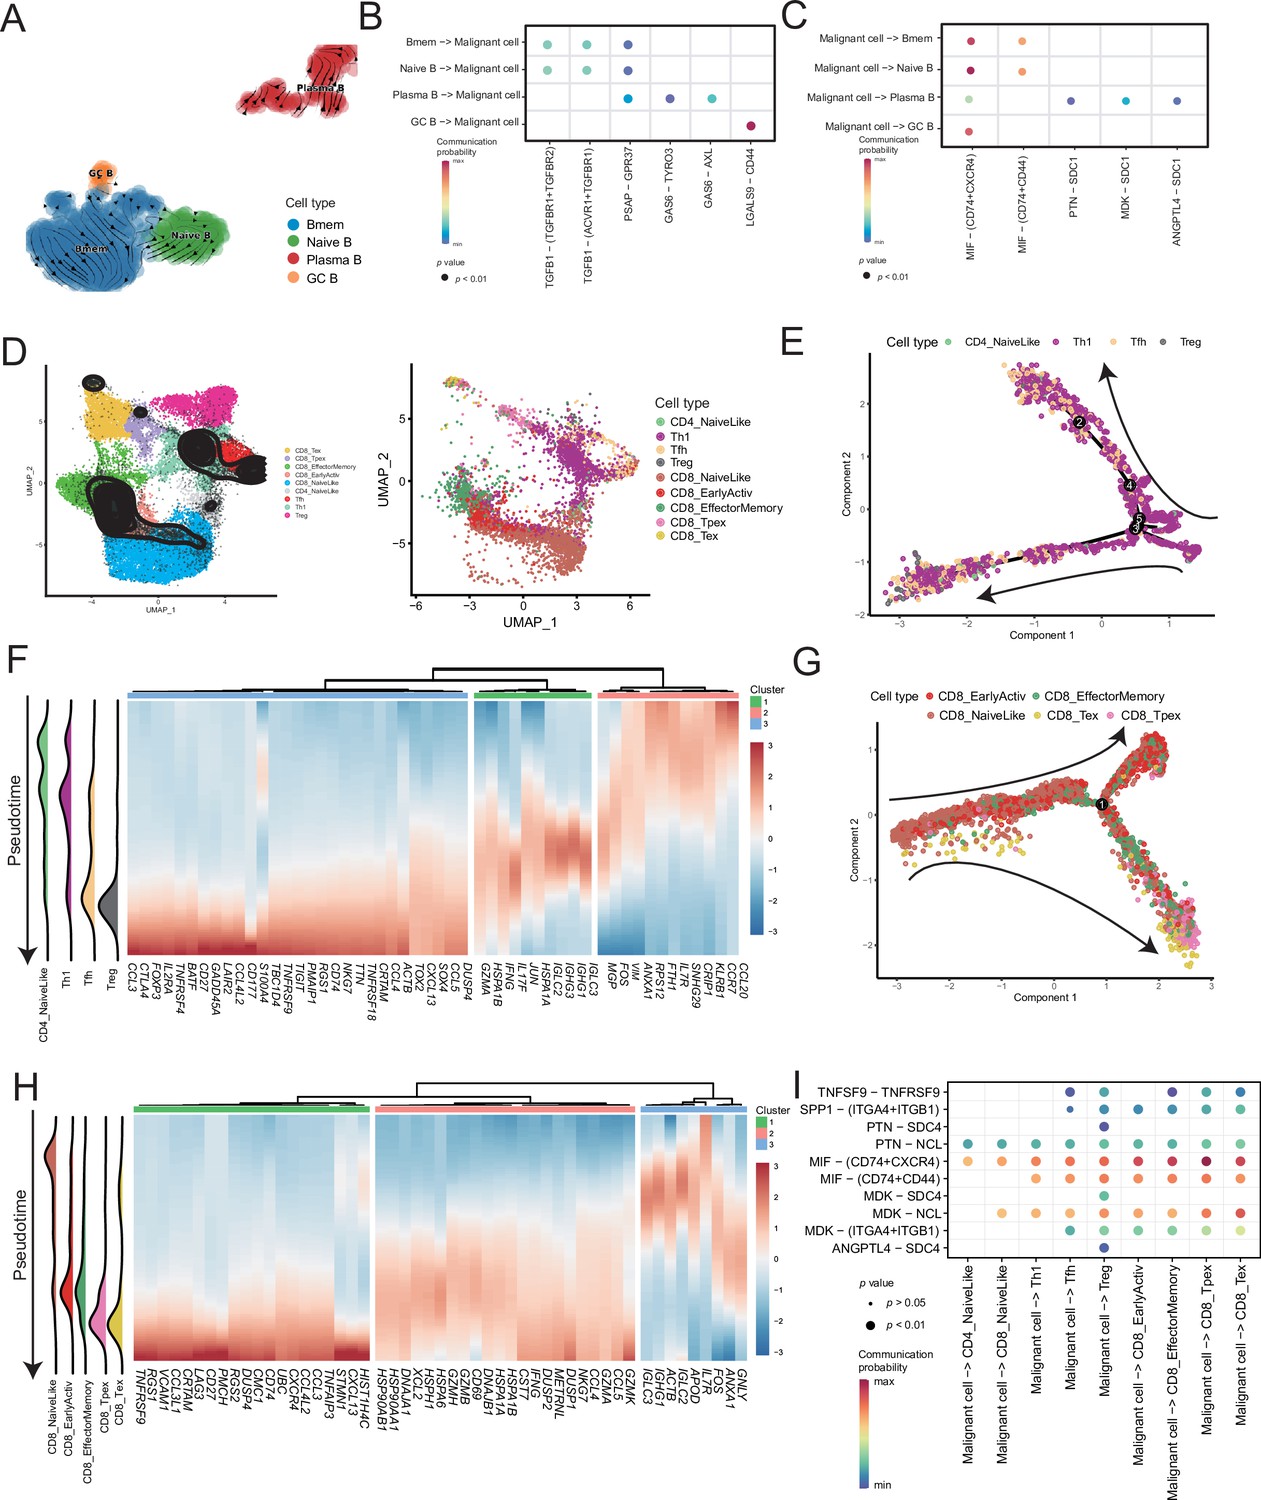
Temporal tracing reveals specific transcriptional characteristics of lymphocyte cell subclusters.
(A) UMAP plot shows the RNA velocities and latency time of the B-cell subclusters. (B) Bubble chart showing ligand-receptor pairs secreted by B cells to malignant cells. (C) Bubble chart showing ligand-receptor pairs secreted by malignant cells to B cells. (D) UMAP map shows the results of T-cell subcluster cell annotation by ProjecTILs. The cells in the colored background refer to the cell types in the reference dataset, and the cells in the black circle represent the cells in our data. (E) The arrangement of different CD4+ T subcluster cells on the pseudotime trajectory. (F) The heatmap shows dynamic gene expression patterns accompanying the differentiation of CD4+ T cells. (G) The arrangement of the different CD8+ T subcluster cells on the pseudotime trajectory. (H) The heatmap shows dynamic gene expression patterns accompanying the differentiation of CD8+ T cells. (I) Bubble chart showing ligand-receptor pairs secreted by malignant cells to T cells.
Figure 5—figure supplement 1
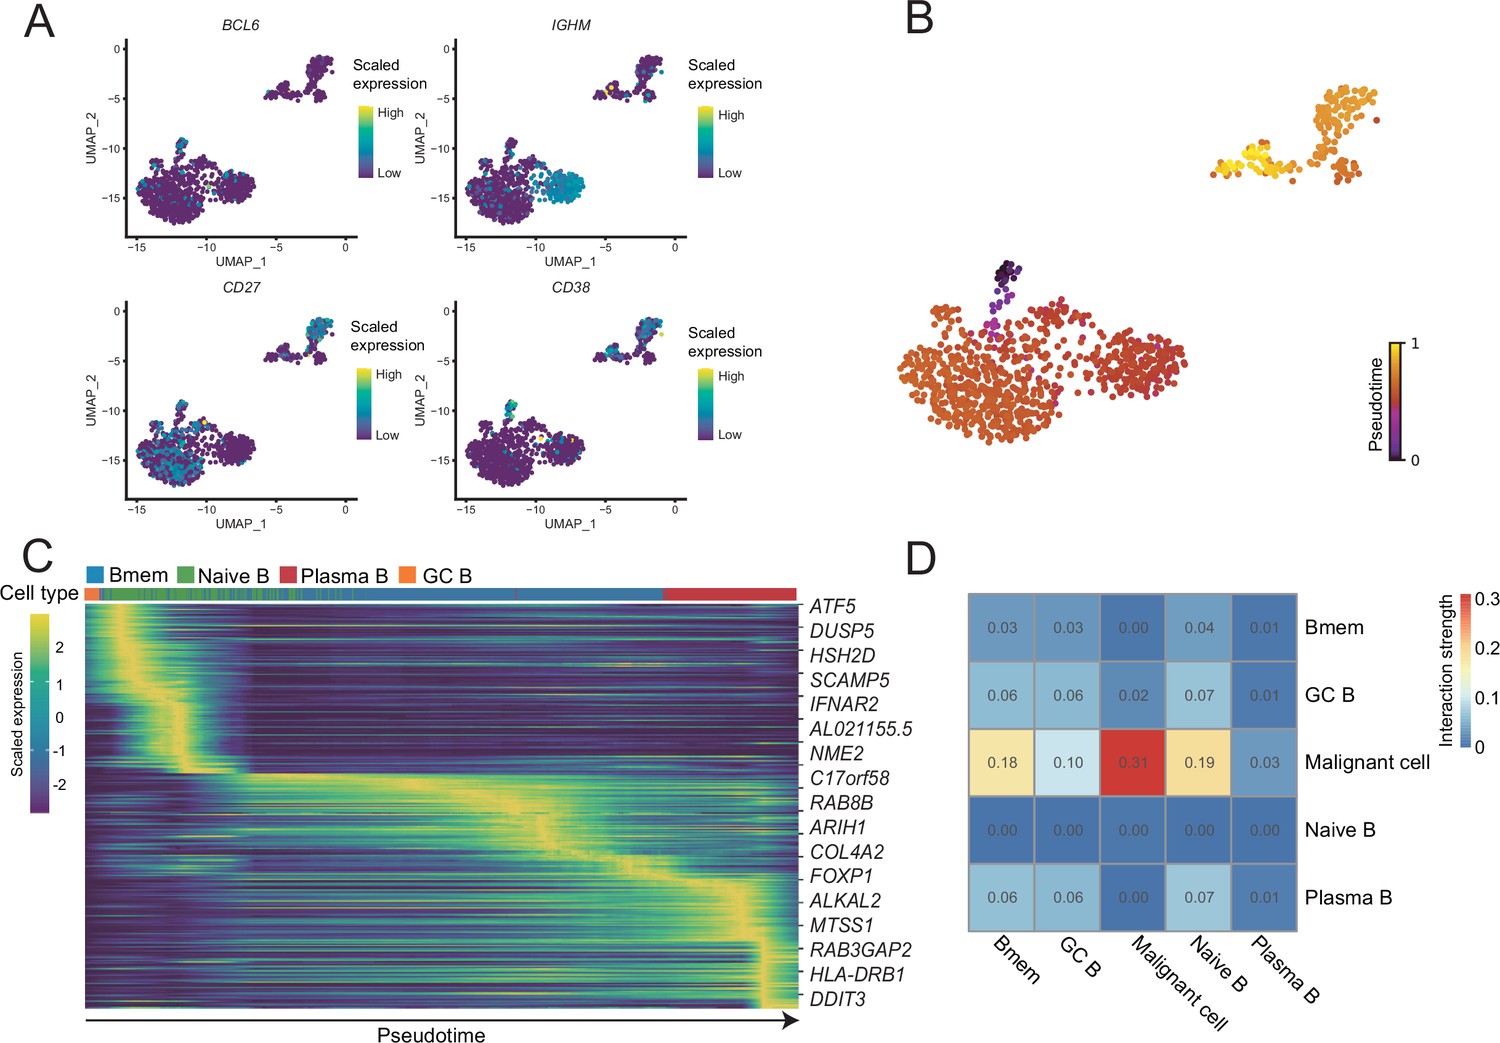
B-cell subcluster gene expression patterns.
(A) The expression levels of BCL6, IGHM, CD27, and CD38 in B cells. (B) The latent time of B cells. (C) Heatmap shows dynamic gene expression patterns accompanying the evolution of B cells. (D) Heatmap of the interaction strength between B cells and malignant cells.
Figure 5—figure supplement 2

T-cell subcluster gene expression patterns.
(A) CD4+ T cells’ pseudotime trajectory. (B) FOXP3 expression pattern on the pseudotime trajectory of CD4+ T cells. (C) CD8+ T cells’ pseudotime trajectory. (D) PDCD1, CTLA4, and NFATC4 expression patterns on the pseudotime trajectory of CD8+ T cells. (E) UMAP plot of cutaneous melanoma (CM) T cells labeled by cell type. (F) UMAP plot of each CM T-cell PDCD1, CTLA4, and NFATC4 expression levels. (G) Heatmap of the interaction strength between T cells and malignant cells.
Figure 6 with 1 supplement
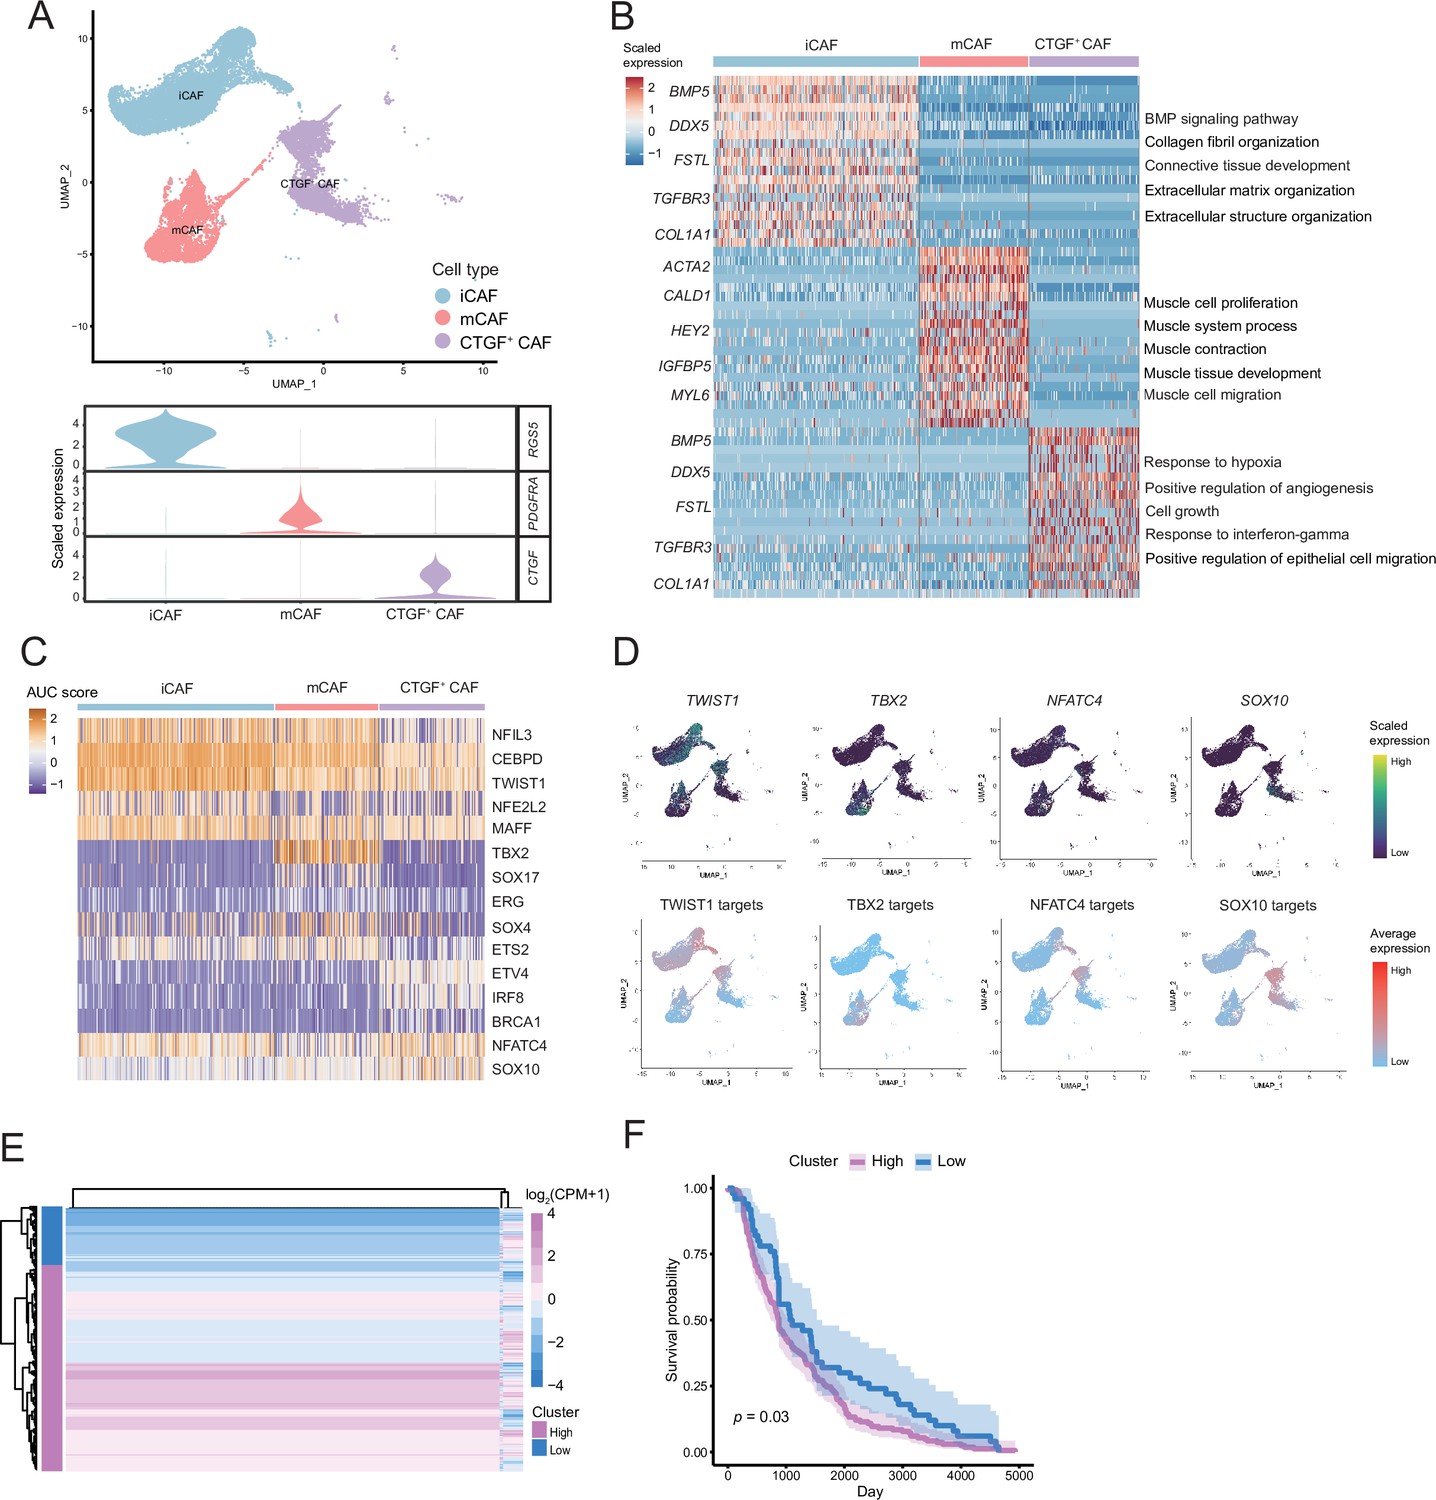
The fibroctyeibrocyte subclusters contain three cell types, among which CTGF+ cancer-associated fibroblasts (CAFs) are correlated with the degree of malignancy.
(A) UMAP plot of fibroblast subclusters and Vlnplot of fibroblast subclusters marker genes. (B) Heatmap shows the subclusters of differentially expressed genes (DEGs) and enrichment to GO terms. (C) Heatmap of the area under curve (AUC) scores of transcription factor (TF) motifs estimated by SCENIC for each cell in fibroblast subclusters. (D) UMAP plot of TFs, including TWIST1, TBX2, NFATC4, SOX10, and TF target expression levels, in each fibroblast. (E) NFATC4-targeted expression patterns in melanoma cohort data from The Cancer Genome Atlas (TCGA). (F) Statistics of NFATC4-targeted KM survival curves using the melanoma cohort data in TCGA.
Figure 6—figure supplement 1

The targets of NFATC4.
(A) Network of NFATC4 and target genes. (B) GO term enrichment results of NFATC4 targets.
Figure 7
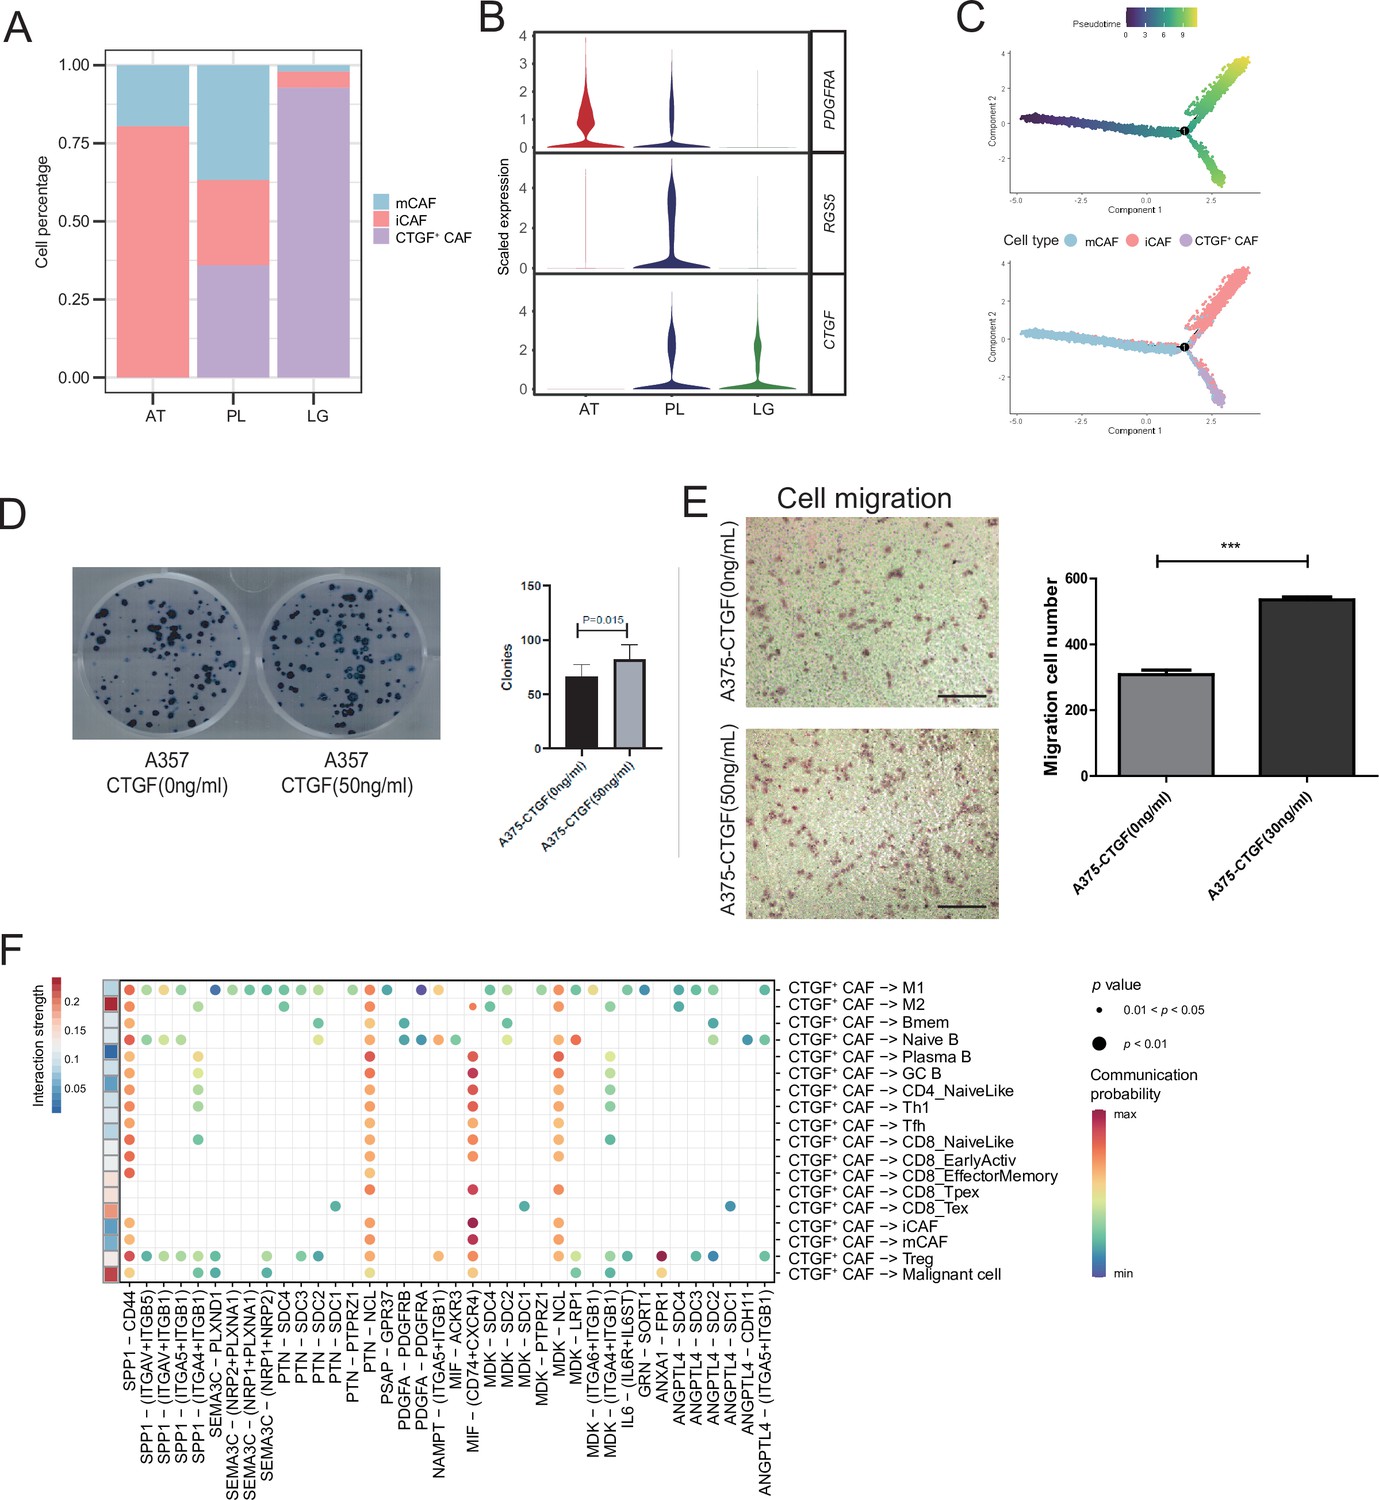
CTGF+ cancer-associated fibroblasts (CAFs) promote the proliferation of malignant cells.
(A) The distribution of fibroblast subclusters in adjacent tissues, primary acral melanoma (AM) lesions, and lymph gland metastasis samples. (B) Fibroblast subcluster marker expression levels in adjacent tissues, primary AM lesions, and lymph gland metastasis samples. (C) Evolutionary pseudotime of fibroblasts and the arrangement of different subclusters of cells on the pseudotime trajectory. (D) Clone formation assay of A375 cells in the presence of 50 ng/ml CTGF. The bar plot depicts the number of clones. Scale bar, 20μm. (E) Transwell assay on A375 cells in the presence of 50 ng/ml CTGF. The bar plot shows the number of migrated cells. ***p value < 0.001. (F) Interactions of the CTGF+ CAFs with the other cell types.
-
Figure 7—source data 1
Original records and pictures of Clone formation assay.
- https://cdn.elifesciences.org/articles/78616/elife-78616-fig7-data1-v2.zip
-
Figure 7—source data 2
Original records and pictures of Transwell assay.
- https://cdn.elifesciences.org/articles/78616/elife-78616-fig7-data2-v2.zip
Tables
Table 1
Clinical information of samples.
| Patient | Sample | Code name | Gender | Age | Site | Size | Medical history | Diagnose |
|---|---|---|---|---|---|---|---|---|
| Patient 1 | Primary lesion | PL1 | M | 40 | Fourth toe of right foot | 1*2 cm | 20 years, ulcer 1 month | Invasive melanoma |
| Patient 2 | Primary lesion | PL2 | M | 65 | Fourth toe of right foot | 5*8 cm | 5 years, ulcer 6 months | Malignant melanoma of the extremity |
| Lymph gland | LG2 | Left foot heel | 2.6 cm in diameter | Lymph gland metastasis of melanoma | ||||
| Patient 3 | Adjacent tissue | AT3 | F | 52 | The left groin | 3*2 cm | 8 months, ulcer 2 months | Acral melanoma, T4b (Breslow >4 mm, ulcer) |
| Patient 4 | Primary lesion | PL4 | F | 72 | Right foot heel | 4.5*4.5 cm | 2 years | Acral melanoma, (Breslow = 2.8 mm) |
| Adjacent tissue | AT4 | NA | ||||||
| Patient 5 | Primary lesion | PL5 | F | 77 | Left thumb | 3*2 cm | 10 years | Acral melanoma, ulcer |
| Patient 6 | Adjacent tissue | AT6 | F | 69 | Left foot heel | NA | 7 months | Invasive melanoma, (Breslow >1.8 mm) |
Additional files
Download links
A two-part list of links to download the article, or parts of the article, in various formats.
Downloads (link to download the article as PDF)
Open citations (links to open the citations from this article in various online reference manager services)
Cite this article (links to download the citations from this article in formats compatible with various reference manager tools)
Mapping the single-cell landscape of acral melanoma and analysis of the molecular regulatory network of the tumor microenvironments
eLife 11:e78616.
https://doi.org/10.7554/eLife.78616


