Gallbladder adenocarcinomas undergo subclonal diversification and selection from precancerous lesions to metastatic tumors
- Department of Internal Medicine, Seoul National University Bundang Hospital, Republic of Korea
- Department of Pathology, Seoul National University Bundang Hospital, Republic of Korea
- Department of Pathology and Translational Genomics, Samsung Medical Center, Sungkyunkwan University School of Medicine, Republic of Korea
- Genealogy Inc, Republic of Korea
- Center for Precision Medicine, Seoul National University Bundang Hospital, Republic of Korea
- Medical Research Collaboration Center, Seoul National University Bundang Hospital, Republic of Korea
- Department of Data Science, Dana Farber Cancer Institute, Harvard T.H. Chan School of Public Health, United States
- Biomedical Research Institute, Seoul National University Bundang Hospital, Republic of Korea
- Department of Surgery, Seoul National University Bundang Hospital, Republic of Korea
Figures
Figure 1 with 2 supplements
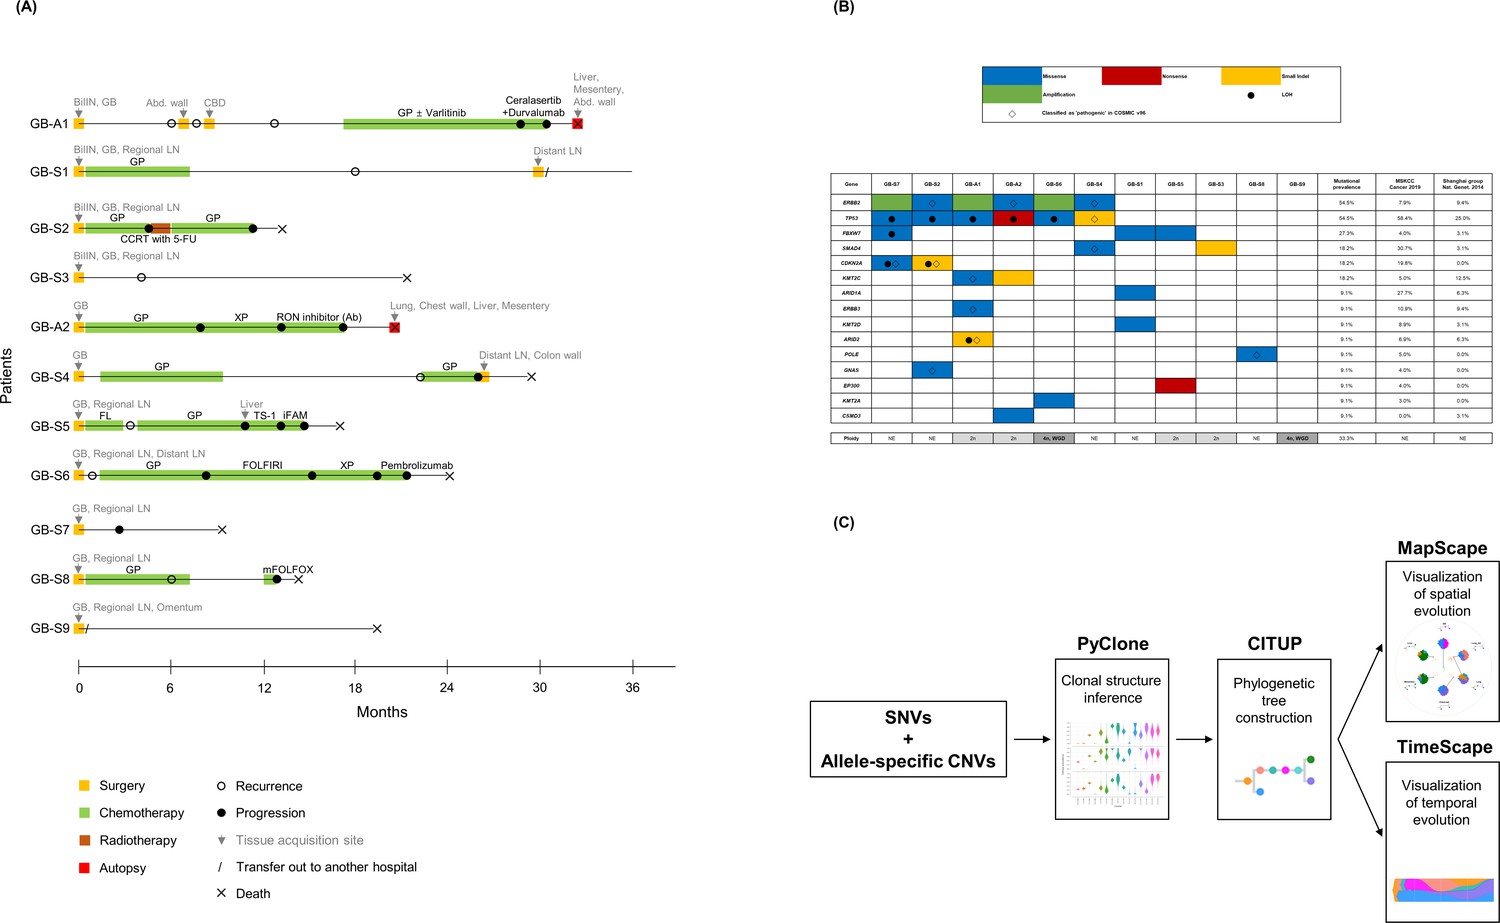
Clinical history of patients, mutational landscape, and study workflow.
(A) Clinical history of 11 patients is summarized in the swimmer plot. (B) The mutational landscape of 11 primary tumors (GB) is visualized and compared with the two previous studies on gallbladder adenocarcinoma (GBAC). (C) The process of constructing clonal evolution trajectories using multiple tumor samples is shown in the workflow. Ab, antibody; Abd, abdominal; Adj, adjuvant; BilIN, biliary intraepithelial neoplasia; CBD, common bile duct; CCRT, concurrent chemoradiotherapy; CNVs, copy number variations; COSMIC, Catalogue Of Somatic Mutations In Cancer; FL, 5-fluorouracil + leucovorin; FOLFIRI, 5-fluorouracil + leucovorin + irinotecan; GB, gallbladder; GP, gemcitabine + cisplatin; iFAM, infusional 5-fluorouracil + doxorubicin + mitomycin-C; LOH, loss of heterozygosity; mFOLFOX, modified 5-fluorouracil + leucovorin + oxaliplatin; MSKCC, Memorial Sloan Kettering Cancer Center; NE, not evaluable; SNVs, single nucleotide variants; WGD, whole genome doubling; XP, capecitabine + cisplatin; 5-FU, 5-fluorouracil.
Figure 1—figure supplement 1
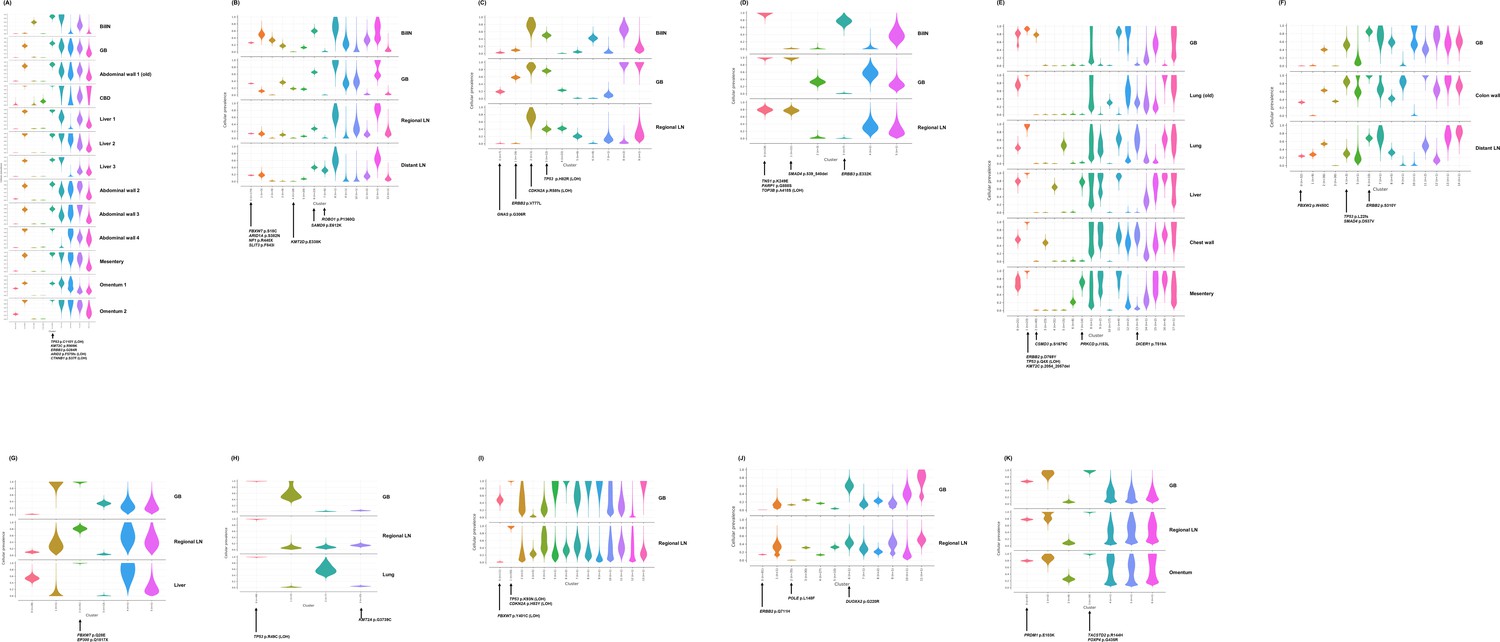
Inference of clonal structure by PyClone algorithm.
(A–K) The clonal population structure was statistically inferred for GB-A1 (A), GB-S1 (B), GB-S2 (C), GB-S3 (D), GB-A2 (E), GB-S4 (F), GB-S5 (G), GB-S6 (H), GB-S7 (I), GB-S8 (J), and GB-S9 (K) using PyClone. See Supplementary file 2 to check the matching information for the PyClone clusters and the CITUP clones. BilIN, biliary intraepithelial neoplasia; GB, gallbladder; CBD, common bile duct; LN, lymph node.
Figure 1—figure supplement 2
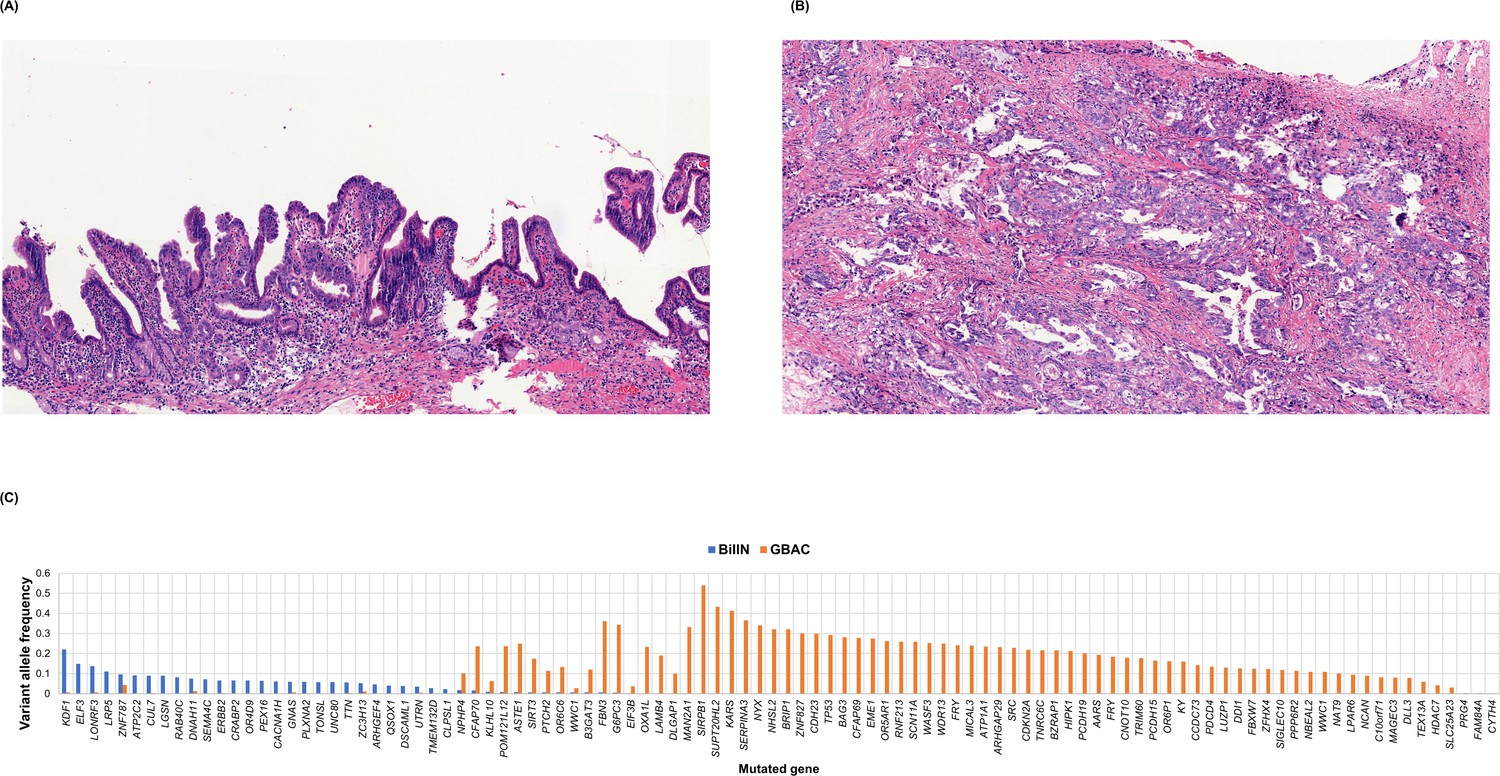
BiIlN and primary gallbladder adenocarcinoma (GBAC) of the GB-S7 patient presumed to be derived from different origins.
(A) H&E staining of BiIlN. (B) H&E staining of GBAC. (C) Variant allele frequency of mutated genes in BilIN and primary GBAC. BilIN, biliary intraepithelial neoplasia; H&E, hematoxylin and eosin.
Figure 2
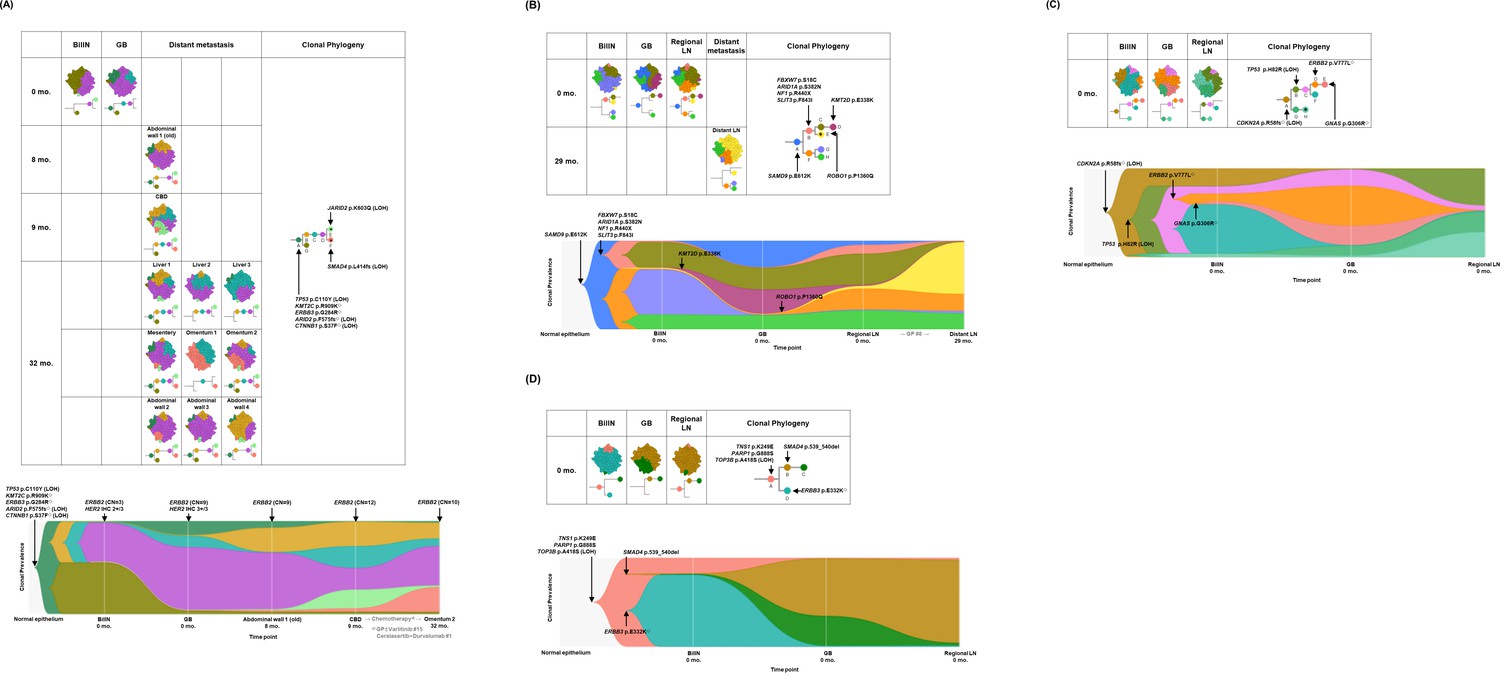
Spatial and temporal clonal evolution of four patients with gallbladder adenocarcinoma (GBAC) whose precancerous BilIN tissues were analyzed.
(A–D) The most probable phylogenetic trees and MapScape and TimeScape results are visualized for GB-A1 (A), GB-S1 (B), GB-S2 (C), and GB-S3 (D). In MapScape visualization (table), the numbers in the row indicate the time taken from diagnosis to tissue acquisition in months, and the columns indicate whether the tissue is a precancerous lesion, primary tumor, or metastatic lesion. Colors represent distinct clones and clonal prevalences per site were proportional to the corresponding-colored area of the cellular aggregate representation. In TimeScape visualization (schema), clonal prevalences (vertical axis) were plotted across time points (horizontal axis) for each clone (colors). Asterisks (*) in the clonal phylogenetic tree denote subclones that constituted <5% in the primary tumor and expanded more than sevenfold in the metastatic tumor. Diamond symbol (◇) is used if the mutation in the figure is classified as 'pathogenic' in Catalogue Of Somatic Mutations In Cancer (COSMIC) v96. Notable events were marked with arrows. The time from diagnosis of GBAC to tissue acquisition was indicated under the sample name. Chemotherapy history was indicated in gray color, where '#' represents the number of chemotherapy cycles. BilIN, biliary intraepithelial neoplasia; CBD, common bile duct; CN, copy number; GB, gallbladder; GP, gemcitabine + cisplatin; LN, lymph node; LOH, loss of heterozygosity.
Figure 3
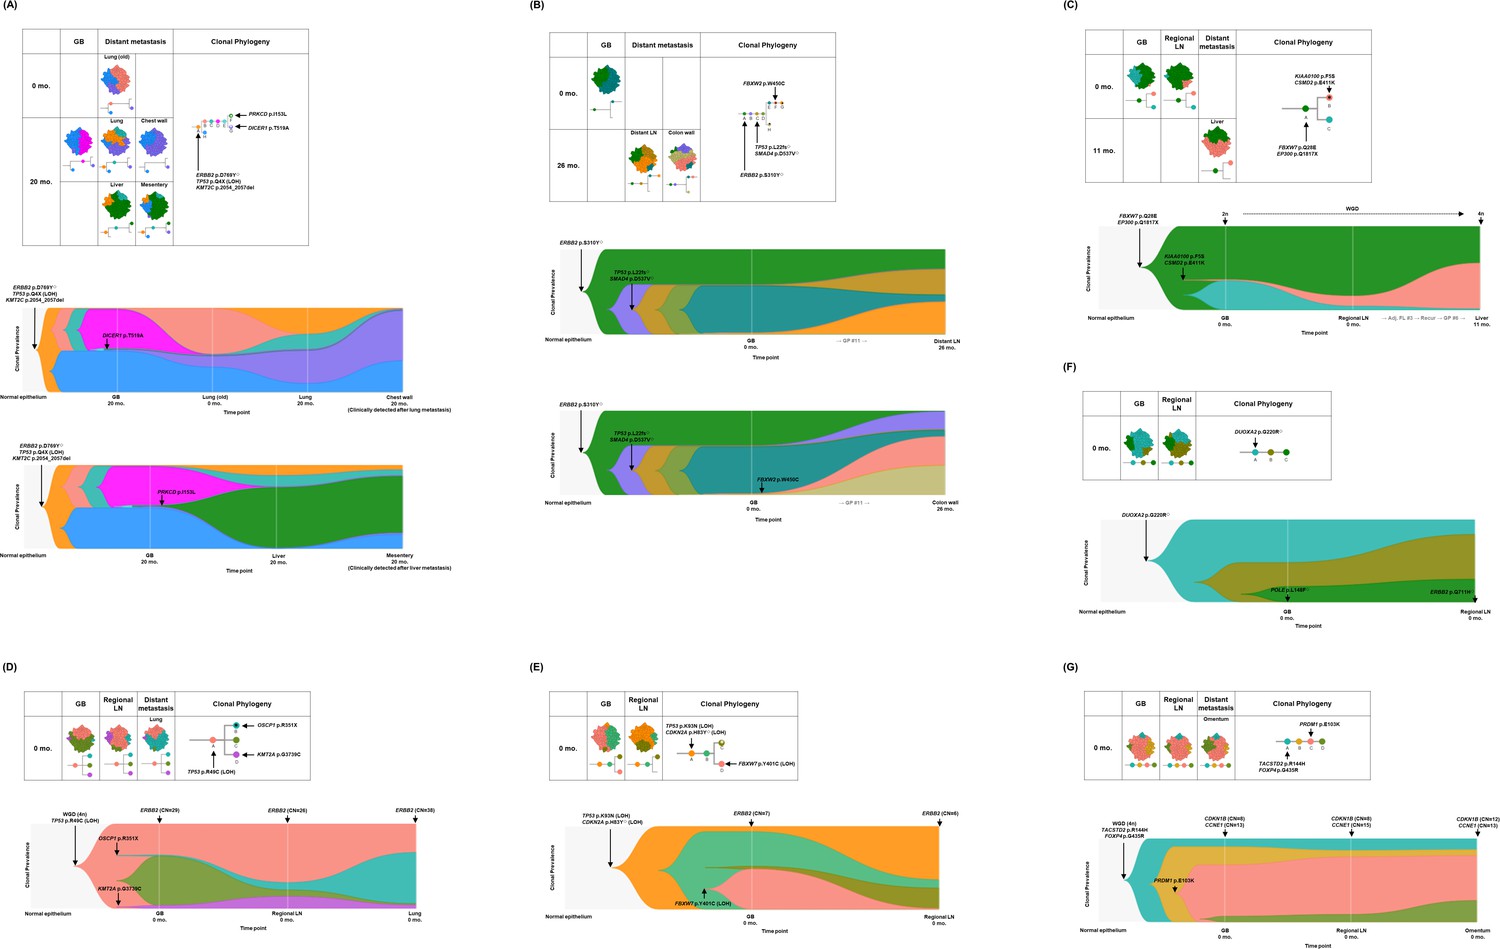
Spatial and temporal clonal evolution of additional seven patients with gallbladder adenocarcinoma (GBAC).
(A–G) The most probable phylogenetic trees and MapScape and TimeScape results are visualized for GB-A2 (A), GB-S4 (B), GB-S5 (C), GB-S6 (D), GB-S7 (E), GB-S8 (F), and GB-S9 (G). In MapScape visualization (table), the numbers in the row indicate the time taken from diagnosis to tissue acquisition in months, and the columns indicate whether the tissue is a precancerous lesion, primary tumor, or metastatic lesion. Colors represent distinct clones and clonal prevalences per site were proportional to the corresponding-colored area of the cellular aggregate representation. In TimeScape visualization (schema), clonal prevalences (vertical axis) were plotted across time points (horizontal axis) for each clone (colors). Asterisks (*) in the clonal phylogenetic tree denote subclones that constituted <5% in the primary tumor and expanded more than sevenfold in the metastatic tumor. Diamond symbol (◇) is used if the mutation in the figure is classified as 'pathogenic' in Catalogue Of Somatic Mutations In Cancer (COSMIC) v96. Notable events were marked with arrows. The time from diagnosis of GBAC to tissue acquisition was indicated under the sample name. Chemotherapy history was indicated in gray color, where '#' represents the number of chemotherapy cycles. Adj, adjuvant; BilIN, biliary intraepithelial neoplasia; CN, copy number; FL, 5-fluorouracil + leucovorin; GB, gallbladder; GP, gemcitabine + cisplatin; LN, lymph node; LOH, loss of heterozygosity; WGD, whole genome doubling.
Figure 4 with 3 supplements

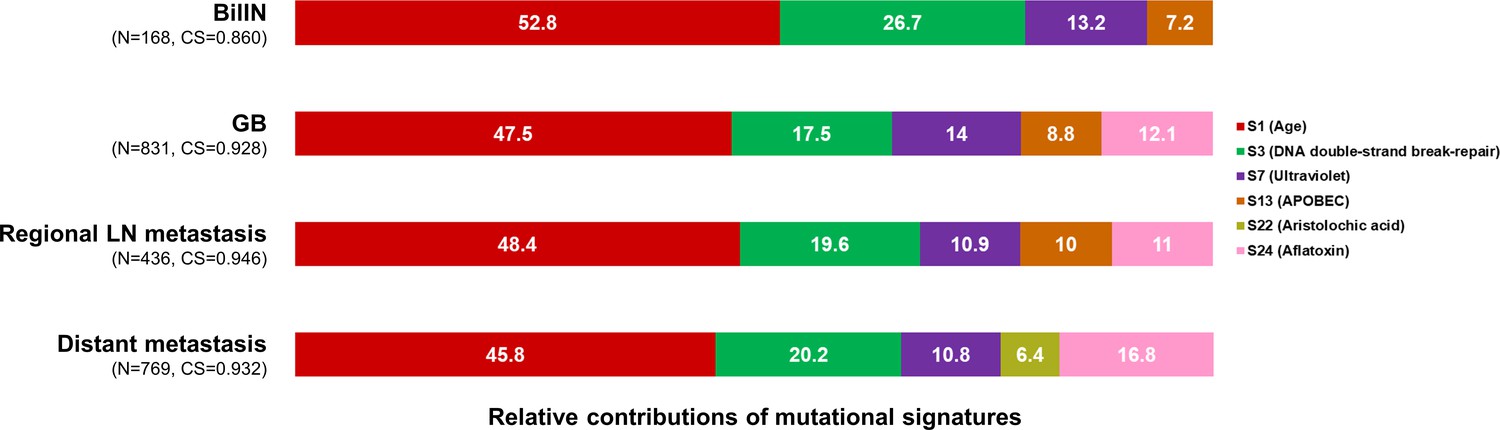
Mutational signature analysis.
(A–B) The 100% stacked bar plots compare the proportions of known COSMIC Mutational Signatures v2 within our dataset and two public (MSKCC and Shanhai) datasets (A), and each category split according to the timing of development during clonal evolution (B). The total number of mutations (N) and cosine similarity (CS) values of each category were noted. BilIN, biliary intraepithelial neoplasia; COSMIC, Catalogue Of Somatic Mutations In Cancer; GB, gallbladder; LN, lymph node; MSKCC, Memorial Sloan Kettering Cancer Center.
Figure 4—figure supplement 1

Mutational signatures within each sample from 11 gallbladder adenocarcinoma (GBAC) patients.
The 100% stacked bar plots comparing the proportions of known COSMIC Mutational Signatures v2 within each sample from 11 GBAC patients. BilIN, biliary intraepithelial neoplasia; CBD, common bile duct; COSMIC, Catalogue Of Somatic Mutations in Cancer; GB, gallbladder; LN, lymph node.
Figure 4—figure supplement 2
Mutational signatures within each category split according to the type of sample.
The 100% stacked bar plots comparing the proportions of known COSMIC Mutational Signatures v2 within each category split according to the type of sample. The total number of mutations (N) and cosine similarity (CS) values of each category were noted. BilIN, biliary intraepithelial neoplasia; COSMIC, Catalogue Of Somatic Mutations In Cancer; GB, gallbladder; LN, lymph node.
Figure 4—figure supplement 3
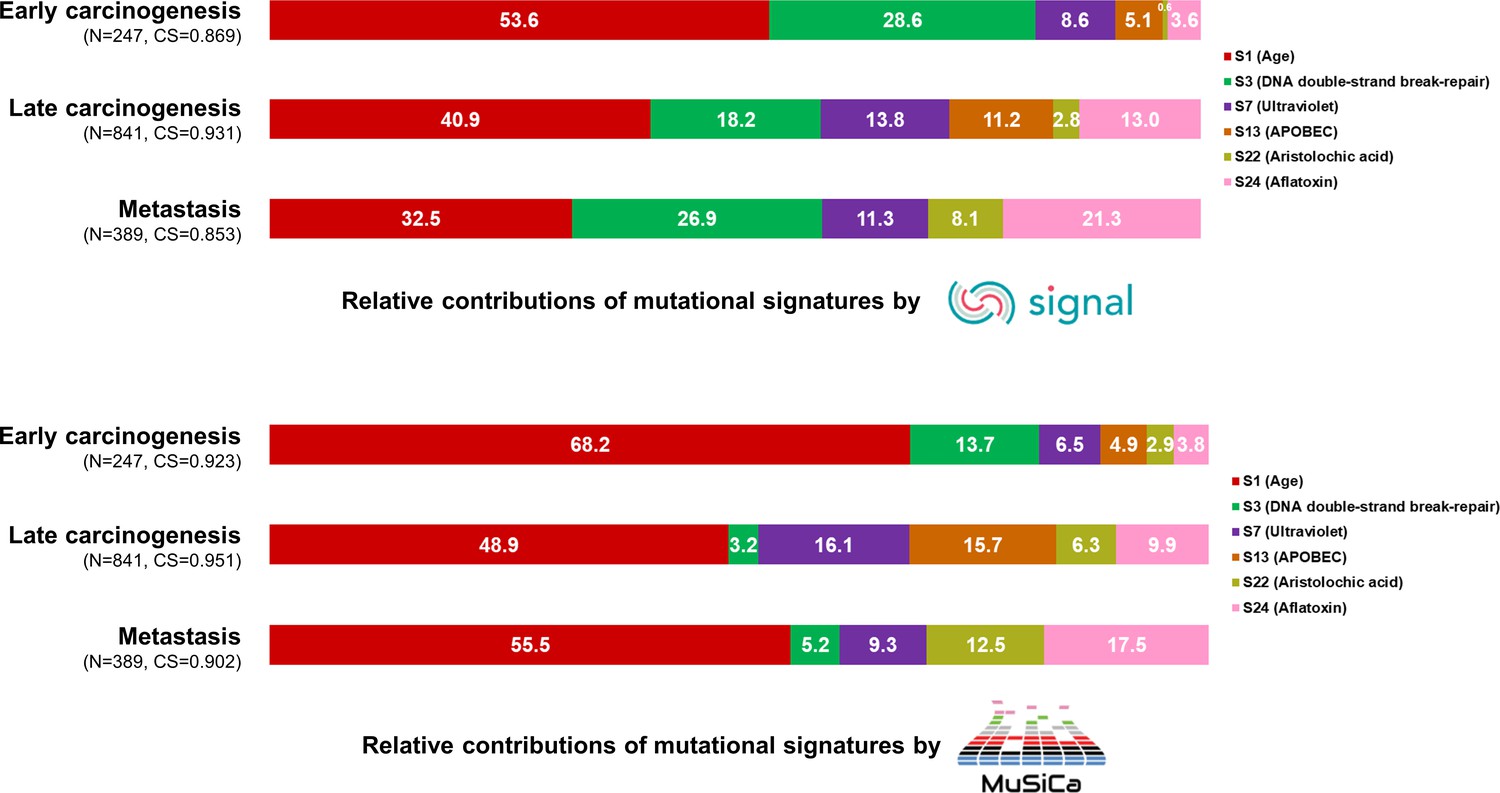
Mutational signature analysis validated by two additional tools, Signal and MuSiCa.
The 100% stacked bar plots comparing the proportions of known COSMIC Mutational Signatures v2 within each category split according to the timing of development during clonal evolution. The total number of mutations (N) and cosine similarity (CS) values of each category were noted. COSMIC, Catalogue Of Somatic Mutations in Cancer.
Figure 5

ERBB2 copy number variation during neoplastic transformation of BilIN in GB-A1.
(A–G) ERBB2 gene amplification (A and B), HER2 SISH (C and D), and HER2 IHC (F and G) were compared between BilIN (A, C) and (F) and primary GBAC (B), (D), and (G) samples and the mean ERBB2/CEP17 ratio of BilIN and GB-A1 samples were compared by using the Wilcoxon rank-sum test (E). BilIN, biliary intraepithelial neoplasia; GBAC, gallbladder adenocarcinoma; IHC, immunohistochemistry; SISH, silver in situ hybridization.
Tables
Table 1
Baseline characteristics of 11 patients with GBAC.
| Patient ID* | Sex | Age at diagnosis | ECOG PS at diagnosis | Stage at diagnosis | Differentiation |
|---|---|---|---|---|---|
| GB-A1 | F | 70 | 1 | IV | PD |
| GB-S1 | F | 66 | 1 | IV | MD |
| GB-S2 | F | 66 | 1 | IV | MD |
| GB-S3 | F | 75 | 1 | III | MD |
| GB-A2 | M | 61 | 1 | IV | MD |
| GB-S4 | M | 72 | 1 | IV | MD |
| GB-S5 | F | 70 | 1 | IV | PD |
| GB-S6 | M | 70 | 0 | IV | MD |
| GB-S7 | F | 74 | 1 | IV | PD |
| GB-S8 | M | 67 | 1 | III | WD |
| GB-S9 | M | 59 | 0 | IV | MD |
-
*
In patient ID, ‘A’ indicates autopsy cases whereas ‘S’ indicates surgery cases.
-
GBAC, gallbladder adenocarcinoma; ECOG PS, Eastern Cooperative Oncology Group performance status; M, male; F, female; PD, poorly differentiated; MD, moderately differentiated; WD, well-differentiated.
Table 2
List of subclones expanding during metastasis.
| Patient ID | Subclone | No. of mutations | Putative driver mutations | Clonal prevalence in primary tumor | Clonal prevalence in metastasis | Metastatic organ |
|---|---|---|---|---|---|---|
| GB-A1 | E | 121 | JARID2 p.K603Q (LOH) | 0.2% | 20.5% | CBD |
| F | 54 | SMAD4 p.L414fs (LOH) | 0.4% | 49.8% | Omentum 1 | |
| 27.0% | Omentum 2 | |||||
| GB-S1 | E | 6 | ROBO1 p.P1360Q | 0.0% | 59.2% | Distant LN |
| GB-S2 | H | 6 | – | 1.2% | 28.1% | Regional LN |
| GB-A2 | F | 14 | PRKCD p.I153L | 0.3% | 73.1% | Liver |
| 68.3% | Mesentery | |||||
| G | 3 | DICER1 p.T519A | 2.8% | 39.9% | Lung | |
| 61.5% | Chest wall | |||||
| GB-S4 | F | 32 | FBXW2 p.W450C | 0.0% | 34.1% | Colon wall |
| H | 36 | – | 0.0% | 34.9% | Distant LN | |
| GB-S5 | B | 28 | KIAA0100 p.F5S | 1.2% | 54.4% | Liver |
| CSMD2 p.E411K | ||||||
| GB-S6 | B | 7 | OSCP1 p.R351X | 1.1% | 60.2% | Lung |
| GB-S7 | C | 5 | – | 3.3% | 24.7% | Regional LN |
-
Putative driver mutations are indicated, and a full list of mutated genes is specified in Supplementary file 2.
-
GB, gallbladder; LN, lymph node; CBD, common bile duct.
Author response table 1
Proportion of mutations satisfying the conditions: (1) C:G > T:A variants, and (2) VAF < 5% in sample-specific clusters.
| Patient ID | Sample | Type of sample | Sample specific clusters* | Number of mutations in sample-specific clusters† | Number of filtered mutations in sample-specific clusters | Percentage (%) |
|---|---|---|---|---|---|---|
| GB-A1 | BilIN | FFPE | 2 | 34 | 3 | 8.8 |
| CBD | FFPE | 3 | 121 | 13 | 10.7 | |
| GB-S1 | BilIN | FFPE | 2 | 9 | 3 | 33.3 |
| GB | FFPE | 4 | 18 | 7 | 38.9 | |
| Distant LN | FFPE | 7 | 6 | 0 | 0.0 | |
| GB-S2 | BilIN | FFPE | 6 | 8 | 3 | 37.5 |
| GB | FFPE | 0 | 7 | 2 | 28.6 | |
| GB-S3 | BilIN | FFPE | 3 | 7 | 1 | 14.3 |
| GB | FFPE | 2 | 3 | 0 | 0.0 | |
| GB-A2 | GB | Fresh-frozen | 2 | 40 | 0 | 0.0 |
| Lung (old) | FFPE | 10 | 17 | 1 | 5.9 | |
| Lung | Fresh-frozen | 5 | 15 | 0 | 0.0 | |
| Chest wall | Fresh-frozen | 3 | 23 | 0 | 0.0 | |
| Liver | Fresh-frozen | 4 | 31 | 0 | 0.0 | |
| Mesentery | Fresh-frozen | 6 | 8 | 2 | 25.0 | |
| GB-S4 | Colon wall | FFPE | 3 | 36 | 0 | 0.0 |
| Distant LN | FFPE | 1 | 9 | 2 | 22.2 | |
| GB-S5 | GB | FFPE | 3 | 13 | 0 | 0.0 |
| GB-S6 | GB | FFPE | 1 | 5 | 0 | 0.0 |
| Lung | FFPE | 2 | 7 | 0 | 0.0 | |
| GB-S7 | GB | FFPE | 0 | 11 | 0 | 0.0 |
| Regional LN | FFPE | 3 | 5 | 0 | 0.0 | |
| GB-S8 | GB | FFPE | 2 | 35 | 4 | 11.4 |
| Regional LN | FFPE | 0 | 81 | 3 | 3.7 |
Additional files
-
Supplementary file 1
Tables.
(A) Baseline characteristics of samples are summarized. (B) Mutational signatures of our dataset are analyzed by three different tools, Mutalisk, Signal, and MuSiCa.
- https://cdn.elifesciences.org/articles/78636/elife-78636-supp1-v3.docx
-
Supplementary file 2
Detected somatic alternations in 11 patients with gallbladder adenocarcinoma (GBAC).
Full list of mutations called in our cohort.
- https://cdn.elifesciences.org/articles/78636/elife-78636-supp2-v3.xlsx
-
MDAR checklist
- https://cdn.elifesciences.org/articles/78636/elife-78636-mdarchecklist1-v3.docx
Download links
A two-part list of links to download the article, or parts of the article, in various formats.
Downloads (link to download the article as PDF)
Open citations (links to open the citations from this article in various online reference manager services)
Cite this article (links to download the citations from this article in formats compatible with various reference manager tools)
Gallbladder adenocarcinomas undergo subclonal diversification and selection from precancerous lesions to metastatic tumors
eLife 11:e78636.
https://doi.org/10.7554/eLife.78636


