Mitochondrial redox adaptations enable alternative aspartate synthesis in SDH-deficient cells
- Human Biology Division, Fred Hutchinson Cancer Center, United States
- Molecular Medicine & Mechanisms of Disease Program, University of Washington, United States
- Department of Chemistry and Biochemistry, New Mexico State University, United States
Figures
Figure 1 with 1 supplement
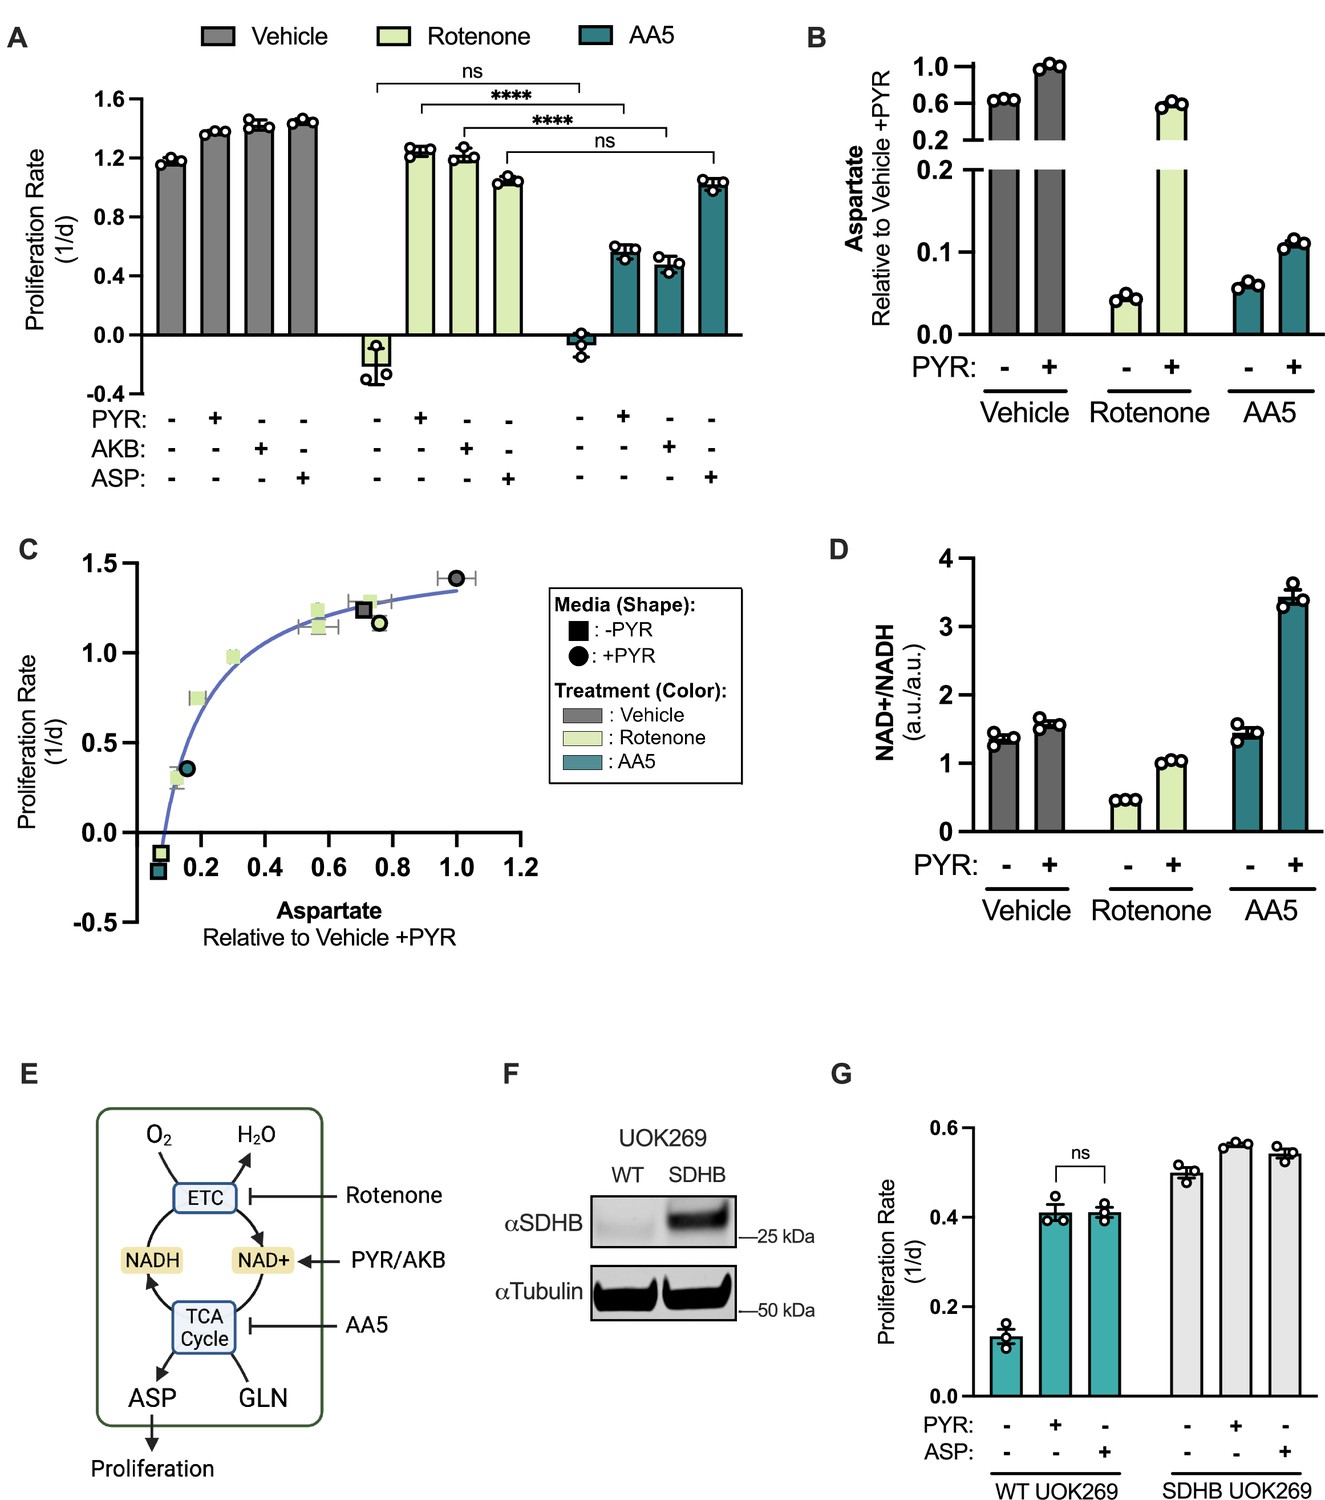
SDH inhibition blocks proliferation, which is incompletely rescued by electron acceptors but robustly restored by aspartate.
(A) Proliferation rates of 143B cells treated with vehicle (DMSO), 50 nM rotenone, or 5 µM atpenin A5 (AA5) cultured in pyruvate free DMEM with no addition, 1 mM pyruvate (PYR), 1 mM alpha-ketobutyrate (AKB), or 20 mM aspartate (ASP). (B) Aspartate levels measured by liquid chromatography-mass spectrometry (LCMS) metabolomics in 143B cells, comparing normalized aspartate ion counts (a.u.; arbitrary units) from cells treated with vehicle (DMSO), 50 nM rotenone, or 5 µM AA5 in pyruvate free DMEM with no addition or 1 mM PYR for 6 hr (n=3). (C) Proliferation rate (y-axis) versus normalized aspartate levels (x-axis) of 143B cells after 6 hours of the indicated treatments (n=3). Data points without borders correspond to a dose titration of rotenone (25 12.5, 6.25, 3.125, 1.565 and 0 nM) in pyruvate free DMEM. Data points with a black border correspond to cells treated with standard dosing of 50 nM rotenone and 5 µM AA5 in DMEM, with and without pyruvate as indicated. See Figure 1—figure supplement 1K-L for additional information. (D) NAD+/NADH measured by LCMS metabolomics of 143B cells treated with vehicle (DMSO), 50 nM rotenone, or 5 µM AA5 in pyruvate free DMEM with no addition or 1 mM PYR for 6 hours (n=3). (E) Schematic showing that rotenone inhibits the ETC, blocking NADH oxidation causing an indirect TCA cycle impairment that can be overcome by exogenous electron acceptors (PYR/AKB), while AA5 directly blocks the TCA cycle and aspartate synthesis. (F) Western blot for SDHB and α-tubulin (tubulin) in WT UOK269 cells or UOK269 cells with restoration of SDHB (SDHB UOK269) as indicated. Tubulin is used as a loading control. (G) Proliferation of WT UOK269 and SDHB UOK269 cells cultured in pyruvate-free DMEM supplemented with vehicle (H2O), 1 mM PYR, or 20 mM ASP (n=3). Data are plotted as means ± standard deviation (SD) and compared with an unpaired two-tailed student’s t-test. p<0.05*, p<0.01**, p<0.001***, p<0.0001****.
-
Figure 1—source data 1
Proliferation rates and relative metabolite levels by LCMS in Figure 1.
- https://cdn.elifesciences.org/articles/78654/elife-78654-fig1-data1-v3.zip
-
Figure 1—source data 2
Uncropped western blot for Figure 1F.
- https://cdn.elifesciences.org/articles/78654/elife-78654-fig1-data2-v3.zip
Figure 1—figure supplement 1
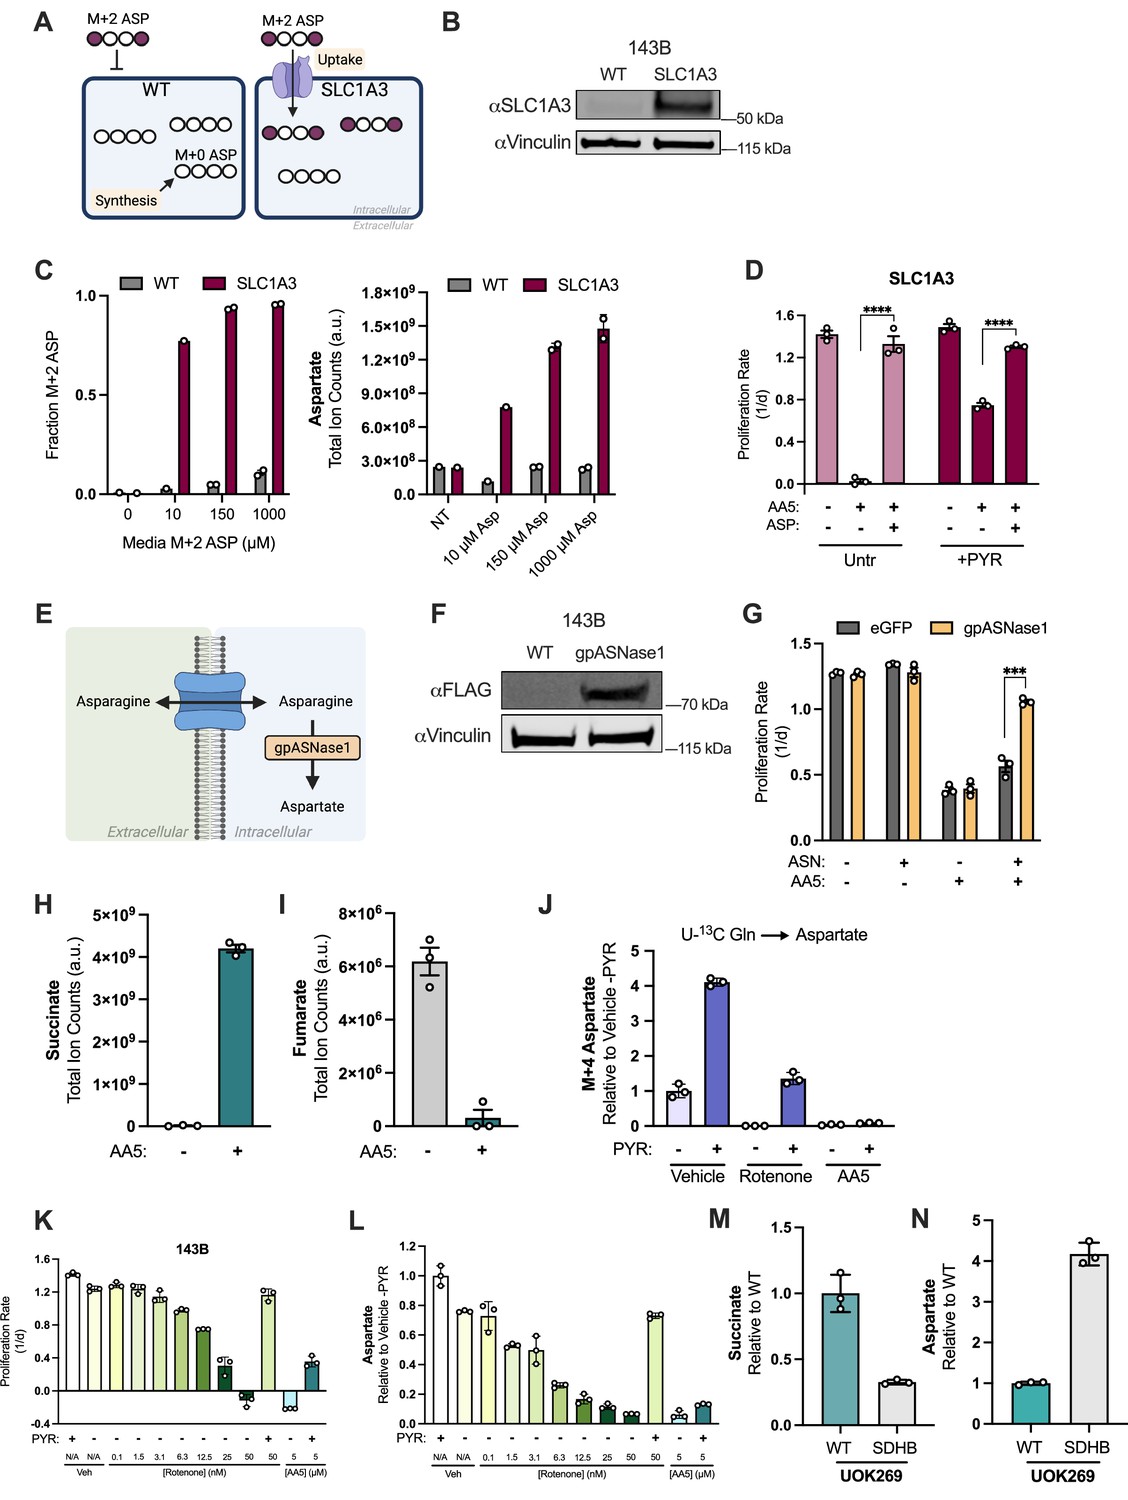
Alternative methods of aspartate acquisition and characterization of metabolic phenotypes in SDH-impaired cells.
(A) Schematic demonstrating how the aspartate transporter SLC1A3 allows for cells to uptake aspartate, which can be measured by the incorporation of isotopically labeled extracellular aspartate (M+2). (B) Western blot for SLC1A3 and vinculin in 143B cells expressing SLC1A3 or wild type (WT) control 143B cells. Vinculin is used as a loading control. (C) Fractional labeling of aspartate and total aspartate levels measured by LCMS metabolomics from 143B cells with or without SLC1A3 expression after 1 hr of exposure to the indicated concentrations of 1,4-13C labeled (M+2) aspartate (n=1 or n=2). (D) Proliferation rates of SLC1A3 expressing 143B cells treated with vehicle (DMSO), 5 µM AA5 or 5 µM AA5 and 1 mM aspartate in pyruvate-free DMEM with no addition or 1 mM pyruvate (n=3). (E) Schematic depicting how expression of gpASNase1 permits environmental asparagine (ASN) to be used to support intracellular aspartate levels. (F) Western blot for FLAG and tubulin from WT 143B cells and 143B cells expressing FLAG-tagged gpASNase1. Tubulin is used as a loading control. (G) Proliferation rates of 143B cells expressing eGFP or gpASNase1 cultured in DMEM with 1 mM pyruvate and supplemented with vehicle (H2O) or 1 mM asparagine (ASN) and treated with vehicle (DMSO) or 5 µM AA5 (n=3). (H) Succinate levels measured by LCMS metabolomics from 143B cells treated with vehicle (DMSO) or 5 µM AA5 for 6 hours (n=3). (I) Fumarate levels measured by LCMS metabolomics from 143B cells treated with vehicle (DMSO) or 5 µM AA5 for 6 hr (n=3). (J) M+4 aspartate levels measured by LCMS metabolomics from 143B cells cultured with pyruvate/glutamine free DMEM with 4 mM U-13C glutamine and treated with vehicle (DMSO), 50 nM rotenone, or 5 µM AA5 in the absence and presence of 1 mM pyruvate for 6 hr (n=3). (K) Proliferation rates of 143B cells treated with a dose titration of rotenone (50, 25 12.5, 6.25, 3.125, 1.565 and 0 nM) in pyruvate-free DMEM (n=3). Also included are proliferation rates of cells treated with vehicle (“N/A”), 50 nM rotenone, or 5 µM AA5 in pyruvate-free DMEM with or without 1 mM pyruvate. (L) Relative aspartate levels measured by LCMS metabolomics of 143B cells treated with a dose titration of rotenone (50, 25 12.5, 6.25, 3.125, 1.565 and 0 nM) in pyruvate-free DMEM for 6 hr (n=3). Also included are relative aspartate levels of cells treated with vehicle (‘N/A’), 50 nM rotenone, or 5 µM AA5 in pyruvate-free DMEM with and without 1 mM pyruvate supplementation for 6 hr. (M) Relative succinate levels measured by LCMS metabolomics from WT and SDHB UOK269 cells in DMEM with 1 mM pyruvate for 6 hr (n=3). (N) Relative aspartate levels measured by LCMS metabolomics from WT and SDHB UOK269 cells in DMEM with 1 mM pyruvate for 6 hr (n=3). Data are plotted as means ± standard deviation (SD) and compared with an unpaired two-tailed student’s t-test. p<0.05*, p<0.01**, p<0.001***, p<0.0001****.
-
Figure 1—figure supplement 1—source data 1
Proliferation rates and metabolite levels by LCMS in Figure 1—figure supplement 1.
- https://cdn.elifesciences.org/articles/78654/elife-78654-fig1-figsupp1-data1-v3.zip
-
Figure 1—figure supplement 1—source data 2
Uncropped western blot for Figure 1—figure supplement 1B and F.
- https://cdn.elifesciences.org/articles/78654/elife-78654-fig1-figsupp1-data2-v3.zip
Figure 2 with 1 supplement
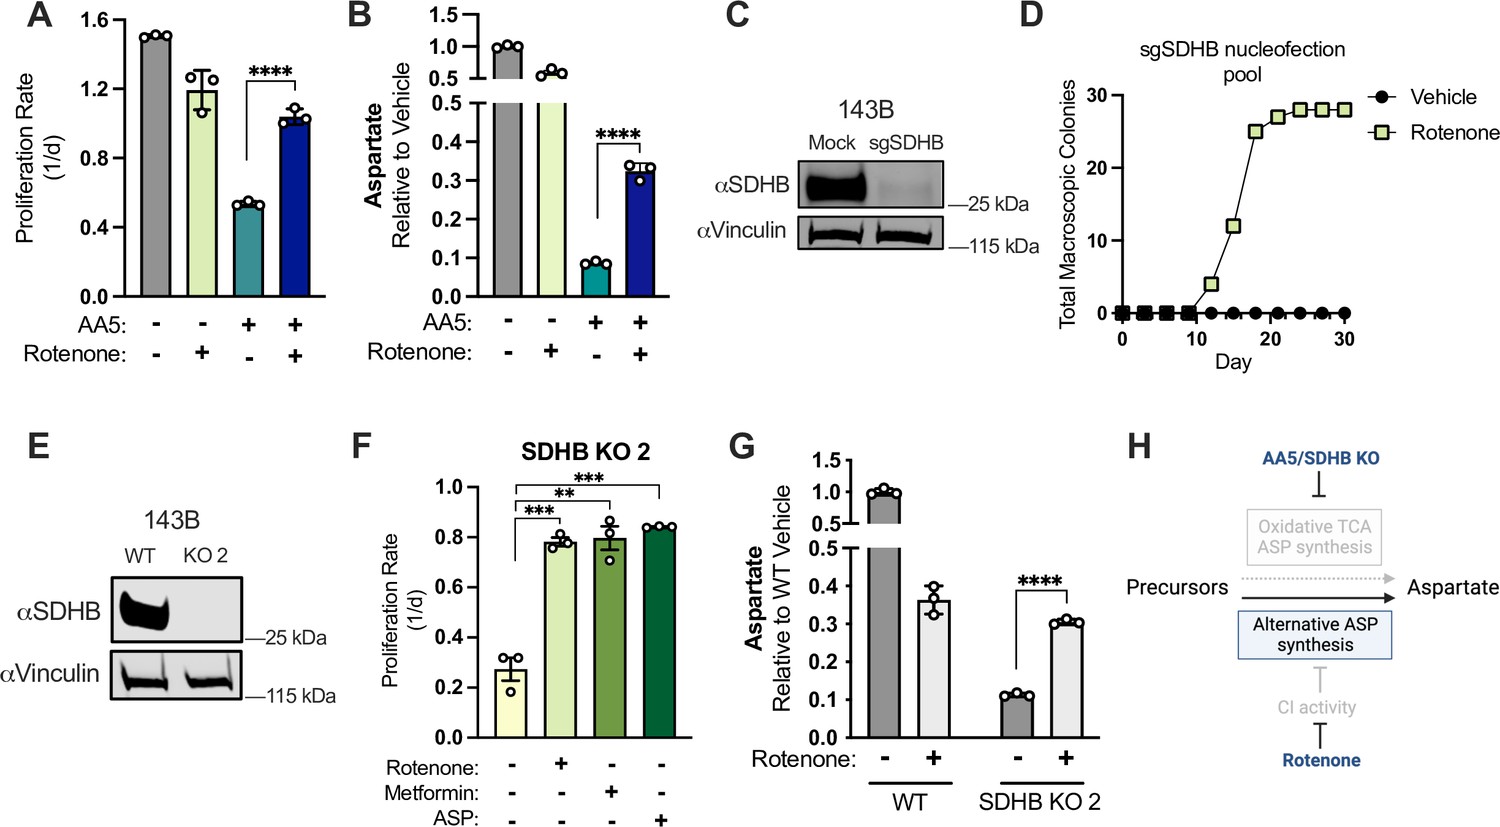
CI inhibition is sufficient to induce aspartate synthesis and cell proliferation in SDH-deficient cancer cells.
(A) Proliferation rates of 143B cells cultured in DMEM with 1 mM PYR treated with vehicle (DMSO), 50 nM rotenone, 5 µM AA5, or 5 µM AA5 and 50 nM rotenone (n=3). (B) Aspartate levels of 143B cells cultured in DMEM with 1 mM PYR treated with vehicle (DMSO), 50 nM rotenone, 5 µM AA5, or 5 µM AA5 and 50 nM rotenone for 6 hours (n=3). (C) Western blot for SDHB and vinculin from 143B cells 3 days after nucleofection with plasmid GFP (Mock) or sgRNAs and sNLS-SpCas9 for SDHB as indicated. Vinculin is used as a loading control. (D) Number of single cell clones that formed colonies from sgSDHB pool in 143B cells treated with vehicle (DMSO) or 30 nM rotenone during a 30 day period. (E) Western blot for SDHB and vinculin from WT 143B cells and SDHB KO 143B clone 2. Vinculin is used as a loading control. (F) Proliferation rates of SDHB KO 143B cells (clone 2) cultured in DMEM with 1 mM PYR and treated with vehicle (DMSO), 50 nM rotenone, 1 mM metformin, or 20 mM ASP (n=3). (G) Aspartate levels measured by LCMS metabolomics of WT 143B cells and SDHB KO 2 cells cultured in DMEM with 1 mM PYR and treated with vehicle (DMSO) or 50 nM rotenone for 6 hr (n=3). (H) Schematic showing that CI inhibition promotes alternative aspartate synthesis pathways upon SDH disruption. Data are plotted as means ± standard deviation (SD) and compared with an unpaired two-tailed student’s t-test. p<0.05*, p<0.01**, p<0.001***, p<0.0001****.
-
Figure 2—source data 1
Proliferation rates, relative metabolite levels by LCMS, and other data in Figure 2.
- https://cdn.elifesciences.org/articles/78654/elife-78654-fig2-data1-v3.zip
-
Figure 2—source data 2
Uncropped western blots for Figure 2C and E.
- https://cdn.elifesciences.org/articles/78654/elife-78654-fig2-data2-v3.zip
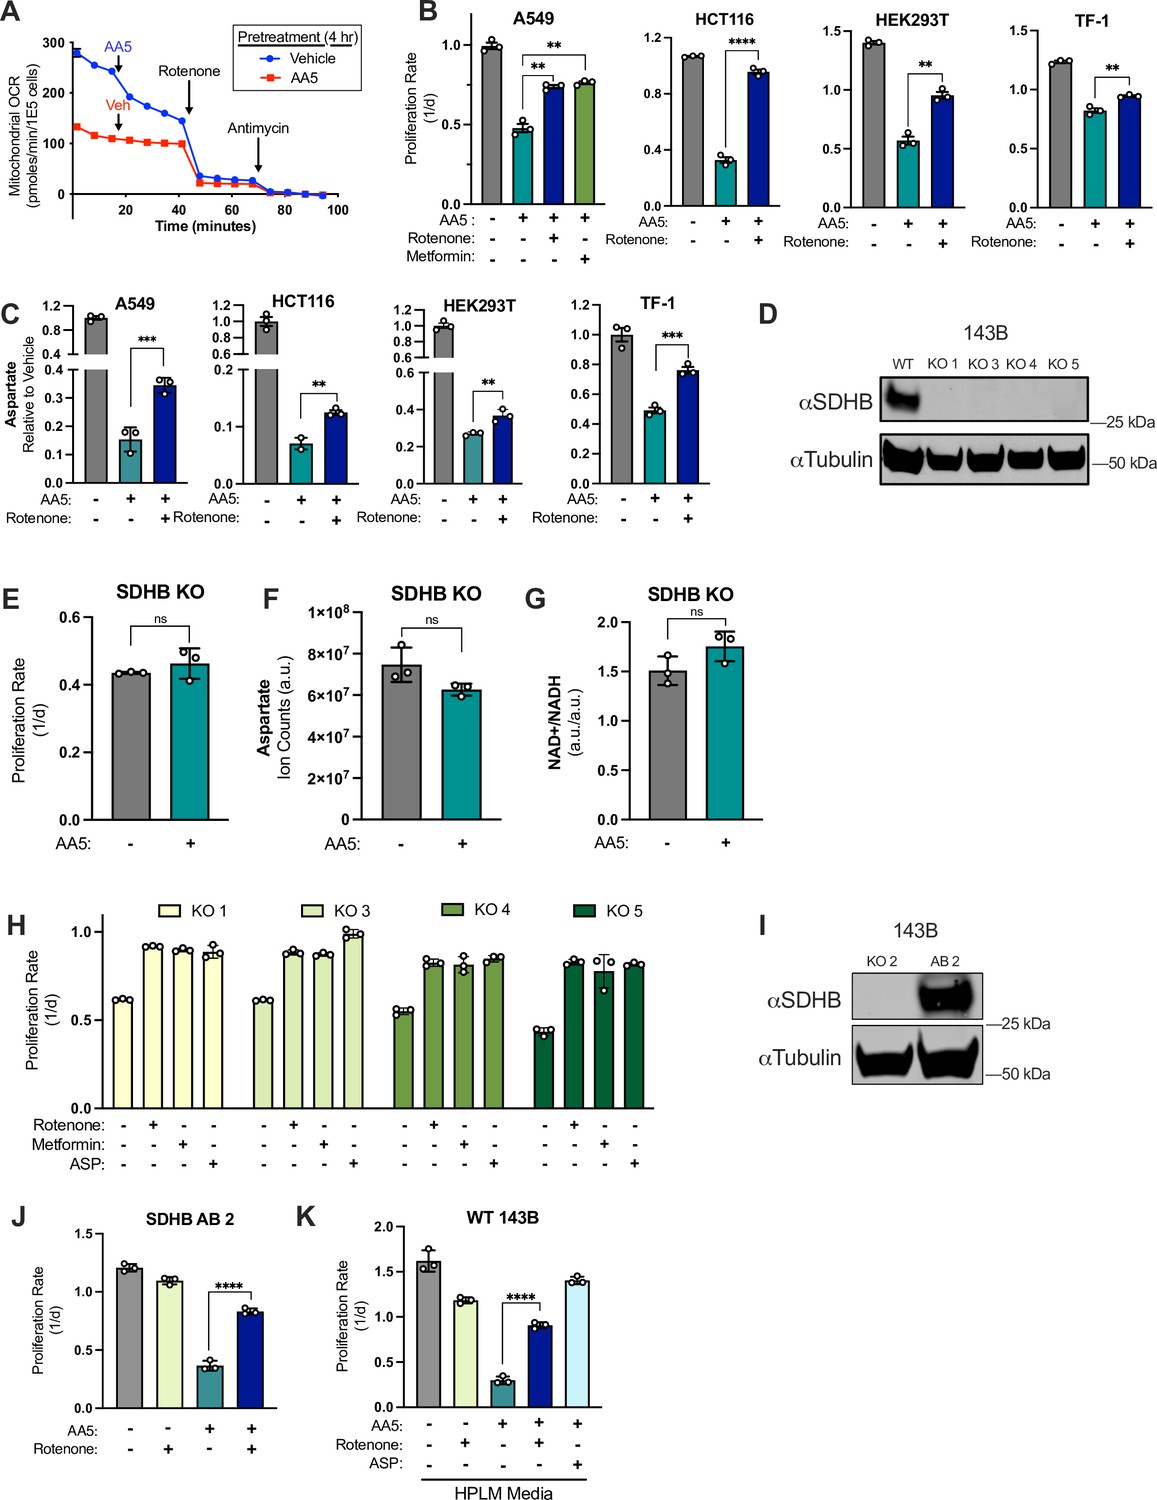
Figure 2—figure supplement 1
Characterization of interactions between CI inhibition and SDH status.
(A) Mitochondrial oxygen consumption rates in WT 143B cells pretreated with vehicle (DMSO) or 5 µM AA5 for 4 hr, then injected with vehicle (DMSO) or 5 µM AA5 as indicated, followed by treatment of all conditions with 100 nM rotenone and 10 µM antimycin (n=3) in DMEM with 1 mM pyruvate. (B) Proliferation rates of A549, HCT116, HEK293T, and TF-1 cells cultured in DMEM with 1 mM pyruvate and treated with vehicle (DMSO), AA5, or AA5 and rotenone. A549 cells were treated with 2.5 µM AA5, 80 nM rotenone, and 500 μM metformin and HCT116, HEK293T, and TF-1 cells were treated with 5 µM AA5 and 50 nM rotenone (n=3). (C) Relative aspartate levels measured by LCMS metabolomics of A549, HCT116, HEK293T, and TF-1 cells cultured in DMEM with 1 mM pyruvate and treated with vehicle (DMSO), AA5, or AA5 and rotenone for 6 hr as done above in B (n=3). (D) Western blot for SDHB and tubulin from WT 143B cells and four SDHB KO 143B clones. Tubulin is used as a loading control. (E) Proliferation rates of SDHB KO 143B cells (clone 5) treated with either vehicle (DMSO) or 5 µM AA5 in DMEM with 1 mM pyruvate (n=3). (F) Aspartate levels measured by LCMS metabolomics from SDHB KO 143B cells (clone 5) treated with either vehicle (DMSO) or 5 µM AA5 in DMEM with 1 mM pyruvate for 6 hr (n=3). (G) NAD+/NADH measured by LCMS metabolomics of SDHB KO 143B cells (clone 5) treated with either vehicle (DMSO) or 5 µM AA5 in DMEM with 1 mM pyruvate for 6 hr (n=3). (H) Proliferation rates of corresponding SDHB KO clones from (D) treated with vehicle (DMSO), 50 nM rotenone, 1 mM metformin, or 20 mM ASP in DMEM with 1 mM pyruvate (n=3). (I) Western blot for SDHB and tubulin from SDHB KO clone 2 (KO 2) and the cells with SDHB cDNA added back (AB 2). Tubulin was used as a loading control. (J) Proliferation rates of SDHB AB 2 cells treated with vehicle (DMSO), 50 nM rotenone, 5 µM AA5, or 5 µM AA5 and 50 nM rotenone (n=3). (K) Proliferation rates of WT 143B cells cultured in HPLM and treated with vehicle (DMSO), 50 nM rotenone, 5 µM AA5, 5 µM AA5 and 50 nM rotenone, or 5 µM AA5 and 20 mM ASP (n=3). Data are plotted as means ± standard deviation (SD) except in A which are means ± standard error of the mean (SEM) and compared with an unpaired two-tailed student’s t-test. p<0.05*, p<0.01**, p<0.001***, p<0.0001****.
-
Figure 2—figure supplement 1—source data 1
Proliferation rates, metabolite levels by LCMS, and mitochondrial oxygen consumption values in Figure 2—figure supplement 1.
- https://cdn.elifesciences.org/articles/78654/elife-78654-fig2-figsupp1-data1-v3.zip
-
Figure 2—figure supplement 1—source data 2
Uncropped western blot for Figure 2—figure supplement 1D and I.
- https://cdn.elifesciences.org/articles/78654/elife-78654-fig2-figsupp1-data2-v3.zip
Figure 3 with 2 supplements
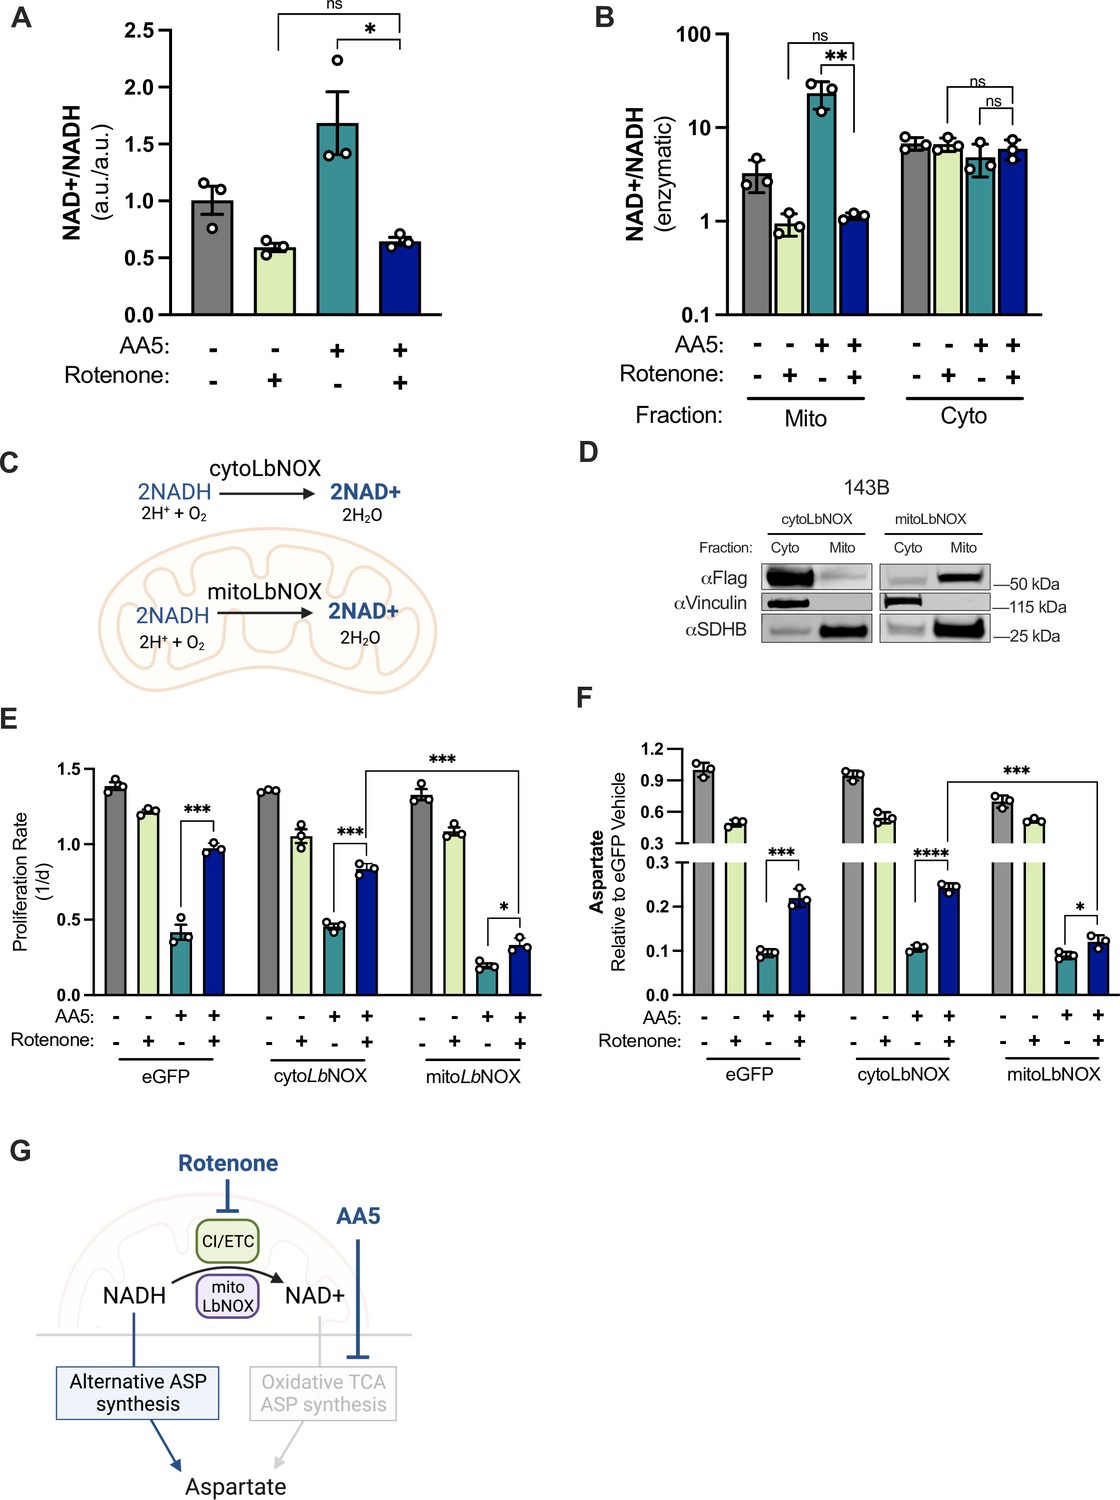
CI inhibition decreases mitochondrial NAD+/NADH, which is required for aspartate synthesis and proliferation in SDH-impaired cells.
(A) Whole cell NAD+/NADH measured by LCMS metabolomics of 143B cells cultured in DMEM with 1 mM PYR and treated with vehicle (DMSO), 50 nM rotenone, 5 µM AA5, or 5 µM AA5 and 50 nM rotenone for 6 hr (n=3). (B) Cytosolic and mitochondrial NAD+/NADH measured by enzymatic assay of 143B cells cultured in DMEM with 1 mM PYR and treated with vehicle (DMSO), 50 nM rotenone 5 µM AA5, or 5 µM AA5 and 50 nM rotenone for 6 hr (n=3). (C) Schematic depicting the functions of FLAG-tagged cytoLbNOX and mitoLbNOX in each compartment as indicated. (D) Western blot for FLAG, Vinculin, and SDHB from 143B cells expressing FLAG-tagged cytoLbNOX or mitoLbNOX, in cytosolic or mitochondrial fractions isolated by differential centrifugation. Vinculin is a loading control for cytosol and SDHB is a loading control for mitochondria. (E) Proliferation rates of eGFP, cytoLbNOX, and mitoLbNOX expressing 143B cells cultured in DMEM with 1 mM PYR treated with vehicle (DMSO), 50 nM rotenone, 5 µM AA5, or 5 µM AA5 and 50 nM rotenone (n=3). (F) Aspartate levels measured by LCMS metabolomics of eGFP, cytoLbNOX, and mitoLbNOX expressing 143B cells cultured in DMEM with 1 mM PYR and treated with vehicle (DMSO), 50 nM rotenone, 5 µM AA5, or 5 µM AA5 and 50 nM rotenone for 6 hr (n=3). (G) Schematic showing how compartment-specific mitochondrial redox alterations promote alternative aspartate synthesis pathways in SDH-impaired cells. Data are plotted as means ± standard deviation (SD) with the exception of A which is plotted as means ± standard error of the mean (SEM) and compared with an unpaired two-tailed student’s t-test. p<0.05*, p<0.01**, p<0.001***, p<0.0001****.
-
Figure 3—source data 1
Proliferation rates, relative metabolite levels by LCMS, and enzymatic assay values in Figure 3.
- https://cdn.elifesciences.org/articles/78654/elife-78654-fig3-data1-v3.zip
-
Figure 3—source data 2
Uncropped western blot for Figure 3D.
- https://cdn.elifesciences.org/articles/78654/elife-78654-fig3-data2-v3.zip
Figure 3—figure supplement 1
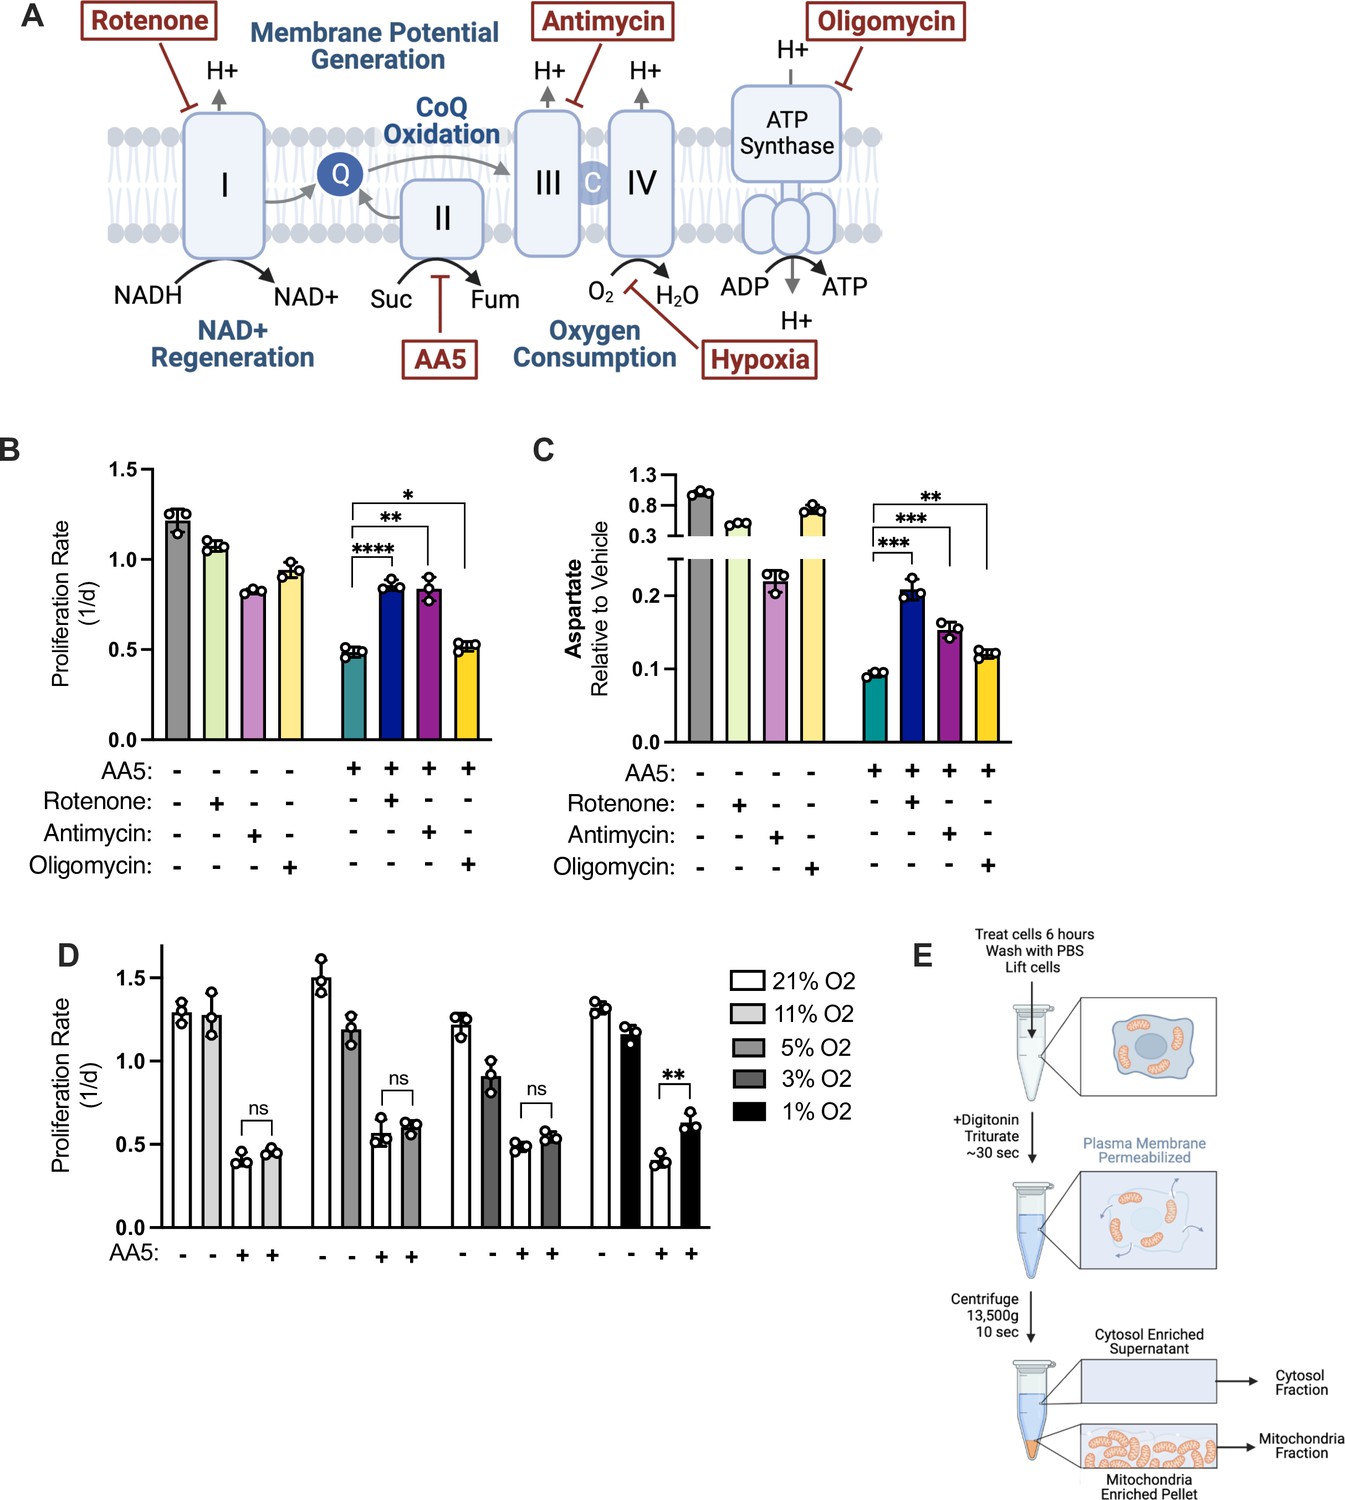
Effects of ETC inhibition in SDH-deficient cells.
(A) Schematic showing the metabolic roles of the electron transport chain and ATP synthase and depicting the sites of action for rotenone, AA5, antimycin A, hypoxia, and oligomycin. (B) Proliferation rates of WT 143B cells cultured in DMEM with 1 mM pyruvate and treated with vehicle (DMSO), 50 nM rotenone, 5 µM AA5, 800 nM Antimycin A, 1 µM oligomycin, and 5 µM AA5 and 50 nM rotenone, 5 µM AA5 and 800 nM Antimycin A, or 5 µM AA5 and 1 µM oligomycin (n=3). (C) Relative aspartate levels measured by LCMS metabolomics of WT 143B cells cultured in DMEM with 1 mM pyruvate and treated with vehicle (DMSO), 50 nM rotenone, 5 µM AA5, 800 nM Antimycin A, 1 µM oligomycin, and 5 µM AA5 and 50 nM rotenone, 5 µM AA5 and 800 nM Antimycin A, or 5 µM AA5 and 1 µM oligomycin for 6 hr (n=3). (D) Proliferation rates of WT 143B cells cultured in DMEM with 1 mM pyruvate and treated with either vehicle (DMSO) or 5 µM AA5. Experiments were done in 11, 5, 3, and 1% O2, with paired control conditions at 21% O2 shown for each experiment (n=3). (E) Diagram showing how mitochondrial fractions were obtained for the compartmentalized NAD+/NADH ratio measurements in Figure 3B. Protocol adapted from Lee et al., 2019. Data are plotted as means ± standard deviation (SD) and compared with an unpaired two-tailed student’s t-test. p<0.05*, p<0.01**, p<0.001***, p<0.0001****.
-
Figure 3—figure supplement 1—source data 1
Proliferation rates and metabolite levels by LCMS in Figure 3—figure supplement 1.
- https://cdn.elifesciences.org/articles/78654/elife-78654-fig3-figsupp1-data1-v3.zip
Figure 3—figure supplement 2
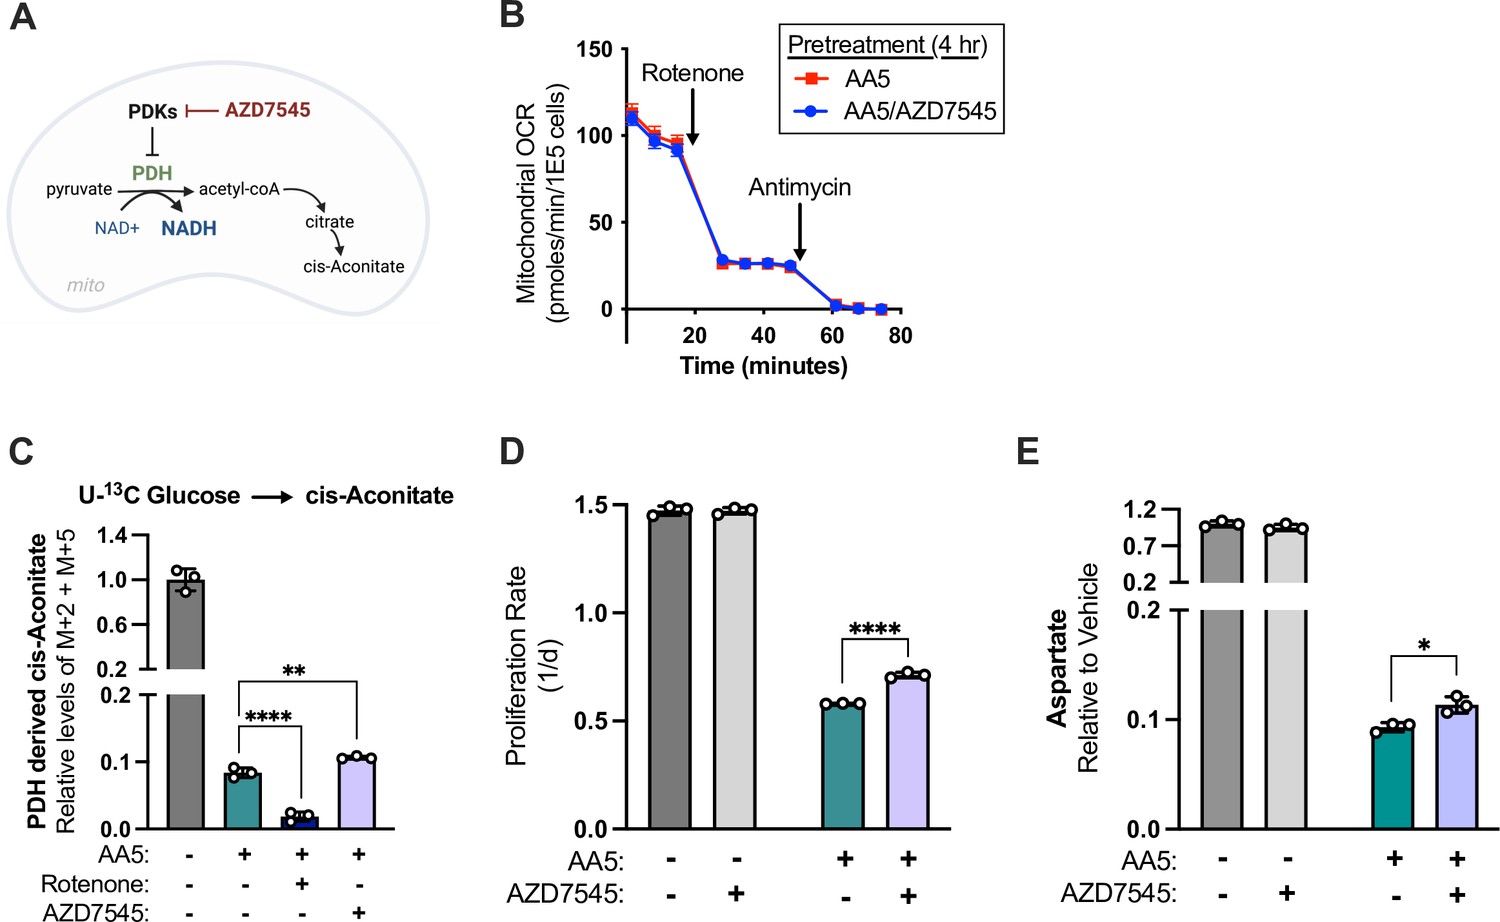
Effects of PDK inhibition in SDH-deficient cells.
(A) Schematic showing the mechanism of action of AZD7545 to activate pyruvate dehydrogenase (PDH) by inhibition of the negative regulators of PDH, pyruvate dehydrogenase kinases (PDKs). (B) Mitochondrial oxygen consumption rates of WT 143B cells in DMEM with 1 mM pyruvate and pre-treated for 4 hr with 5 µM AA5 or 5 µM AA5 and 5 µM AZD7545 with indicated injections of 100 nM rotenone and 10 µM antimycin (n=3). (C) Combined M+2 and M+5 cis-aconitate levels relative to vehicle treated cells measured by LCMS metabolomics from WT 143B cells cultured in glucose/pyruvate-free DMEM with 12C 1 mM AKB and 25 mM U-13C glucose and treated with vehicle (DMSO), 5 µM AA5, 5 µM AA5 and 50 nM rotenone, or 5 µM AA5 and 5 µM AZD7545 for 6 hr (n=3). (D) Proliferation rates of WT 143B cells cultured in DMEM with 1 mM pyruvate and treated with vehicle (DMSO), 5 µM AA5, 5 µM AZD7545, or 5 µM AA5 and 5 µM AZD7545 (n=3). (E) Aspartate levels measured by LCMS metabolomics of WT 143B cells cultured in DMEM with 1 mM pyruvate and treated with vehicle (DMSO), 5 µM AA5, 5 µM AZD, or 5 µM AA5 and 5 µM AZD for 6 hr (n=3). Data are plotted as means ± standard deviation (SD) except in B which are means ± standard error of the mean (SEM) and compared with an unpaired two-tailed student’s t-test. p<0.05*, p<0.01**, p<0.001***, p<0.0001****.
-
Figure 3—figure supplement 2—source data 1
Proliferation rates, relative metabolite levels by LCMS, and mitochondrial oxygen consumption values in Figure 3—figure supplement 2.
- https://cdn.elifesciences.org/articles/78654/elife-78654-fig3-figsupp2-data1-v3.zip
Figure 4 with 1 supplement
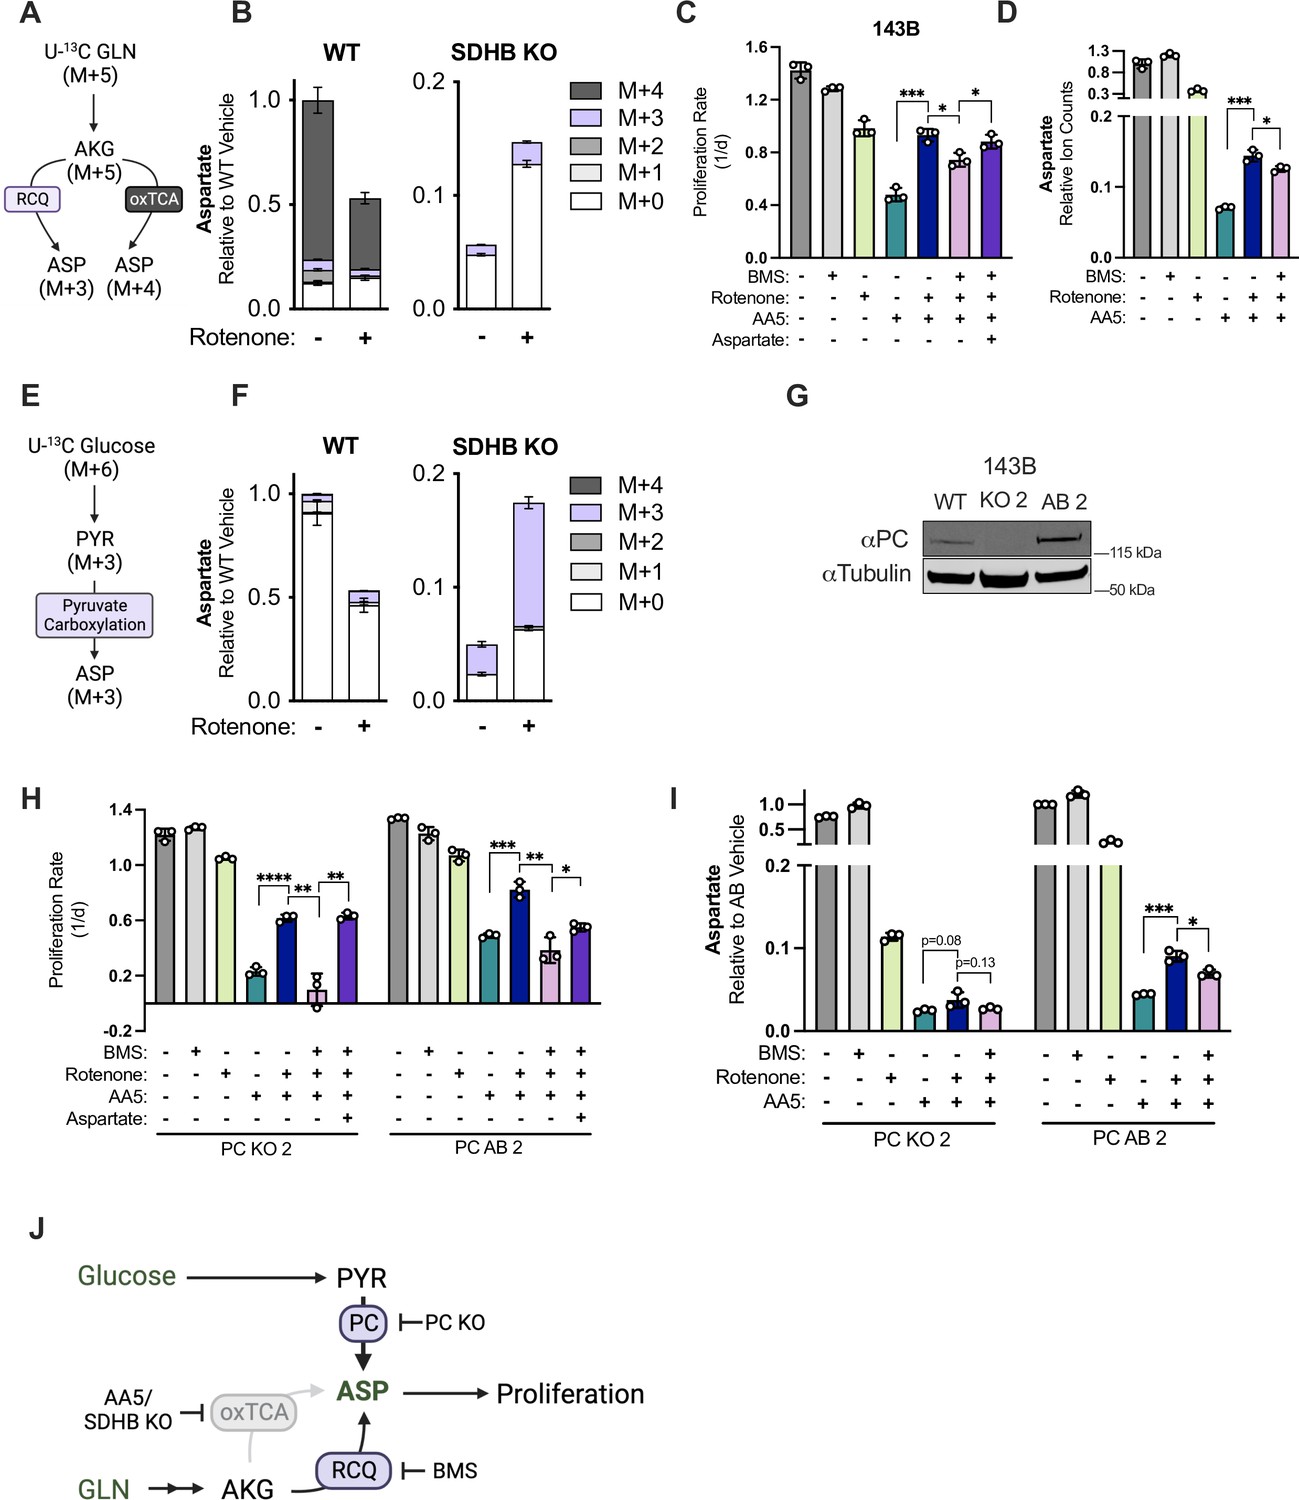
Reductive carboxylation and pyruvate carboxylation drive aspartate synthesis in SDH impaired cells upon CI inhibition.
(A) Schematic depicting metabolic pathway usage for isotopologue patterns of aspartate derived from U-13C glutamine. (B) Relative ion counts for all aspartate isotopologues derived from U-13C glutamine measured by LCMS metabolomics in WT and SDHB KO 143B cells treated with either vehicle (DMSO) or 50 nM rotenone in pyruvate-free DMEM with 1 mM AKB for 6 hr (n=3). (C) Proliferation rates of WT 143B cells treated with either vehicle (DMSO); 25 µM BMS-303141 (BMS); 50 nM rotenone; 5 µM AA5; 5 µM AA5 and 50 nM rotenone; 5 µM AA5, 50 nM rotenone and 25 µM BMS; or 5 µM AA5, 50 nM rotenone, 25 µM BMS, and 20 mM aspartate in DMEM with 1 mM pyruvate (n=3). (D) Relative aspartate levels measured by LCMS metabolomics of WT 143B cells treated with either vehicle (DMSO); 25 µM BMS; 50 nM rotenone; 5 µM AA5; 5 µM AA5 and 50 nM rotenone; 5 µM AA5, 50 nM rotenone and 25 µM BMS in pyruvate free DMEM with 1 mM AKB for 6 hr (n=3). (E) Schematic depicting metabolic pathway usage for isotopologue patterns of aspartate derived from U-13C glucose. (F) Relative ion counts for aspartate isotopologues derived from U-13C glucose measured by LCMS metabolomics in WT and SDHB KO 143B cells treated with either vehicle (DMSO) or 50 nM rotenone in pyruvate free DMEM with 1 mM AKB for 6 hr (n=3). (G) Western blot for PC in WT 143B cells, PC KO clone 2, and PC KO clone 2 with PC cDNA added back. Tubulin is used as a loading control. (H) Proliferation rates of PC KO and PC AB 143B cells treated with vehicle (DMSO); 25 µM BMS; 50 nM rotenone; 5 µM AA5; 5 µM AA5 and 50 nM rotenone; 5 µM AA5, 50 nM rotenone and 25 µM BMS; or 5 µM AA5, 50 nM rotenone, 25 µM BMS, and 20 mM aspartate in DMEM with 1 mM PYR (n=3). (I) Relative aspartate levels measured by LCMS metabolomics of PC KO and PC AB 143B cells treated with vehicle (DMSO); 25 µM BMS; 50 nM rotenone; 5 µM AA5; 5 µM AA5 and 50 nM rotenone; 5 µM AA5, 50 nM rotenone and 25 µM BMS; or 5 µM AA5, 50 nM rotenone, 25 µM BMS in pyruvate free DMEM with 1 mM AKB for 6 hr (n=3). (J) Schematic showing two alternative aspartate synthesis pathways induced by CI inhibition in SDH-impaired cells. Data are plotted as means ± standard deviation (SD) and compared with an unpaired two-tailed student’s t-test. p<0.05*, p<0.01**, p<0.001***, p<0.0001****.
-
Figure 4—source data 1
Proliferation rates and relative metabolite levels by LCMS in Figure 4.
- https://cdn.elifesciences.org/articles/78654/elife-78654-fig4-data1-v3.zip
-
Figure 4—source data 2
Uncropped western blot for Figure 4G.
- https://cdn.elifesciences.org/articles/78654/elife-78654-fig4-data2-v3.zip
Figure 4—figure supplement 1
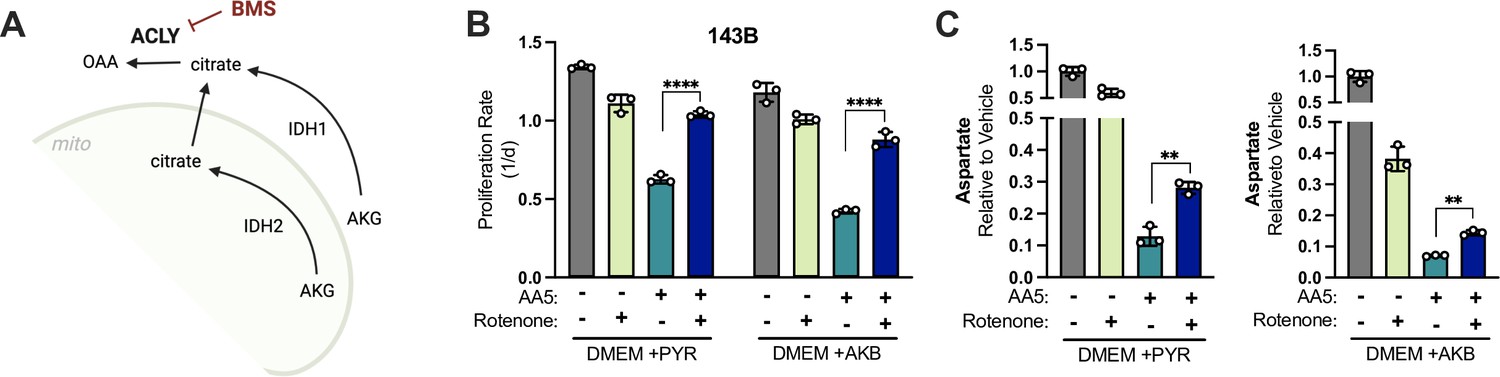
Effects of pyruvate versus AKB in SDH and CI impaired cells.
(A) Schematic showing how the ACLY inhibitor BMS-303141 blocks a convergent step necessary for glutamine-derived aspartate synthesis by either cytosolic or mitochondrial reductive carboxylation of glutamine derived AKG. IDH1; Isocitrate dehydrogenase 1, IDH2; Isocitrate dehydrogenase 2, ACLY; ATP-Citrate Lyase, OAA; oxaloacetate. (B) Proliferation rates of WT 143B cells treated with vehicle (DMSO), 50 nM rotenone, 5 µM AA5 or 5 µM AA5 and 50 nM rotenone in either DMEM with 1 mM pyruvate or pyruvate-free DMEM with 1 mM AKB (n=3). (C) Relative aspartate levels measured by LCMS metabolomics of WT 143B cells treated with vehicle (DMSO), 50 nM rotenone, 5 µM AA5 or 5 µM AA5 and 50 nM rotenone in either DMEM with 1 mM pyruvate or pyruvate-free DMEM with 1 mM AKB for 6 hours (n=3). Data are plotted as means ± standard deviation (SD) and compared with an unpaired two-tailed student’s t-test. p<0.05*, p<0.01**, p<0.001***, p<0.0001****.
-
Figure 4—figure supplement 1—source data 1
Proliferation rates and relative metabolite levels by LCMS in Figure 4—figure supplement 1.
- https://cdn.elifesciences.org/articles/78654/elife-78654-fig4-figsupp1-data1-v3.zip
Figure 5 with 1 supplement

Mitochondrial pyruvate import supports alternative aspartate synthesis in SDH-impaired cells.
(A) Western blot for MPC1 and SDHB in WT 143B cells, two MPC1 KO 143B clones, and MPC1 KO 143B clone 1 with MPC1-V5 cDNA added back (AB). SDHB is used as a loading control. (B) Proliferation rates of MPC1 KO 143B cells (clone 1) compared to MPC1 AB 143B cells treated with vehicle (DMSO), 5 µM AA5, or 5 µM AA5 and 50 nM rotenone in DMEM with 1 mM PYR (n=3). (C) Relative aspartate levels measured by LCMS metabolomics of MPC1 KO 143B cells (clone 1) compared to MPC1 AB 143B cells treated with vehicle (DMSO), 5 µM AA5, or 5 µM AA5 and 50 nM rotenone in pyruvate free DMEM with 1 mM AKB for 6 hr (n=3). (D) Proliferation rates of MPC1 KO 143B cells (clone 2) treated with vehicle (DMSO), 5 µM AA5, 5 µM AA5 and 50 nM rotenone, with and without 20 mM aspartate in DMEM with 1 mM PYR (n=3). (E) Relative AKG levels measured by LCMS metabolomics of MPC1 KO 143B cells (clone 1) compared to MPC1 AB 143B cells treated with vehicle (DMSO), 5 µM AA5, or 5 µM AA5 and 50 nM rotenone in pyruvate free DMEM with 1 mM AKB for 6 hours (n=3). (F) Schematic depicting the metabolic fates of mitochondrial pyruvate in SDH/CI impaired cells: PC activity to synthesize oxaloacetate and GPT2 activity to generate AKG and alanine as a byproduct. Data are plotted as means ± standard deviation (SD) and compared with an unpaired two-tailed student’s t-test. p<0.05*, p<0.01**, p<0.001***, p<0.0001****.
-
Figure 5—source data 1
Proliferation rates and relative metabolite levels by LCMS in Figure 5.
- https://cdn.elifesciences.org/articles/78654/elife-78654-fig5-data1-v3.zip
-
Figure 5—source data 2
Uncropped western blot for Figure 5A.
- https://cdn.elifesciences.org/articles/78654/elife-78654-fig5-data2-v3.zip
Figure 5—figure supplement 1
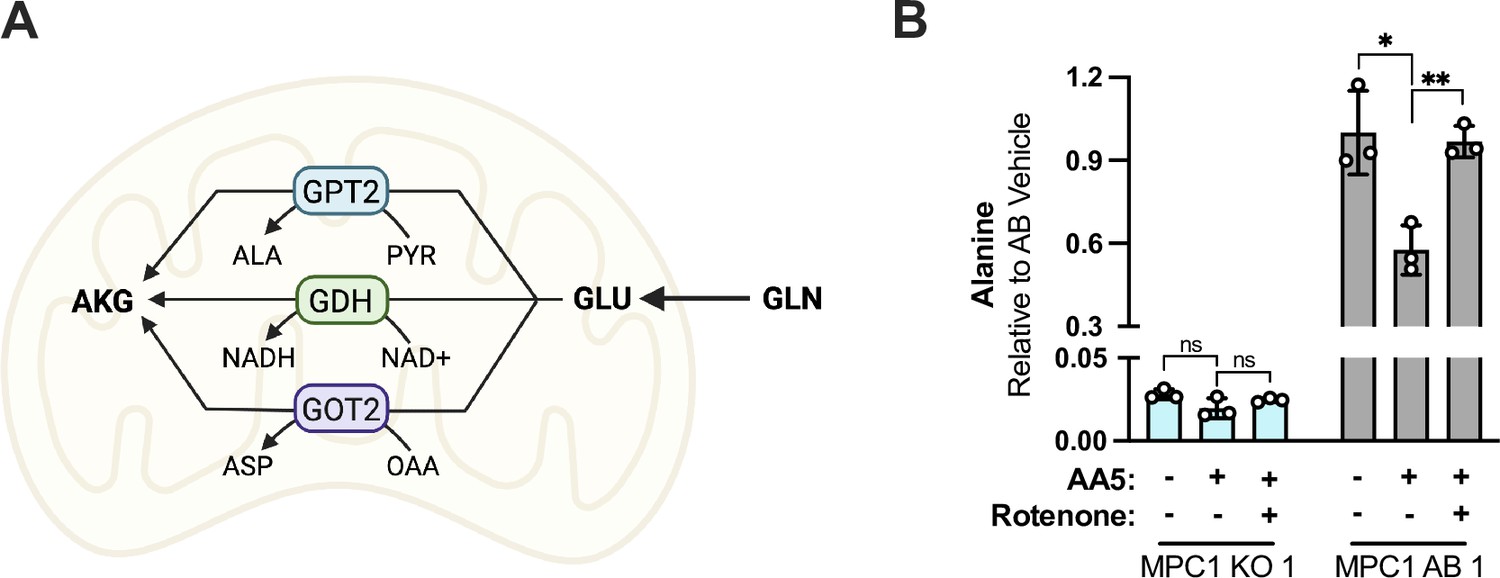
Mitochondrial AKG production is dependent on GPT2.
(A) Model depicting three enzymes capable of mitochondrial AKG production from glutamate (GLU) and necessary cofactors. GPT2; glutamic-pyruvic transaminase 2, GDH; glutamate dehydrogenase, GOT2; glutamic-oxaloacetic transaminase 2, ALA; alanine. (B) Relative alanine levels measured by LCMS metabolomics of MPC1 KO 143B cells (clone 1) compared to MPC1 AB 143B cells treated with vehicle (DMSO), 5 µM AA5, or 5 µM AA5 and 50 nM rotenone in pyruvate-free DMEM with 1 mM AKB for 6 hr (n=3). Data are plotted as means ± standard deviation (SD) and compared with an unpaired two-tailed student’s t-test. p<0.05*, p<0.01**, p<0.001***, P<0.0001****.
-
Figure 5—figure supplement 1—source data 1
Relative metabolite levels by LCMS in Figure 5—figure supplement 1.
- https://cdn.elifesciences.org/articles/78654/elife-78654-fig5-figsupp1-data1-v3.zip
Figure 6 with 1 supplement
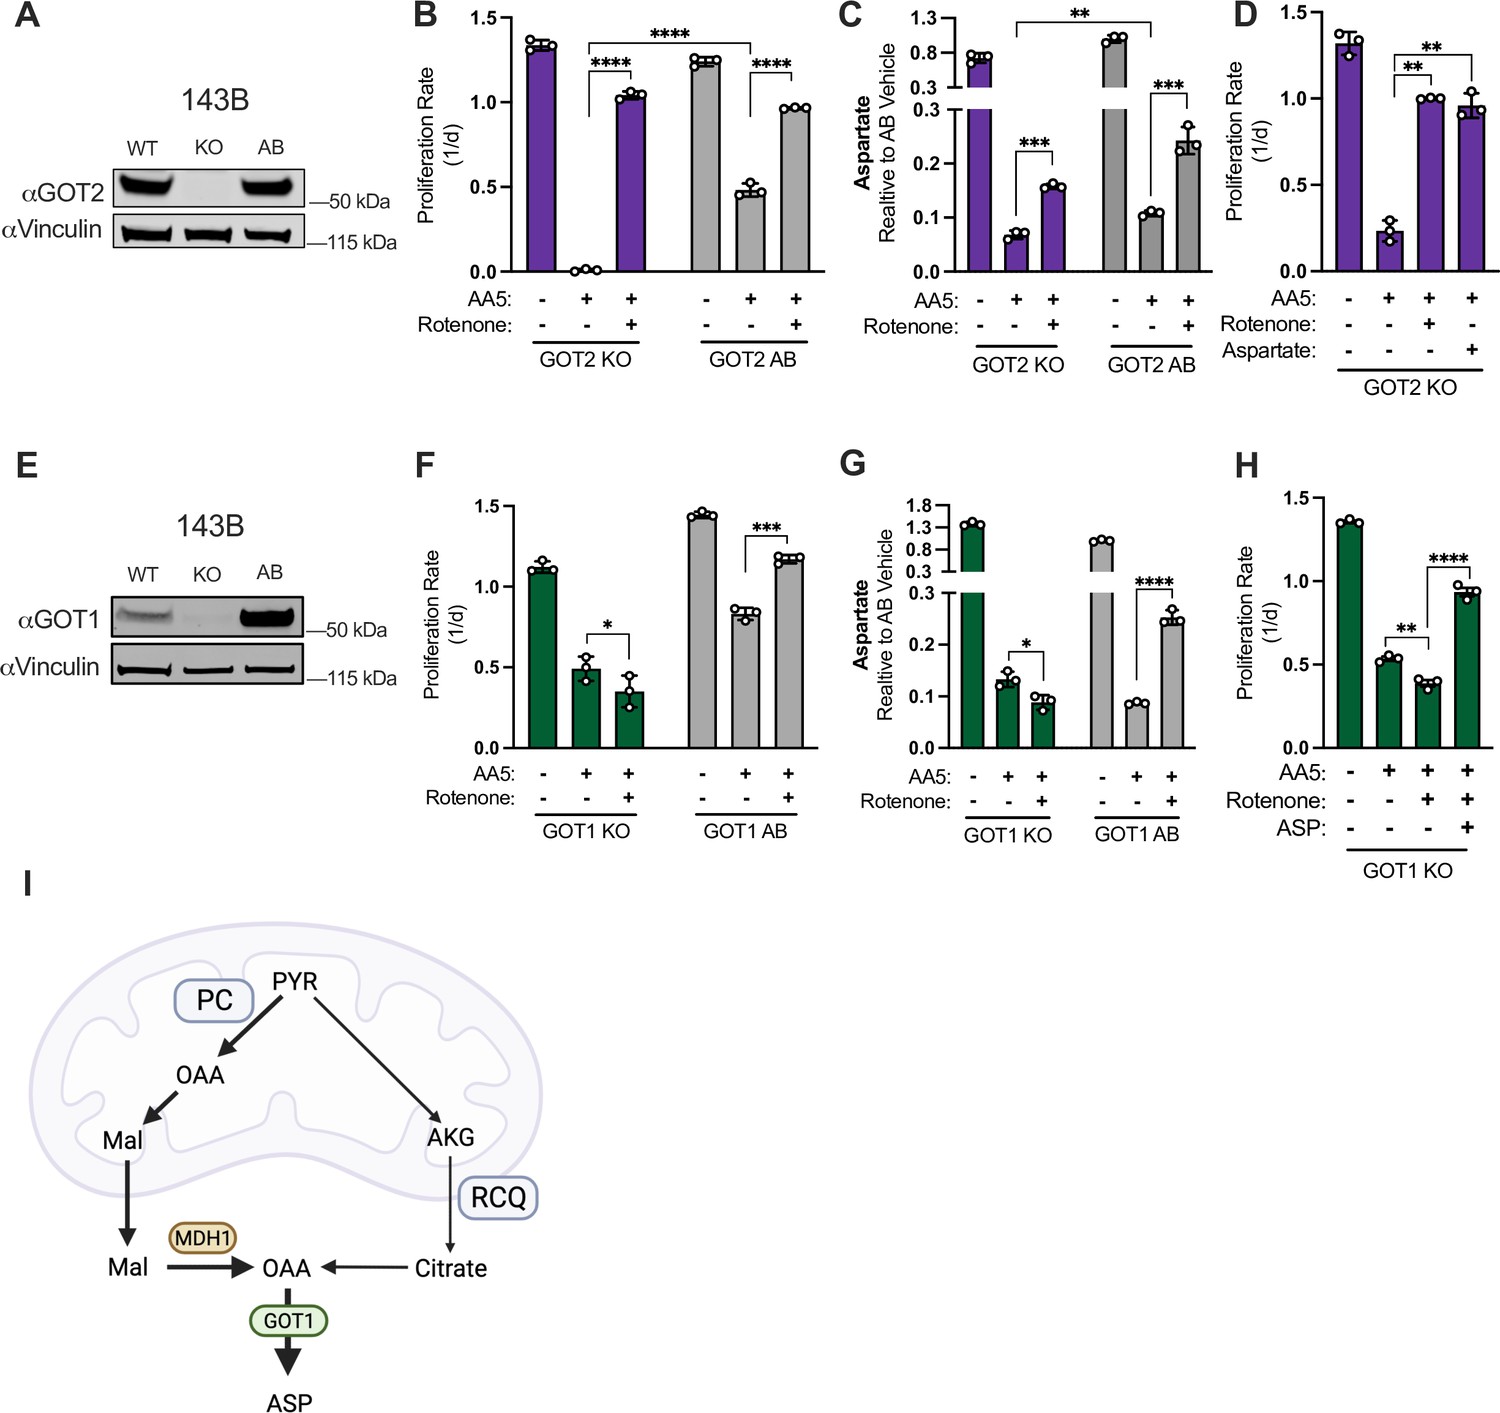
GOT1 is required for increased aspartate synthesis in SDH impaired cells upon complex I co-inhibition.
(A) Western blot for GOT2 and Vinculin from WT 143B cells, GOT2 KO 143B cells, and the same GOT2 KO clone expressing GOT2 cDNA (AB). Vinculin is the loading control. (B) Proliferation rates of GOT2 KO 143B cells compared to GOT2 AB 143B cells treated with vehicle (DMSO), 5 µM AA5, or 5 µM AA5 and 50 nM rotenone in DMEM with 1 mM PYR (n=3). (C) Relative aspartate levels measured by LCMS metabolomics of GOT2 KO 143B cells compared to GOT2 AB 143B cells treated with vehicle (DMSO), 5 µM AA5, or 5 µM AA5 and 50 nM rotenone in pyruvate-free DMEM with 1 mM AKB for 6 hours (n=3). (D) Proliferation rates of GOT2 KO 143B cells treated with vehicle (DMSO), 5 µM AA5, 5 µM AA5 and 50 nM rotenone, or 5 µM AA5 and 20 mM aspartate in DMEM with 1 mM PYR (n=3). (E) Western blot for GOT1 and Vinculin from WT 143B cells, GOT1 KO 143B cells, and the same GOT1 KO clone expressing GOT1 cDNA (AB). Vinculin is the loading control. (F) Proliferation rates of GOT1 KO 143B cells compared to GOT1 AB 143B cells treated with vehicle (DMSO), 5 µM AA5, or 5 µM AA5 and 50 nM rotenone in DMEM with 1 mM pyruvate (n=3). (G) Relative aspartate levels measured by LCMS metabolomics of GOT1 KO 143B cells compared to GOT1 AB 143B cells treated with vehicle (DMSO), 5 µM AA5, or 5 µM AA5 and 50 nM rotenone in pyruvate-free DMEM with 1 mM AKB for 6 hr (n=3). (H) Proliferation rates of GOT1 KO 143B cells treated with vehicle (DMSO), 5 µM AA5, 5 µM AA5 and 50 nM rotenone, or 5 µM AA5, 50 nM rotenone and 20 mM aspartate in DMEM with 1 mM PYR (n=3). (I) Schematic showing how aspartate is synthesized via GOT1 from RCQ and PC in SDH-deficient cells when complex I is also impaired. Data are plotted as means ± standard deviation (SD) and compared with an unpaired two-tailed student’s t-test. p<0.05*, p<0.01**, p<0.001***, p<0.0001****.
-
Figure 6—source data 1
Proliferation rates and relative metabolite levels by LCMS in Figure 6.
- https://cdn.elifesciences.org/articles/78654/elife-78654-fig6-data1-v3.zip
-
Figure 6—source data 2
Uncropped western blots for Figure 6A and E.
- https://cdn.elifesciences.org/articles/78654/elife-78654-fig6-data2-v3.zip
Figure 6—figure supplement 1
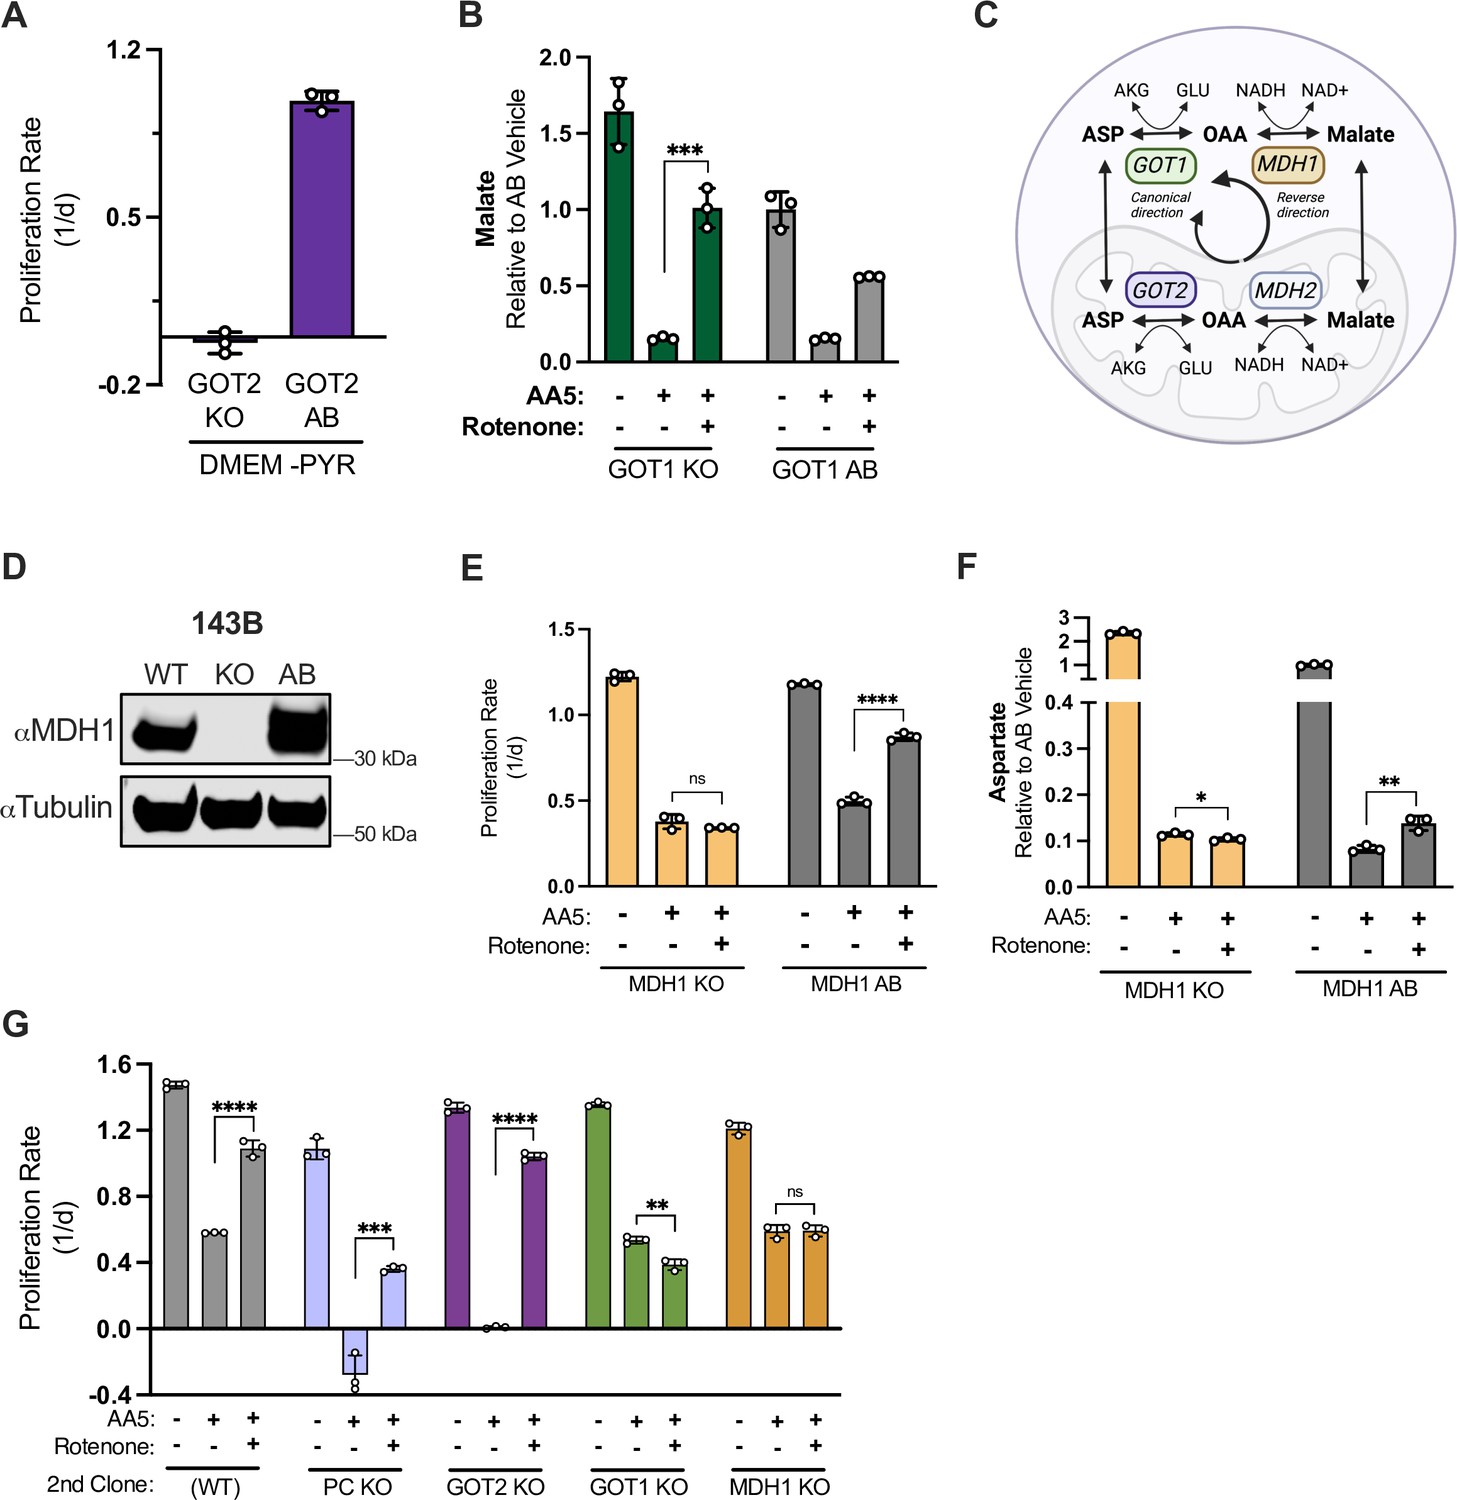
Contributions of components of the malate-aspartate shuttle to alternative aspartate synthesis in SDH-deficient cells.
(A) Proliferation rates of GOT2 KO and GOT2 AB 143B cells in pyruvate-free DMEM (n=3). (B) Relative malate levels by LCMS metabolomics of GOT1 KO 143B cells compared to GOT1 AB 143B cells, treated with vehicle (DMSO), 5 µM AA5, or 5 µM AA5 and 50 nM rotenone in pyruvate-free DMEM with 1 mM AKB for 6 hr (n=3). Malate levels are relative to the GOT1 AB vehicle condition. (C) Model depicting the malate-aspartate shuttle in its canonical and reverse directions. (D) Western blot of MDH1 and tubulin in WT 143B cells, MDH1 KO 143B cells, and the same MDH1 KO clone with MDH1 cDNA added back (AB). Tubulin is the loading control. (E) Proliferation rates of MDH1 KO 143B cells compared to MDH1 AB 143B cells treated with vehicle (DMSO), 5 µM AA5, or 5 µM AA5 and 50 nM rotenone in DMEM with 1 mM pyruvate (n=3). (F) Relative aspartate levels measured by LCMS metabolomics of MDH1 KO 143B cells compared to MDH1 AB 143B cells treated with vehicle (DMSO), 5 µM AA5, or 5 µM AA5 and 50 nM rotenone in pyruvate-free DMEM with 1 mM AKB for 6 hr (n=3). (G) Proliferation rates of WT 143B cells and second single cell clones for PC, GOT2, GOT1, and MDH1 KO 143B cells in DMEM with 1 mM pyruvate and treated with vehicle (DMSO), 5 µM AA5, or 5 µM AA5 and 50 nM rotenone. Data are plotted as means ± standard deviation (SD) and compared with an unpaired two-tailed student’s t-test. p<0.05*, p<0.01**, p<0.001***, p<0.0001****.
-
Figure 6—figure supplement 1—source data 1
Proliferation rates and relative metabolite levels by LCMS in Figure 6—figure supplement 1.
- https://cdn.elifesciences.org/articles/78654/elife-78654-fig6-figsupp1-data1-v3.zip
-
Figure 6—figure supplement 1—source data 2
Uncropped western blot for Figure 6—figure supplement 1D.
- https://cdn.elifesciences.org/articles/78654/elife-78654-fig6-figsupp1-data2-v3.zip
Figure 7 with 1 supplement
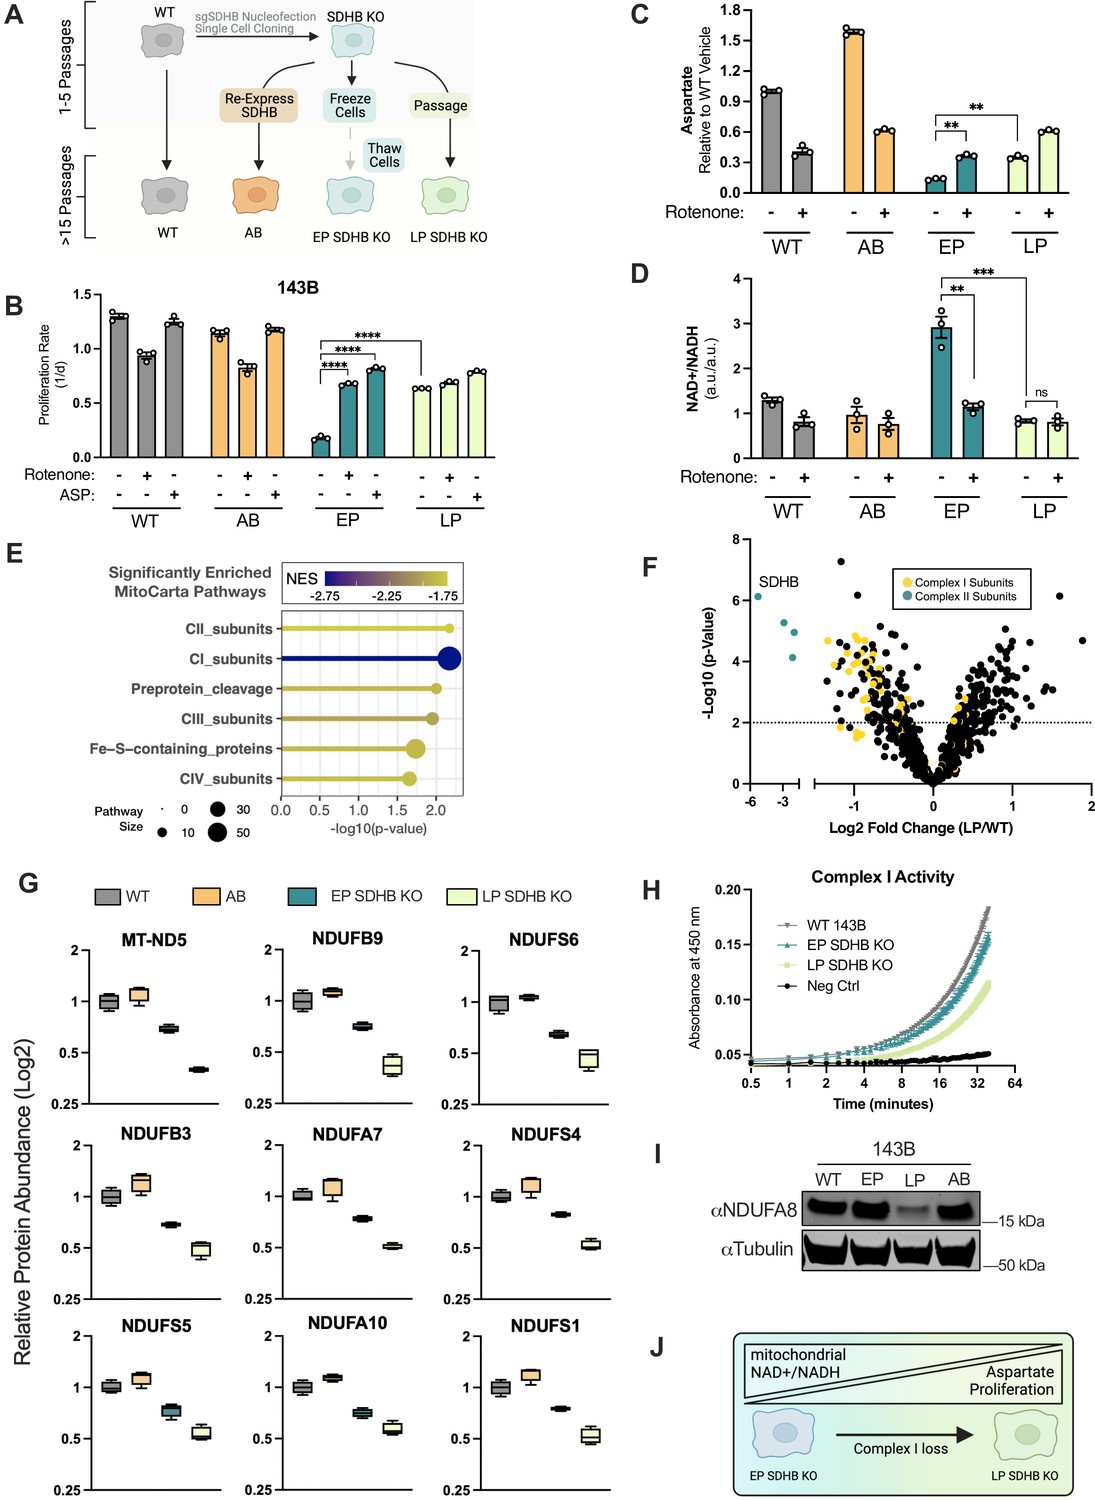
Adaptive CI activity loss supports proliferation in SDHB-null cells.
(A) Schematic showing how SDHB KO 143B clones were used to generate SDHB addback cells (AB), early passage SDHB KO cells (EP), or late passage (LP) SDHB KO cells. (B) Proliferation rates of wild-type (WT), SDHB addback (AB), early passage (EP) and late passage (LP) SDHB KO 143B cells cultured in DMEM with 1 mM PYR, treated with vehicle (DMSO), 50 nM rotenone, or 20 mM ASP (n=3). (C) Relative aspartate levels measured by LCMS metabolomics of wild-type (WT), SDHB addback (AB), early passage (EP) and late passage (LP) SDHB KO 143B cells cultured in DMEM with 1 mM PYR and treated with vehicle (DMSO) or 50 nM rotenone for six hours (n=3). (D) Whole cell NAD+/NADH measured by LCMS metabolomics of wild-type (WT), SDHB addback (AB), early passage (EP) and late passage (LP) SDHB KO 143B cells cultured in DMEM with 1 mM PYR and treated with vehicle (DMSO) or 50 nM rotenone for 6 hr (n=3). (E) Gene set enrichment analysis (GSEA) of mitochondrial protein expression in LP SDHB KO 143B cells compared to WT 143B cells using MitoCarta 3.0 pathways. (F) Volcano plot of compiled LP SDHB KO 143B cells compared to WT 143B cells showing all mitochondrial proteins (black), complex II subunits (blue), and complex I subunits (yellow) (n=4). (G) Box plots of a subset of CI subunits showing relative expression in WT 143B, SDHB AB 143B, EP SDHB KO 143B, and LP SDHB KO 143B cells (n=4). (H) Complex I activity assay of WT 143B, EP SDHB KO, and LP SDHB KO cells (n=2). (I) Western blot for NDUFA8 and tubulin from WT 143B, EP SDHB KO, LP SDHB KO, and SDHB AB cells. Tubulin is used as a loading control. (J) Schematic detailing how CI activity is suppressed to generate an ideal mitochondrial redox state in SDH-deficient cells to enable aspartate synthesis. Data are plotted as means ± standard deviation (SD) and compared with an unpaired two-tailed student’s t-test. p<0.05*, p<0.01**, p<0.001***, p<0.0001****.
-
Figure 7—source data 1
Proliferation rates, relative metabolite levels by LCMS, volcano plot data, and complex I activity values in Figure 7.
- https://cdn.elifesciences.org/articles/78654/elife-78654-fig7-data1-v3.zip
-
Figure 7—source data 2
Uncropped western blot for Figure 7I.
- https://cdn.elifesciences.org/articles/78654/elife-78654-fig7-data2-v3.zip
Figure 7—figure supplement 1
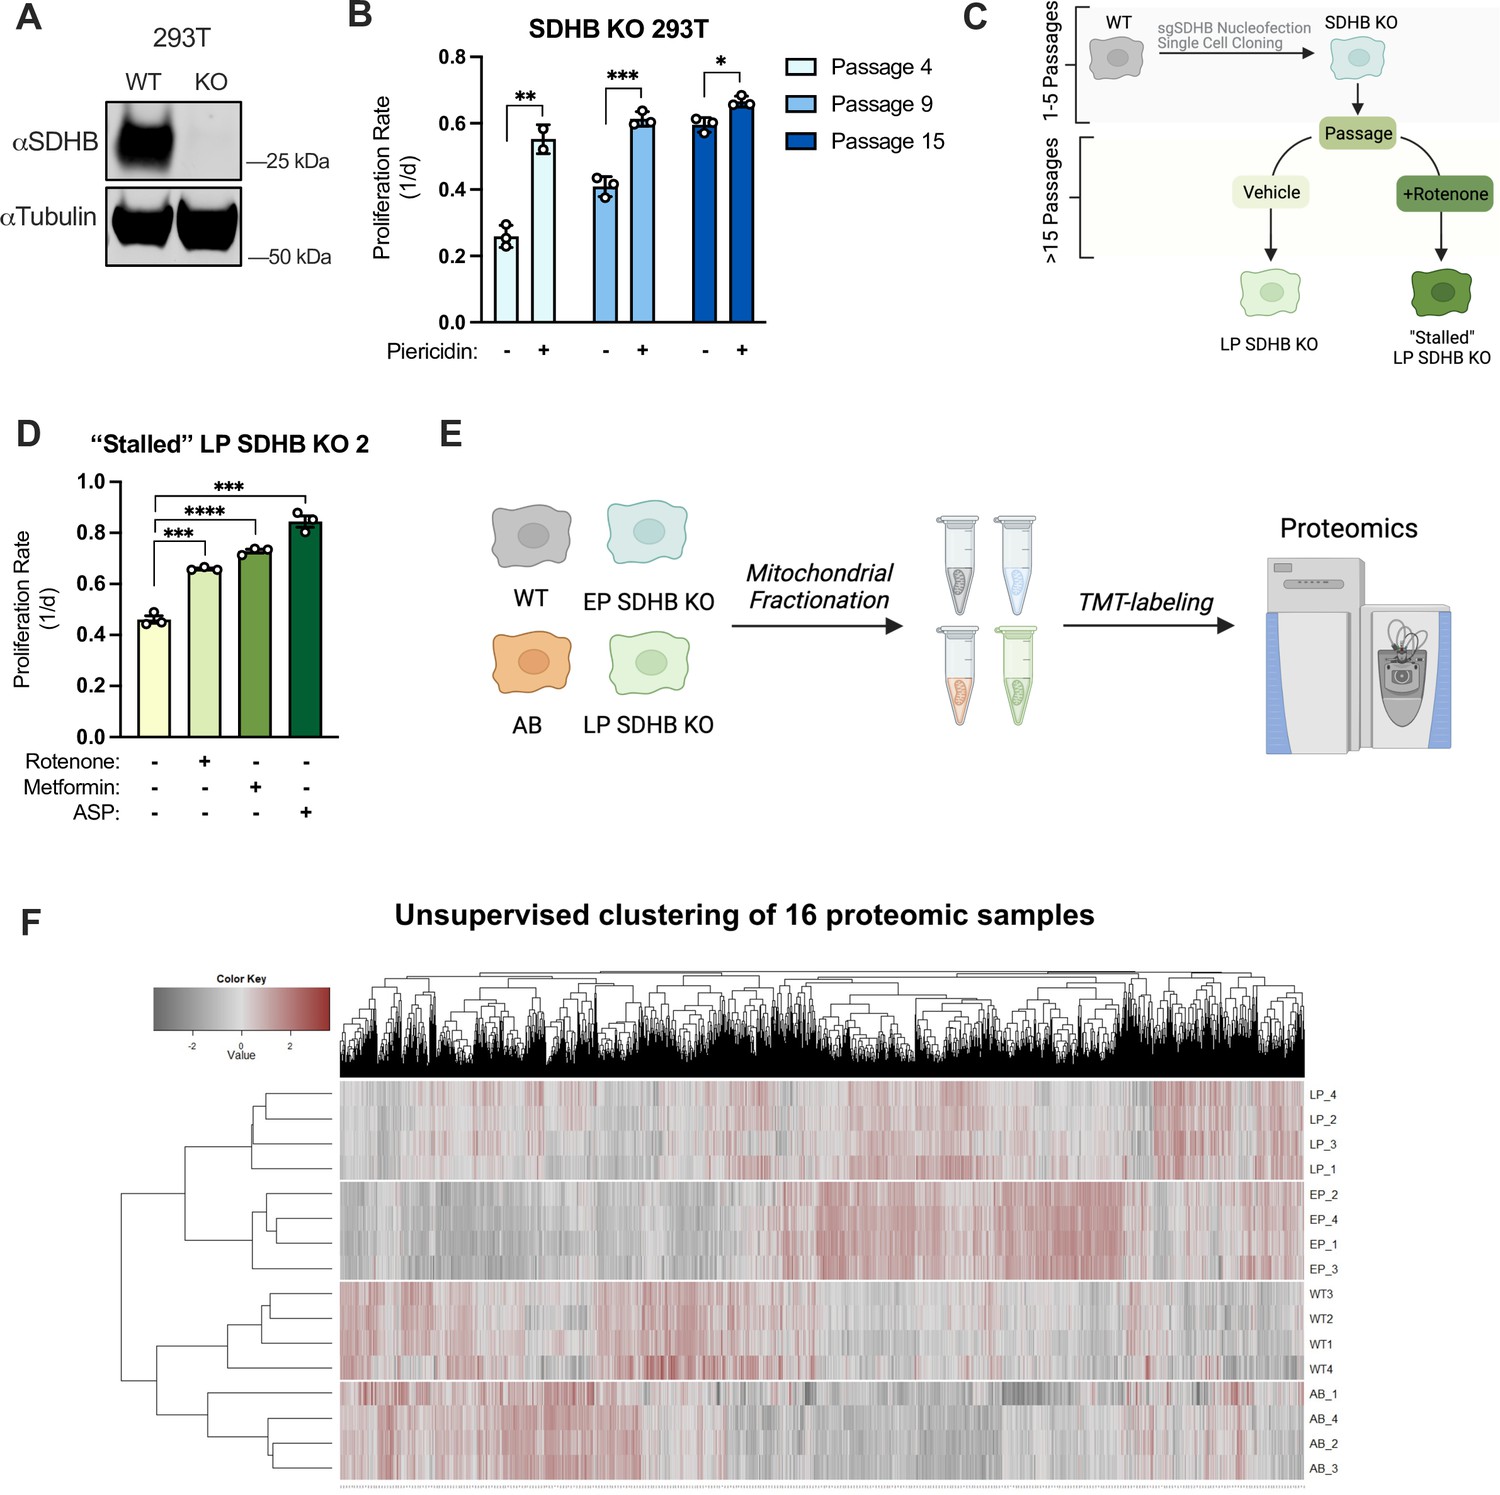
Characterization of adaptations in SDHB KO cells.
(A) Western blot for SDHB and tubulin from WT and SDHB KO HEK293T cells. Tubulin is used as a loading control. (B) Proliferation rates of SDHB KO HEK293T cells cultured in DMEM with 1 mM pyruvate from the indicated passage number after derivation of KO clone. For each passage, cells were treated vehicle (DMSO) or 1 µM of the CI inhibitor piericidin A. (C) Schematic illustrating how SDHB KO 143B cells were maintained in culture with or without continuous rotenone to achieve late passage (LP) status or ‘Stalled’ LP status. (D) Proliferation rates of ‘Stalled’ LP SDHB KO 143B cells treated with vehicle (DMSO), 50 nM rotenone, 1 mM metformin, or 20 mM ASP in DMEM with 1 mM pyruvate. (E) Schematic depicting how samples from WT 143B, SDHB addback cells (AB), early passage SDHB KO cells (EP), and late passage (LP) SDHB KO cells were acquired for mitochondrial proteomics and other experiments. (F) Unsupervised clustering from mitochondrial proteomics data of the four cell lines listed in C (n=4). Data are plotted as means ± standard deviation (SD) and compared with an unpaired two-tailed student’s t-test. p<0.05*, p<0.01**, p<0.001***, p<0.0001****.
-
Figure 7—figure supplement 1—source data 1
Proliferation rates in Figure 7—figure supplement 1.
- https://cdn.elifesciences.org/articles/78654/elife-78654-fig7-figsupp1-data1-v3.zip
-
Figure 7—figure supplement 1—source data 2
Uncropped western blot for Figure 7—figure supplement 1A.
- https://cdn.elifesciences.org/articles/78654/elife-78654-fig7-figsupp1-data2-v3.zip
Figure 8 with 1 supplement
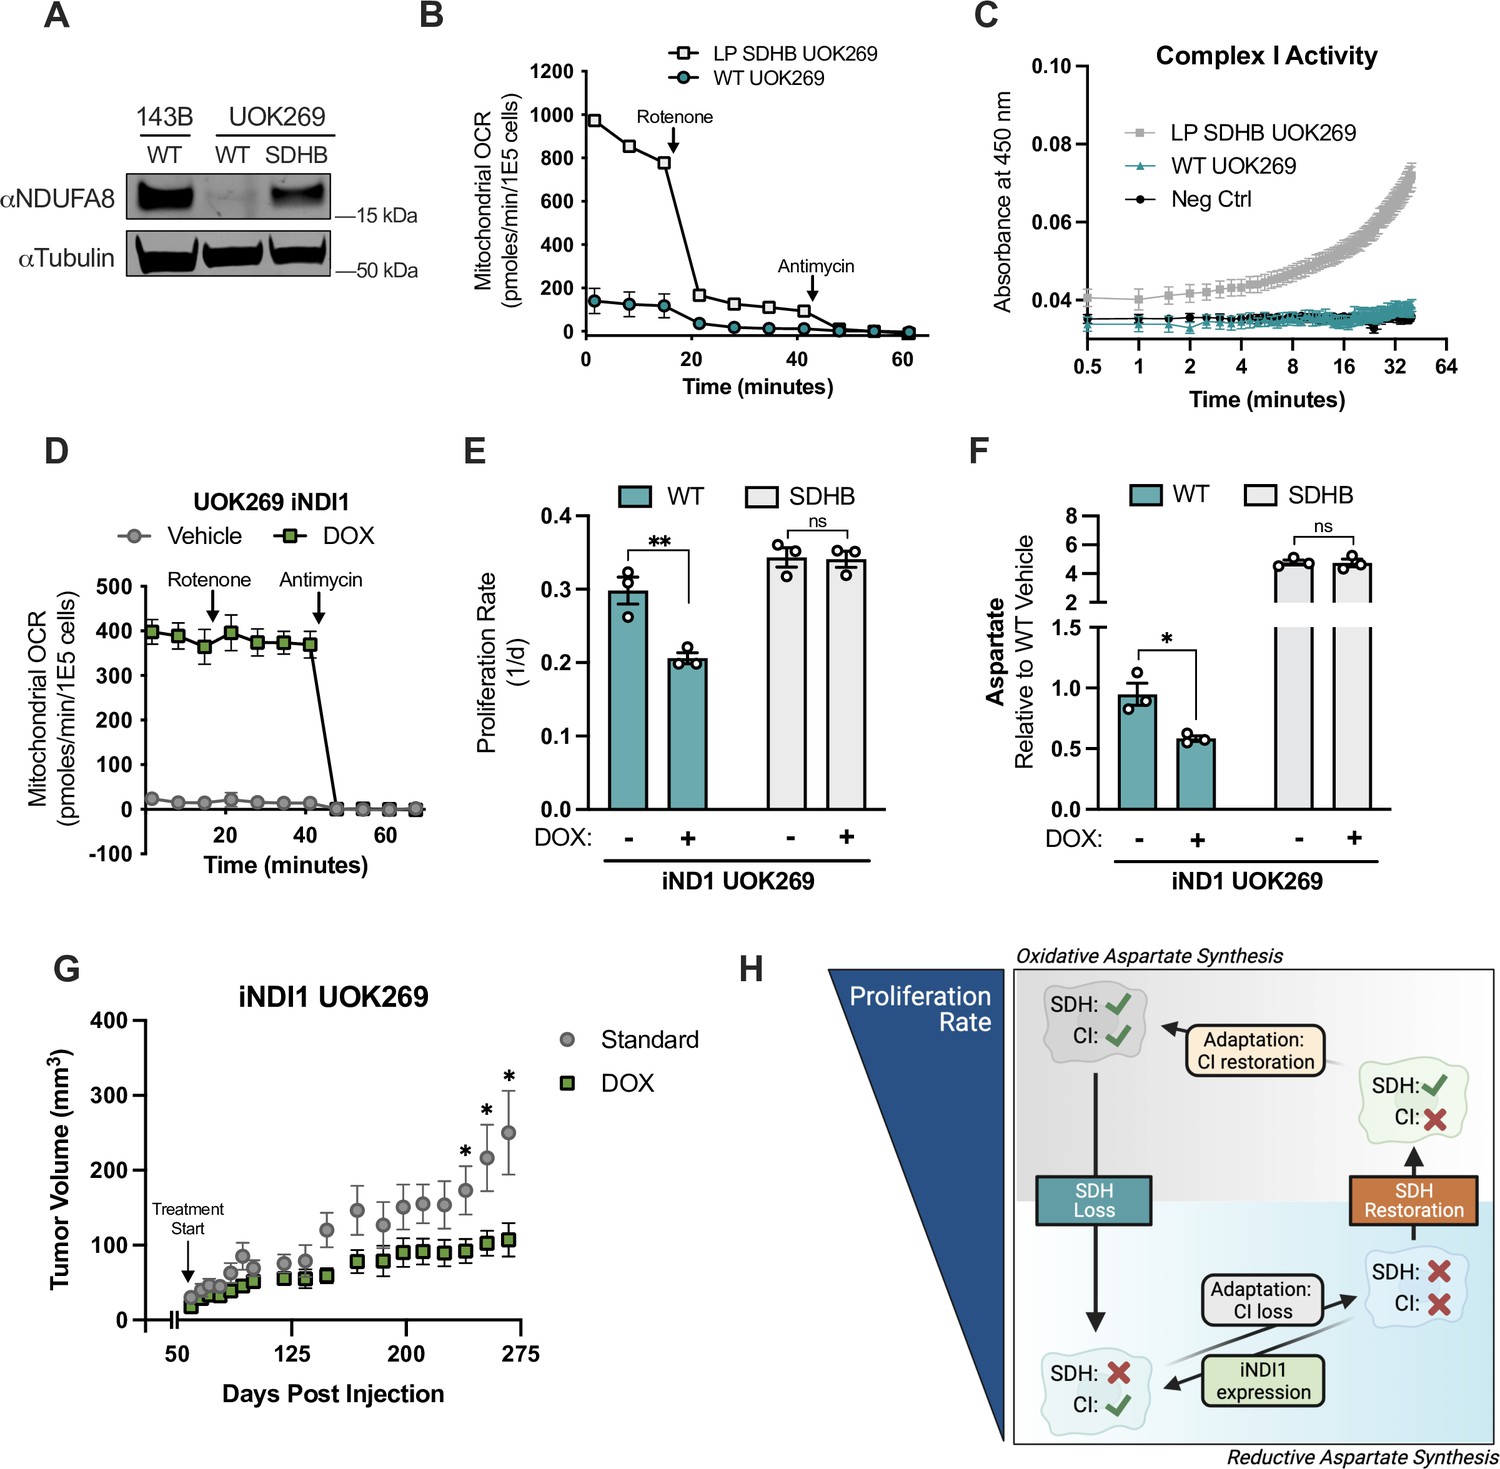
Complex I activity is deleterious in SDHB-mutant renal cell carcinoma cells.
(A) Western blot for NDUFA8 and tubulin from WT 143B, WT UOK269, and late-passage (LP) SDHB UOK269 cells. Tubulin is used as a loading control. (B) Mitochondrial oxygen consumption rate of WT UOK269 cells compared to LP SDHB UOK269 cells with indicated injections of 100 nM rotenone and 10 µM antimycin (n=3). (C) Complex I activity assay of WT UOK269 and LP SDHB UOK269 cells (n=3). (D) Mitochondrial oxygen consumption rates of pInducer20-NDI1 expressing UOK269 cells (UOK269 iNDI1) that were pretreated with vehicle (H2O) or 1 µg/mL doxycycline for 40 hr as indicated, followed by injections of 100 nM rotenone and 10 µM antimycin (n=3). (E) Proliferation rates of WT and SDHB UOK269 cells with expression of pInducer20-NDI1 (iNDI1) cultured in DMEM with 1 mM PYR and treated with vehicle (H2O) or 1 µg/mL doxycycline (n=3). (F) Aspartate levels measured by LCMS metabolomics of WT and SDHB UOK269 cells with expression of pInducer20-NDI1 (iNDI1) cultured in DMEM with 1 mM PYR and treated with vehicle (H2O) or 1 µg/mL doxycycline for 24 hr (n=3). (G) Tumor volumes of iNDI1 UOK269 cells implanted into the flanks of immunocompromised SCID mice. After tumors became palpable, mice were fed either standard or doxycycline-containing chow (n=10 tumors per condition). (H) Model demonstrating adaptations to SDH loss and SDH restoration, correlating to aspartate levels and proliferation rate. Data are plotted as means ± standard deviation (SD) except in B and D which are means ± standard error of the mean (SEM) and compared with an unpaired two-tailed student’s t-test. p<0.05*, p<0.01**, p<0.001***, p<0.0001****.
-
Figure 8—source data 1
Proliferation rates, mitochondrial oxygen consumption values, complex I activity values, relative metabolite levels by LCMS, and tumor volumes in Figure 8.
- https://cdn.elifesciences.org/articles/78654/elife-78654-fig8-data1-v3.zip
-
Figure 8—source data 2
Uncropped western blot for Figure 8A.
- https://cdn.elifesciences.org/articles/78654/elife-78654-fig8-data2-v3.zip
Figure 8—figure supplement 1
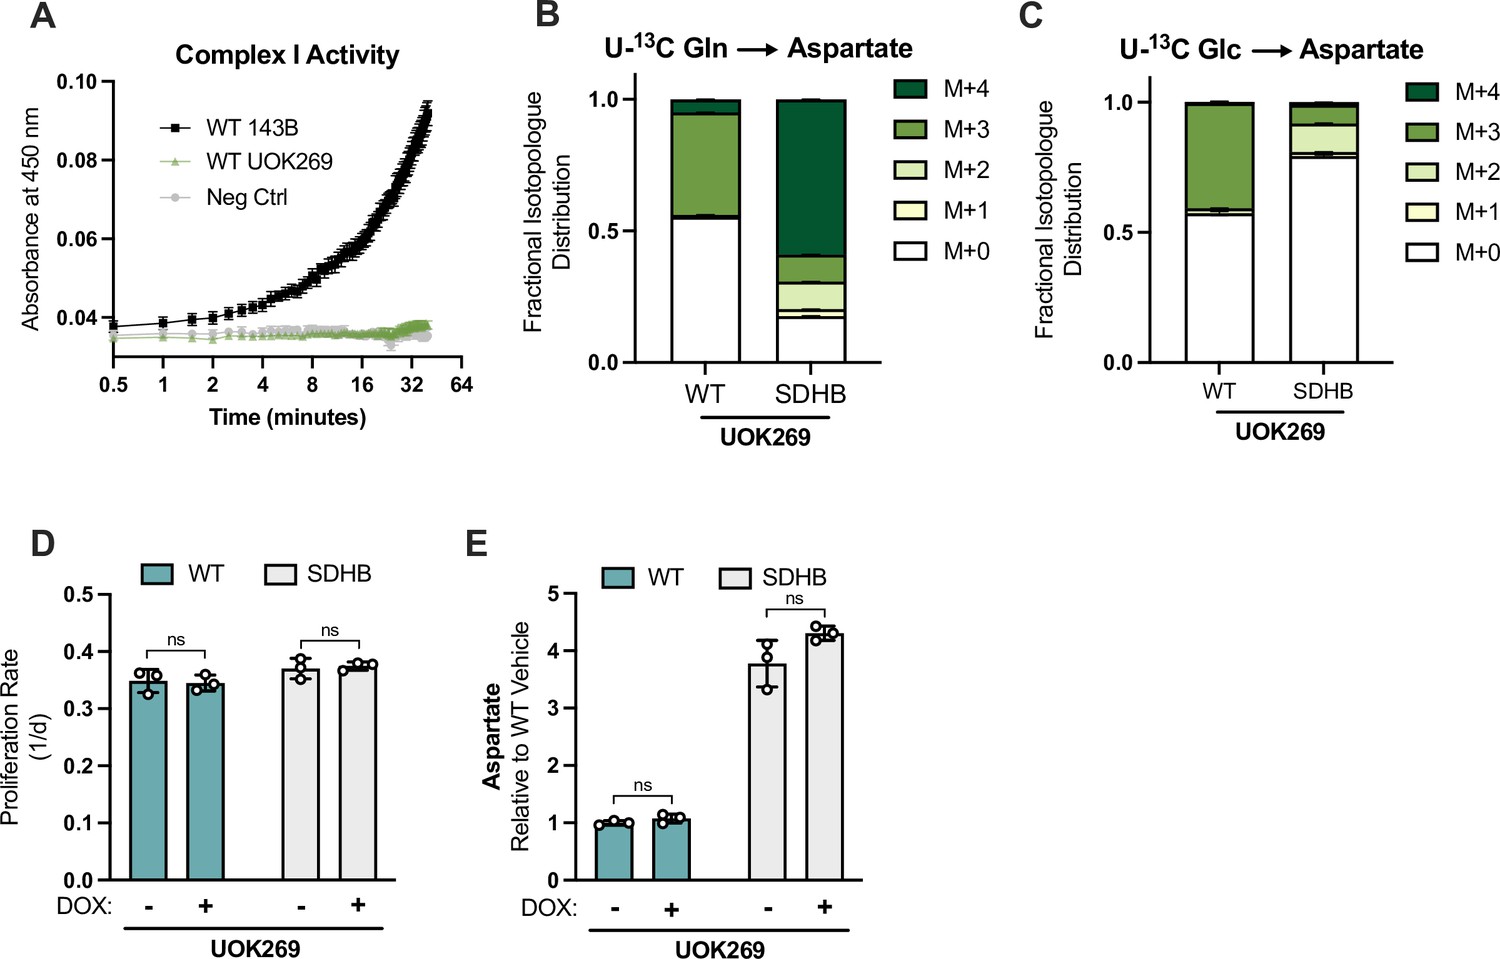
Characterization of WT and SDHB UOK269 cells.
(A) Complex I activity assay of extracts from WT 143Bs and WT UOK269 cells (n=3). (B) Fractional isotopologue distribution of aspartate measured by LCMS metabolomics of WT or SDHB UOK269 cells cultured in glutamine free DMEM with 1 mM pyruvate supplemented with 4 mM U-13C glutamine (Gln) for 6 hr (n=3). (C) Fractional isotopologue distribution of aspartate measured by LCMS metabolomics of WT or SDHB UOK269 cells cultured in glucose/pyruvate-free DMEM with 25 mM U-13C glucose (Glc) and 1 mM AKB for 6 hr (n=3). (D) Proliferation rate of WT UOK269 cells and SDHB AB UOK269 cells treated with vehicle (H2O) or 1 µg/µL doxycycline in DMEM with 1 mM pyruvate (n=3). (E) Relative aspartate levels measured by LCMS metabolomics of WT UOK269 cells and SDHB AB UOK269 cells treated with vehicle (H2O) or 1 µg/µL doxycycline in DMEM with 1 mM pyruvate (n=3). Data are plotted as means ± standard deviation (SD) and compared with an unpaired two-tailed student’s t-test. p<0.05*, p<0.01**, p<0.001***, p<0.0001****.
-
Figure 8—figure supplement 1—source data 1
Proliferation rates, relative metabolite levels by LCMS, fractional isotopologue distribution values, and mitochondrial oxygen consumption values in Figure 8—figure supplement 1.
- https://cdn.elifesciences.org/articles/78654/elife-78654-fig8-figsupp1-data1-v3.zip
Author response image 1
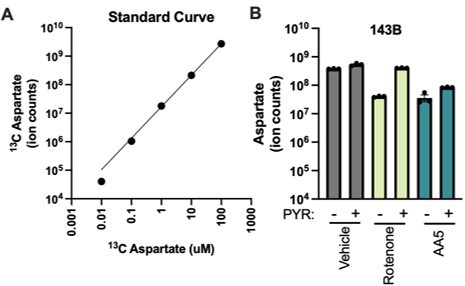
Quantitative analysis of aspartate detection by LCMS.
(A) Detection of isotopically labeled aspartate by LCMS across a standard curve of aspartate levels. (B) Measurement of aspartate from 143B cells treated with vehicle, 50 nM rotenone, or 5 µM AA5, with or without 1 mM pyruvate in DMEM for 6 hours. Aspartate ion counts are within the linear range for aspartate detection.
Author response image 2
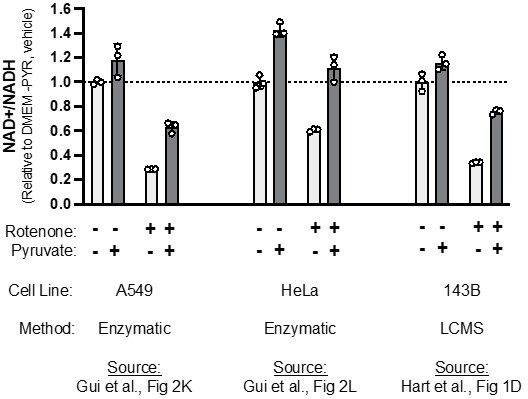
Comparing relative changes in NAD+/NADH when adding pyruvate and/or rotenone, across studies.
NAD+/NADH measurements from the indicated figure panels in Gui et al. 2016 or this revised manuscript, with each made relative to vehicle treated cells cultured in pyruvate-free DMEM.
Additional files
-
MDAR checklist
- https://cdn.elifesciences.org/articles/78654/elife-78654-mdarchecklist1-v3.pdf
-
Supplementary file 1
Ion counts from each metabolomics experiment conducted in this study.
Organized by tab for each figure; tables include cell line, treatment, and metabolite measured.
- https://cdn.elifesciences.org/articles/78654/elife-78654-supp1-v3.xlsx
-
Supplementary file 2
Mitochondrial proteomics dataset used to generate Figure 7E-G, Figure 7—figure supplement 1F.
- https://cdn.elifesciences.org/articles/78654/elife-78654-supp2-v3.xlsx
Download links
A two-part list of links to download the article, or parts of the article, in various formats.
Downloads (link to download the article as PDF)
Open citations (links to open the citations from this article in various online reference manager services)
Cite this article (links to download the citations from this article in formats compatible with various reference manager tools)
Mitochondrial redox adaptations enable alternative aspartate synthesis in SDH-deficient cells
eLife 12:e78654.
https://doi.org/10.7554/eLife.78654


