Obligate sexual reproduction of a homothallic fungus closely related to the Cryptococcus pathogenic species complex
- Department of Molecular Genetics and Microbiology, Duke University Medical Center, United States
- Broad Institute of MIT and Harvard, United States
- Westerdijk Fungal Biodiversity Institute, Netherlands
- Institute of Biodiversity and Ecosystem Dynamics (IBED), University of Amsterdam, Netherlands
- Génomique Métabolique, CNRS, University Evry, Université Paris-Saclay, France
- Lehrstuhl für Molekulare und Zelluläre Botanik, Ruhr-Universität Bochum, Germany
Figures
Figure 1 with 5 supplements

Genome-wide comparison between the two C. depauperatus strains and phylogenetic placement of C. depauperatus.
(A) Circos plot comparing the genome assemblies of C. depauperatus CBS7841 and CBS7855. The two assemblies are overall syntenic, except for five inversions (labelled ‘a’ to ‘e’; see Figure 1—figure supplement 2 for details). Other genomic features are depicted in different tracks for each chromosome, as shown in the key. (B) Genome-based phylogeny recovers C. depauperatus as a sister species to the human pathogenic Cryptococcus clade. The tree was inferred by maximum likelihood using a concatenation-based approach on a data matrix composed of protein alignments of 4074 single-copy genes shared across selected strains of seven Cryptococcus species and an outgroup (Kwoniella mangrovensis). Log-likelihood of the tree: lnL = –16948764.2158. A coalescence-based tree topology inference obtained by ASTRAL was completely congruent with the concatenation-based phylogeny (see Figure 1—figure supplement 5). The reliability of each internal branch was evaluated by 1000 replicates of the Shimodaira–Hasegawa approximate likelihood ratio test (SH-aLRT) and ultrafast bootstrap (UFboot) in the concatenation-based tree, and local posterior probability (LPP) in the coalescence-based tree. Branch lengths are given in number of substitutions per site (scale bar). For each branch of the tree, three additional measures of genealogical concordance are shown: the gene concordance factor (gCF), the site concordance factor (sCF), and quartet support for the main topology (q1)(see ‘Materials and methods’ for details). Scanning electron microscopy images illustrating sexual reproductive structures (basidia with spore chains) of C. neoformans (H99 × KN99; top), C. depauperatus CBS7841 (middle) and C. amylolentus (CBS6039 × CBS6273; bottom). Scale bars = 5μm.
Figure 1—figure supplement 1
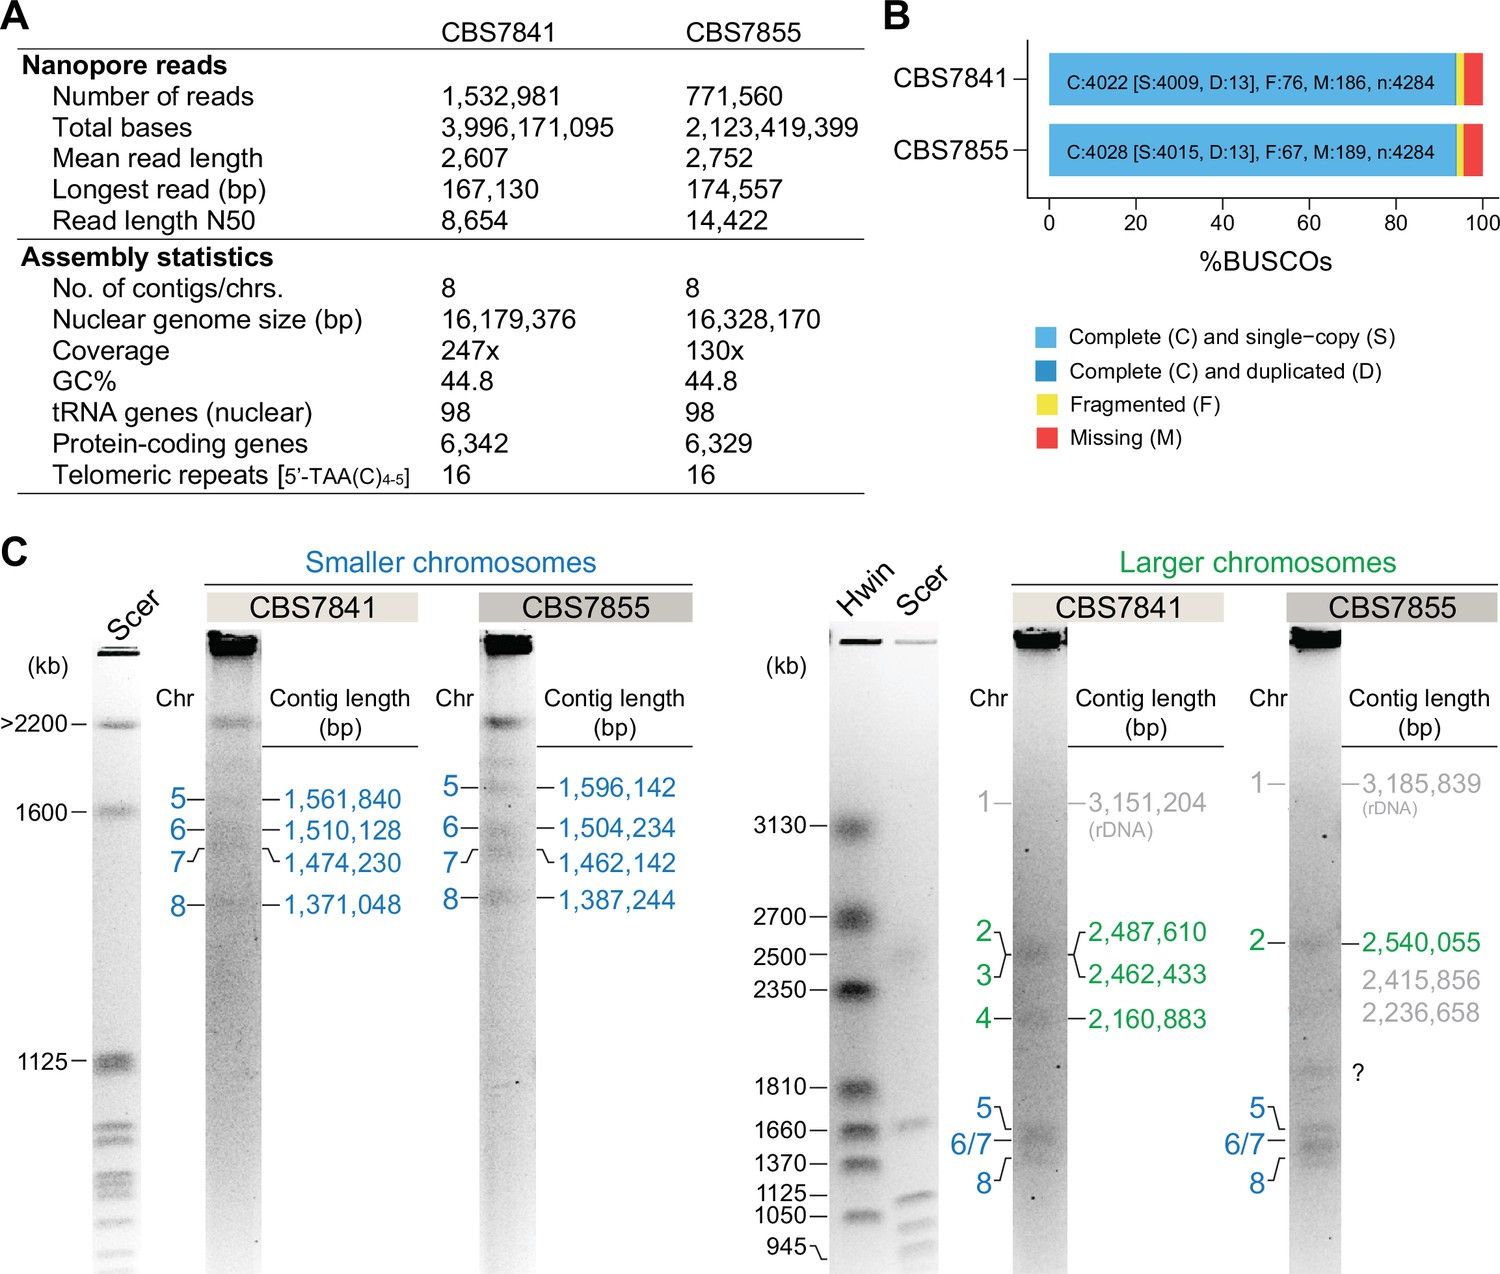
Statistics of the genome assemblies of CBS7841 and CBS7855 and electrophoretic karyotyping.
(A) Genome sequencing data generated, final genome assembly statistics, and (B) genome completeness assessment upon aligning C. depauperatus gene sets to 4284 Benchmarking Universal Single-Copy Orthologs (BUSCOs) included in the tremellomycetes_odb10 dataset. (C) Electrophoretic karyotypes (clamped homogeneous electrical field [CHEF]) of CBS7841 and CBS7855. Chromosomes of Saccharomyces cerevisiae (Scer) and Hansenula wingei (Hwin) served as size markers. For CBS7841, all contigs (except the largest one that includes the rDNA array, which runs at a higher size range) could be assigned to a band in the gel. For CBS7855, we found two discrepancies: (i)a band (marked with a question mark) that could not be assigned to any of the assembled contigs, and (ii) the fact that contigs 3 and 4 seem to be unaccounted for in the gel. This might suggest inherent chromosome instability in this strain (e.g., a subpopulation of cells undergoing chromosomal rearrangements/breaks/fusions), which will be the subject of future studies.
-
Figure 1—figure supplement 1—source data 1
Raw images of clamped homogeneous electrical field (CHEF) gels.
- https://cdn.elifesciences.org/articles/79114/elife-79114-fig1-figsupp1-data1-v2.zip
Figure 1—figure supplement 2

Inversions between the two C. depauperatus isolates.
(A) Synteny maps of C. depauperatus CBS7841 and CBS7855 highlighting two large and three small inversions detected between the two strains, with each inversion containing more than two genes (labeled ‘a’ to ‘e’ and denoted by a teal blue bar). (B) Except for inversion ‘a’, all the others (inversion ‘b’ is shown as an example) are associated with duplicated sequences at the borders (highlighted in yellow). Gray or pink bars/lines connect similar regions between the two strains (BLASTN hits>200bp) in the same or inverted orientation, respectively. An ‘r’ next to the chromosome number (e.g., Chr 6r in CBS7855) indicates that the orientation is reversed relative to the orientation in the assembly.
Figure 1—figure supplement 3
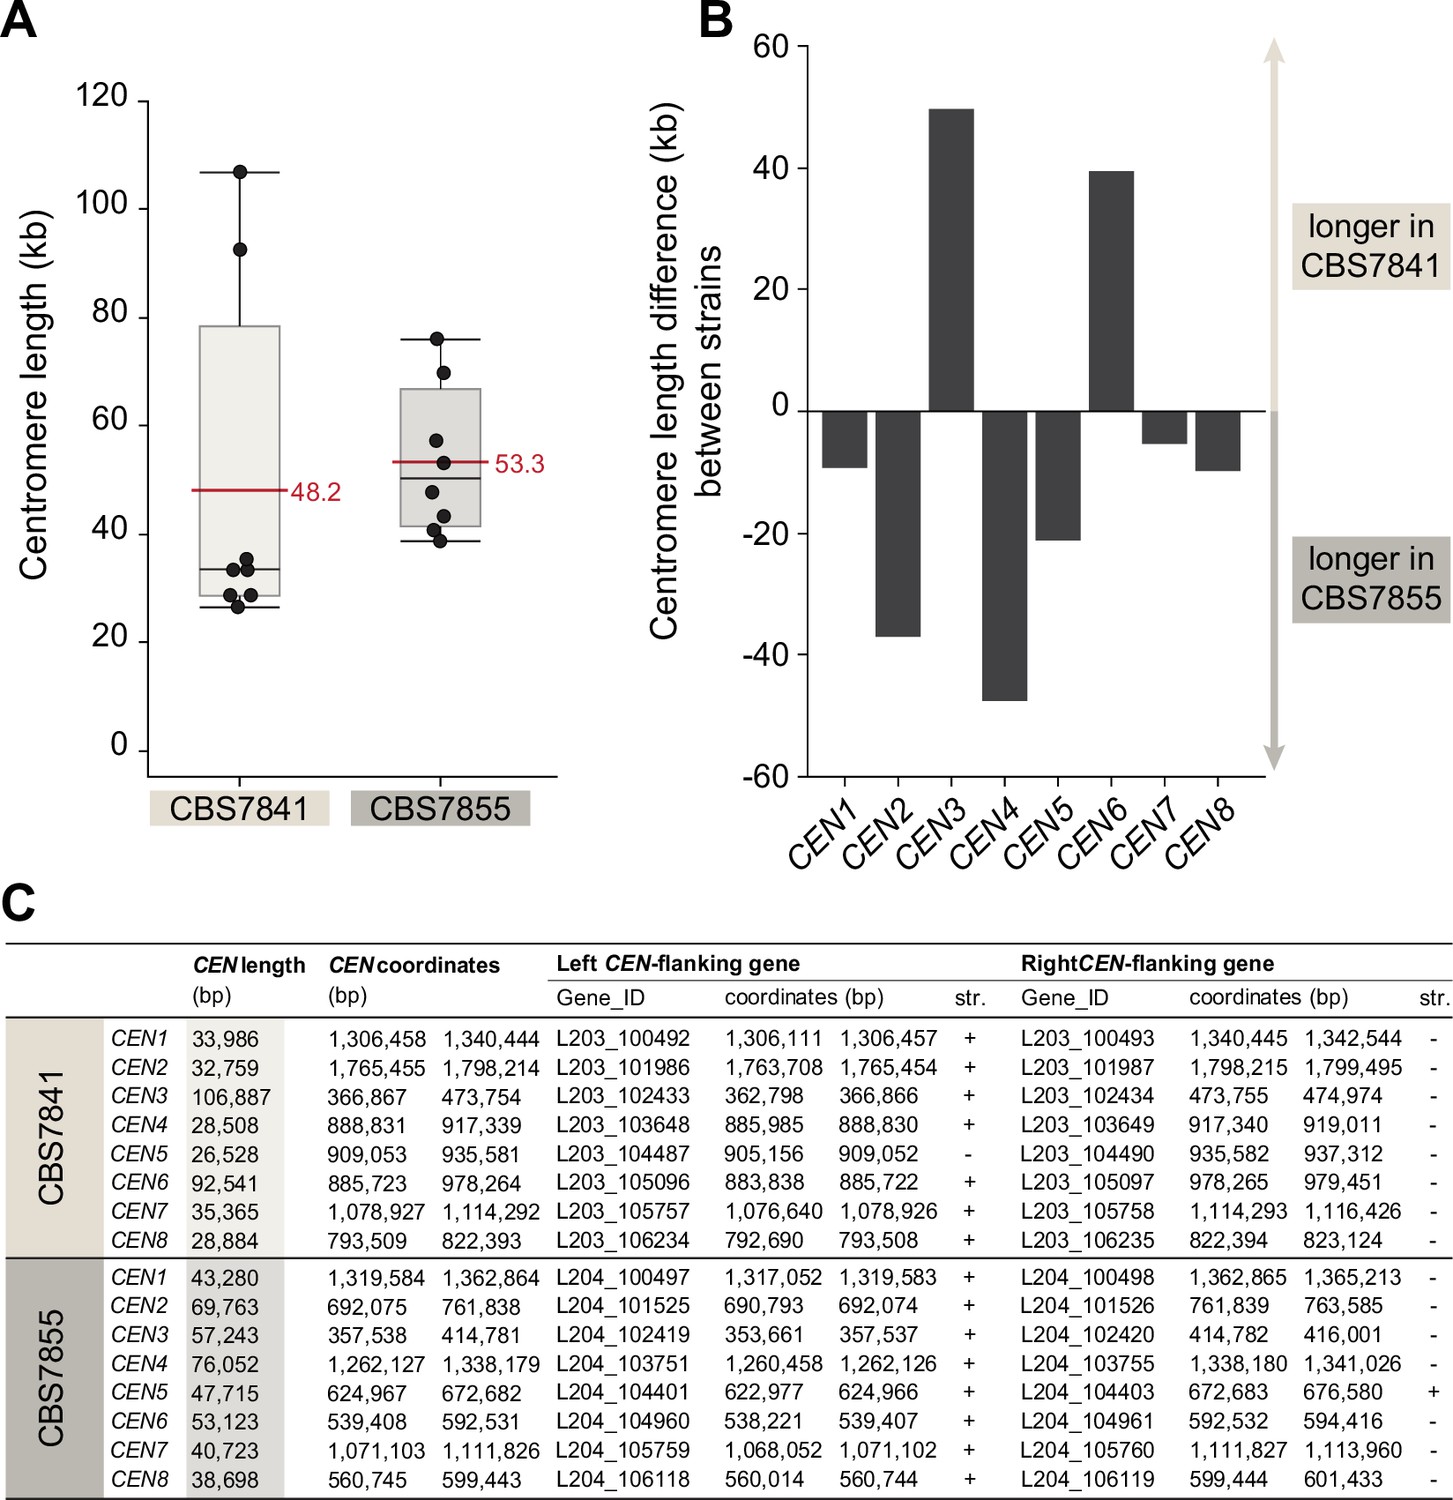
Centromere length comparison between CBS7841 and CBS7855.
(A) Box plots depicting the predicted centromere length. Each dot represents one centromere, and the horizontal red lines depict mean centromere lengths in the corresponding strain. Shaded boxes represent the interquartile ranges, and upper or lower whiskers show the largest or smallest observations, respectively. The centromere length differences observed between the two strains are not statistically significant (p=0.1036; Wilcoxon test). (B) Bar graph depicting the length difference between centromeres of homologous chromosomes of the two strains. (C) List of open reading frames (ORFs) flanking the candidate centromeric regions, genomic coordinates of the predicted centromeres and their exact length. Centromere length was defined as the distance between centromere-flanking ORFs.
Figure 1—figure supplement 4
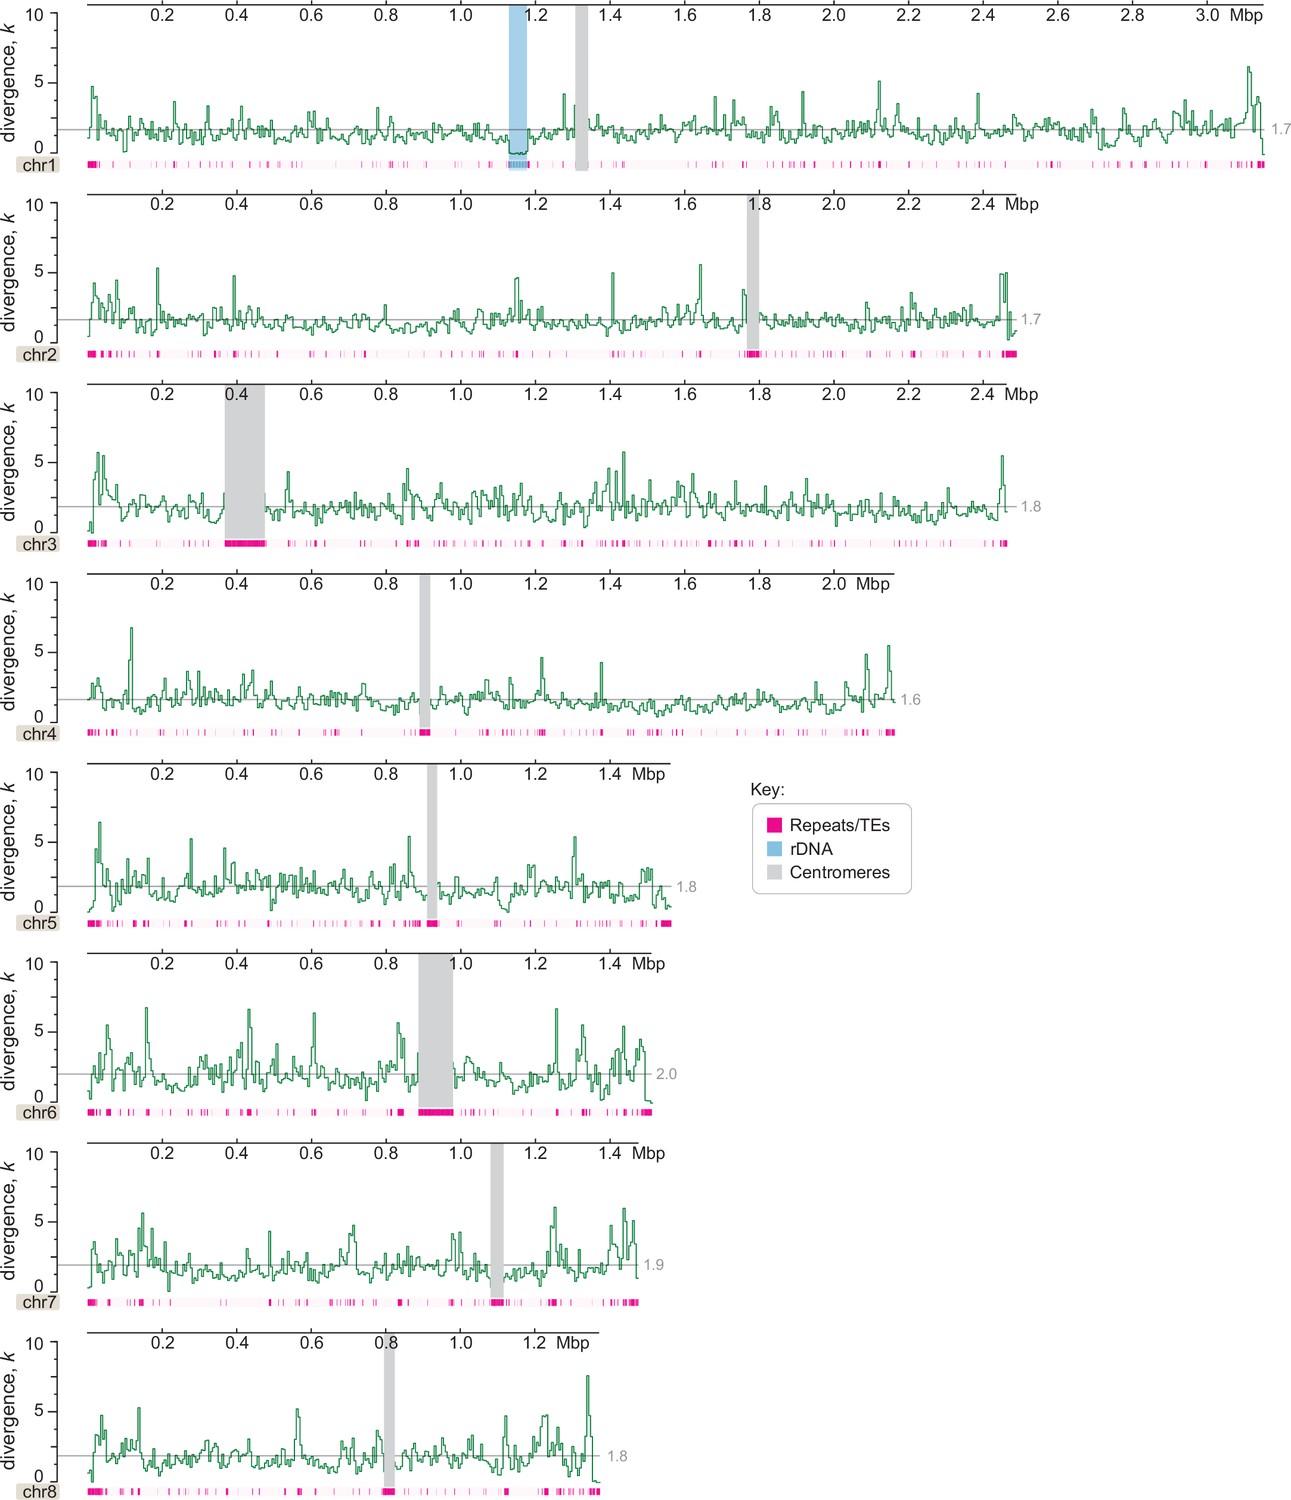
Genome-wide divergence (k, with Jukes–Cantor correction) of C. depauperatus CBS7855 relative to CBS7841 genome reference.
This analysis shows no evidence of introgression (which would appear as regions with zero or nearly zero divergence) between the two strains (y-axis values represent percentages; x-axis values represent mega base pairs).Centromeres, rDNA, and repeat content are depicted as indicated in the key. Each data point represents the average divergence using a non-overlapping sliding window of 5000 sites. A gray line shows the mean divergence for that chromosome.
Figure 1—figure supplement 5
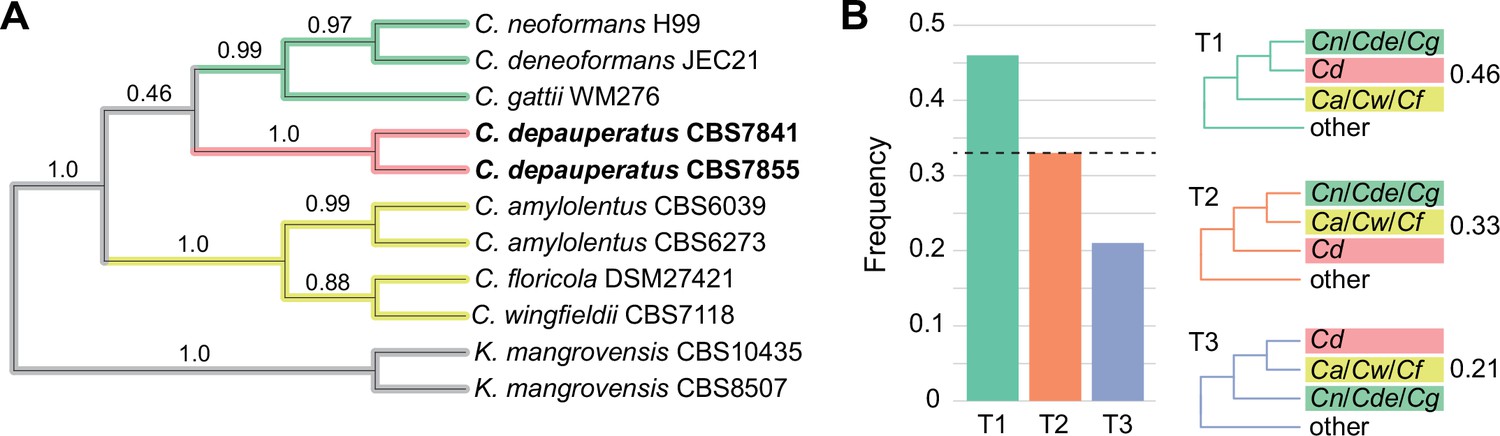
Tree topology inferred from the coalescence-based approach.
(A) Tree topology derived from the coalescence approach is fully congruent with the maximum likelihood (ML) tree derived from a concatenation-based approach. Numerical values on the branches represent quartet support for the main topology (q1).All branches received 1.0 local posterior probability (LPP). (B) Examination of support among individual gene trees for alternative hypotheses of conflicting branches in the species phylogeny. Green bars and topology (T1)reflect the relationships inferred using a concatenation-based approach on the full data matrix, which also corresponds to the best quartet support, while orange and blue bars and topologies (T2 and T3)correspond to the two alternative hypotheses supported by the two alternative resolutions of each quartet. Dashed horizontal lines mark expectation for a hard polytomy. Cn: C. neoformans; Cde: C. deneoformans; Cg: C. gattii; Cd: C. depauperatus; Ca: C. amylolentus; Cw: C. wingfieldii; Cf: C. floricola.
Figure 2 with 3 supplements

The predicted MAT locus of C. depauperatus.
(A) Circos plot depicting the distribution of BLASTN hits between the C. amylolentus chromosomes containing the P/R (Chr 10; links colored in teal blue) and HD (Chr 11; links colored in gold) MAT loci and the C. depauperatus CBS7841 chromosomes. Genes residing within the MAT locus of C. neoformans whose orthologs in C. depauperatus are predominantly clustered on Chr 4 (putative MAT) are depicted as small circles colored in teal blue and gold next to the chromosome tracks. Other small circles illustrate genes within (purple) or bordering (pink) the C. neoformans MAT locus that are found dispersed in the C. depauperatus genome (see Figure 2—source data 1). Other genomic features are as given in the legend of Figure 1A. (B) Sequence alignment of MFα/A1 and MFa/A2pheromone precursors showing that the C. depauperatus mature pheromone is highly similar to MFα/A1 pheromones of other Cryptococcus species. The black arrowhead denotes the predicted cleavage site, giving rise to the peptide moiety of the mature pheromone (indicated by a black bar). (C) Maximum likelihood phylogeny of Ste3α(A1)and Ste3a(A2)pheromone receptors from different Cryptococcus species and Kwoniella mangrovensis (outgroup). C. depauperatus Ste3 sequences cluster together with a/A2alleles from other species. Internal branch support was assessed by 10,000 replicates of Shimodaira–Hasegawa approximate likelihood ratio test (SH-aLRT) and ultrafast bootstrap (UFboot) and are depicted by gray circles when well supported (>90%). Branch lengths are given in number of substitutions per site. (D) Synteny maps of the C. amylolentus CBS6039 P/R (top panel) and HD (bottom panel) MAT loci compared to the predicted MAT region of C. depauperatus CBS7841 and CBS7855. The regions spanning the proposed HD and P/R loci in C. amylolentus are highlighted in yellow. Genes at the predicted MAT region of C. depauperatus with a corresponding ortholog in C. amylolentus found within or flanking the P/R locus are colored, respectively, in dark or light teal blue. Genes flanking the HD locus in C. amylolentus with a corresponding ortholog in C. depauperatus at the predicted MAT region are shown in light gold, while those found within the fused MAT locus of C. neoformans are colored in dark gold. No homologs of the homeodomain transcription factor genes HD1 (SXI1) and HD2 (SXI2) were detected in the genome of C. depauperatus. Vertical gray or pink bars connect orthologs with the same or inverted orientation. Pink horizontal bars below the genes represent repeat-rich regions containing transposable elements or their remnants. ψMFa indicates pheromone gene remnants in CBS6039, and the telomere of Chr 11 in C. amylolentus is depicted by a circled ‘T’.
-
Figure 2—source data 1
Genes within or adjacent to the C. neoformans H99 MAT locus or the P/R and HD MAT loci of C. amylolentus CBS6039, and corresponding orthologs in C. depauperatus.
- https://cdn.elifesciences.org/articles/79114/elife-79114-fig2-data1-v2.xlsx
Figure 2—figure supplement 1
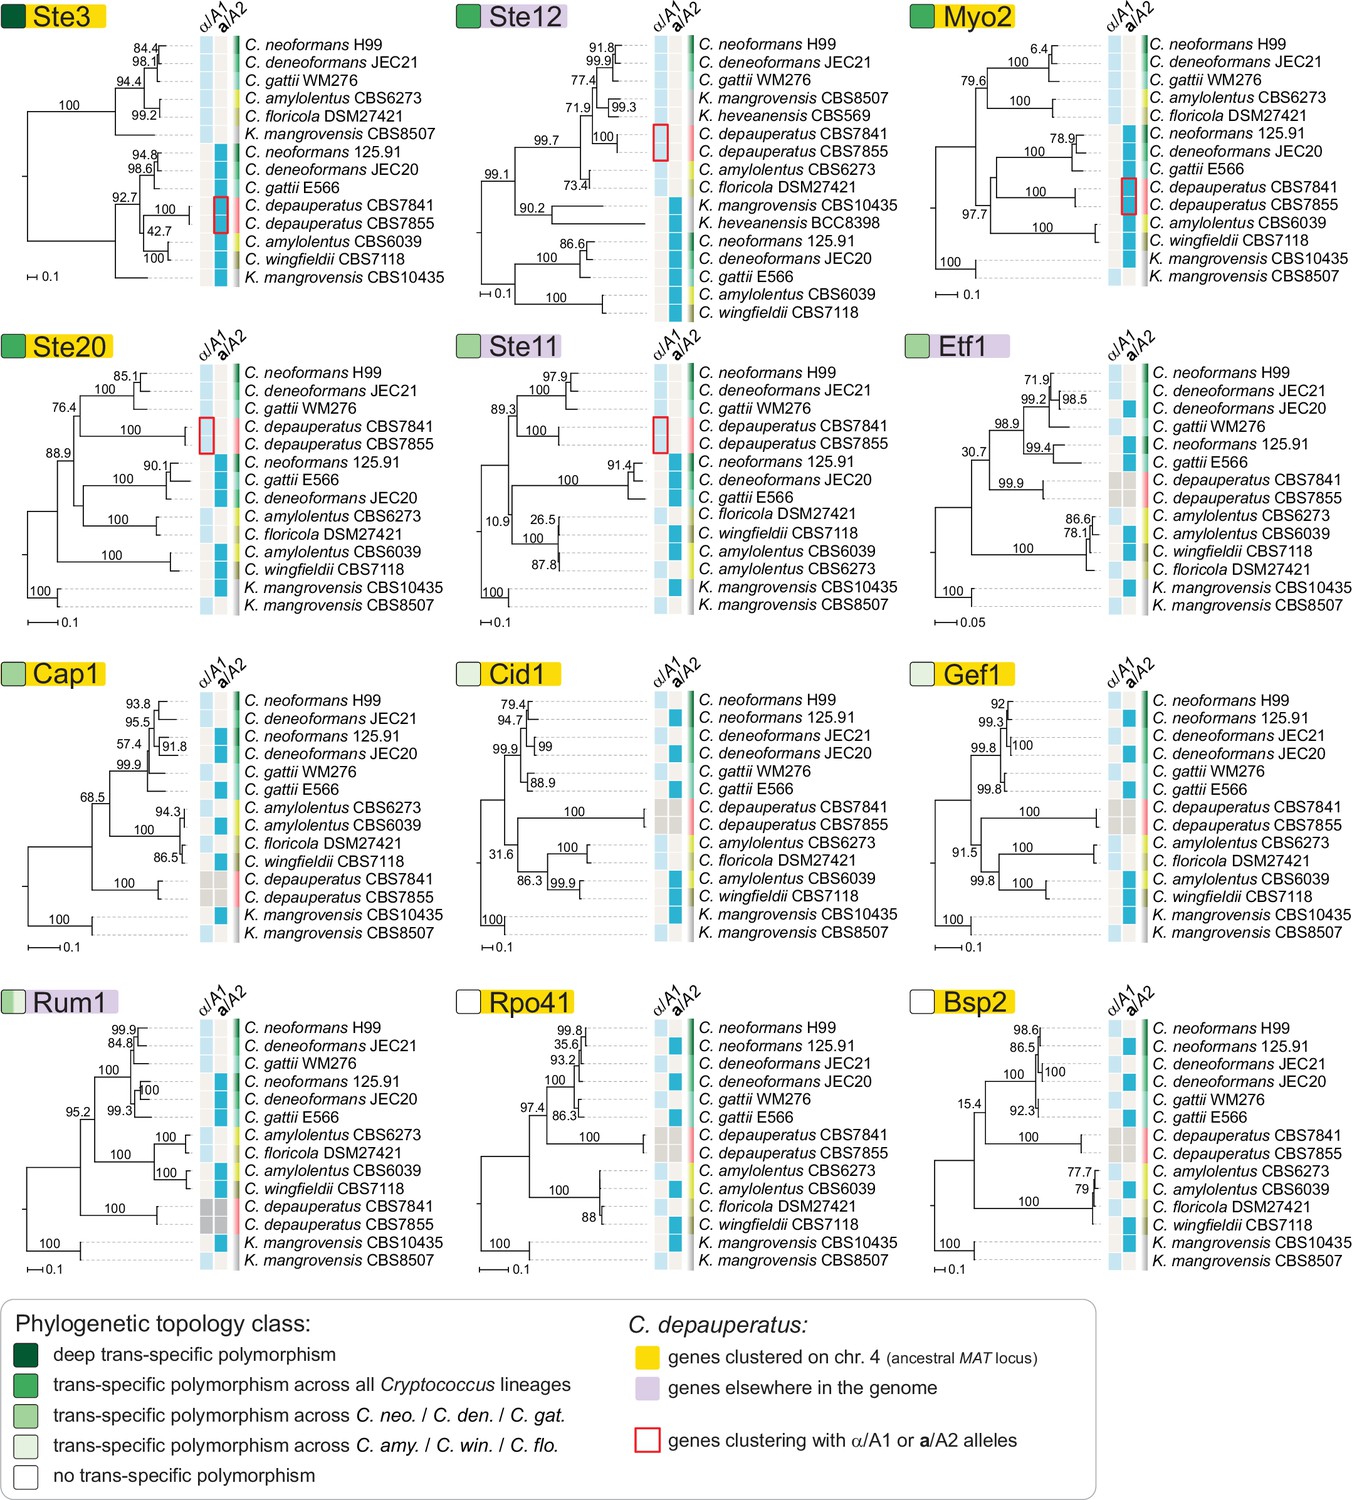
Individual genealogies of genes within the MAT locus of C. neoformans exhibiting different level of trans-specific polymorphism.
Of the analyzed genes, STE3 and MYO2 are both found within the predicted ancestral MAT region of C. depauperatus, and group with strong support with the a/A2alleles from other Cryptococcus species. Conversely, STE12 and STE11 are found outside the predicted MAT region of C. depauperatus (each on a different chromosome) and cluster more closely with α/A1 alleles from other Cryptococcus species. The STE20 gene groups more closely with α/A1 alleles despite residing at predicted MAT locus in C. depauperatus; this may represent the outcome of gene conversion replacing the STE20a/A2with the α/A1 allele. A deep trans-specific polymorphism is only seen for the STE3 gene.
Figure 2—figure supplement 2
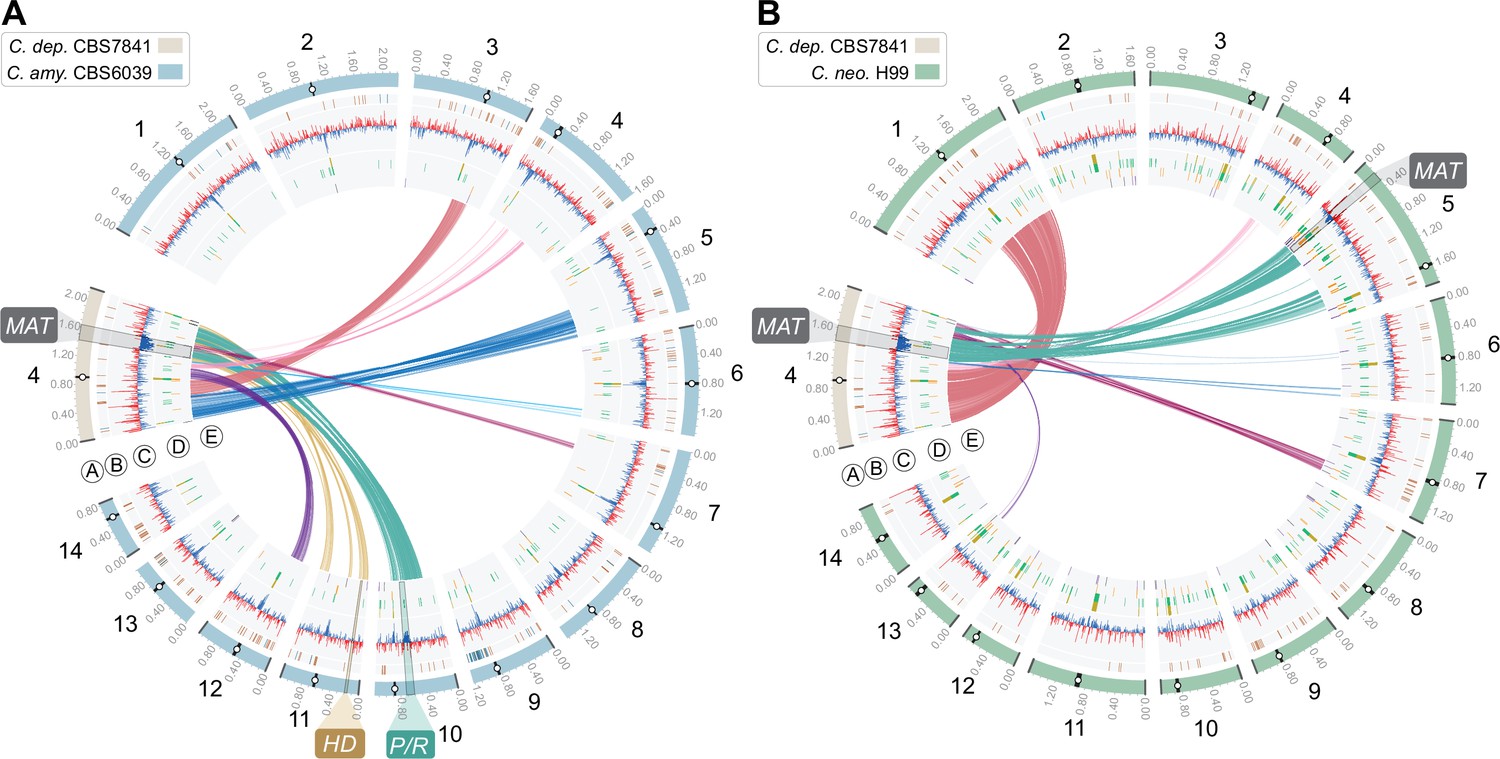
Genome comparison showing the distribution of BLASTN hits (>0.5kb) represented as links between Chr 4 of C. depauperatus, on which the predicted MAT locus is located, and all 14 chromosomes of (A) C. amylolentus CBS6039 and (B) C. neoformans H99.
Tracks ‘A’ to ‘E’ depict genomic features as given in the legend of Figure 1.
Figure 2—figure supplement 3
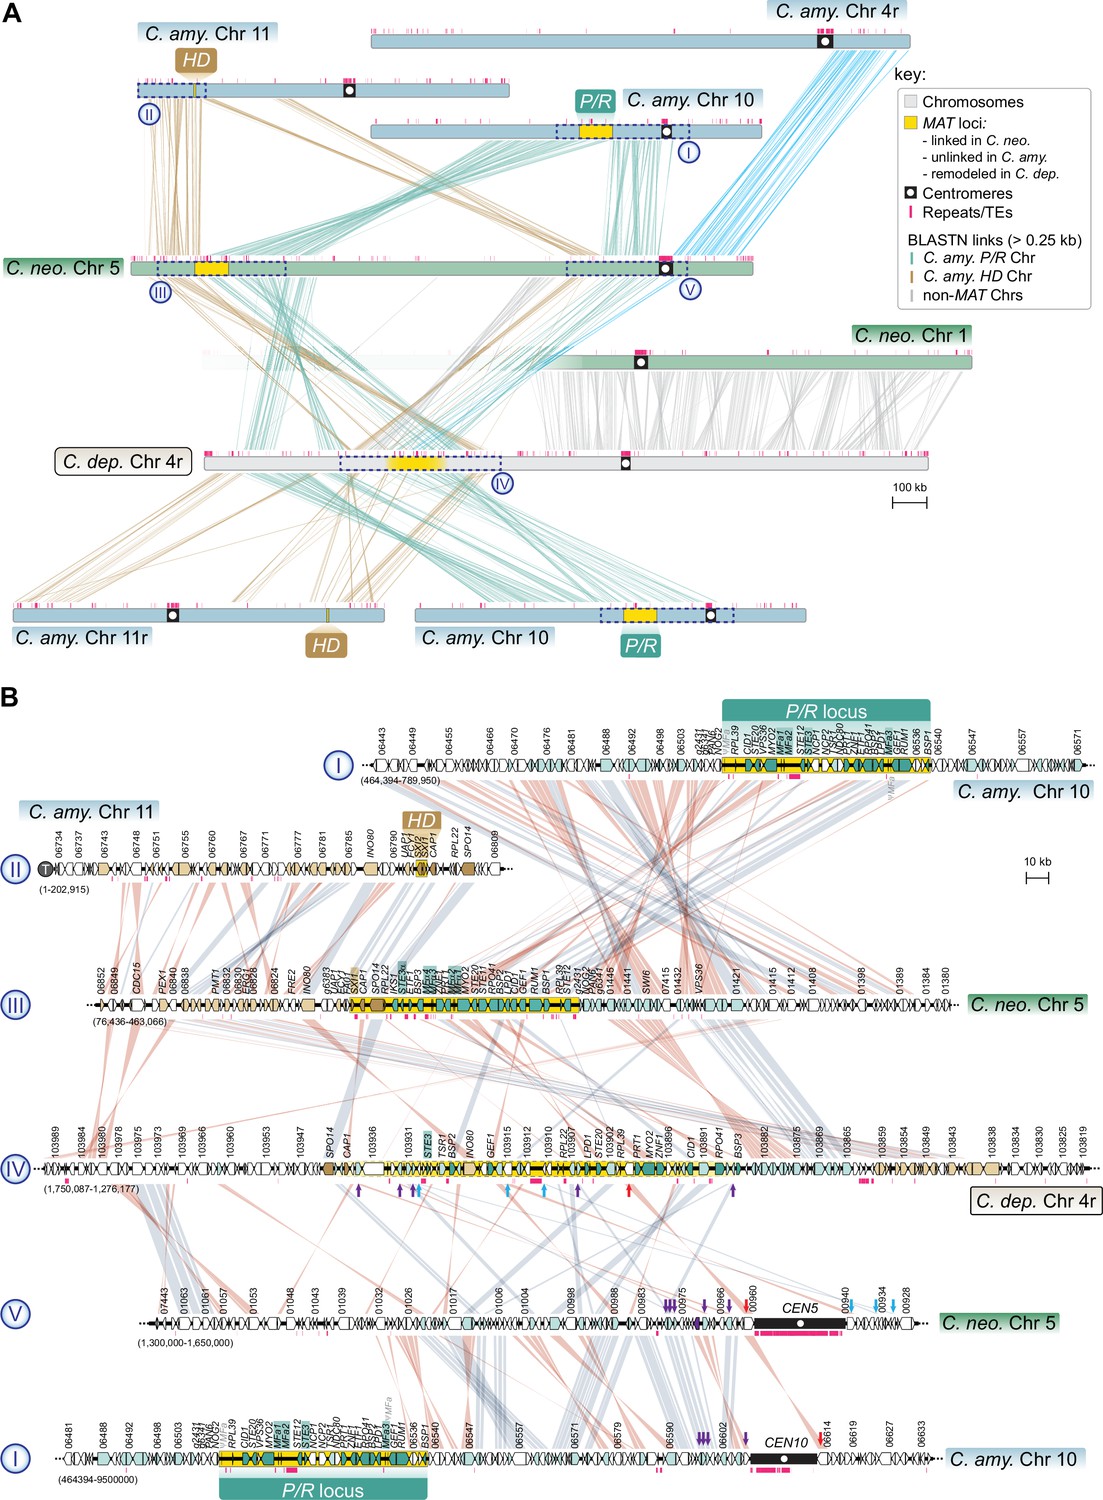
The MAT region of C. depauperatus contains genes that are flanking the centromeres of MAT-containing chromosomes in C. neoformans and C. amylolentus.
(A) Linear chromosome plots depicting syntenic regions between the MAT chromosomes of C. depauperatus (Chr 4), C. neoformans (Chr 5) and C. amylolentus (Chrs 10 and 11). In C. neoformans, CEN5 derives from a past event of intercentromeric recombination between CEN4 and CEN10 of C. amylolentus. C. depauperatus CEN4 corresponds to CEN1 of C. neoformans. (B) Zoomed-in views of the chromosomal regions enclosed in dashed blue boxes (labelled in roman numerals ‘I’ to ‘V’) showing gene synteny conservation and rearrangements. Note that several genes (denoted by red, purple, and blue arrows) flanking C. neoformans CEN5 and C. amylolentus CEN10 are found within the predicted MAT region of C. depauperatus, suggesting that this centromere became inactivated following complex chromosomal rearrangements. For simplicity, the locus_tag prefixes (C. neoformans H99 – CNAG, C. amylolentus CBS6039 – L202, C. depauperatus CBS7841 – L203) were omitted from the gene IDs.
Figure 3
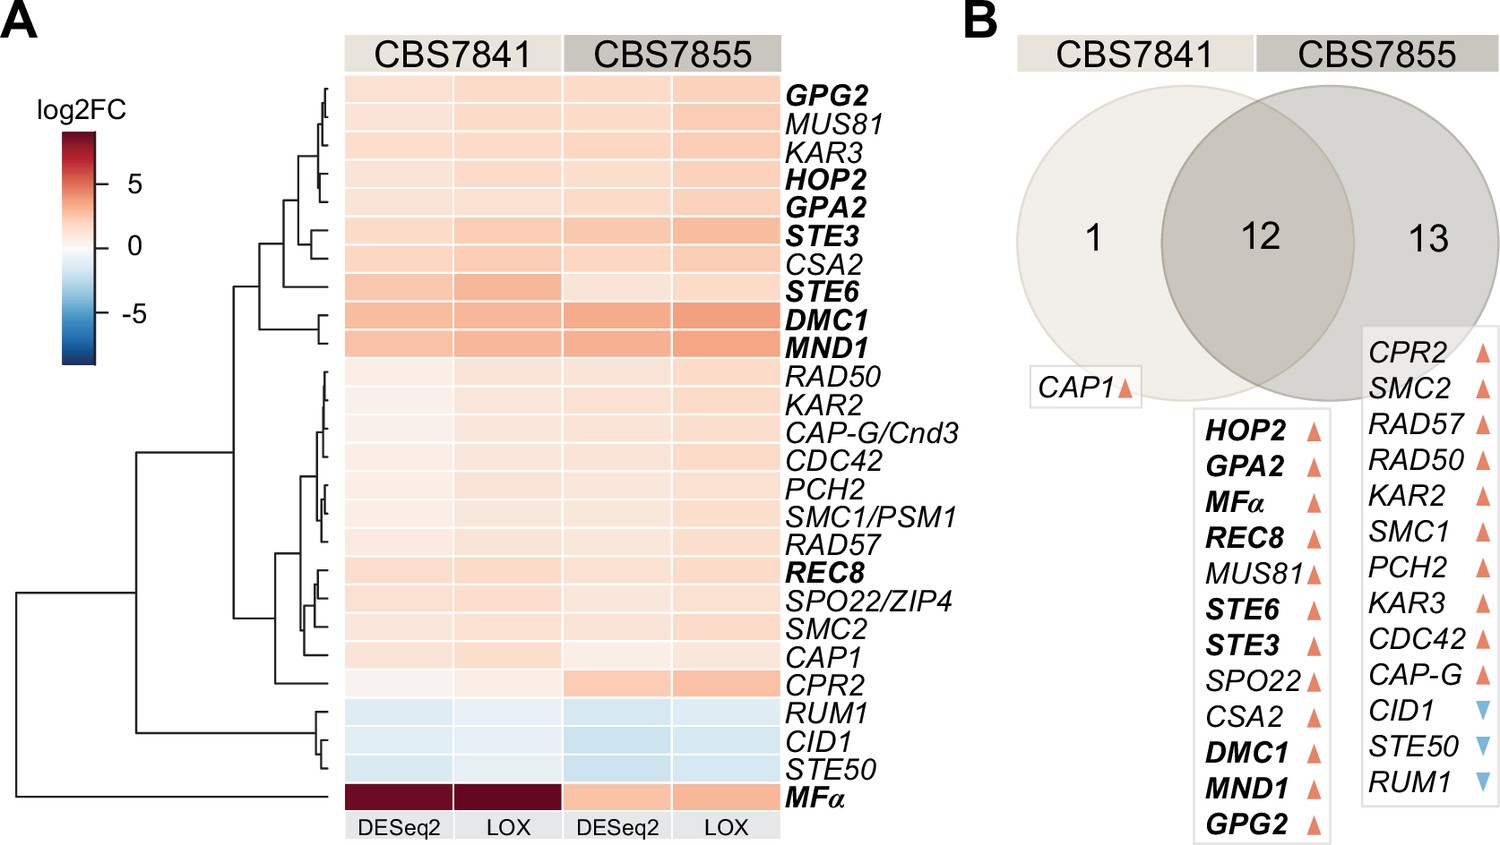
C. depauperatus displays upregulation of key mating and meiotic genes in sporulating conditions.
(A) Heatmap of gene expression analysis of mating and meiosis-related genes for CBS7841 and CBS7855 (see Figure 3—source data 1 and Figure 3—source data 2 for the complete list of genes). Log2 fold changes (log2FC) for conditions conducive for sporulation (solid medium) vs. conditions that inhibited sporulation (liquid media) were determined with DESeq2 and LOX algorithms. Genes shown are differentially expressed in at least one of the two strains using the following thresholds for differential expression: log2FC ≥ ±1, false discovery rate (FDR) (p-adj, DESeq2) ≤ 0.05, p-value=1 (LOX) in the corresponding direction. RNA-seq was performed in triplicate for each strain and condition, and the heatmap shows the mean values across samples. Clustering and generation of heatmaps was done in R (v3.5.1). (B) Venn diagram showing shared and unique differentially expressed genes (DEGs) between the two strains relative to RNA-seq conditions reported in panel (A). Upregulated and downregulated genes are indicated, respectively, by orange and blue arrowheads, and key mating and meiotic DEGs in both strains are depicted in boldface.
-
Figure 3—source data 1
Mating and meiosis genes and their expression under sporulation (solid) vs. non-sporulation (liquid) conditions.
- https://cdn.elifesciences.org/articles/79114/elife-79114-fig3-data1-v2.xlsx
-
Figure 3—source data 2
C. depauperatus gene expression analysis comparing sporulation (solid) vs. non-sporulation (liquid) conditions.
- https://cdn.elifesciences.org/articles/79114/elife-79114-fig3-data2-v2.xlsx
Figure 4
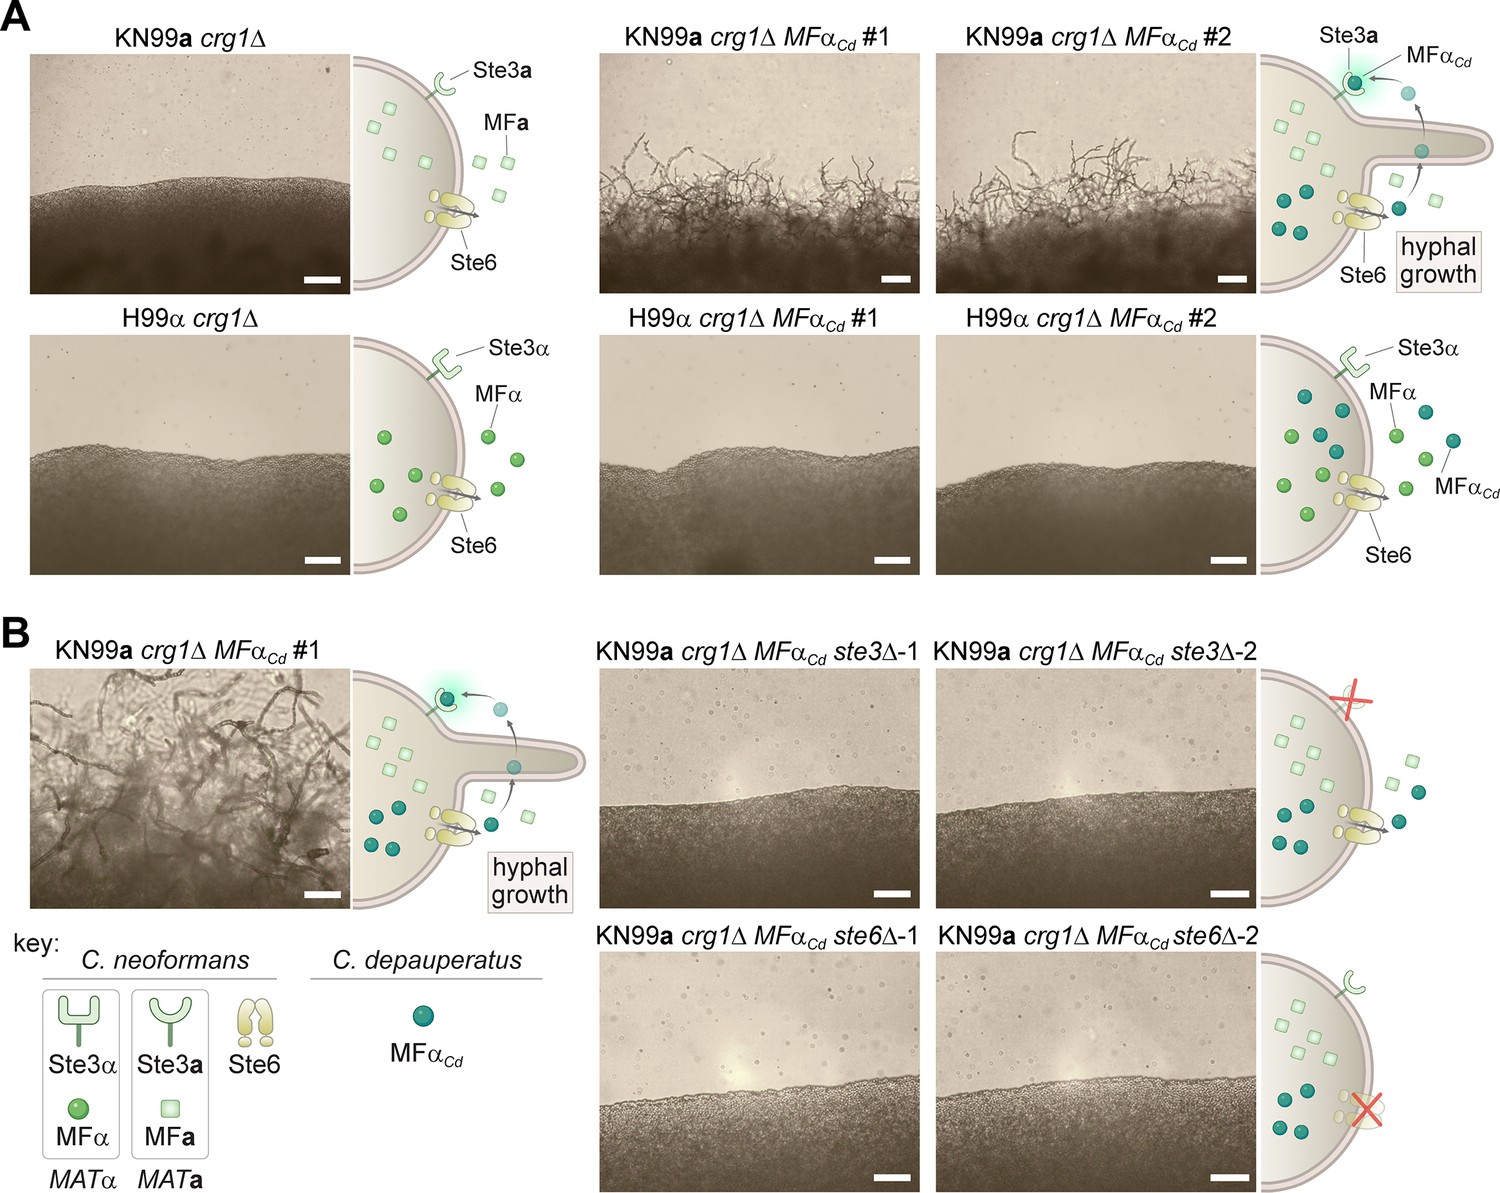
Ectopic expression of the C. depauperatus MFα gene in C. neoformans induces self-filamentation through Ste3 and Ste6.
(A) The C. depauperatus MFα gene was introduced ectopically into C. neoformans MATα (H99α crg1Δ) and MATa(KN99a crg1Δ) strains, and transformants harboring the transgene were assessed for their ability to filament. Light microscopy images of cell patches on filament agar after 6days of incubation at room temperature in the dark. Scale bars represent 50μm for all images except for the KN99a MFαCd transformants, where it denotes 100μm. (B) STE3 and STE6 deletion mutants were constructed in the modified KN99a crg1Δ MFαCd self-filamentous strain. After incubation on filament agar, no filamentation was observed in the ste3Δ and ste6Δ mutants, indicating that both proteins are required for MFαCd to stimulate self-filamentation in C. neoformans. All scale bars represent 50μm.
-
Figure 4—source data 1
Raw images of gels validating C. neoformans WT, ste3Δ and ste6Δ strains expressing the C. depauperatus pheromone.
- https://cdn.elifesciences.org/articles/79114/elife-79114-fig4-data1-v2.zip
Figure 5 with 2 supplements

C. depauperatus mfαΔ and ste3Δ mutants display defects in basidia maturation and sporulation, and the dmc1Δ mutant shows impaired sporulation despite achieving basidial maturation.
(A) Scanning electron microscopy images of wild-type CBS7841, mfαΔ (SEC831), ste3Δ (SEC836), and dmc1Δ (SEC866) deletion mutants. Cells were imaged following 1week of incubation on V8 medium at room temperature in the dark. Images were taken at ×3500 magnification; bars = 10μm. Arrows show examples of the tip splitting phenotype observed in mfαΔ and ste3Δ mutants. (B) Quantification of basidia-producing spores and basidia defective in sporulation. Strains were incubated on Murashige–Skoog (MS) medium for 10days. Up to 100 basidia were evaluated in each case across at least three independent images, and the percentage of basidia with spores (blue) and those defective in sporulation (i.e., bald basidia; orange) is represented. Single mutants (mfαΔ, ste3Δ, and dmc1Δ) were constructed via A. tumefaciens-mediated transformation, and the mfαΔ ste3Δ double mutant was isolated from progeny of mfαΔ × ste3Δ co-cultures (basidia #6 isolate number 1). Error bars represent standard error of the mean (see Figure 5—source data 1). (C) Box and whisker plots showing the diameter of sporulating and unsporulated basidia in wild-type and mutant strains. Strains were incubated on MS medium for 25days, imaged at ×12.5 magnification, and the basidial diameter was measured with ImageJ software (see Figure 5—figure supplement 2). Shaded boxes and black line represent the interquartile ranges and median value, respectively. Outliers are included (see Figure 5—source data 2). Statistical significance in panels (B) and (C) was determined with a one-way ANOVA and Tukey’s post hoc test. *** Significant at p<0.0001; n.s., not significant.
-
Figure 5—source data 1
Frequency of basidia defective in sporulation (bald basidia) and basidia with spores in C. depauperatus wild-type (CBS7841) and mutant strains, and one-way ANOVA and Tukey’s HSD post hoc statistical tests for frequencies of bald basidia.
- https://cdn.elifesciences.org/articles/79114/elife-79114-fig5-data1-v2.pdf
-
Figure 5—source data 2
Diameter of unsporulated and sporulating basidia in C. depauperatus wild-type (CBS7841) and mutant strains (mfαΔ, ste3Δ, and dmc1Δ) following incubation on Murashige–Skoog (MS) medium for 25days at room temperature in the dark.
Statistical tests for differences in basidial diameter (one-way ANOVA followed by Tukey’s HSD post hoc; when comparing two groups of observations, the results of Tukey’s HSD test are equivalent to Student’s t-test).
- https://cdn.elifesciences.org/articles/79114/elife-79114-fig5-data2-v2.xlsx
Figure 5—figure supplement 1
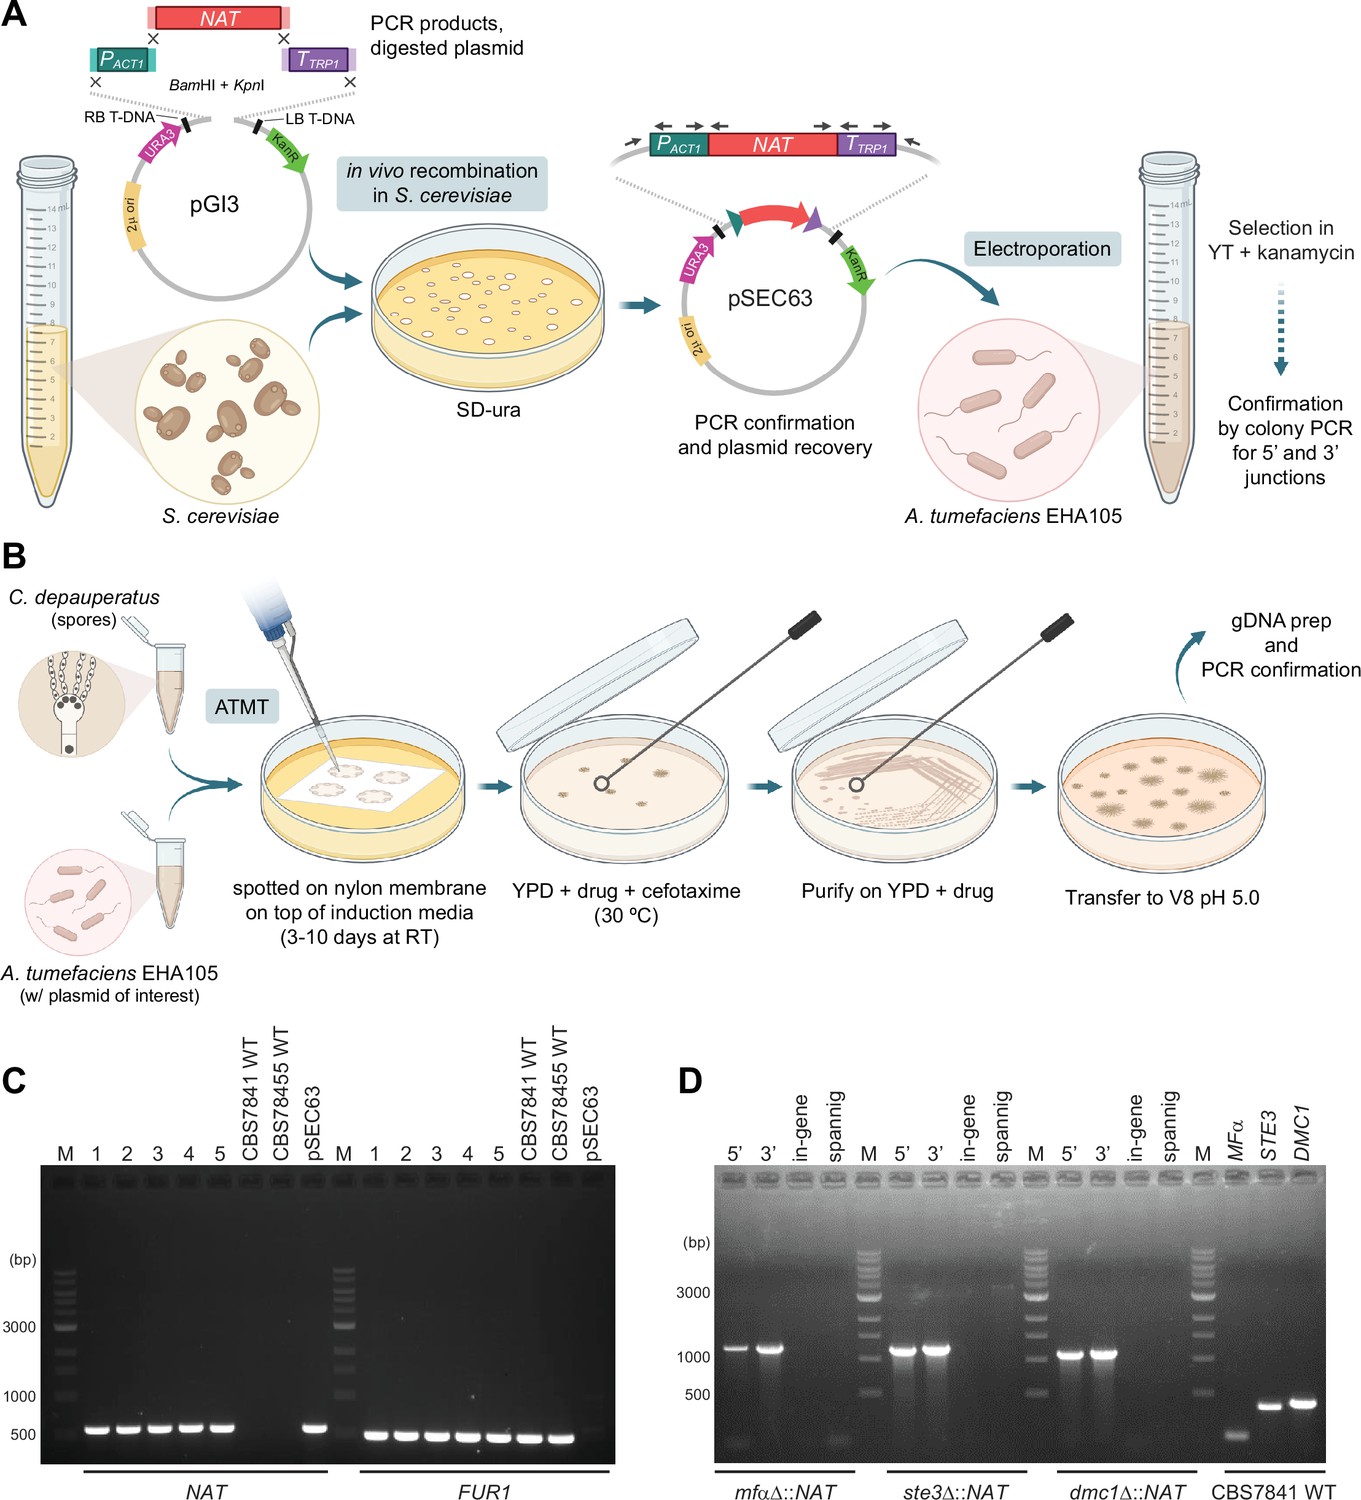
Schematic of the transformation system optimized for C. depauperatus and genotypic analysis of C. depauperatus transformants.
(A) The efficient homologous recombination system of S. cerevisiae was employed to construct plasmids for A. tumefaciens-mediated transformation of C. depauperatus as illustrated in panel (B).(C) PCR confirmation of ectopic NAT transformants. PCR with primers JOHE40162 and JOHE41081 identified the NAT gene in CBS7841 (lanes 1–4) and CBS7855 (lane 5) transformants. CBS7841 and CBS7855 wild-type serve as negative controls, and pSEC63 (the plasmid containing the C. depauperatus specific NAT marker in the binary vector pGI3) serves as a positive control. FUR1 PCR with primers JOHE45648 and JOHE45649 are positive controls for C. depauperatus genomic DNA. (D) Junction, in-gene, and spanning PCR confirmation of mfαΔ, ste3Δ, and dmc1Δ mutants. See Supplementary file 1 for primer sequences. Panels (A) and (B) were produced with https://biorender.com/.
-
Figure 5—figure supplement 1—source data 1
Raw images of gels validating the C. depauperatus deletion mutant strains.
- https://cdn.elifesciences.org/articles/79114/elife-79114-fig5-figsupp1-data1-v2.zip
Figure 5—figure supplement 2
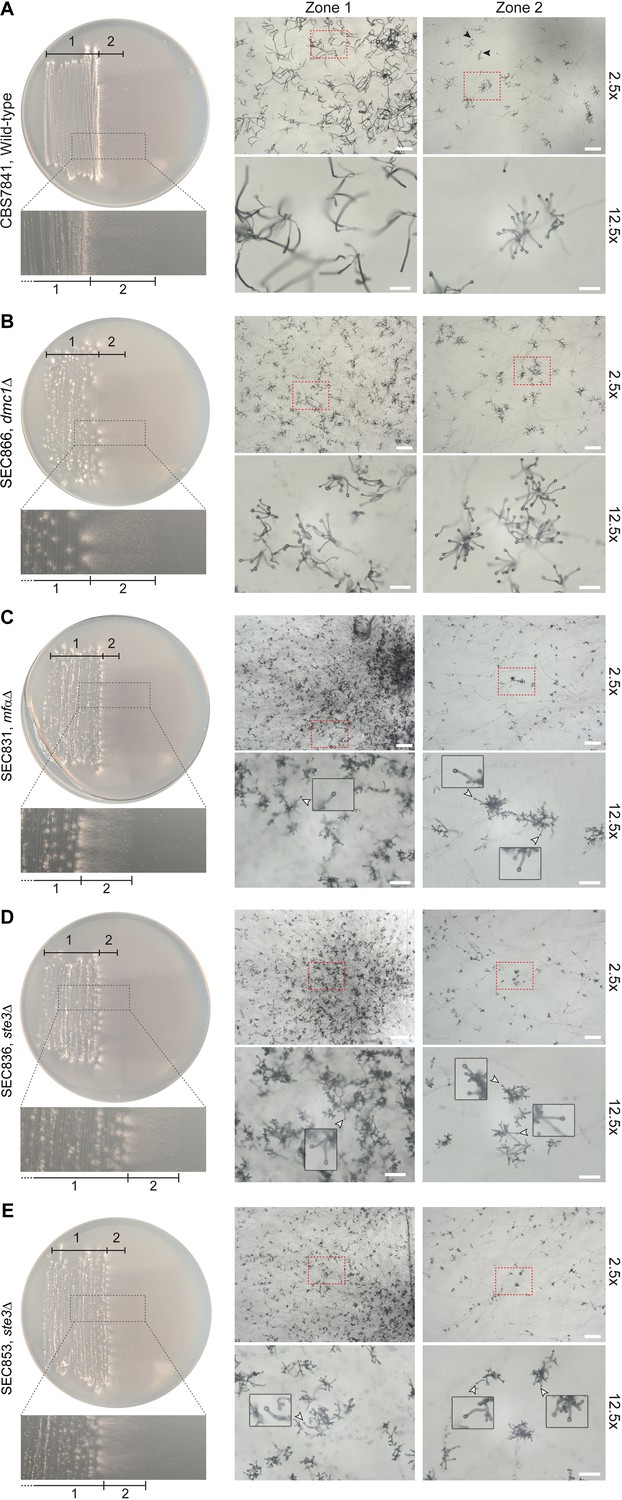
Representative microscopy images of (A) wild-type CBS7841, (B) dmc1Δ (SEC866), mfαΔ (SEC831), (C) ste3Δ-1 (SEC836), (D), ste3Δ-2 (SEC853), and (E) dmc1Δ (SEC866) deletion mutants.
Plates were imaged following 25days of incubation on Murashige–Skoog (MS) medium at room temperature in the dark. Images were taken at ×2.5 (bars = 200μm) and ×12.5magnification (bars = 50μm) from two different zones of the culture: zone 1 corresponding to older hyphae (in the wild type, this zone predominantly contains sporulated basidia) and zone 2 corresponding to younger, actively growing hyphae (in the wild type, this zone predominantly contains unsporulated basidia; a few sporulating basidia are indicated by black arrowheads). Basidia diameter was measured with ImageJ from images taken at ×12.5 magnification (see Figure 5—source data 2). For each representative image taken at ×2.5 magnification, a zoomed-in view (×12.5) corresponding to the region indicated by dashed red squares is shown below. For the mfαΔ (SEC831), ste3Δ-1 (SEC836), and ste3Δ-2 (SEC853) mutants, examples of immature basidia are indicated by white arrowheads and shown as zoomed-in insets.
Figure 6 with 1 supplement

Sporulation is partially restored in mfαΔ × ste3Δ co-cultures.
(A) Illustration and light microscopy images of the C. depauperatus mfαΔ mutant (left), ste3Δ mutant (right), and a co-culture of the mfαΔ and ste3Δ mutants (middle). Images were taken following 2weeks of incubation on Murashige–Skoog (MS) medium. White arrows indicate spore chains, and a zoomed-in view is shown in the inset. (B) Quantification of basidia-producing spores and basidia defective in sporulation in wild-type (CBS7841), mfαΔ and ste3Δ single mutants, and the mfαΔ × ste3Δ co-cultures. In each case, ~100 basidia across at least three independent images were quantified, and the percentage of basidia with spores (blue) and those defective in sporulation (i.e., bald basidia; orange) is shown. Error bars represent standard error of the mean. Statistical significance was determined with a one-way ANOVA and Tukey’s post hoc test. *Significant at p<0.05; ***significant at p<0.0001 (see Figure 6—source data 1). (C) Table summarizing genotypic analysis of basidiospores dissected from 12 independent basidia of the mfαΔ × ste3Δ cross. The germination rate of the dissected spores was 100%. Presence of wild-type MFα and STE3 or mutant mfαΔ and ste3Δ alleles was determined by in-gene and junction PCRs. Each basidium was scored as parental ditype (PD), nonparental ditype (NPD), tetratype (TT), and uniparental (Uni.) based upon the genotype of parental and recombinant spores they comprised. Phenotypic and genotypic analyses of each dissected spore are available in Figure 6—source data 2. Illustrations in panel (A) were produced with https://biorender.com/.
-
Figure 6—source data 1
Frequency of basidia defective in sporulation (bald basidia) and basidia with spores in C. depauperatus wild-type (CBS7841), mfαΔ and ste3Δ single mutants, and the mfαΔ × ste3αΔ co-cultures mutant strains and one-way ANOVA and Tukey’s HSD post hoc statistical tests for frequencies of sporulating basidia.
Related to Figure 6B.
- https://cdn.elifesciences.org/articles/79114/elife-79114-fig6-data1-v2.pdf
-
Figure 6—source data 2
Phenotyping and genotyping analyses of the progeny derived from mfαΔ × ste3Δ co-cultures.
Related to Figure 6C. Progeny from each basidium were plated on YPD and YPD+ NATto test for NAT resistance or sensitivity and subjected to PCR and gel electrophoresis with primers targeting the wild-type MFα and STE3 alleles, as well as the 3′ junction of the mfαΔ::NAT and ste3Δ::NAT deletion loci. Phenotyping and genotyping observations were compiled to determine whether exogenous pheromone from the ste3Δ mutant may have stimulated sporulation of the mfαΔ mutant, or mating occurred between the mfαΔ and ste3Δ mutants. Each basidium was scored as parental ditype (PD), nonparental ditype (NPD), tetratype (TT), and uniparental (Uni.) based upon the genotype of parental and recombinant spores they comprised.
- https://cdn.elifesciences.org/articles/79114/elife-79114-fig6-data2-v2.xlsx
Figure 6—figure supplement 1
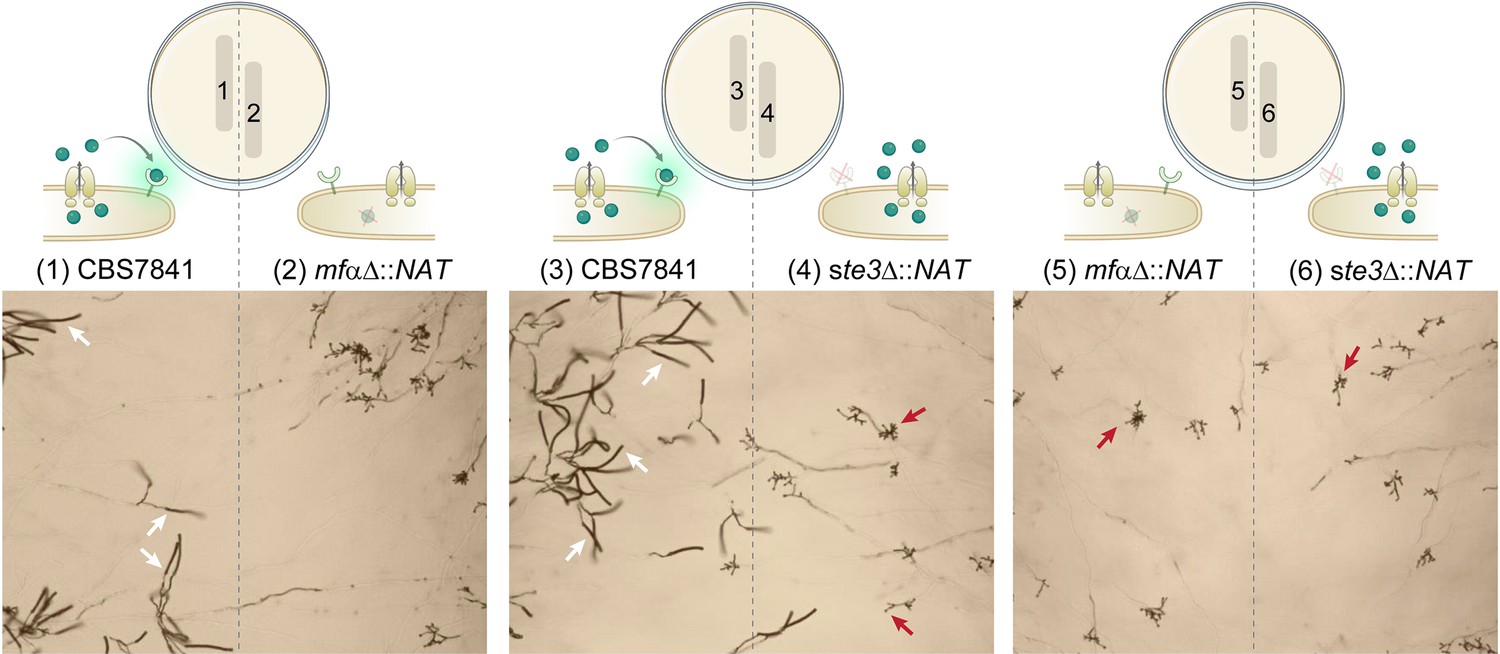
C. depauperatus mutant strains do not undergo sporulation in confrontation assays.
Spores and/or hyphae from wild-type and mutant strains were struck~2mm apart on Murashige–Skoog (MS) medium and incubated at room temperature for 2weeks. Sporulating basidia (a few examples emphasized by white arrows) are observed on the left side of the plate (1 and 3) where the WT strain was inoculated, but not on the right side of the plate corresponding to the mutant strains (red arrows indicate a few examples of bald basidia). The lack of complementation of the mfαΔ mutation (expected to occur in 2 and 5) might be due to low diffusion and/or concentration of the mating pheromone, preventing long-distance interactions.
Figure 7 with 1 supplement
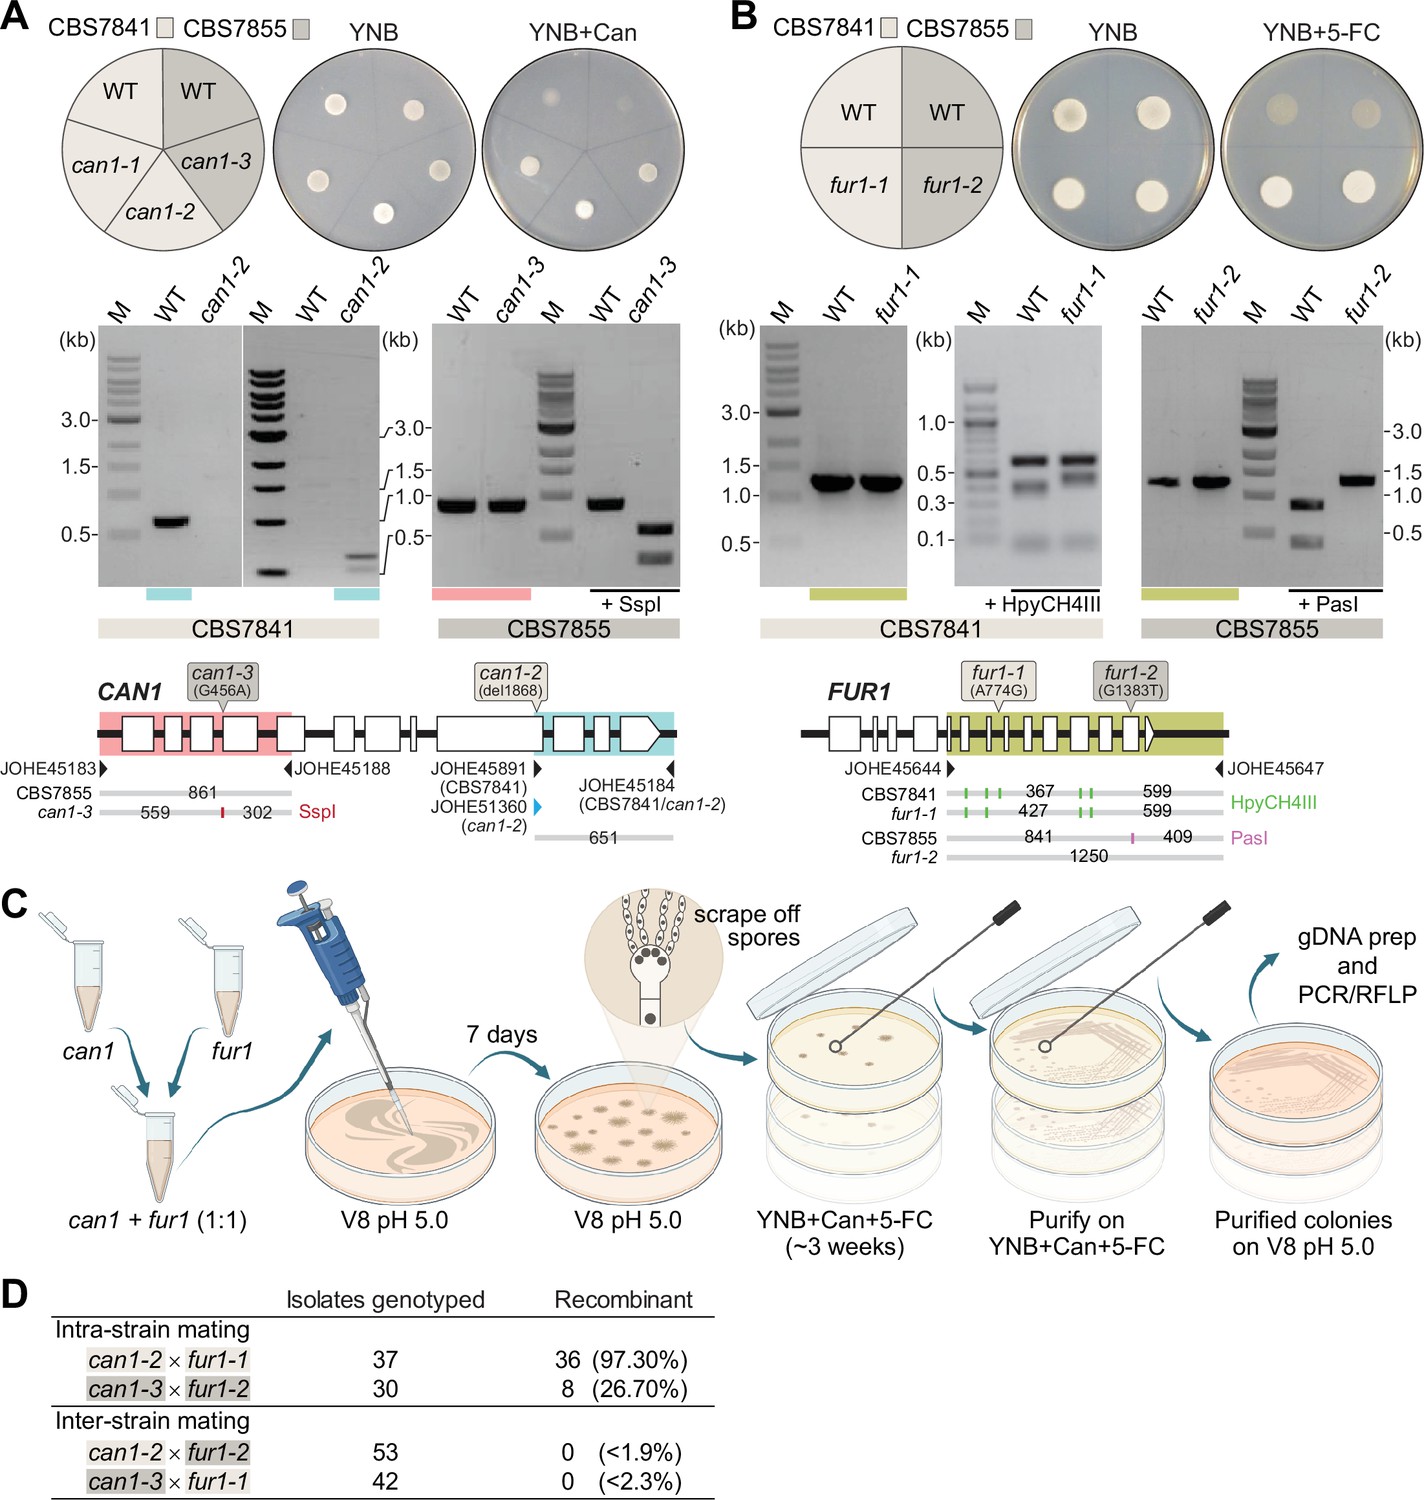
Analysis of C. depauperatus can1 and fur1 mutants, and mating in intra- and inter-strain crosses.
Phenotypic and genotypic analysis of (A) can1 and (B) fur1 mutants. Top panels: wild-type and UV-induced can1 mutants on YNB and YNB+ 60µg/mL canavanine (Can), and wild-type (WT) and spontaneous fur1 mutants on YNB+ 100µg/mL 5-flucytosine (5-FC). Bottom panels: PCR and RFLP analyses of wild-type, and mutant can1 and fur1 alleles. The different CAN1 and FUR1 spontaneous mutations are depicted on the top of each gene (see ‘Materials and methods’ for details). (C) Schematic of mating assays with the can1 and fur1 mutants. (D) Mating assessment in CBS7841 and CBS7855 can1 and fur1 mutants when crossed with themselves (intra-strain crosses) and with each other (inter-strain crosses). For the inter-strain crosses, we assumed the possibility that the next isolate to be analyzed could be recombinant and thus the frequencies (shown in parentheses) were calculated as being<1/54 (can1-2 × fur1-2) or<1/43 (can1-3 × fur1-1).
-
Figure 7—source data 1
Source raw data for Figure 7A and B (raw images of gels).
- https://cdn.elifesciences.org/articles/79114/elife-79114-fig7-data1-v2.zip
Figure 7—figure supplement 1
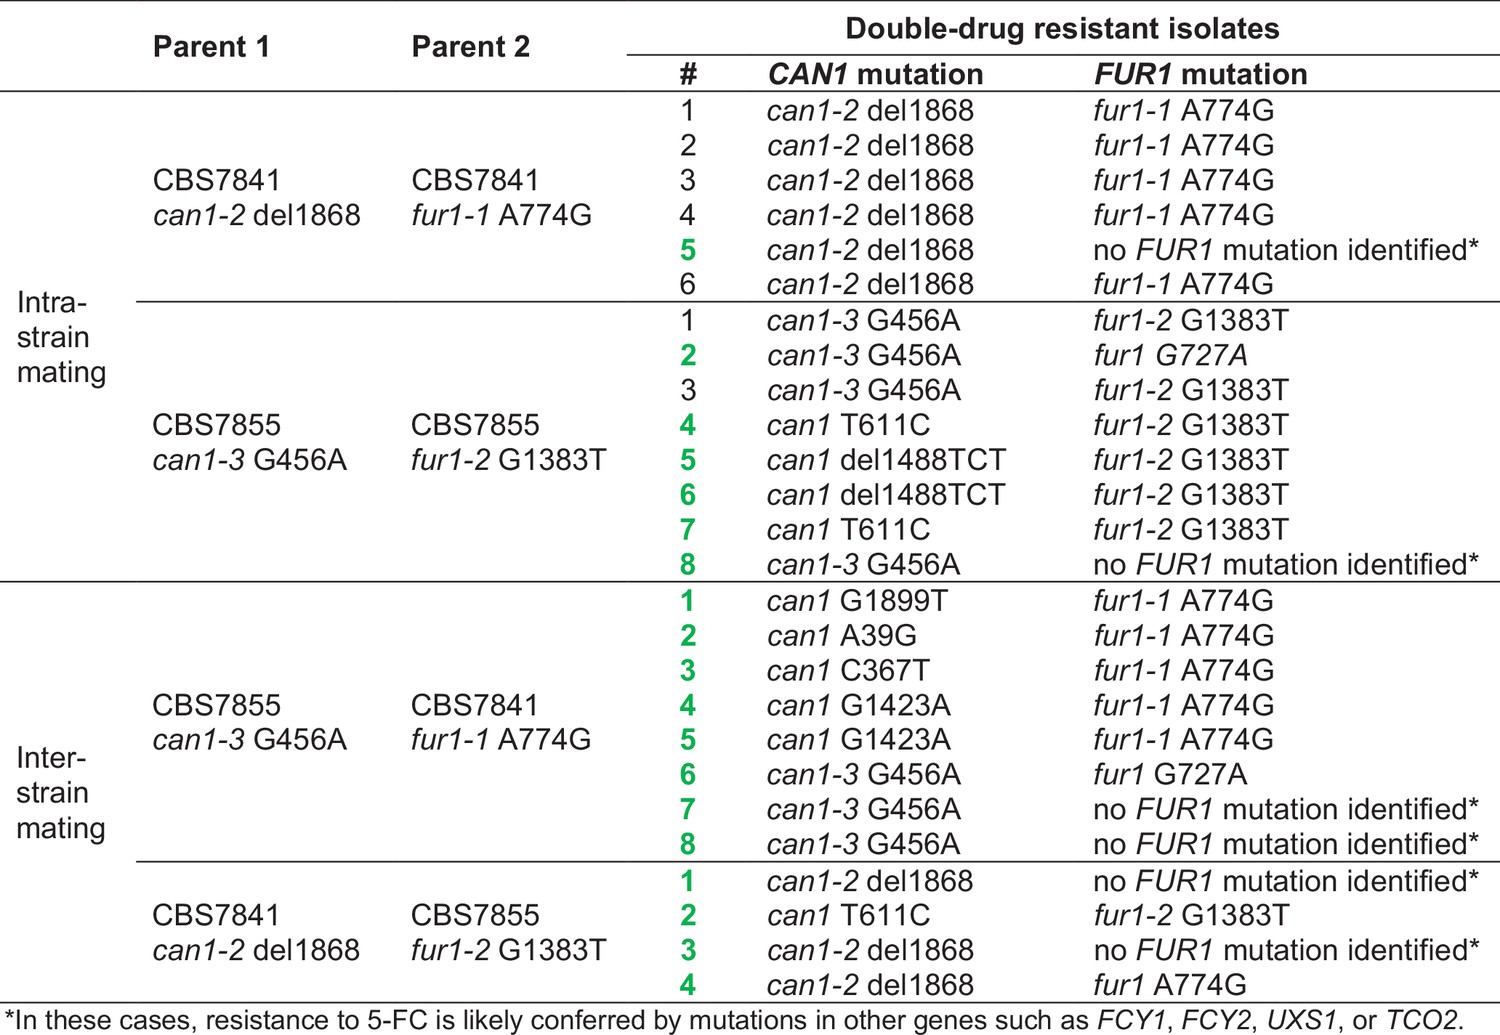
Sanger sequencing of CAN1 and FUR1 loci from double-drug-resistant isolates recovered from C. depauperatus intra- and inter-strain crosses.
Isolates marked in green did not inherit both parental mutant alleles; rather, they gained de novo spontaneous mutations in CAN1 or FUR1 loci, or in other genes.
Figure 8

Meiotic mapping of UV-induced mutations in recombinant progeny.
(A) Chromosome locations of the FUR1 and CAN1 genes and the three new mutations induced by UV irradiation (UV1, UV2, and UV3). Two of the mutations (UV1 and UV2) are spaced~715kb apart on Chr 3. (B) Gene models carrying the UV1, UV2, and UV3 mutations in isolate SEC747. Exons are shown as gray rectangles, while the introns are shown as gray horizontal lines. The UV1, UV2, and UV3 mutations are single-nucleotide changes, respectively, within the seventh exon of the gene L203_103150, the last intron of gene L203_102842, and third exon of gene L203_105531, the latter mutation leading to an early stop-gain. (C) Results of PCR and Sanger sequencing analyses used to determine inheritance of wild-type and mutant alleles in 10 progeny from a cross between isolates SEC747 and SEC631. Wild-type and mutant alleles are colored green and purple, respectively. The parent genotypes of UV1, UV2, and UV3 loci are either all wild-type alleles (P1, isolate SEC631) or all mutant alleles (P2, isolate SEC747). All progeny analyzed inherited both parental can1-2 and fur1-1 mutant loci, providing a double-drug-resistant phenotype. 4 out of 10 progeny had combinations of wild-type and mutant alleles on Chr 3 that differ from either parent, suggesting that meiotic recombination occurred between the two markers.
Figure 9
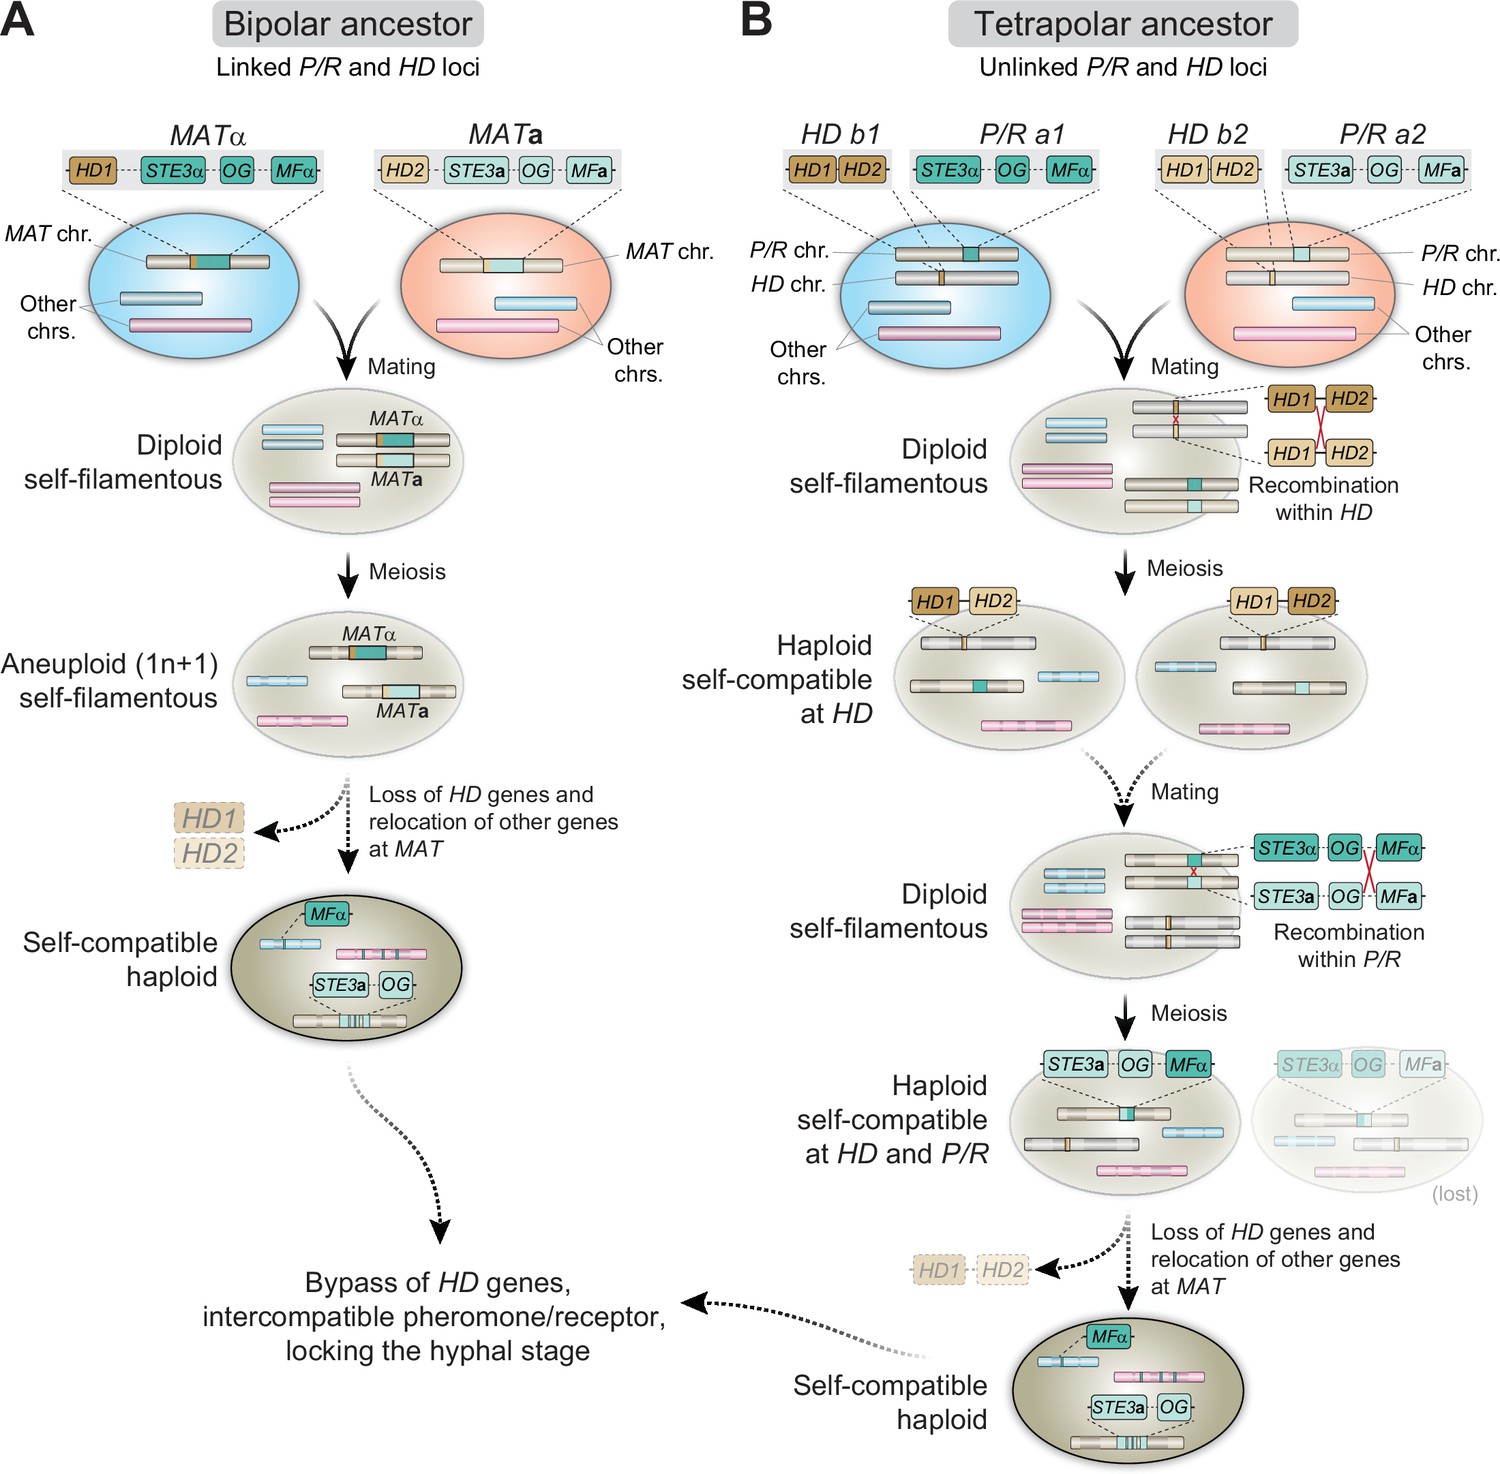
Proposed models for the evolution of MAT and homothallism in C. depauperatus.
(A) Following cell fusion of two haploid cells with opposite mating types with linked P/R and HD loci (bipolar configuration), a self-filamentous diploid cell was formed. During meiosis, one set of homologous chromosomes, except that containing the MAT locus, was lost, resulting in an F1 aneuploid 1n + 1 progeny that is still self-fertile. The need for the HD genes is bypassed and the genes were eventually lost. As selective pressure to maintain genes in tight linkage at MAT was reduced due to self-compatibility, some genes from the MATα loci became unlinked and dispersed throughout the genome via rearrangements and/or transposition. (B) Cells of opposite mating type carrying unlinked P/R and HD loci (tetrapolar configuration) fused to produce a self-filamentous diploid. During meiosis, a recombination event between HD1 and HD2 led to the formation of compatible HD1/HD2 allele pairs whose gene products could heterodimerize and form an active transcriptional regulator. In a subsequent mating event involving one or both such individuals, a recombination event at the P/R locus caused reciprocal exchange between select P/R a1 (including MFα) and P/R a2 genes and gave rise to two haploid, self-filamentous progeny both now capable of responding to their own pheromone. In such a scenario, the cell harboring the STE3aand MFα genes may have subsequently lost the compatible HD1/HD2 gene pair, and some MATα genes became unlinked and dispersed throughout the genome. The cell harboring the STE3α and MFagenes was either lost or outcompeted. OG stands for other genes typically included at the P/R locus beyond mating pheromones and receptors.
Author response image 1

Additional files
-
Supplementary file 1
Strains used in this study.
- https://cdn.elifesciences.org/articles/79114/elife-79114-supp1-v2.xlsx
-
Supplementary file 2
Primers used in this study.
- https://cdn.elifesciences.org/articles/79114/elife-79114-supp2-v2.xlsx
-
MDAR checklist
- https://cdn.elifesciences.org/articles/79114/elife-79114-mdarchecklist1-v2.docx
Download links
A two-part list of links to download the article, or parts of the article, in various formats.
Downloads (link to download the article as PDF)
Open citations (links to open the citations from this article in various online reference manager services)
Cite this article (links to download the citations from this article in formats compatible with various reference manager tools)
Obligate sexual reproduction of a homothallic fungus closely related to the Cryptococcus pathogenic species complex
eLife 11:e79114.
https://doi.org/10.7554/eLife.79114


