HIV skews the SARS-CoV-2 B cell response towards an extrafollicular maturation pathway
- Africa Health Research Institute, South Africa
- School of Laboratory Medicine and Medical Sciences, University of KwaZulu-Natal, South Africa
- HIV Pathogenesis Programme, The Doris Duke Medical Research Institute, University of KwaZulu Natal, South Africa
- Division of Infection and Immunity, University College London, United Kingdom
- KwaZulu-Natal Research Innovation and Sequencing Platform, South Africa
- International AIDS Vaccine Initiative, United States
- The Scripps Research Institute, United States
- Max Planck Institute for Infection Biology, Germany
- Centre for the AIDS Programme of Research in South Africa, South Africa
- Department of Immunology and Microbiology, University of Copenhagen, Denmark
Figures
Figure 1 with 1 supplement
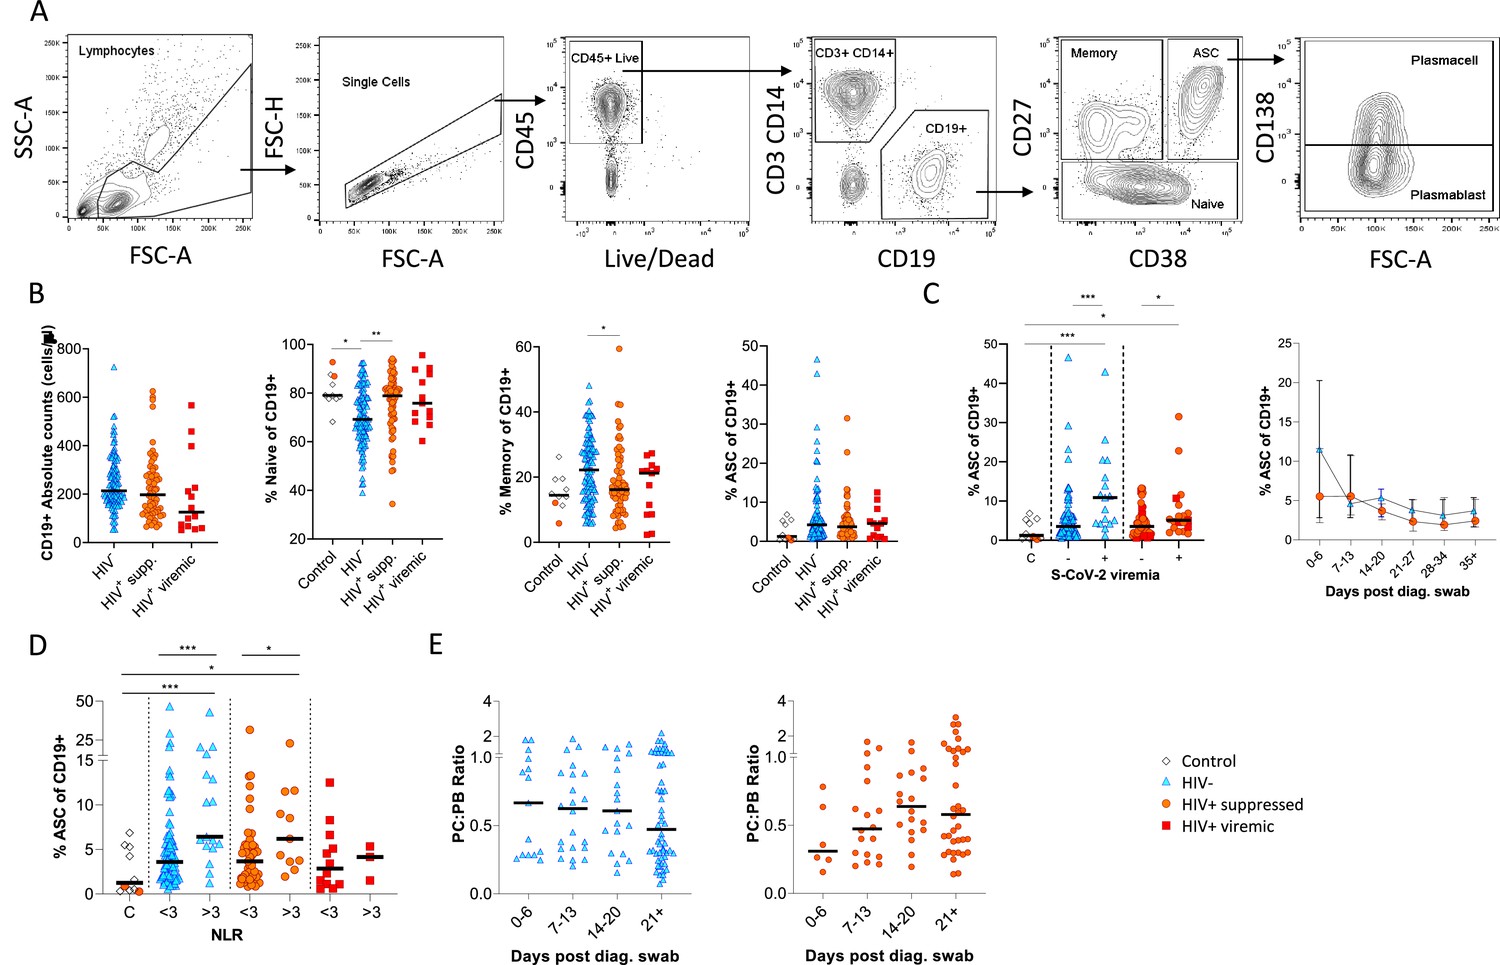
Canonical B cell phenotype frequencies vary with HIV status but still mount robust antibody-secreting cell (ASC) responses.
(A) Gating strategy to identify CD19+ B cells within the peripheral blood mononuclear cell (PBMC) compartment. B cells were further gated on CD27 and CD38 to identify CD27+ Memory, CD27- Naïve, and CD27+CD38++ ASC. (B) Absolute B cell counts were calculated from patient total lymphocyte counts, followed by percent Naïve, Memory, and ASC fractions of the CD19+ parent population. These data represent the total combined frequencies over all time points per patient group. (C) The ASC response associated with SARS-CoV-2 viremia and was tracked longitudinally up to day 35 post diagnosis. Error bars indicate standard deviation (HIV- n = 37; HIV+ n = 33). (D) A neutrophil-lymphocyte ratio (NLR) served as a proxy of inflammation and associated with the ASC as well as plasmablast and plasma cell responses. Statistical analyses were performed using the Kruskal-Wallis H test for multiple comparisons and Mann-Whitney for SARS-CoV-2 viremia or NLR comparisons within groups. p Values are denoted by *≤0.05; **<0.01; ***<0.001, and ****<0.0001.
Figure 1—figure supplement 1

Individual patient longitudinal antibody-secreting cell (ASC) responses.
Figure 2 with 3 supplements
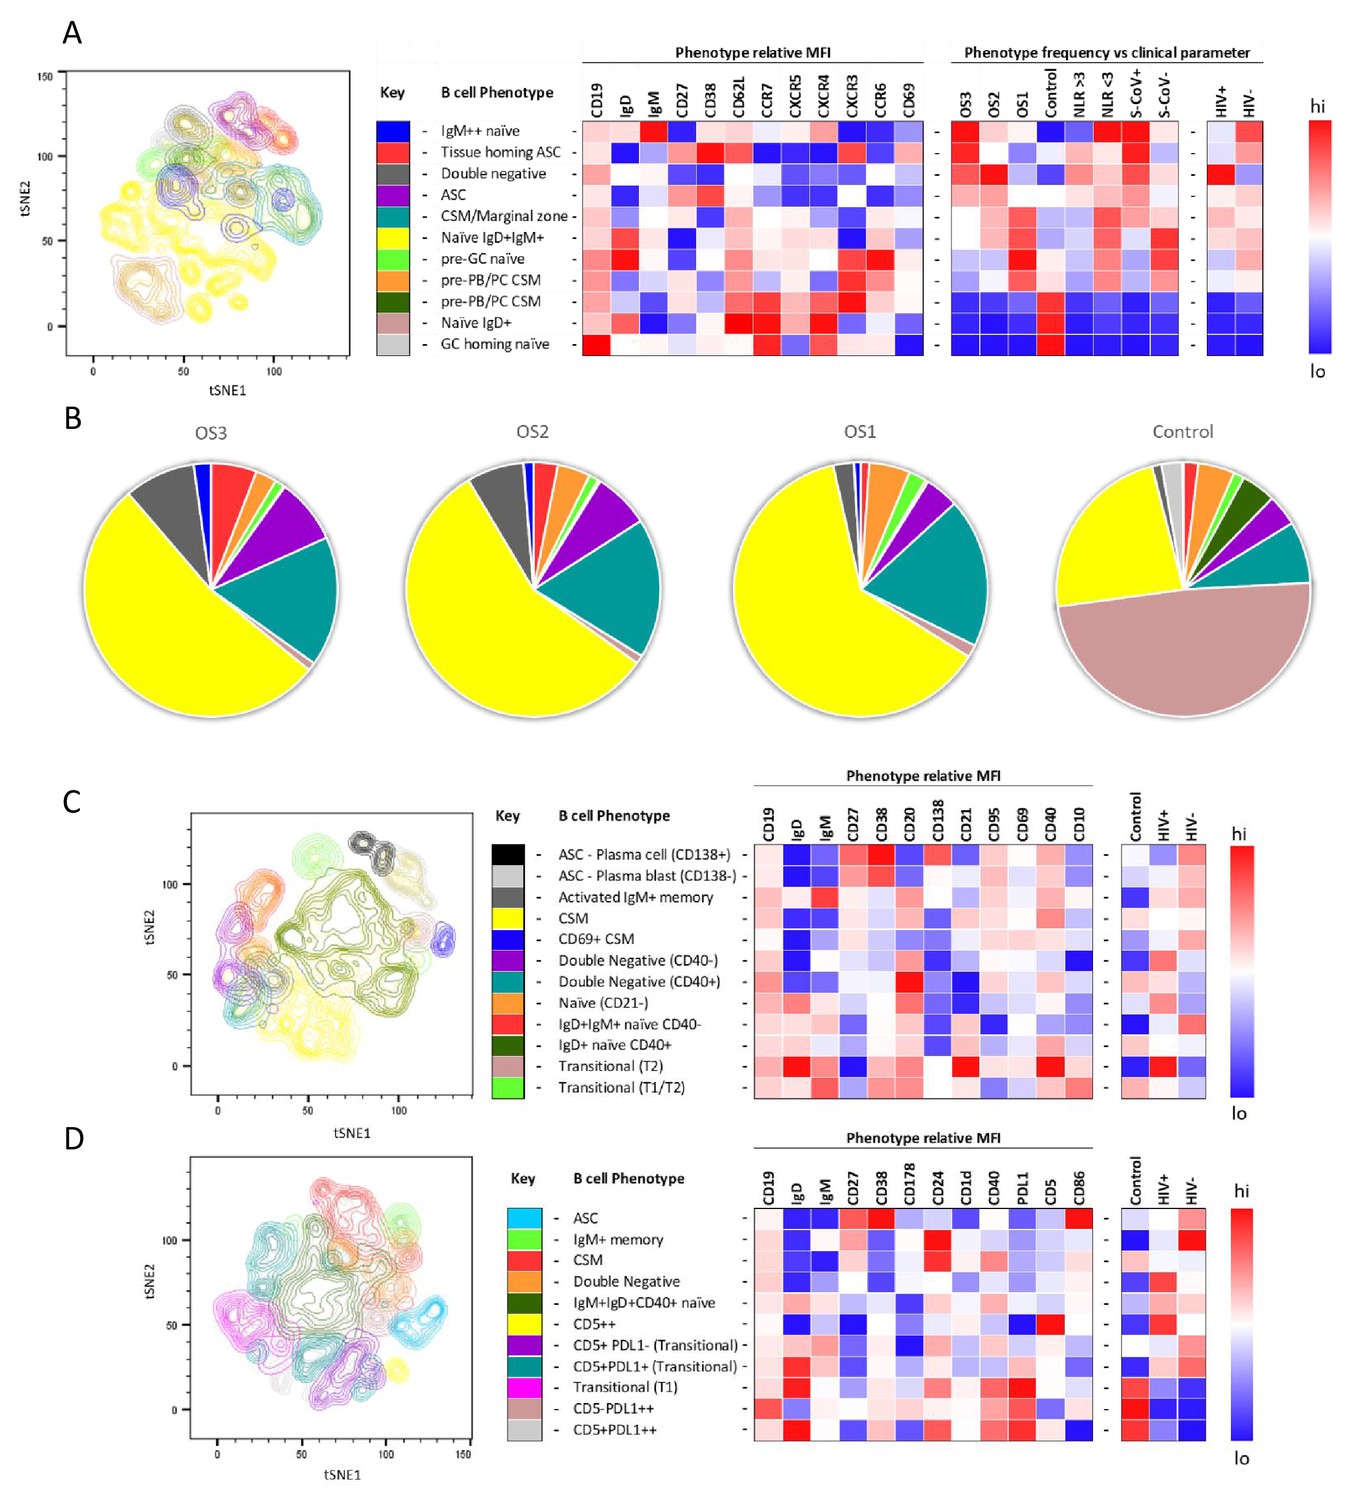
tSNE analysis of the B cell phenotypes and frequencies relative to COVID-19 clinical parameters including disease severity, neutrophil lymphocyte ratio, SARS-CoV-2 viremia, and HIV status.
A total of 80,000 CD19+ B cells, all sampled at baseline, from four patient groups (20,000 cells per group) were used in an unbiased tSNE analysis. Patients were grouped by decreasing disease severity according to an ordinal scale ranging from 3 to 1 (OS3 to 1) and a healthy control group. There was an equal contribution from people living with HIV (PLWH) and HIV-ve patients per group except for the control group. Three B cell phenotyping panels were used, focusing on homing (A, B), maturation (C), and regulatory (D) markers. Each panel included an anchor panel of CD19, IgD, IgM, CD27, and CD38. The key to the colouring of the different tSNE clusters is included alongside with a description of the phenotype. The phenotype is then depicted as a heatmap of the median fluorescence intensity (MFI) of each surface marker within that cluster, followed by a heatmap of the cluster frequency relative to ordinal scale (OS3 to 1); neutrophil-lymphocyte ratio (NLR) cut-off of 3.0 to separate moderate and mild inflammation, SARS-CoV-2 viremia (S-CoV), and HIV status. (B) The frequency of each B cell phenotypic cluster identified by tSNE depicted as pie charts, separated based on disease severity (OS3 to 1) and controls.
Figure 2—figure supplement 1

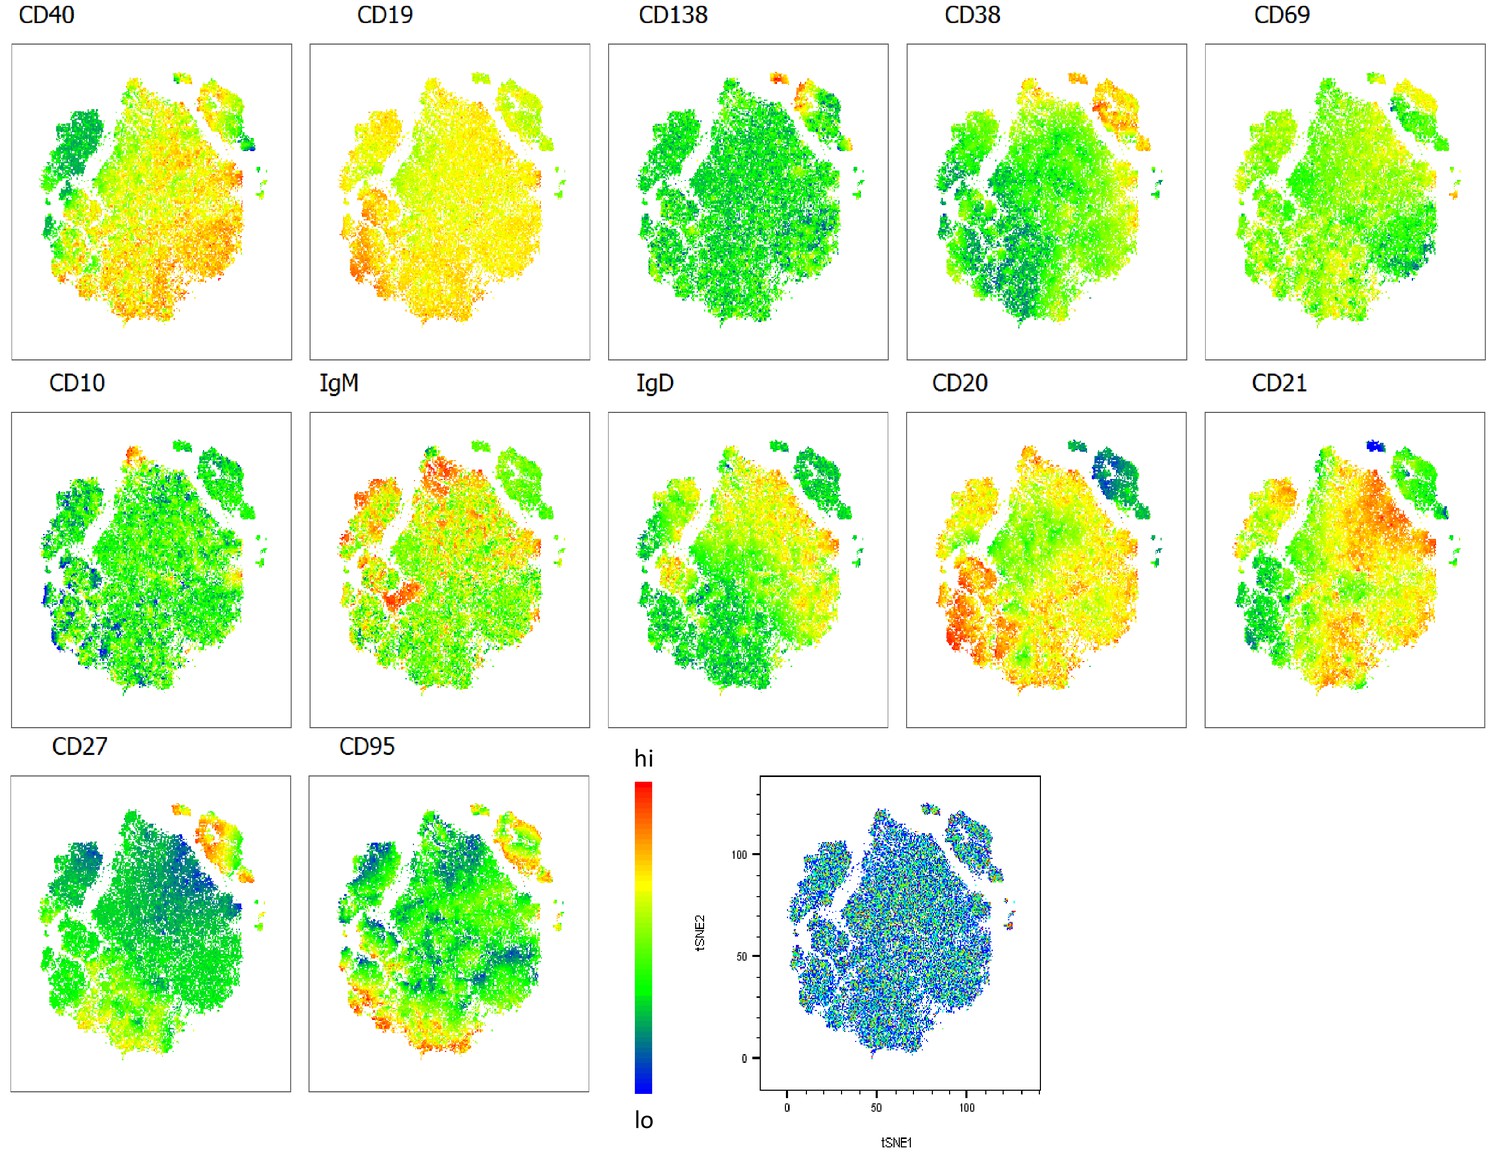
Heatmap overlays B cell compartment tSNE plots focusing on homing markers.
A total of 80,000 CD19+ B cells were used in an unbiased tSNE analysis of the B cell compartment with increasing disease severity ranked by ordinal scale 1–3 (OS1 to 3) and in healthy controls (Control). This means a total of 20,000 CD19+ B cells were contributed by each group. The B cell homing marker expression is represented as a heatmap with high (red) to low (blue) fluorescence intensity depicted.
Figure 2—figure supplement 2
Heatmap overlays B cell compartment tSNE plots focusing on maturation markers.
A total of 80,000 CD19+ B cells were used in an unbiased tSNE analysis of the B cell compartment with increasing disease severity ranked by ordinal scale 1–3 (OS1 to 3) and in healthy controls (Control). This means a total of 20,000 CD19+ B cells were contributed by each group. The B cell maturation marker expression is represented as a heatmap with high (red) to low (blue) fluorescence intensity depicted.
Figure 2—figure supplement 3
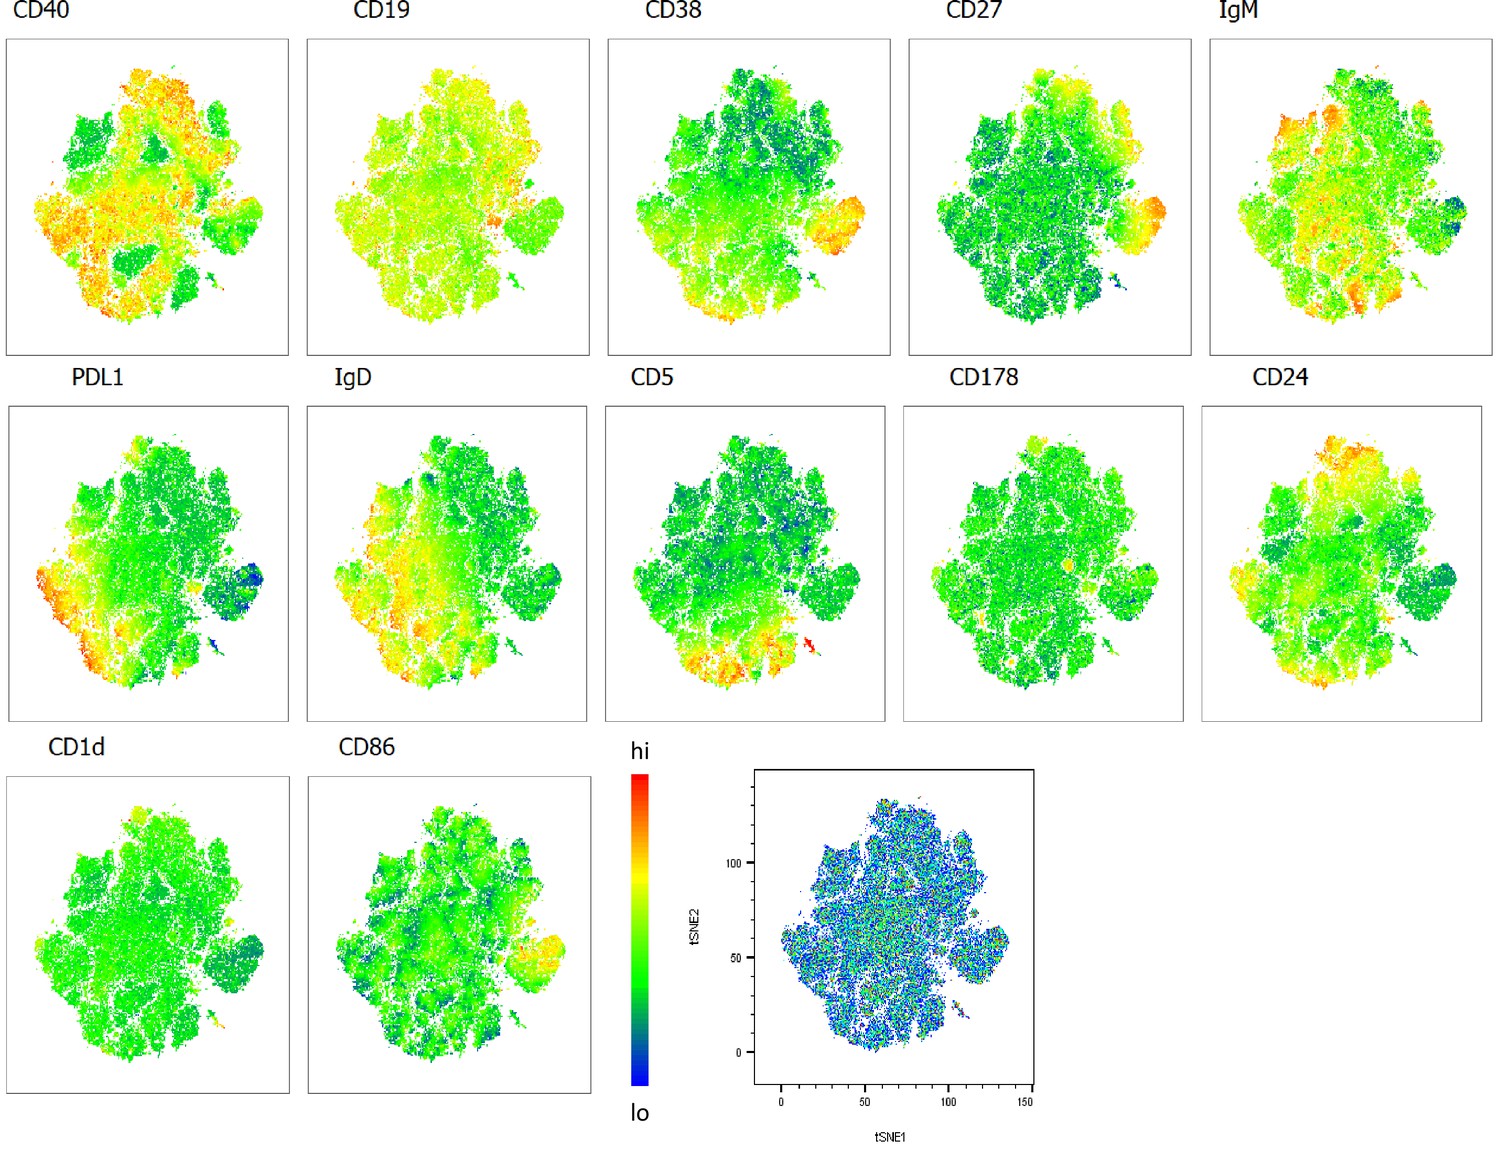
Heatmap overlays B cell compartment tSNE plots focusing on regulatory markers.
A total of 80,000 CD19+ B cells were used in an unbiased tSNE analysis of the B cell compartment with increasing disease severity ranked by ordinal scale 1–3 (OS1 to 3) and in healthy controls (Control). This means a total of 20,000 CD19+ B cells were contributed by each group. The B cell regulatory marker expression is represented as a heatmap with high (red) to low (blue) fluorescence intensity depicted.
Figure 3 with 1 supplement

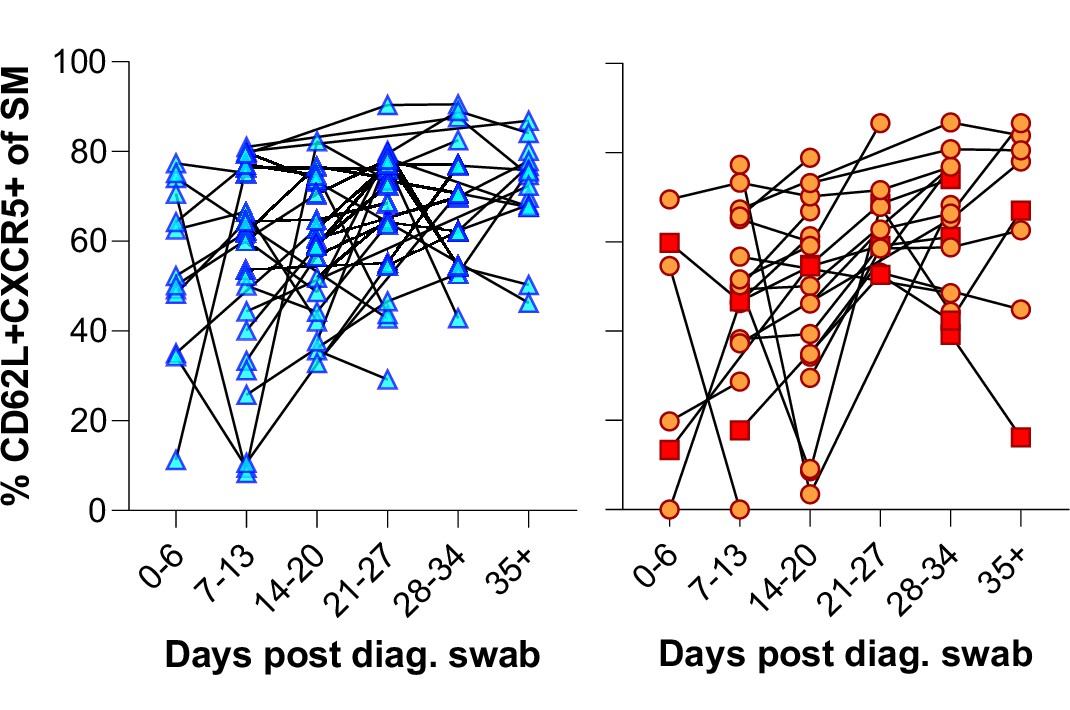
Reduced germinal centre homing and class switching of memory B cells in HIV viremic COVID-19 patients.
(A) Gating strategy for total switched memory (SM; CD27+ IgD-) and homing to germinal centres (CD62L+ CXCR5+) and comparison of SM with respect to HIV status. (B) Germinal centre homing capacity relative to HIV status and longitudinal comparison. Error bars indicate standard deviation (HIV- n = 37; HIV+ n = 33). (C) The SM was further gated on IgM and IgD to identify IgM+ memory and class switched (IgM-IgD-) B cells. Both responses were compared with respect to HIV status. Statistical analyses were performed using the Kruskal-Wallis H test for multiple comparisons. p Values are denoted by *≤0.05; **<0.01; ***<0.001, and ****<0.0001.
Figure 3—figure supplement 1
Individual patient longitudinal switched memory germinal centre (GC) homing responses.
Figure 4 with 2 supplements
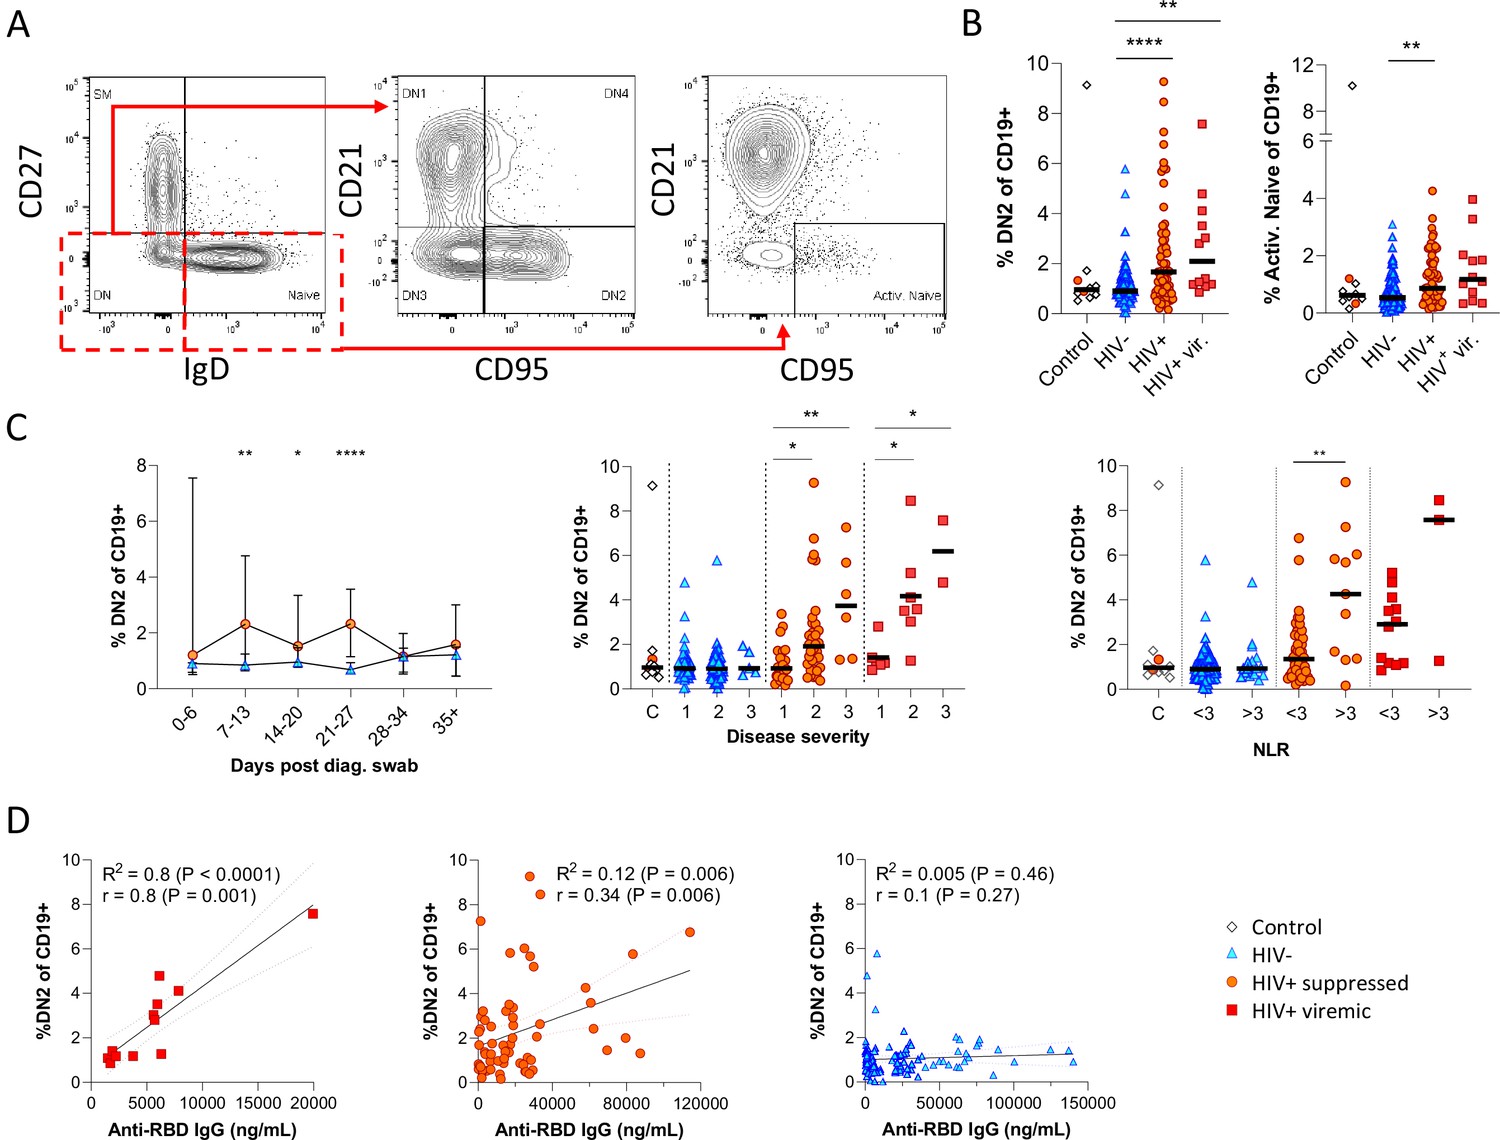
Pronounced extrafollicular B cell activation in people living with HIV (PLWH).
(A) Naïve (CD27- IgD+) and double negative (DN; CD27- IgD-) B cell activation was measured as a CD21- CD95+ phenotype. The respective activated populations are thus DN2 and activated naïve. (B) Prevalence of the DN2 and activated naïve phenotypes with respect to HIV status. (C) The DN2 frequencies were tracked longitudinally and with respect to disease severity (ordinal scale 1–3) and neutrophil-lymphocyte ratio (NLR), respectively. Error bars indicate standard deviation (HIV- n = 37; HIV+ n = 33). (D) Spearman non-parametric correlation of the DN2 B cell response relative to the anti-receptor binding domain (RBD) antibody titre. Statistical analyses were performed using the Kruskal-Wallis H test for multiple comparisons and Mann-Whitney for disease severity or NLR comparisons within groups. p Values are denoted by *≤0.05; **<0.01; ***<0.001, and ****<0.0001.
Figure 4—figure supplement 1
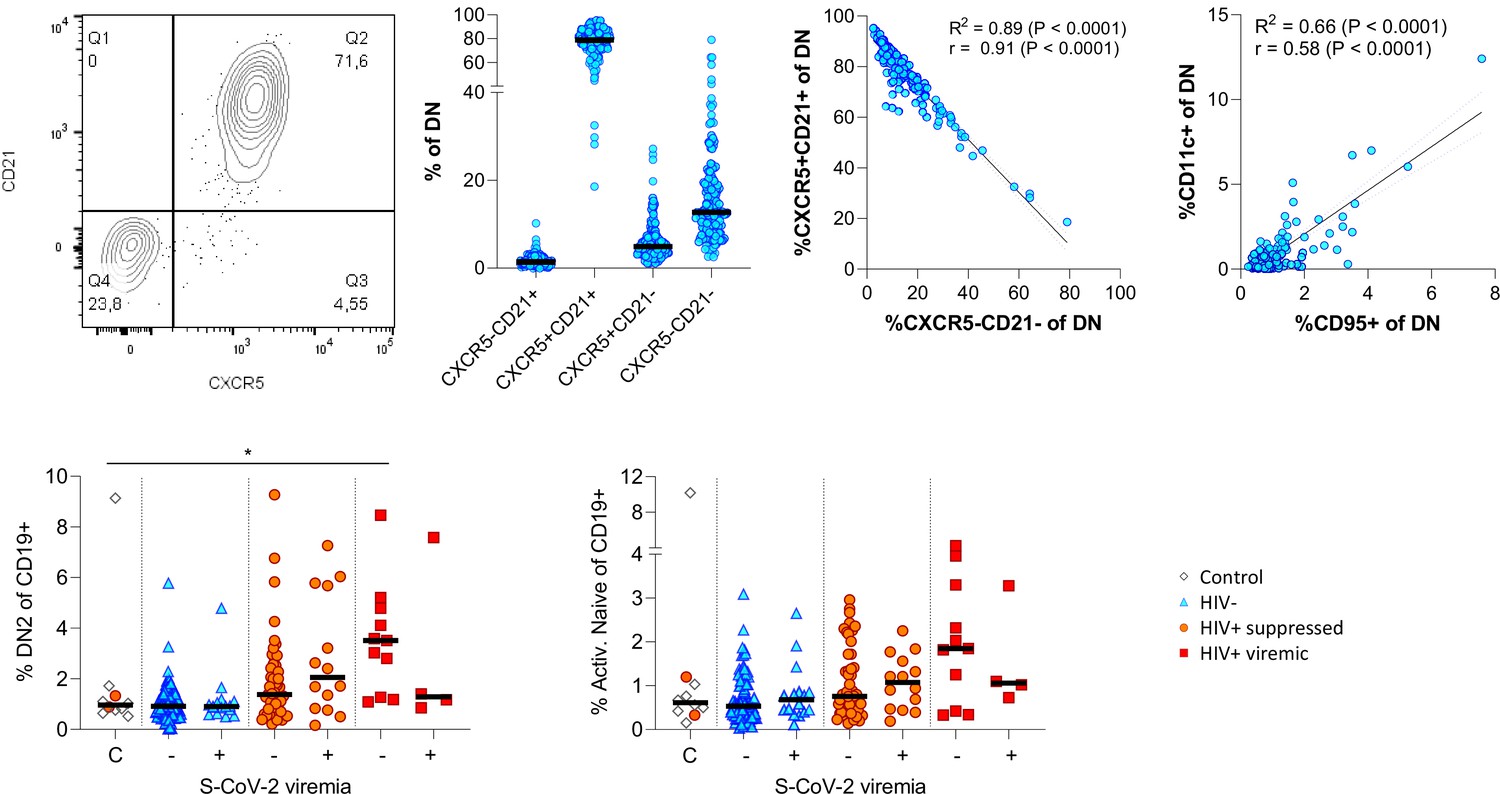
Extended phenotyping of double negative (DN) B cells.
Gating DN B cells for CD21 vs. CXCR5 revealed two dominant populations being either double positive or negative for both markers (A). CD11c and CD95 surface expression on DN B cells correlated positively (B). The frequency of DN2 and active naïve B cells were related to SARS-CoV-2 viral load (C).
Figure 4—figure supplement 2

Individual patient longitudinal DN2 and activated naïve B cell responses and detailed analysis of the activated naïve B cell response.
Individual longitudinal DN2 (A (i)) and activated naïve (A (ii)) B cell responses. (B) The activated naïve B cell frequencies were tracked longitudinally and with respect to disease severity (ordinal scale 1–3) and neutrophil-lymphocyte ratio (NLR), respectively. Error bars indicate standard deviation (HIV- n = 37; HIV+ n = 33). (C) Spearman non-parametric correlation of the activated naïve B cell response relative to the anti-receptor binding domain (RBD) antibody titre. Statistical analyses were performed using the Kruskal-Wallis H test for multiple comparisons and Mann-Whitney for disease severity or NLR comparisons within groups. p Values are denoted by *≤0.05; **<0.01; ***<0.001, and ****<0.0001.
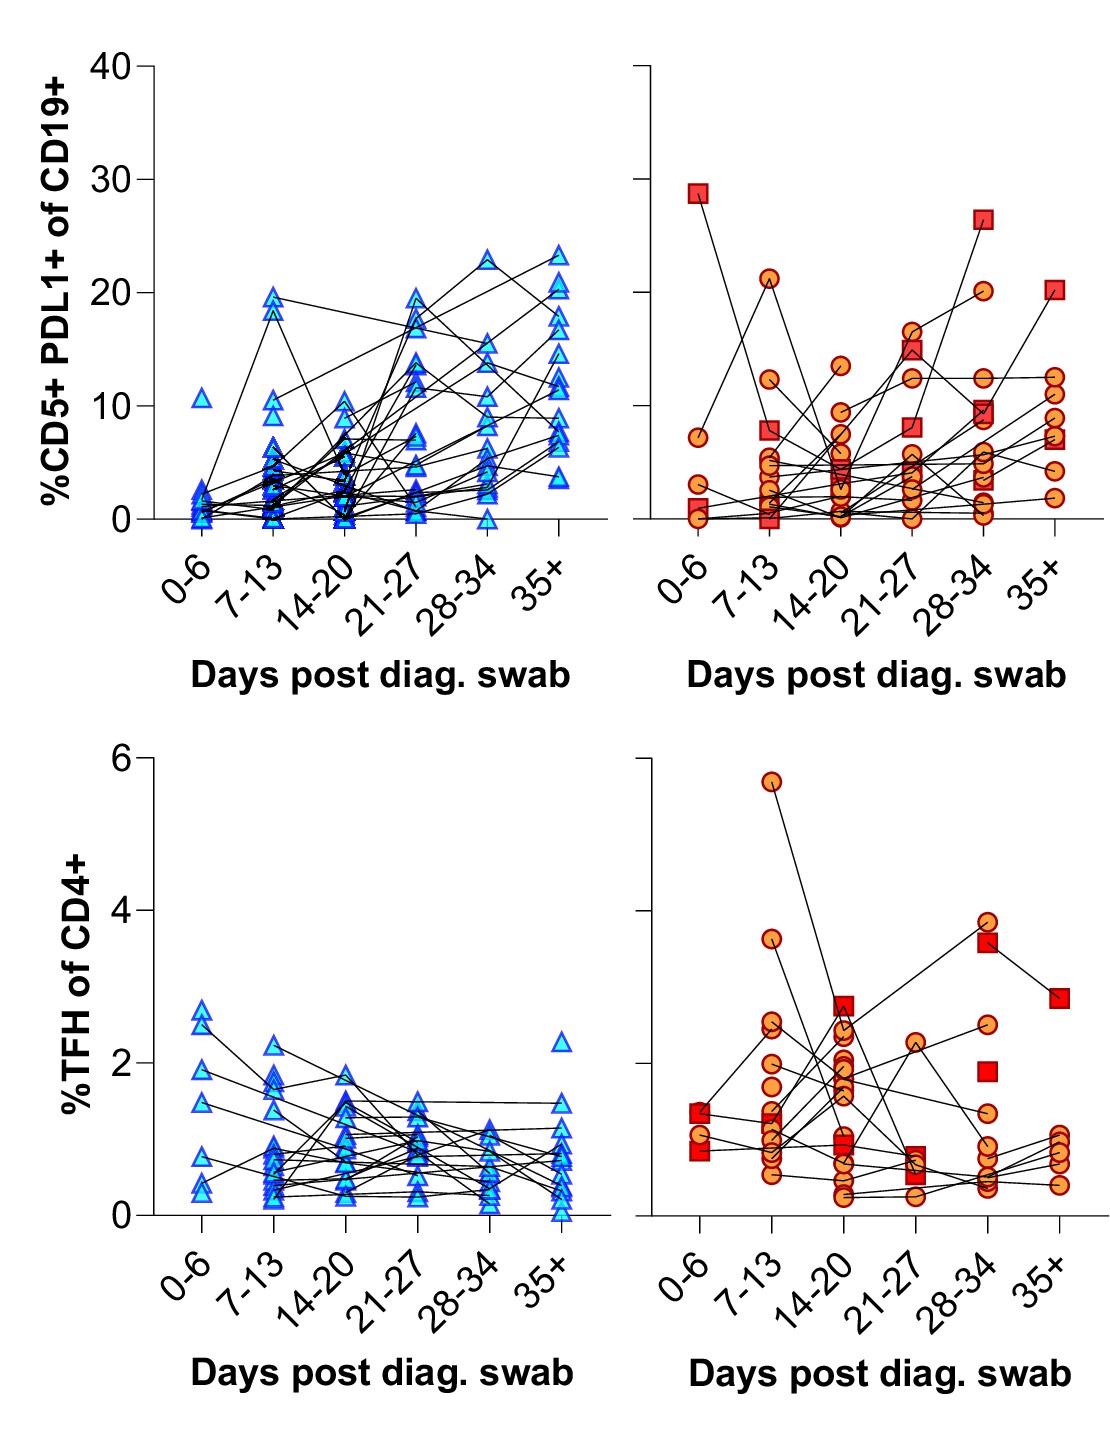
Figure 5 with 1 supplement
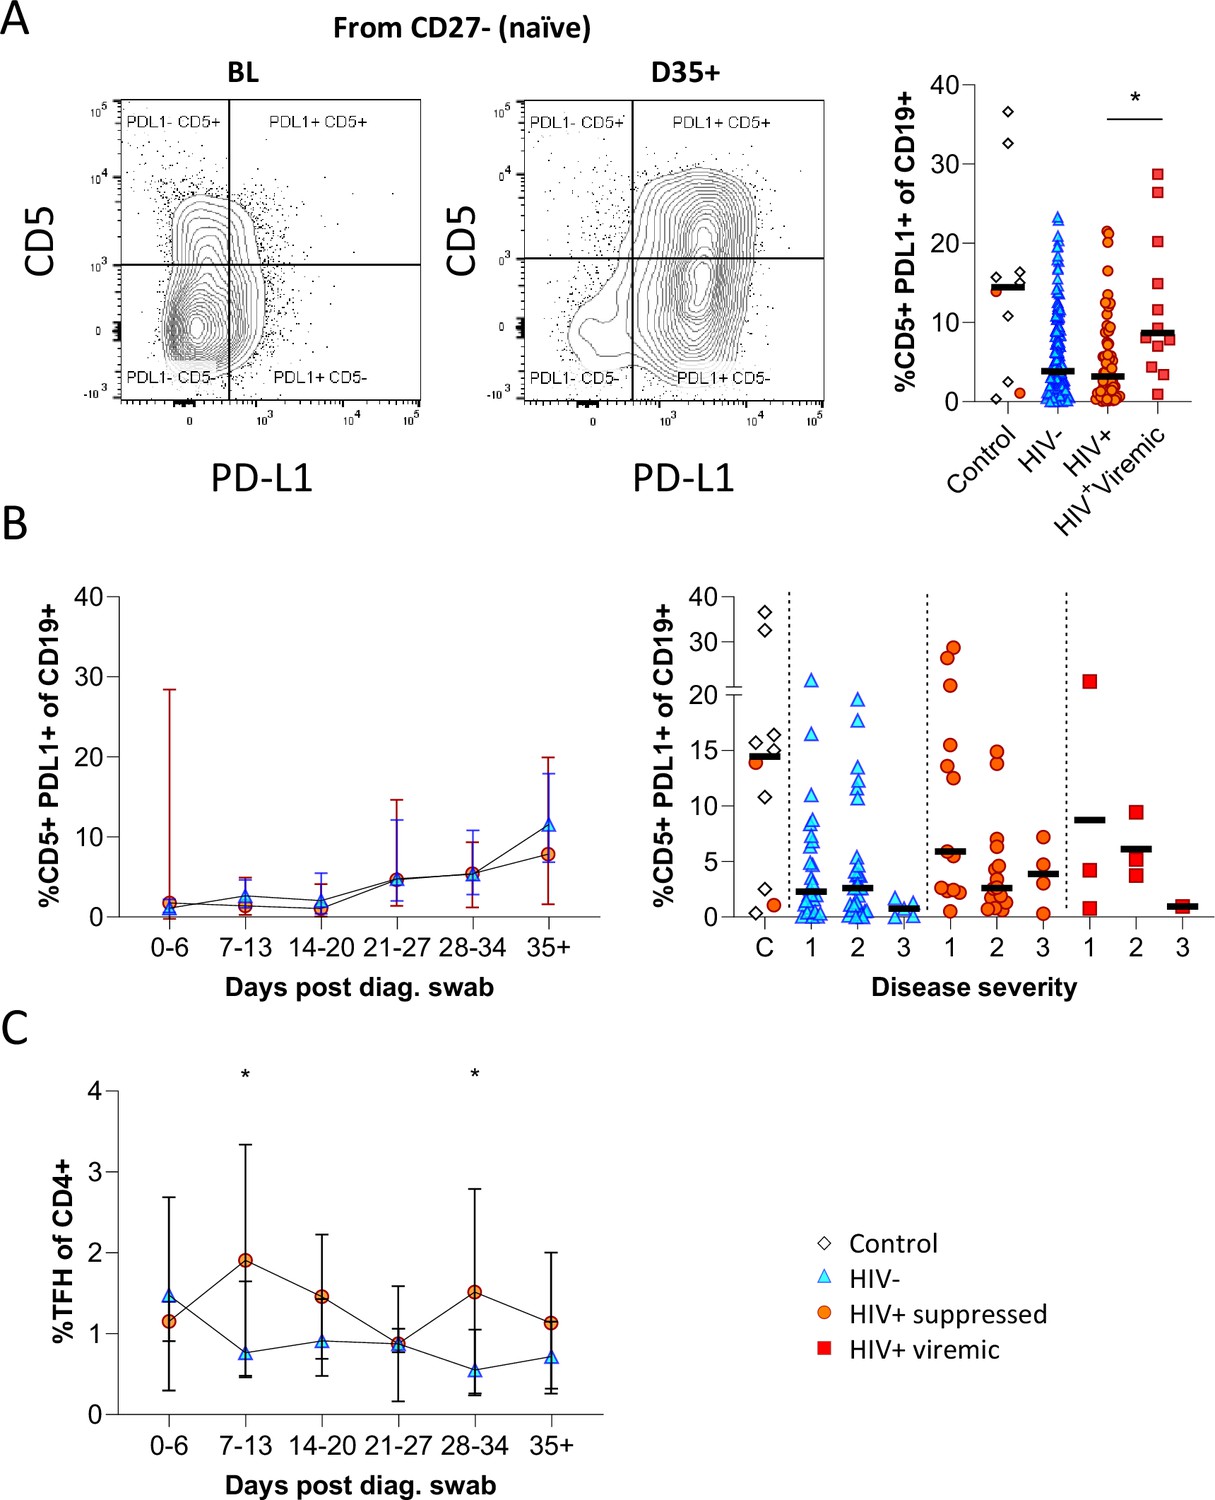
CD5+ PD-L1+ regulatory B cells contract during early response to infection.
(A) Baseline (BL) and day 35 (D35+) example plots of a patient’s CD5+ PD-L1+ regulatory B cell response. These cells were gated from the total naïve (CD27-) B cell population and their frequencies compared relative to HIV status. (B) This response was tracked longitudinally and relative to disease severity (ordinal scale 1–3) and controls denoted as ‘C’. In (C) the corresponding CD4+ T follicular helper (Tfh) response was tracked longitudinally. Error bars indicate standard deviation (HIV- n = 37; HIV+ n = 33). Statistical analyses were performed using the Kruskal-Wallis H test for multiple comparisons and Mann-Whitney for disease severity. p Values are denoted by *≤0.05; **<0.01; ***<0.001, and ****<0.0001.
Figure 5—figure supplement 1
Individual patient longitudinal CD5+ PDL1+ B cell and T follicular helper (Tfh) responses.
Figure 6
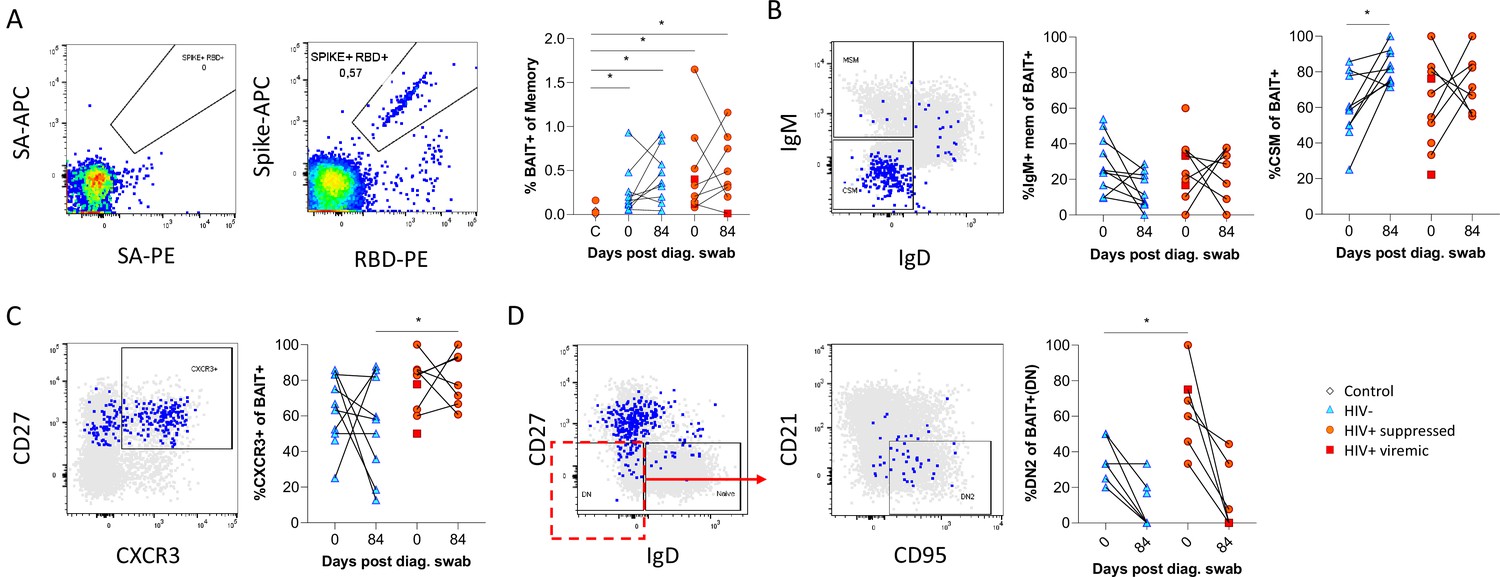
SARS-CoV-2 spike and receptor binding domain (RBD)-specific B cell responses highlight an upregulated extrafollicular response in people living with HIV (PLWH).
The ancestral D614G viral spike (Spike-APC) and receptor binding domain (RBD-PE) proteins were used as baits to detect SARS-CoV-2-specific B cells with SA-APC and SA-PE used as controls (A). The bait-specific B cells were then overlaid onto an IgM vs. IgD plot (B). The extent of IgM-only memory and class switched memory (CSM) B cells were compared at both baseline (day 0) and day 84 post diagnosis. (C) Similarly, the level of CXCR3 expression was assessed. (D) The extent of double negative (DN) B cell activation (CD21- CD95+) was compared regarding HIV status at both time points. Statistical analyses were performed using Wilcoxon and Mann-Whitney tests. p Values are denoted by *≤0.05; **<0.01; ***<0.001, and ****<0.0001.
Additional files
-
Supplementary file 1
Flow cytometry B cell phenotyping antibody panels.
- https://cdn.elifesciences.org/articles/79924/elife-79924-supp1-v2.docx
-
Supplementary file 2
Flow cytometry B cell BAIT antibody panel.
- https://cdn.elifesciences.org/articles/79924/elife-79924-supp2-v2.docx
-
MDAR checklist
- https://cdn.elifesciences.org/articles/79924/elife-79924-mdarchecklist1-v2.docx
-
Source data 1
- https://cdn.elifesciences.org/articles/79924/elife-79924-data1-v2.xlsx
-
Reporting standard 1
STROBE observational study checklist.
- https://cdn.elifesciences.org/articles/79924/elife-79924-repstand1-v2.pdf
Download links
A two-part list of links to download the article, or parts of the article, in various formats.
Downloads (link to download the article as PDF)
Open citations (links to open the citations from this article in various online reference manager services)
Cite this article (links to download the citations from this article in formats compatible with various reference manager tools)
HIV skews the SARS-CoV-2 B cell response towards an extrafollicular maturation pathway
eLife 11:e79924.
https://doi.org/10.7554/eLife.79924


