Non-rapid eye movement sleep determines resilience to social stress
- Neuroscience Institute, Morehouse School of Medicine, United States
- Behavioral Biology Branch, Center for Military Psychiatry and Neuroscience, Walter Reed Army Institute of Research, United States
- Department of Integrative Biology and Physiology, University of California, Los Angeles, United States
Figures
Figure 1 with 1 supplement
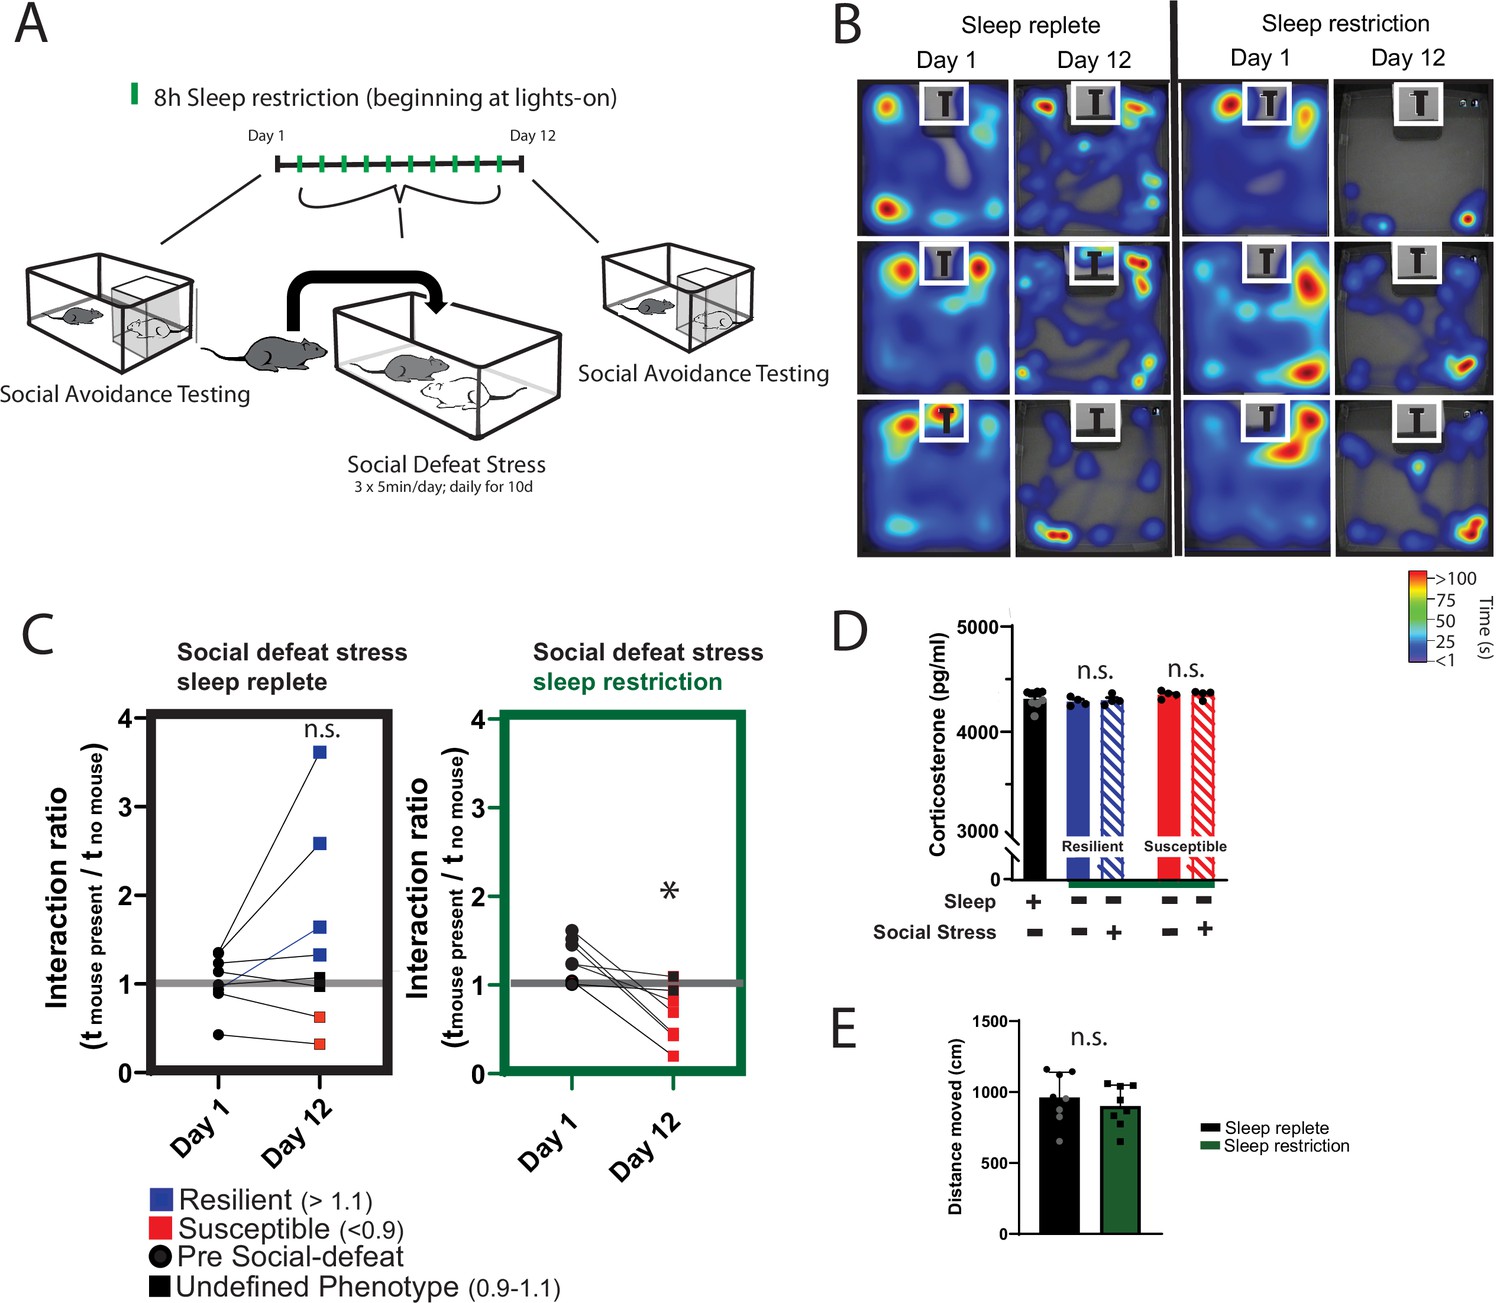
Daily sleep-restriction prevents resilience to social-defeat stress.
One cohort of mice received sleep restriction (8 hr, beginning at light onset) on each day of social-defeat stress; a second cohort (sleep replete) received only social-defeat stress (A; 10 days total, sleep restriction procedure outlined in Methods). As expected in the sleep replete cohort, roughly equal amounts of resilience and susceptibility occurred after social-defeat stress (B, C). In contrast, no mouse that underwent sleep restriction was resilient to social-defeat stress (B, C). Neither the stress response (D; indicated by fecal corticosterone) nor the distance moved during behavioral testing (E) was significantly altered by sleep deprivation. (B) Heatmaps showing the time and location of representative mice during 3-min social-avoidance test both before and after 10 days of social-defeat stress. (C) Interaction ratios calculated from the heatmaps in B; black circles—pre-stress, red box—susceptible, blue box—resilient, black box—undefined; social avoidance was expressed as an interaction ratio based on the time (t) spent interacting (near white box) with a caged, novel CD1 target mouse vs. an empty cage (interaction ratio = te / tf); sleep replete—Student’s paired t, t(7)=1.54, p=0.17; sleep restriction—Student’s paired t, t(6)=4.02, p=0.007; sleep replete—n=8, sleep restriction—n=7. (D) ANOVA, F(4,19)=1.12, p=0.37; n=8. (E) Student’s t, t(14)=0.74, p=0.47. Data points represent mean ± SEM.
Figure 1—figure supplement 1
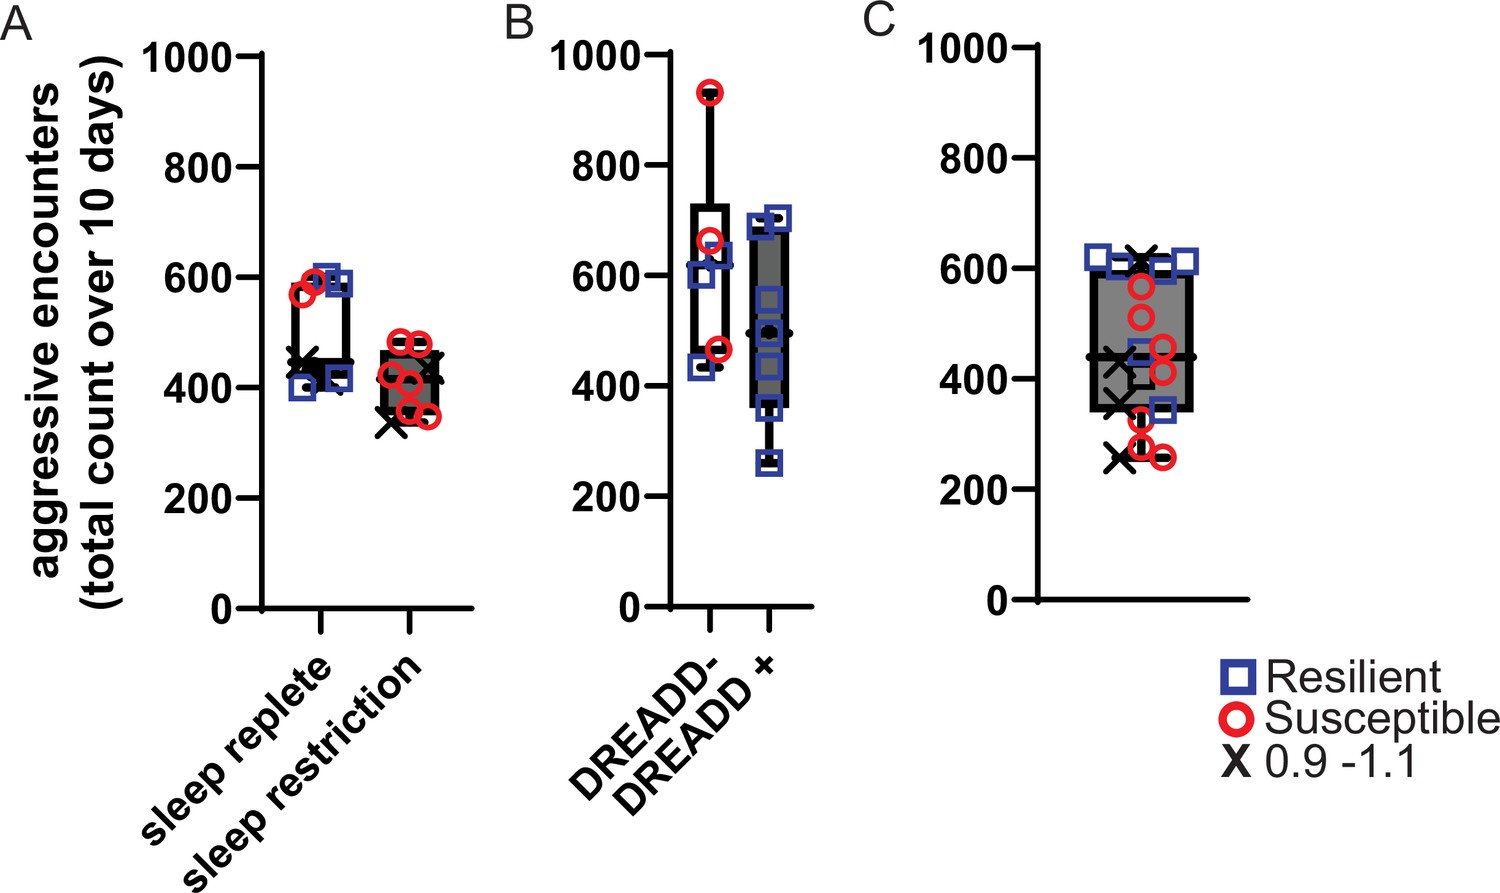
Aggressive encounters during 10 – days of social-defeat stress.
The number of aggressive approaches was counted during each 5-min exposure to social-defeat stress and totaled for the entire 10-day period. Box and whiskers plots represent the median number of aggressive encounters, 25th to 75th percentiles and min/max values for cohorts of mice in Figures 1, 2 and 4. (A) Sleep replete and sleep restriction cohorts from Figure 1. (B) DREADD +and DREADD- cohorts from Figure 2. (C) All mice from Figure 4.
Figure 2 with 1 supplement
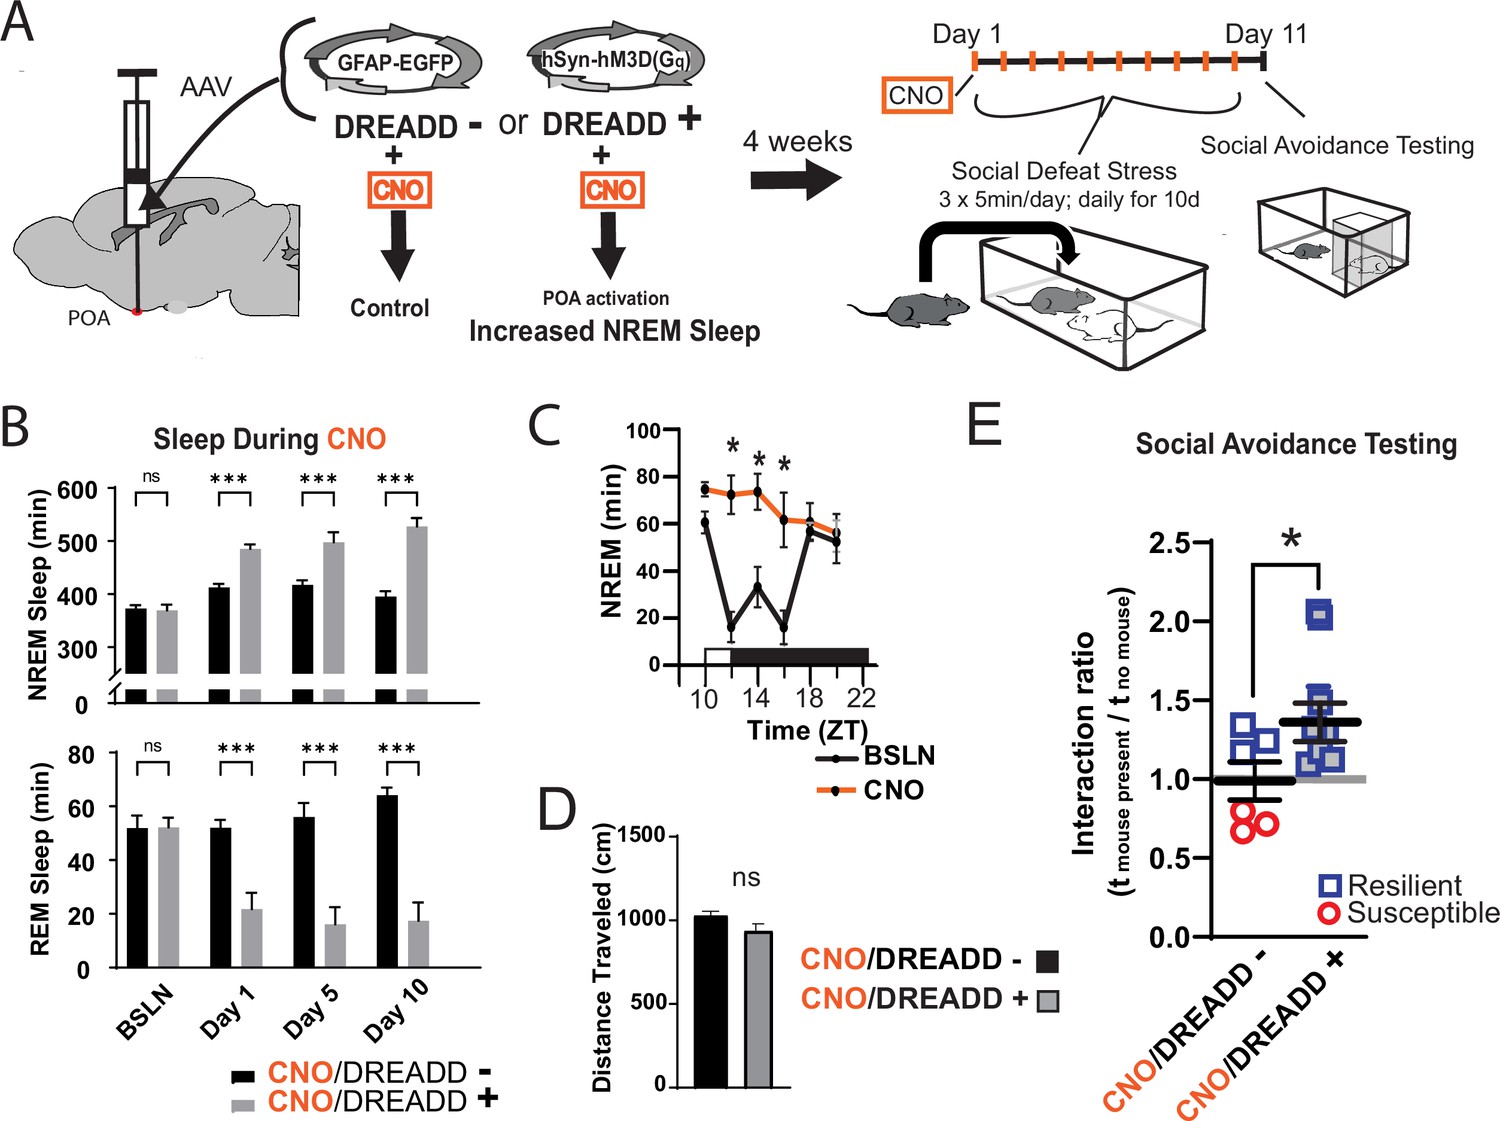
Increased sleep promotes resilience to social-defeat stress.
Adeno-associated viral vectors (AAV2) encoding either an excitatory (Gq) designer receptor exclusively activated by designer drugs (DREADD), or enhanced green fluorescent protein (EGFP) as a control, were delivered to the preoptic area (POA) by intracranial microinjections. After four weeks, i.p. injections of clozapine N-oxide (CNO) were used to activate receptors expressed in the POA (A). In a validation study, chemogenetic activation of the POA significantly increased NREM sleep for six hours (compared to undisturbed sleep on the previous day) following a single injection of the agonist CNO at zeitgeber time 10 (C; ZT 10, ZT12=lights off). A separate cohort of mice expressing DREADD, or EGFP control, was exposed to 10 days of social-defeat stress (ZT12–13) with single, daily, i.p. injection of CNO at lights on (ZT 1–2; A). NREM sleep was significantly increased by daily injections of CNO in mice expressing the excitatory DREADD, but not in mice expressing the control DREADD (B). No mouse expressing the excitatory DREADD was susceptible to the effects of social-defeat stress (E). Mice expressing the control construct displayed both susceptible and resilient behavior as expected (E). The distance moved during behavioral testing was not significantly affected by POA activation (D). (B) Repeated measures ANOVA: NREM main effect of CNO—F(1, 35)=83.37, p<0.0001; interaction effect—F(3, 35)=13.43, p<0.0001; REM main effect of CNO—F(1, 29)=72.92, p<0.0001; interaction effect—F(3, 29)=10.5, p<0.0001; *, p≤0.001, Holms Sidak’s multiple comparison; n=6, DREADD-; n=9 DREADD +. (C) Repeated measures ANOVA: main effect of CNO—F(1, 8)=12.82, p=0.008; interaction effect—F(5, 40)=8.04, p<0.0001; *, p≤0.001, Holms Sidak’s multiple comparison. (D) Student’s t, t(11)=1.82, p=0.087. (E) Student’s t, t(11)=2.157, p=0.027. Data points represent mean ± SEM; *=p 0.05.
Figure 2—figure supplement 1
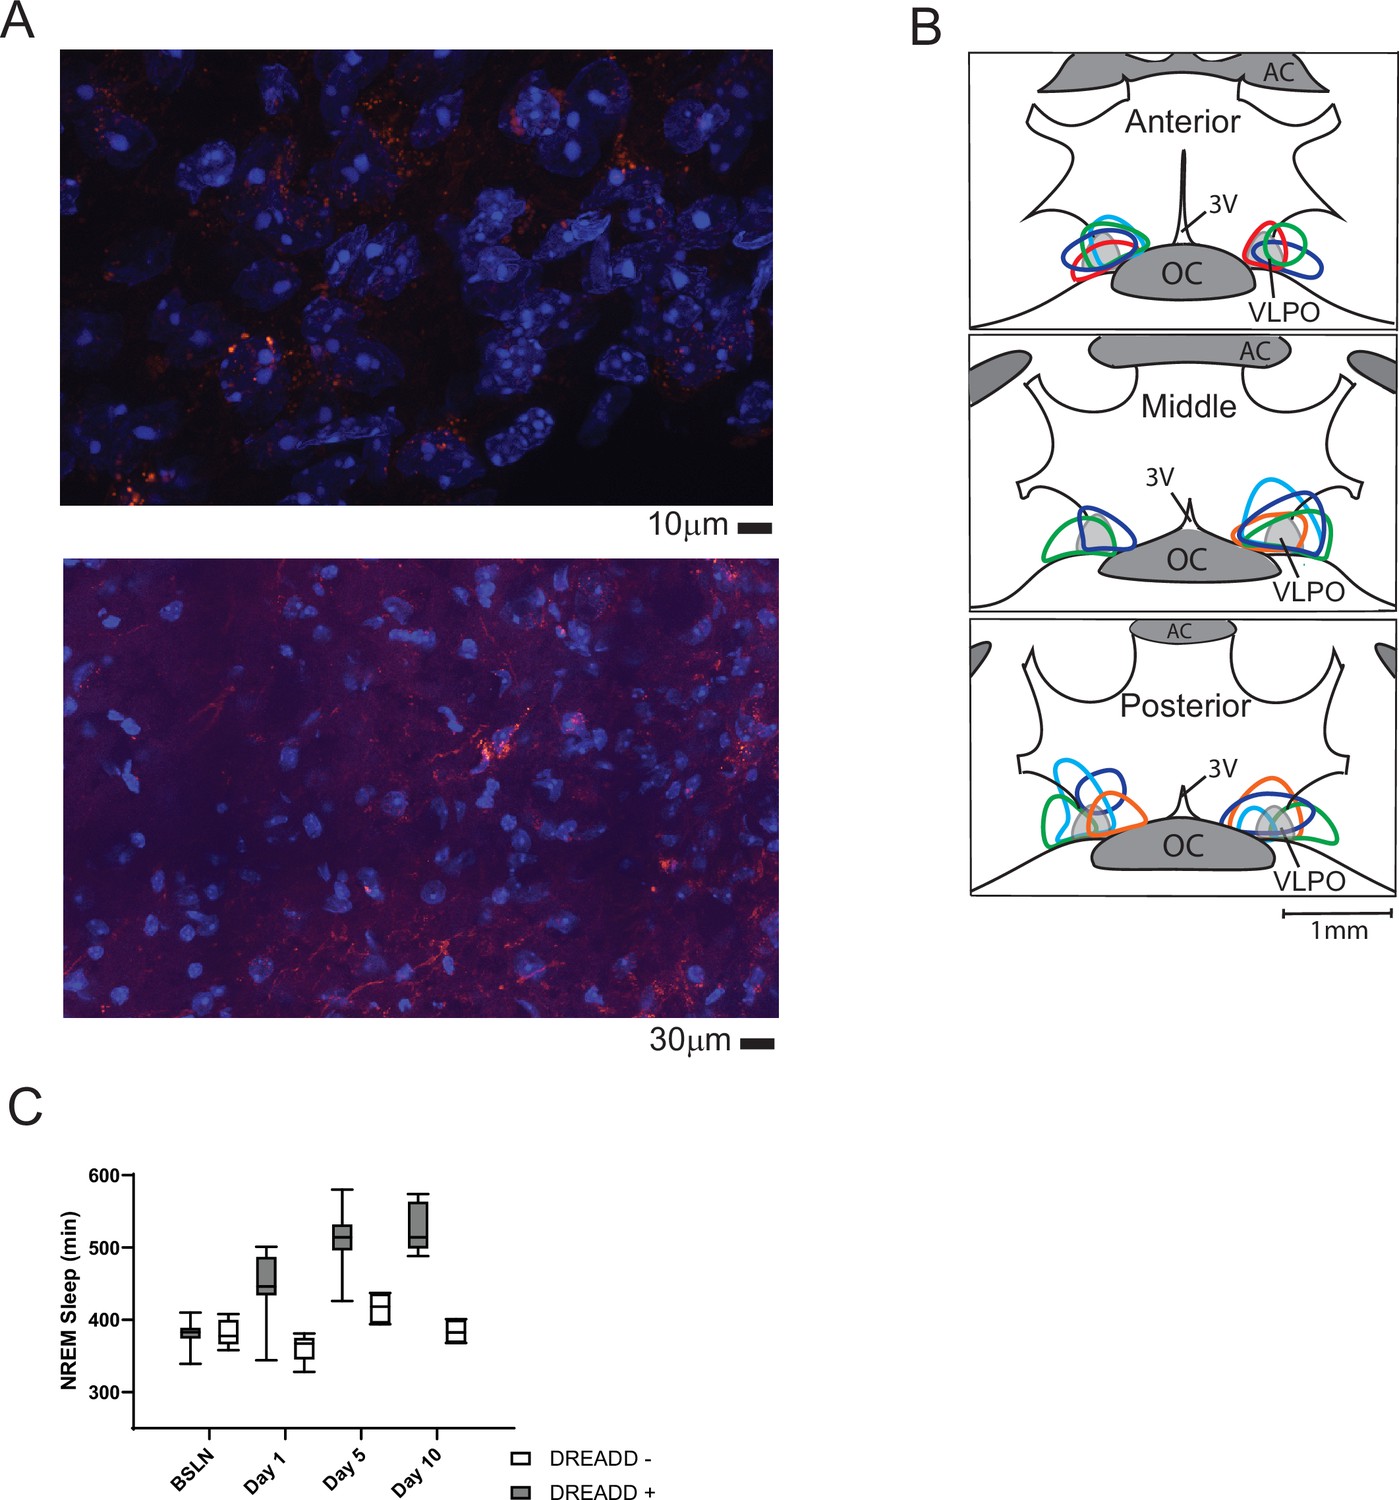
Histological verification of designer-receptor exclusively activated by designer-drugs (DREADD).
Verification of pAAV-hSyn-EGFP (control, not shown) or pAAV-hSyn-hM3D(Gq)-mCherry (excitatory DREADD) expression was performed in sections with nucleic-acid counter stain (DAPI). Representative photomicrographs are shown in A (red, mCherry; blue, DAPI). The outer boundary of labeled cell bodies for each mouse included in the study are illustrated in B. Locations are superimposed on representations of hypothalamic coronal sections (~150 µm spacing; OC, optic chiasm; 3 V, third ventricle; AC anterior commissure). Colors are to aid in differentiation and do not identify individual mice. All mice had both increased sleep over the 10 days (C) and labeling that overlapped a portion of the ventrolateral preoptic area (B, VLPO). (C) Box and whiskers replot of data in Figure 2B showing median, 25th to 75th percentiles and min/max values.
Figure 3 with 1 supplement
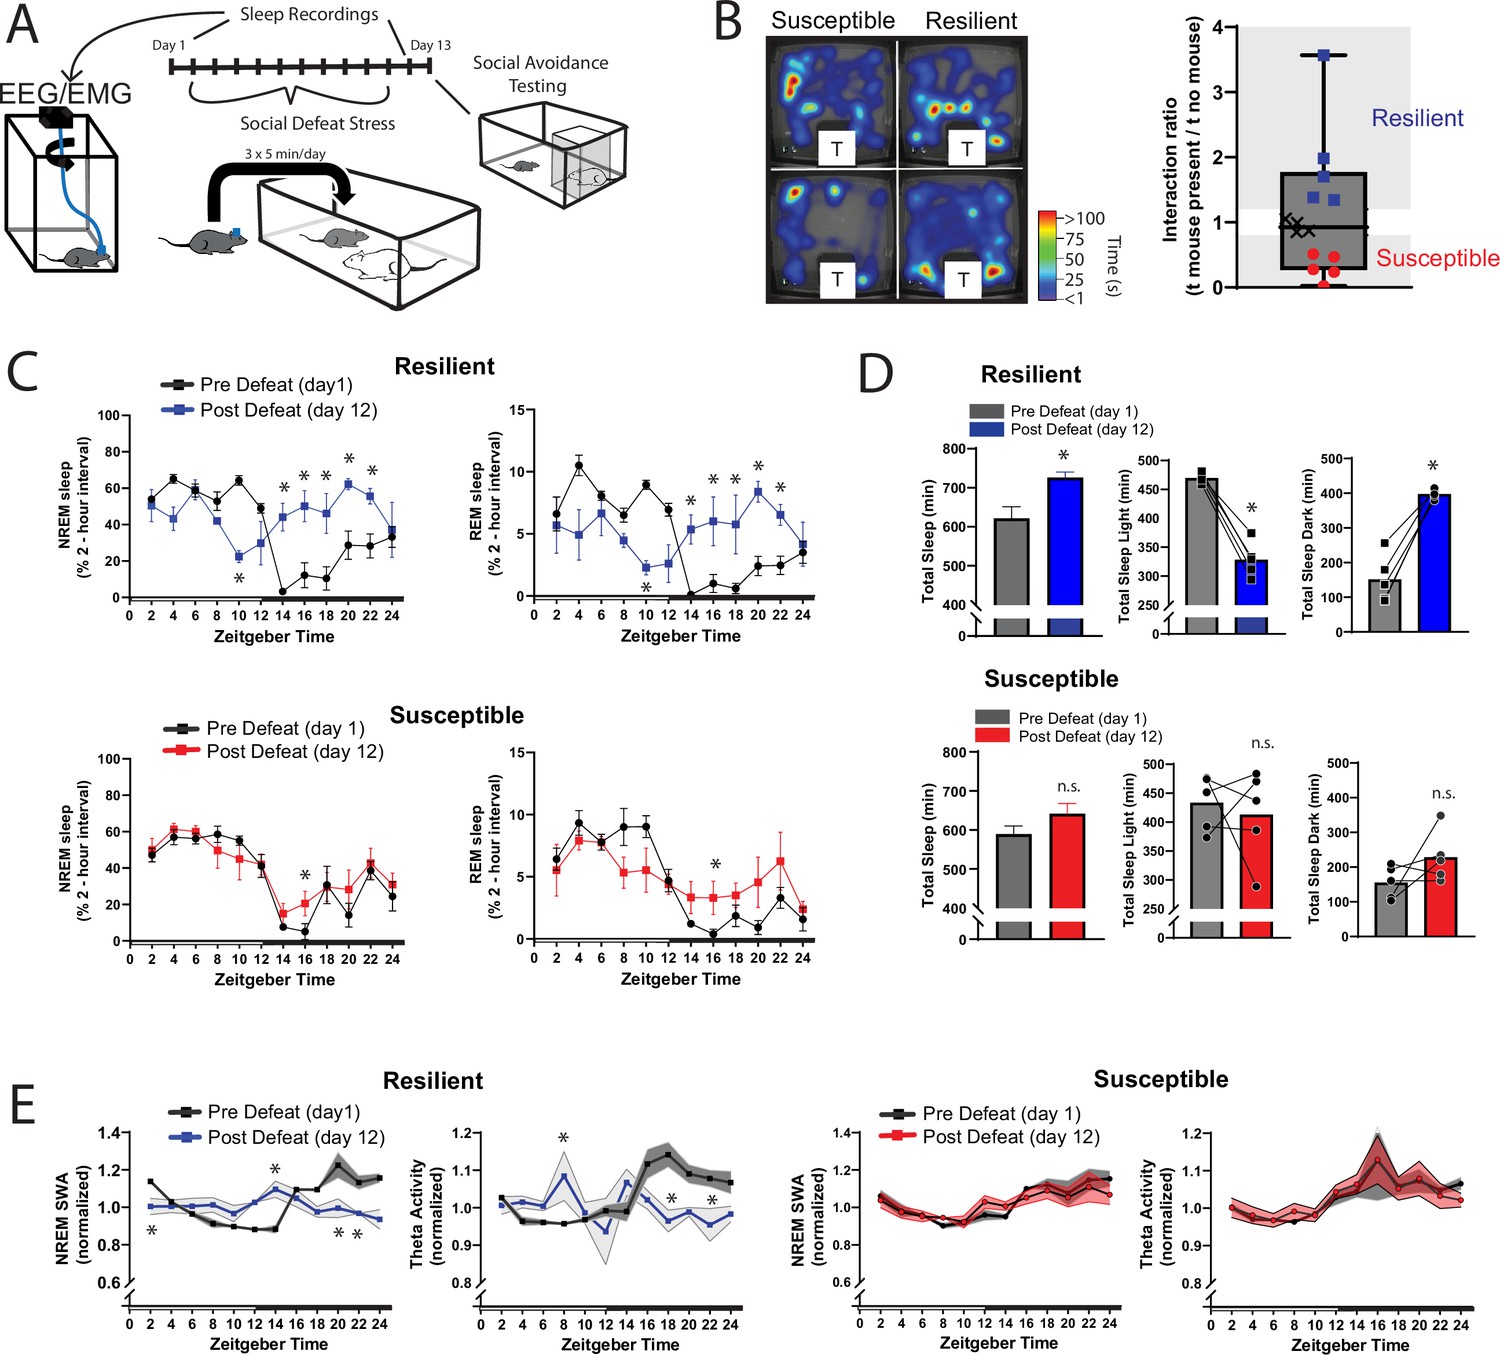
Sleep is reorganized only in mice resilient to social-defeat stress.
24 hr sleep recordings were performed both before and following 10 days of social-defeat stress (A). Sleep in animals identified as resilient (B) was significantly reorganized (C) and increased (D) following social-defeat stress. This change in resilient mice included a significant decrease in total sleep during the light period and increased total sleep during the dark period (D). Animals identified as susceptible (B) showed little change in sleep architecture or amount (C, D). Sleep changes in resilient animals included a flattening of the normal curve in sleep intensity (E; NREM slow-wave activity, SWA: power density 0.5–4 Hz). This change was accompanied by changes in higher frequencies during NREM sleep; theta activity was increased during the day and decreased during the night (E). In contrast, no significant change in either NREM slow-wave or theta activity was observed in susceptible animals (E). (B) Left, representative heatmaps of social avoidance testing; warmer colors indicate increased time; T=caged mouse; right, interaction ratios, X indicates interaction ratios between 0.9 and 1.1 that were excluded from sleep analysis. (C) Resilient, repeated measures ANOVA: NREM: main effect of time—F(11, 88)=4.86, p=0.0001; main effect of day—F(1, 8)=11.71, p=0.009; interaction—F(11,88)=8.02, p=0.0001. REM: main effect of time—F(11, 88)=3.17, p=0.0012; main effect of day—F(1, 8)=0.95, p=0.358; interaction—F(11,88)=6.7, p=0.0001. Susceptible, repeated measures ANOVA: NREM main effect of time—F(11, 88)=8.581, p<0.0001; main effect of day—F(1, 8)=2.925, p=0.1256; interaction—F(11, 88)=1.429, p=0.1742; n=12. (D) Resilient, Student’s paired t: total sleep—t(5)=5.09, p=0.007; light—t(5)=14.62, p=0.0001; dark—t(5)=8.15, p=0.0012. (E) Resilient, SWA: main effect of time—F(11, 84)=4.482, p<0.0001; main effect of susceptibility—F(1, 8)=2.84, p=0.14; interaction—F (11, 84)=6.47, p=0.0001. NREM theta activity: main effect of time—F(11, 89)=1.97, p=0.042; main effect of susceptibility—F(1, 89)=5.04, p=0.027; interaction—F (11, 89)=4.39, p<0.0001. susceptible: main effect of time—F(11, 84)=6.31, p<0.0001; main effect of susceptibility—F(1, 8)=0.64, p=0.45; interaction—F (11, 83)=1.31, p=0.23; *, p≤0.05, Holms Sidak’s multiple comparison. Data points represent mean ± SEM except for B which presents median, 25th to 75th percentiles and min/max values.
Figure 3—figure supplement 1

Sleep is not reorganized after exposure to a novel cage.
24 hr sleep recordings were performed both before and following 10-daily exposures to a novel cage (A). This was done to control for the novel environment experienced during social-defeat stress. Total sleep was slightly increased after 10 daily exposures to a novel cage (B); however, no significant differences were detected in the light period or dark period separately. (B) Total sleep—Student’s t, t(9) = 2.65, p=0.026; light—Student’s t, t(9) = 0.493, p=0.643; dark—Student’s t, t(9) = 1.86, p=0.1; n=10; bars represent mean ± SEM *, p≤0.05.
Figure 4 with 1 supplement

Differences in sleep regulation, prior to social-defeat stress exposure, predicts resilience to social-defeat stress.
Sleep regulation involves a homeostatic process, as NREM sleep amount and intensity (slow-wave activity, SWA) are proportional to the duration of prior wakefulness. A standard method for investigating this sleep-regulatory process is restricting sleep and then measuring the resulting changes in NREM amount and intensity. Here, we used a six-hour sleep restriction paradigm both before and after 10 days of social-defeat stress to investigate the sleep-regulatory differences between resilient and susceptible mice (A). Prior to social-defeat stress exposure, mice later identified as susceptible showed increased sleep-recovery to six-hours of sleep restriction (B; C, top row) when compared to mice identified as resilient (B; C, top row). This pattern was present for both NREM and REM sleep (C, top row). Susceptible and resilient mice lost similar amounts of NREM and REM sleep during sleep-restriction (C, bottom row) and the increased recovery response for susceptible mice persisted when NREM sleep recovered was normalized to the amount of sleep lost (C, bottom). After social-defeat stress, susceptible animals continued to show increased NREM-sleep recovery, but not REM-sleep recovery (D, top row). Sleep intensity (NREM slow-wave activity, SWA) was higher in susceptible animals prior to social-defeat stress during both baseline and following sleep restriction (E, G). This increased sleep intensity in susceptible mice persisted and was more prominent after social-defeat stress (F, H). (B) X indicates interaction ratios between 0.9 and 1.1 that were excluded from sleep analysis. (C) Total sleep: repeated measures ANOVA main effect of time (MET)—F(8, 80)=53.78, p<0.0001; main effect of susceptibility (MES)—F(1, 10)=2.05, p=0.18; interaction (IST)—F (8, 80)=5.14, p<0.0001. NREM sleep, MET—F(8, 80)=50.75, p<0.0001; MES—F(1, 10)=1.92, p=0.19; IST—F (8, 80)=4.77, p<0.0001. REM sleep, MET—F(8, 80)=36.88, p<0.0001; MES—F(1, 10)=2.73, p=0.13; IST—F (8, 80)=3.32, p<0.0025. Sleep lost, Student’s paired t, NREM—t(7)=0.99, p=0.36; REM—t(7)=0.92, p=0.37. % recovered: MET—F(8, 80)=41.45, p<0.0001; MES—F(1, 10)=1.58, p=0.24; IST—F (8, 80)=3.27, p=0.0029. (D) NREM sleep: MET—F(8, 56)=49.2, p<0.0001; MES—F(1, 7)=3.96, p=0.049; IST—F (8, 56)=1.86, p=0.23. REM sleep: MET—F(8, 56)=24.58, p<0.0001; MES—F(1, 7)=0.02, p=0.87; IST—F (8, 56)=0.48, p=0.86. (E) Baseline, parietal: MES—F(1, 95)=4.21, p=0.043. (F) Frontal baseline: IST—F(11, 75)=2.13, p=0.028; frontal sleep restriction, IST—F(8, 63)=2.13, p=0.028; parietal sleep restriction, IST—F(8, 63)=2.84, p=0.009. *=p ≤ 0.05, Holms Sidak’s multiple comparison; n=13. Data points represent mean ± SEM with the exception of panel B which presents median, 25th to 75th percentiles and min/max values.
Figure 4—figure supplement 1
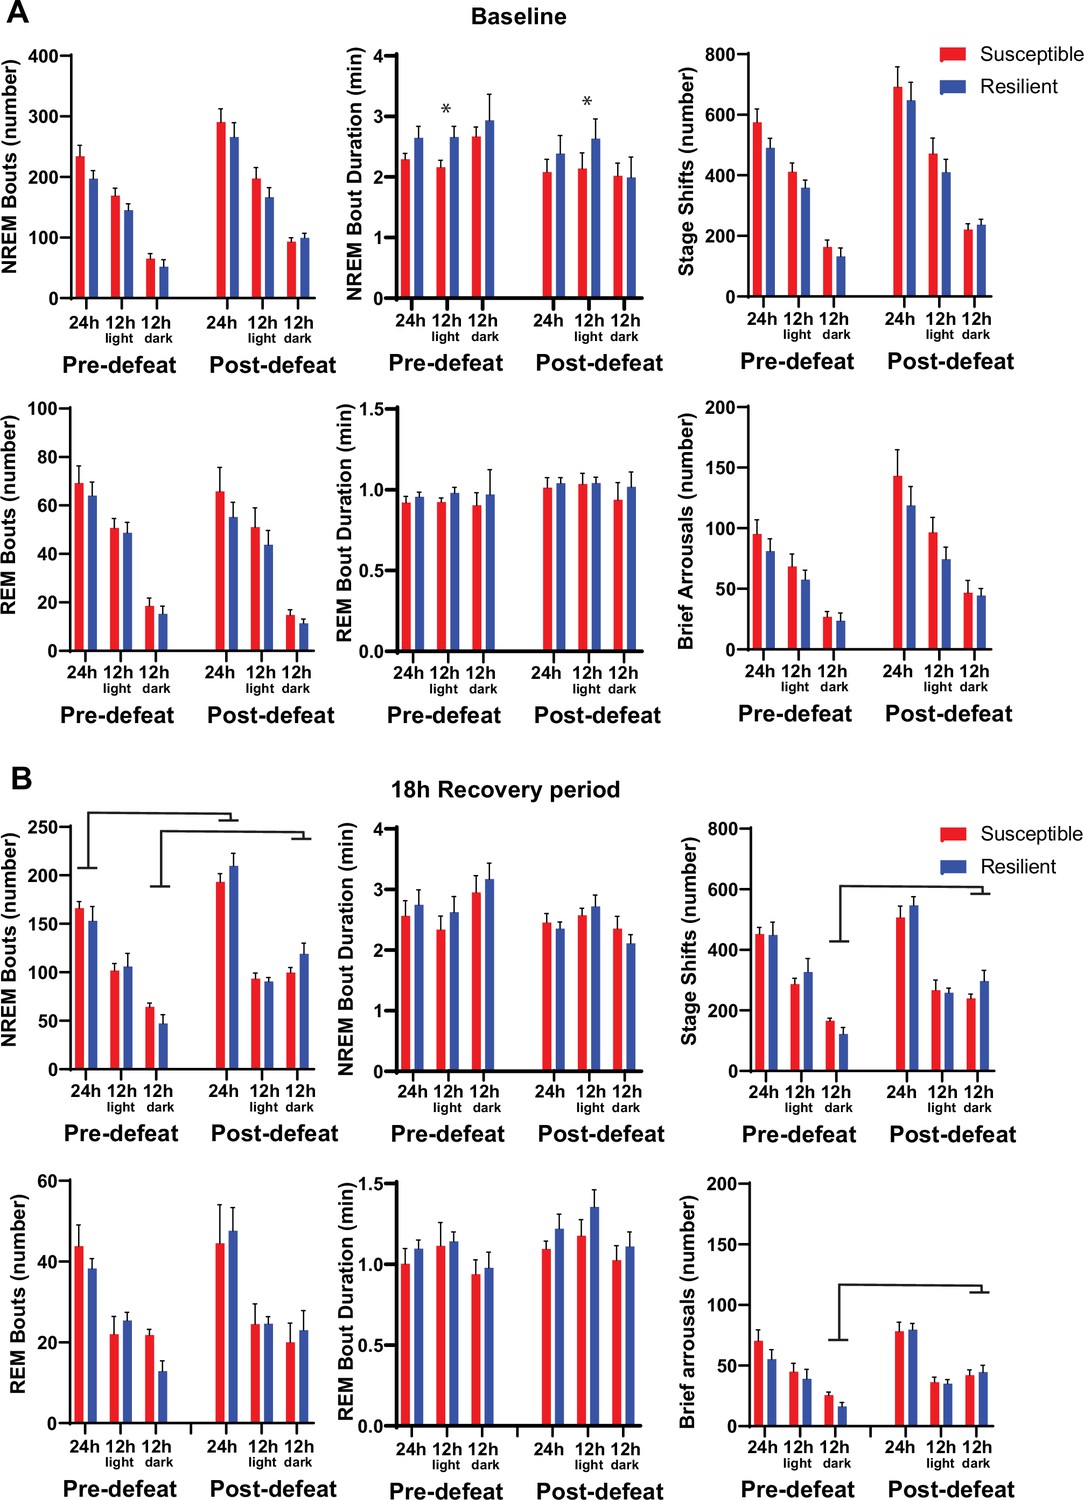
Sleep fragmentation before and after social-defeat stress.
Sleep fragmentation was assessed from 24 hr recordings during undisturbed sleep and with a six-hour sleep restriction. Recordings were performed both before and after 10 days of social-defeat stress (See Figure 4A for experimental paradigm). Comparing undisturbed, baseline, sleep recordings revealed slightly longer NREM-bout duration in resilient animals both before and after social-defeat stress, but only in the 12 hr light period (A, top row). No other differences between resilient and susceptible mice were found during baseline or following 6 hr of sleep restriction (A, B). An overall increase in NREM bout number, stage shifts and brief arousals occurred in both resilient and susceptible animals after social-defeat stress. These increases were found when comparing the responses to 6 hr of sleep restriction (B) and were primarily the result of increases during the dark period (B). (A) Pre social-defeat stress—t(10)=1.87, p=0.046; post social-defeat stress—t(10)=2.52, p=0.03; bars represent mean ± SEM; *, p≤0.05 Student’s t; n=13. (B) ANOVA main effect of stress, 24 hr: bout-number—F(1, 18)=39.99, p<0.0001; main effect of stress, darks: bout number—F(1, 17)=14.43, p=0.0047; stage shifts—F(1, 17)=32.65, p<0.0001; brief arousals—F(1, 7)=30.82, p<0.0001.
Figure 5 with 1 supplement
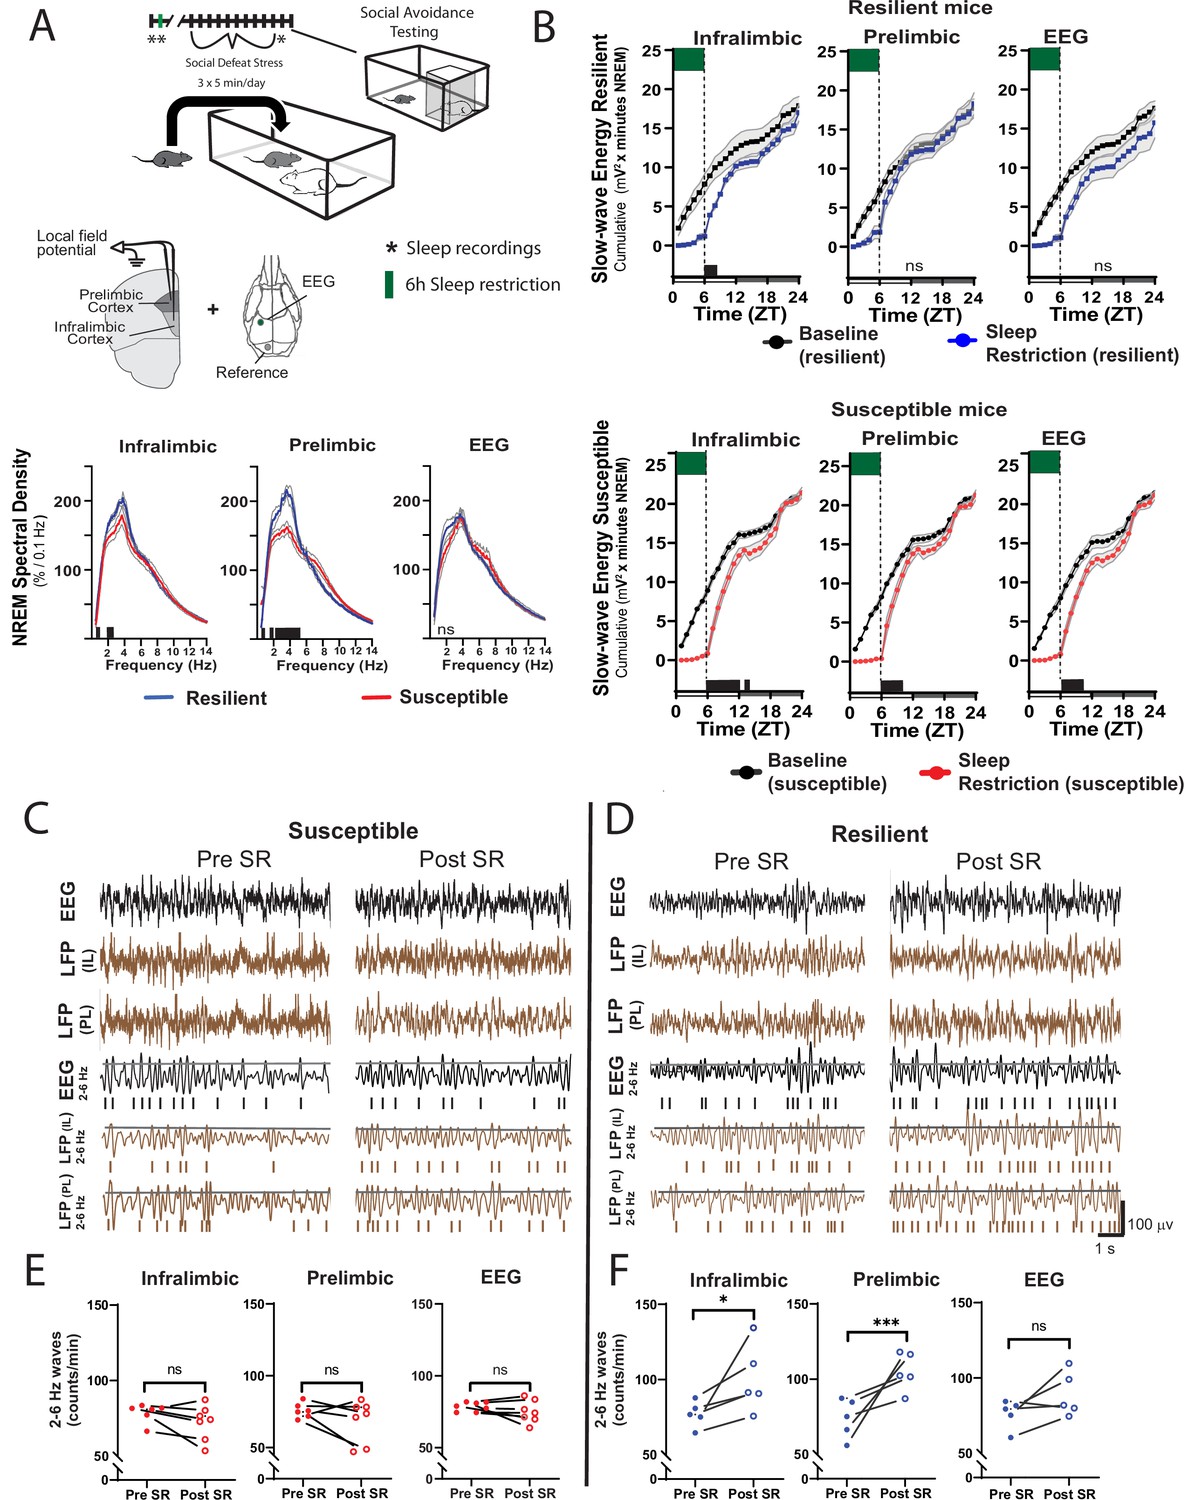
Sleep changes in the ventromedial prefrontal cortex (vmPFC) predict resilience to social-defeat stress.
Local field potential (LFP) in the vmPFC and epidural electroencephalographic recordings (EEG; A, top row; black bars on x-axis=p ≤ 0.05) were simultaneously obtained from mice before ten-days of social-defeat stress. Twenty-four hr LFP/EEG recordings were immediately followed by 6-hr sleep restriction as in Figure 4A. Sleep regulation involves a homeostatic process, as NREM sleep amount and intensity (slow-wave activity, SWA) are proportional to the duration of prior wakefulness. A standard method for investigating this sleep-regulatory process is restricting sleep and then measuring the resulting changes in NREM amount and intensity. Here, we used a 6-hr sleep restriction paradigm before (no post-defeat restriction) 10 days of social-defeat stress to investigate the sleep-regulatory differences between resilient and susceptible mice. NREM sleep intensity (power density >4 Hz) in both the prelimbic and infralimbic LFP were significantly higher in mice later identified as resilient (vs. susceptible mice; A, bottom row); notably, these differences in sleep intensity were not evident in the EEG (A, bottom row). After 6-hr of sleep restriction resilient animals recovered at a faster rate than susceptible animals. This recovery is observed in cumulative NREM slow-wave energy (delta band = 0.5–4 Hz; ) and resilient mice took significantly less time to reach baseline levels (B). The incidence of 2–6 Hz waves in the waking EEG, a marker of sleep-pressure during waking, significantly increased in sleep restricted mice identified as resilient (D). This occurred in both LFP and EEG recordings and indicates a normal accumulation in sleep-pressure. Mice later identified as susceptible (C) did not show this increased wave-incidence, thus, indicating a lack of sleep-pressure accumulation. (A) Shaded areas are SEM; green boxes indicate sleep restriction; ANOVA; prelimbic interaction—F (294, 2950)=4.55, p<0.0001; infralimbic main effect of susceptibility—F (294, 2950)=4.22, p<0.0001; EEG, interaction effect—F (144, 1450)=0.9175, p=0.74; Holms Sidak’s multiple comparison; n=12. (B) Shaded area on x-axis shows light–dark cycle. Repeated measures ANOVA interaction effect—susceptible mice: infralimbic LFP F(17, 187)=11.13, p<0.0001; prelimbic LFP F(17, 187)=5.71, p<0.0001; EEG F(17, 187)=6.75, p<0.0001; resilient mice: infralimbic LFP F(17, 136)=3.71, p<0.0001; black bars on x-axis=p < 0.05, Holms Sidak’s multiple comparison. (C, D) Top rows—representative, raw EEG (black) and LFP (brown) recordings; middle rows—filtered EEG (black) and LFP (brown) signals (2–6 Hz) with threshold for counting identified (70th percentile, black line, see Materials and methods for details). (E, F) Lower plots—average wave-incidence for the 1 hr period immediately before and immediately after sleep restriction; Student’s paired t, *, p=0.03; ***, p=0.0008.
Figure 5—figure supplement 1
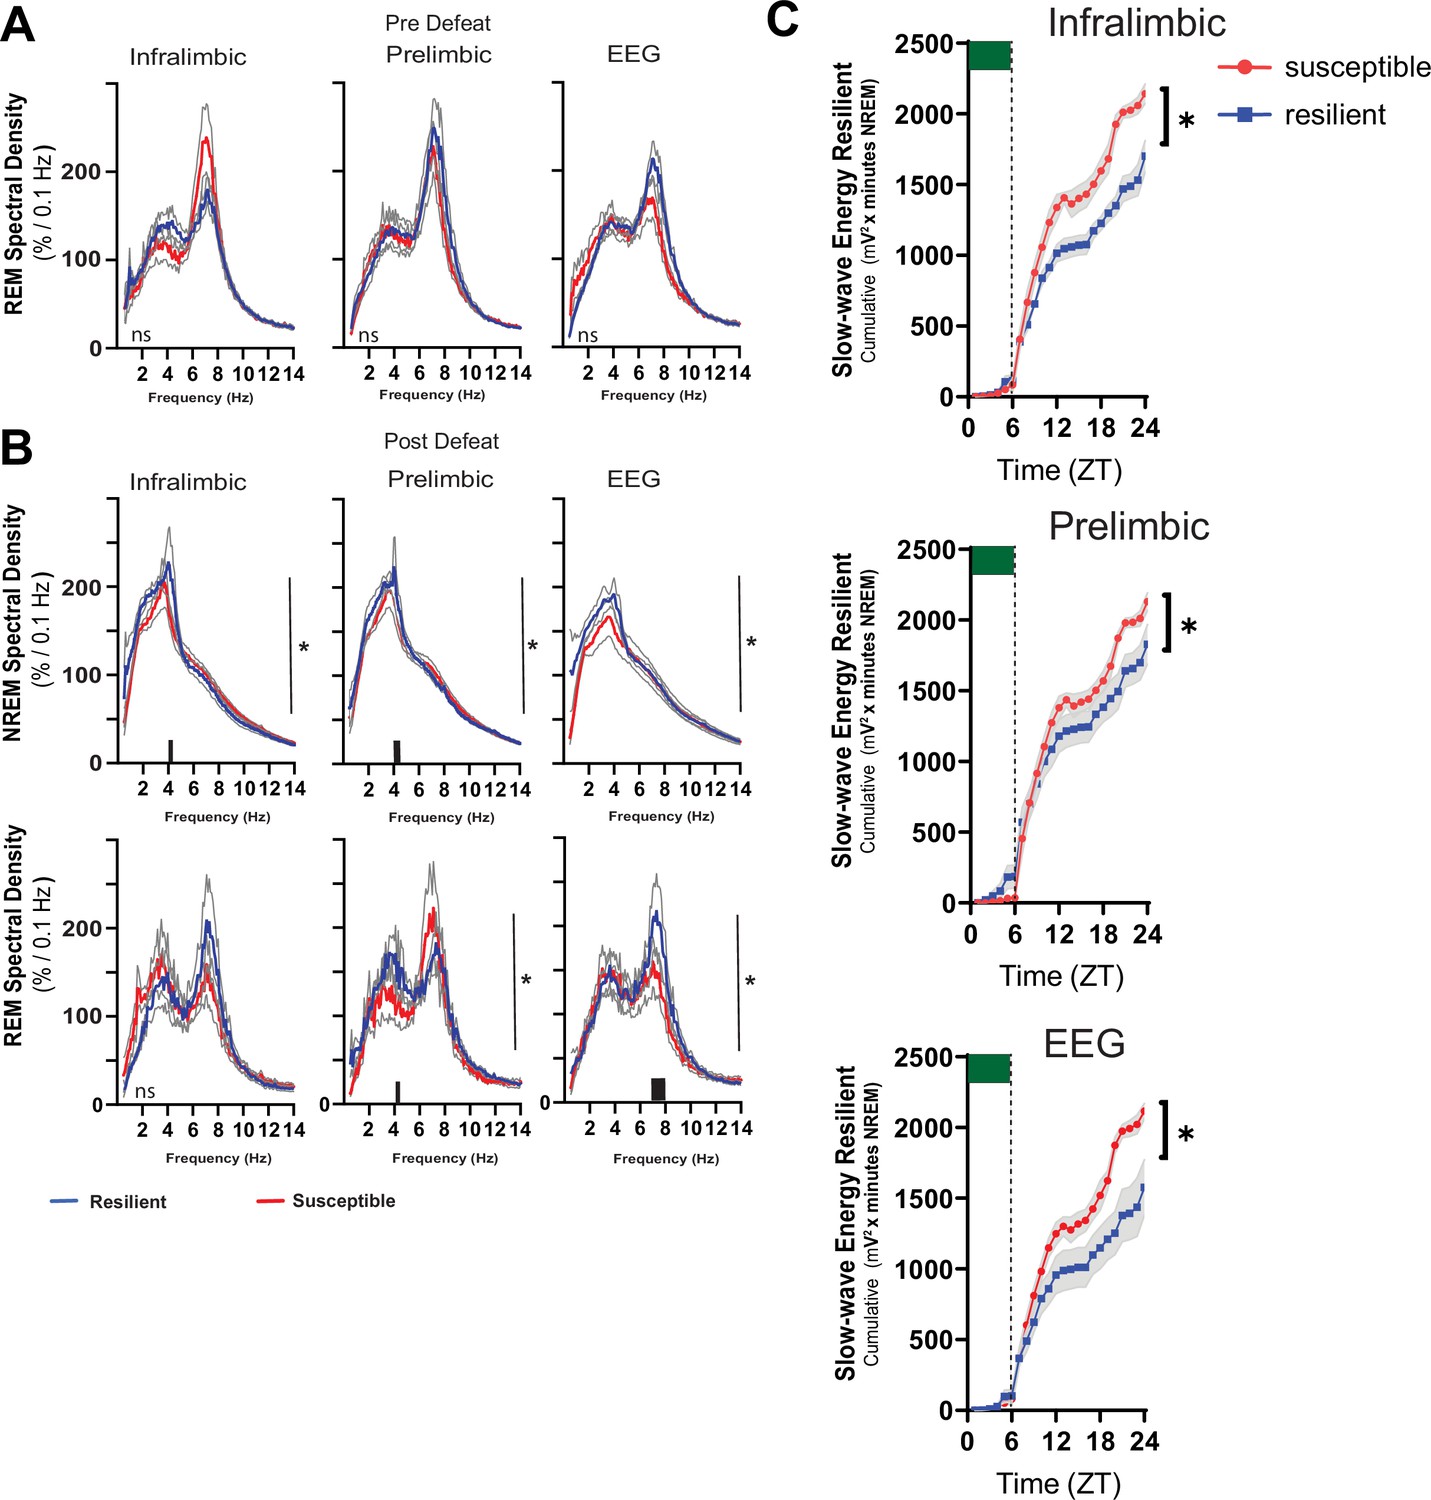
Power density in resilient vs susceptible animals and sleep changes in the ventromedial prefrontal cortex.
Simultaneous local-field potential (LFP)recordings in the ventromedial prefrontal cortex and electroencephalographic (EEG) recordings were obtained from mice before (A) and after (B) 10-days of social-defeat stress. REM power density before social-defeat stress was not significantly different between resilient (blue) and susceptible (red) mice (A; repeated measures ANOVA). After social-defeat stress, resilient animals had increased NREM power density over susceptible animals in frequencies ≤4 Hz for both LFP and EEG leads. Power in REM power density centered around 4–8 Hz also occurred in resilient animals after social-defeat stress, compared to susceptible (B). After 6-hr of sleep restriction, conducted before exposure to social-stress, susceptible animals accumulated significantly more NREM slow-wave energy (C; delta band = 0.5–4 Hz; ). This increased NREM slow-wave energy was also observed in baseline recordings (Figure 5B) and likely indicates an overall increased need for sleep, both at baseline and after sleep restriction. To control for these overall differences, we also compared recovery to baseline within each phenotype (Figure 5), this comparison demonstrated that the recovery of NREM slow-wave energy took significantly less time to return to baseline levels in resilient mice (Figure 5). n=12. *=significant interaction effect, p<0.05, repeated measures ANOVA. Grey lines indicate SEM; Black bars on x-axis=p < 0.05, Holms Sidak’s multiple comparison test.
Figure 6
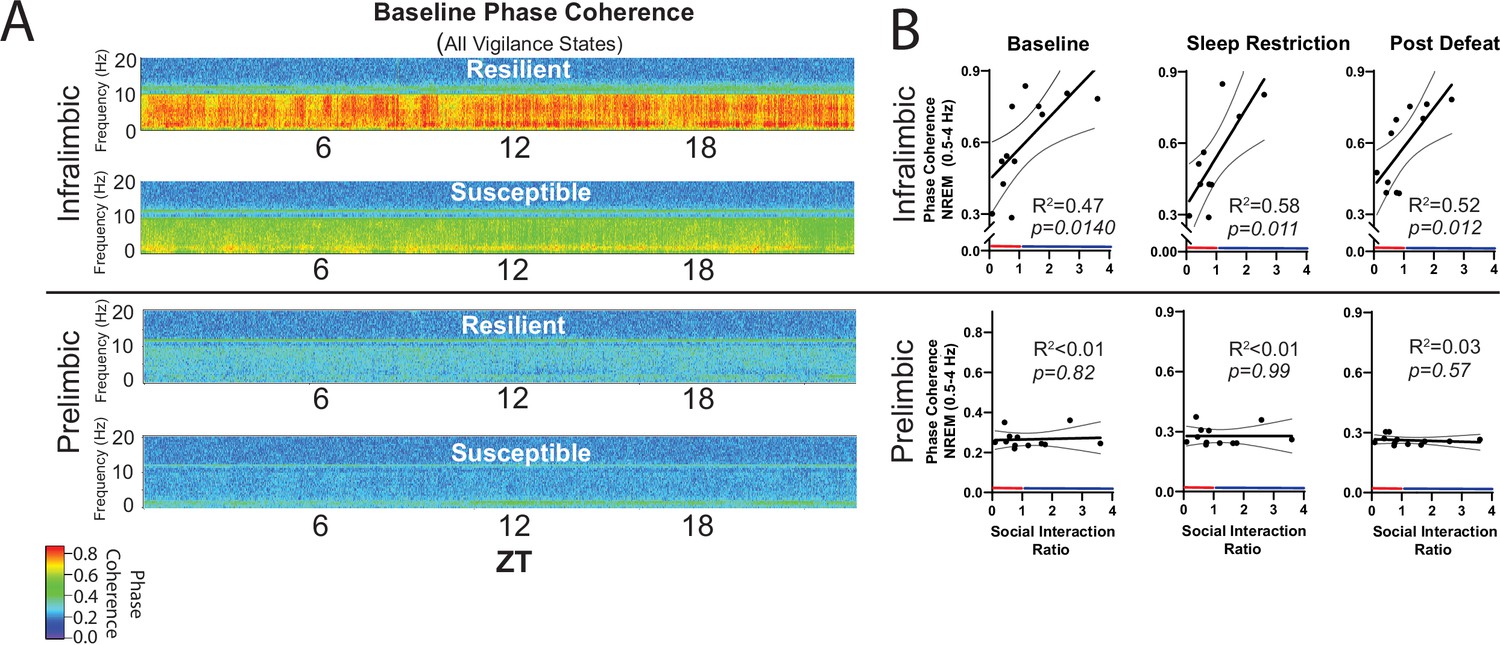
NREM coherence in the 0.5–4 Hz range predicts resilience to social-defeat stress.
Local field potential (LFP) in the ventromedial prefrontal cortex and epidural electroencephalographic recordings (EEG) were simultaneously obtained from mice before and after 10-days of social-defeat stress (see Figure 5). Coherence below 8 Hz between the infralimbic (IL) LFP and EEG was significantly increased across the 24 hr day in undisturbed, resilient mice (compared to susceptible; A, top; warmer colors represent increased coherence). This increased coherence with the EEG below 10 Hz was also visible in the prelimbic (PrL) LFP, but this effect was reduced and not significant (A, bottom; compared to susceptible). A similar pattern of increased coherence in resilient animals was observed after 6 hr of sleep restriction and after 10 days of social-defeat stress (data not shown). Notably, IL-coherence (averaged over 24 hr) predicted social interaction ratios (B, top) both before (B, left) and after (B, middle) social-defeat stress and during recovery from six-hours of sleep restriction (B). These correlations were not observed for the PrL cortex (B, bottom). (A) Heatmaps of coherence over 0.1 Hz intervals in 10 min bins; IL, repeated measures ANOVA: main effect of susceptibility—F(1, 10)=19.81, p=0.0024; PrL, main effect of susceptibility—F(1, 10)=0.188, p=0.09 n.s; n=12. (B) Least-squares regression line with 95% confidence interval and goodness of fit (R2); colors represent resilience (blue) or susceptibility (red) based on interaction ratio; non-zero slope of least-squares regression line, baseline—F(1, 10)=8.87, sleep restriction—F(1, 10)=10.99, post social defeat—F(1, 10)=9.83; p values provided in plots.
Tables
Key resources table
| Reagent type (species) or resource | Designation | Source or reference | Identifiers | Additional information |
|---|---|---|---|---|
| Strain, strain background (Mus musculus, male) | C57BL/6 J | Jackson Labs, Bar Harbor, ME. | Stock #: 000664 | |
| Strain, strain background (Mus musculus, male) | CD-1; retired breeders | Charles Rivers Laboratories, Willington, MA. | 0022CD1 | Used as aggressors in social defeat |
| Recombinant DNA reagent | Control Vehicle, DREADD-, pAAV-hSyn-EGFP | Addgene, Watertown, MA. | Plasmid #50465 | |
| Recombinant DNA reagent | Excitatory DREADD, DREADD +, pAAV-hSyn-hM3D(Gq)-mCherry | Addgene, Watertown, MA. | Plasmid #50474 | |
| Commercial assay or kit | Corticosterone ELISA Kit | Cayman Chemical, Ann Arbor, MI. | Item No. 501320 | |
| Chemical compound, drug | Clozapine N Oxide; CNO | Hello Bio Princeton, NJ. | Cat# HB6149 | Dosage: 2 mg/kg |
| Software, algorithm | Sirenia Acquisition | Pinnacle Technology Inc, Lawrence, KS. | Version 1.8.3 | |
| Software, algorithm | Sirenia Sleep | Pinnacle Technology Inc Lawrence, KS. | Version 1.8.3 | |
| Software, algorithm | Sleep Deprivation System | Pinnacle Technology Inc, Lawrence, KS. | Cat. #: 9000-K5-S | |
| Software, algorithm | Igor Pro 8 software 64-bit | WaveMetrics, Inc, Lake Oswego, OR. | Version 8.04 | FilterIIR, DSPPeriodogram and custom scripts. |
| Software, algorithm, | Noldus Ethovision XT | Noldus Information Technology, Leesburg, VA. | Version 14 | Video tracking during social avoidance test. |
| Software, algorithm | GraphPad Prism | GraphPad Software, San Deigo CA. | Version 7.00 | |
| Other | Prefabricated Electroencephalographic Implant; EEG; electromyograph; EMG | Pinnacle Technologies Inc, Lawrence, KS. | Cat. #: 8201-SS; 8431 | Materials for surgery (Surgery: EEG and LFP electrodes section). |
| Other | Stainless steel screw electrodes | Pinnacle Technology Inc Lawrence, KS. | Cat. #: 8209, 8212, 8403 | Materials for surgery(Surgery: EEG and LFP electrodes section). |
| Other | Silver Epoxy | Pinnacle Technology Inc Lawrence, KS. | Cat. #:8226 | Materials for surgery(Surgery: EEG and LFP electrodes section). |
Additional files
Download links
A two-part list of links to download the article, or parts of the article, in various formats.
Downloads (link to download the article as PDF)
Open citations (links to open the citations from this article in various online reference manager services)
Cite this article (links to download the citations from this article in formats compatible with various reference manager tools)
Non-rapid eye movement sleep determines resilience to social stress
eLife 11:e80206.
https://doi.org/10.7554/eLife.80206


