An atrial fibrillation-associated regulatory region modulates cardiac Tbx5 levels and arrhythmia susceptibility
- Department of Medical Biology, Amsterdam Cardiovascular Sciences, Amsterdam Reproduction and Development, Amsterdam University Medical Centers, University of Amsterdam, Netherlands
- Department of Experimental Cardiology, Amsterdam Cardiovascular Sciences, Amsterdam University Medical Centers, University of Amsterdam, Netherlands
- Department of Cardiology, Severance Hospital, College of Medicine, Yonsei University, Republic of Korea
- Department of Physiology, University of Maastricht, Cardiovascular Research Institute Maastricht, Maastricht University Medical Center, Netherlands
Figures
Figure 1 with 1 supplement
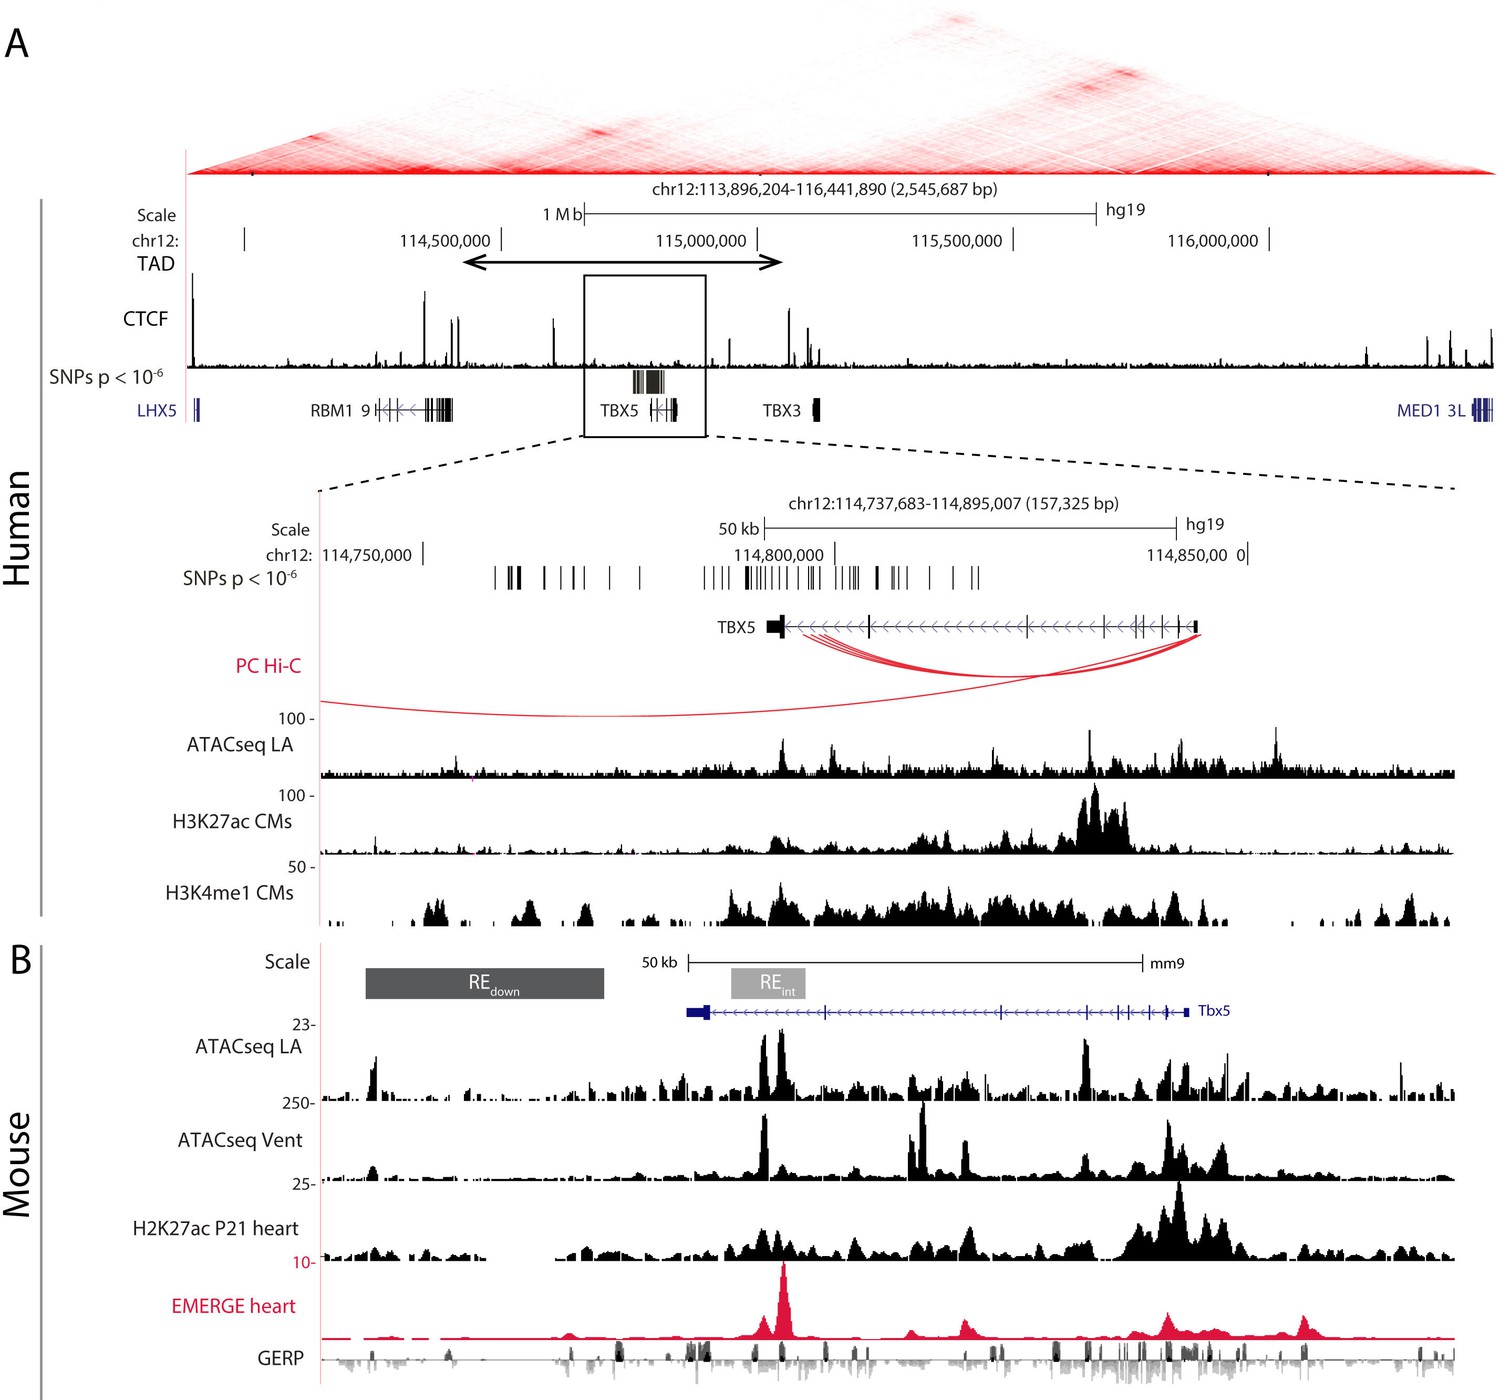
AF-associated noncoding variants are found in the TBX5 locus.
(A) Hi-C heatmap from human lymphoblastoid line GM12878 shows AF-associated variants are found in the regulatory domain of TBX5. Zoom-in of the AF-associated region overlaid with promoter capture Hi-C (red arcs), regions of open chromatin in whole left atria (ATACseq LA), H3K27ac and H3K4me1 ChIPseq signatures in cardiomyocytes. (B) Mouse orthologue of the human region including ATACseq from left atrial and ventricular CMs, H3K27ac ChIPseq from whole juvenile hearts, EMERGE, and conservation tracks. CRISPR/Cas9-generated deletions in light gray (REint), and dark gray (REdown).
Figure 1—figure supplement 1
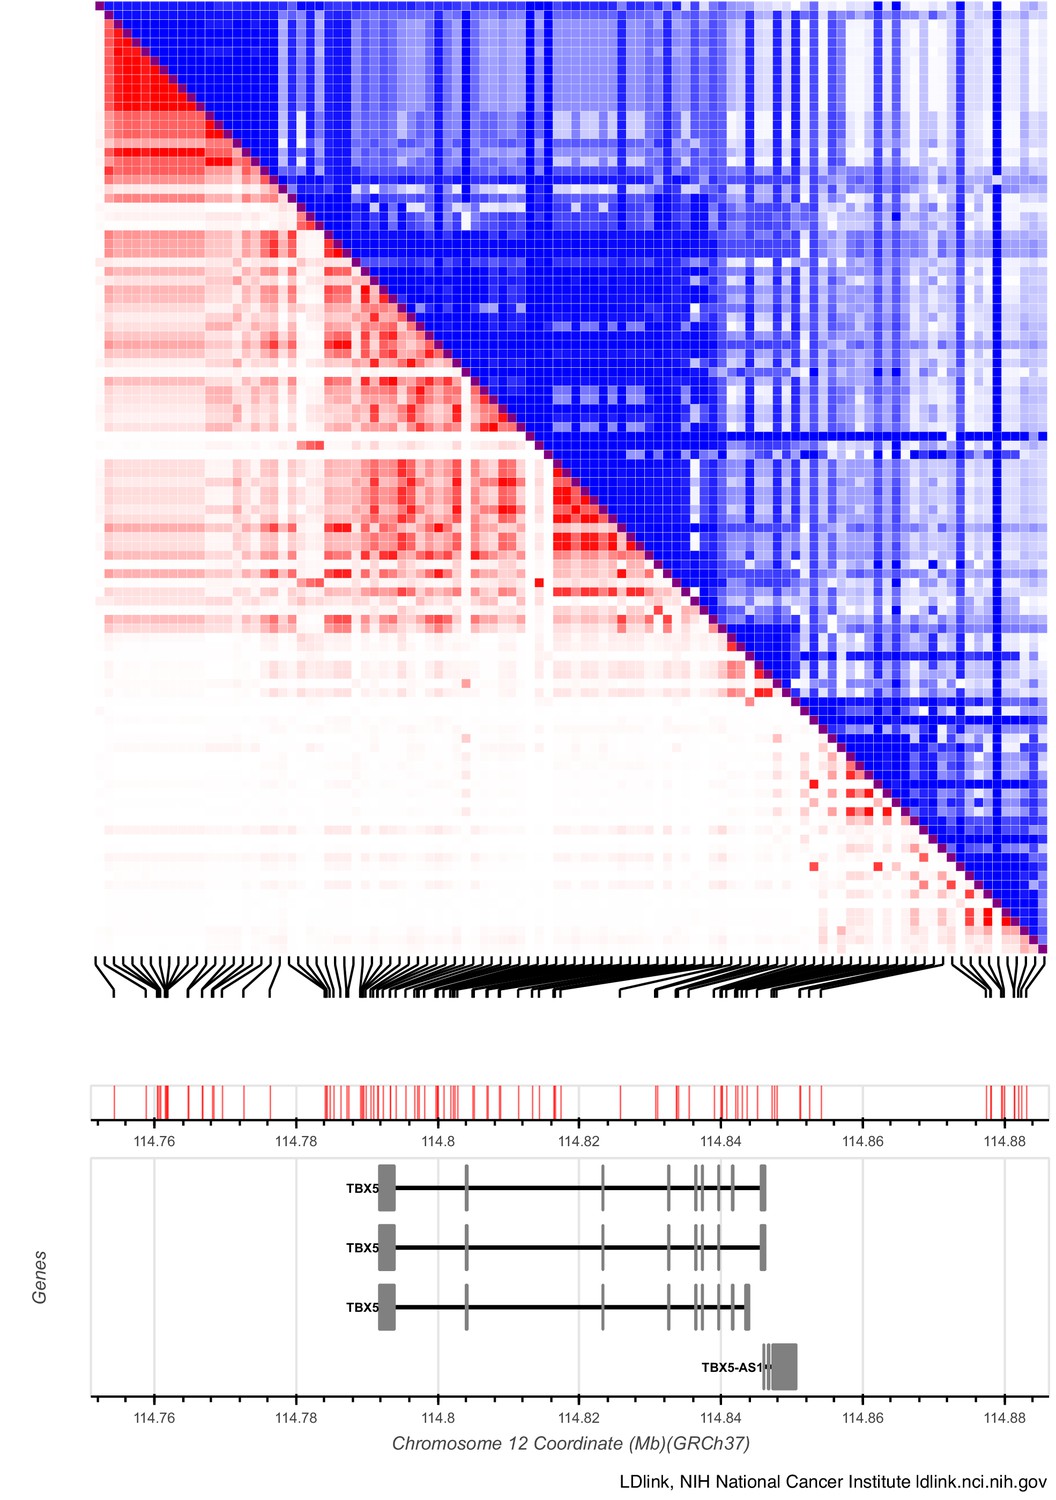
AF-associated variants near TBX5 are grouped into distinct haplotypes.
Linkage disequilibrium (LD) matrix plot of SNPs located at the TBX5 locus associated with AF. The SNPs found in the last intron and downstream of the gene are clustered into two distinct haplotypes based on minimum linkage disequilibrium r2 of 0.1. The plot was generated using the LD matrix tool al ldlink.nci.nih.gov. Scale bar depicted above and below gene.
Figure 2 with 3 supplements
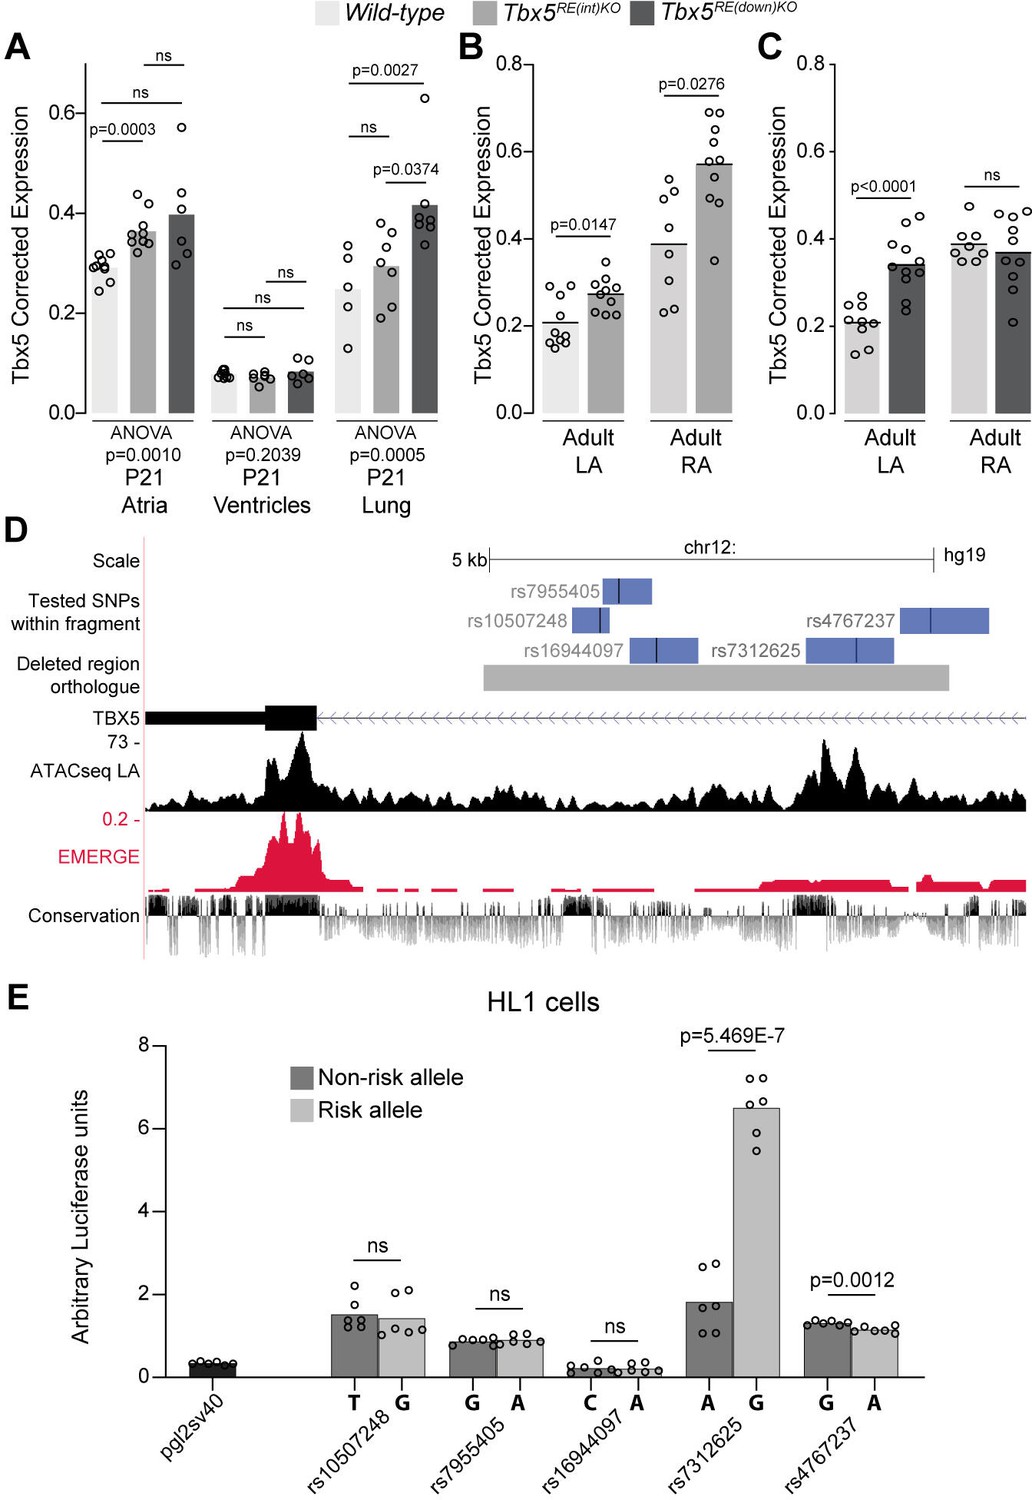
Deletion of AF-associated regions results in increased Tbx5 in adult atrial tissue.
(A) Tbx5 expression in atria, ventricles, and lungs from P21 control, Tbx5RE(int)KO, and Tbx5RE(down)KO mice determined by RT-qPCR. (B–C) Tbx5 expression levels in adult control and Tbx5RE(int)KO (B) or Tbx5RE(down)KO (C) left and right atria. (D) UCSC browser view of the human intronic region (gray) and tested fragments containing AF-associated SNPs (blue) overlaid with chromatin conformation, EMERGE, and conservation tracks. (E) Luciferase assay (n=6) shows enhancer activity differences between non-risk (dark gray) or risk (gray) alleles (Kruskal-Wallis p=0.0019). Statistical significance within each tissue type was determined with ANOVA followed by pairwise comparisons using Dunnett’s T3 multiple comparison test in A, unpaired t-tests in B, C, and Kruskal-Wallis tests followed by pairwise unpaired t-tests (p values shown in figure) in E.
Figure 2—figure supplement 1

No difference in transcript levels of genes adjacent to Tbx5 in deletion mutants.
(A) Fetal (E14.5) expression levels of Tbx5 were normalized to controls within each litter. (B) Reference gene-corrected expression levels of Rbm19, Tbx3, and Med13l in juvenile whole atria (left) and ventricles (right) in WT (n=5), Tbx5RE(int)KO (n=6), and Tbx5RE(down)KO (n=6). Statistical significance within each gene and tissue type was determined with Kruskal-Wallis tests.
Figure 2—figure supplement 2

Tbx5 is selectively expressed in cardiomyocyte nuclei in atria of WT and Tbx5RE(int)KO mice.
(A) Immunoflourescence staining on paraffin sections of adult left atria for Tbx5 (red), PCM-1 which marks cardiomyocytes nuclei (green), and DAPI (blue). Red arrowheads point to non-cardiomyocyte (Tbx5-negative, PCM-1-negative) nuclei, and yellow arrowheads point to Tbx5 +cardiomyocytes. Scale bar is 50 µm.
Figure 2—figure supplement 3
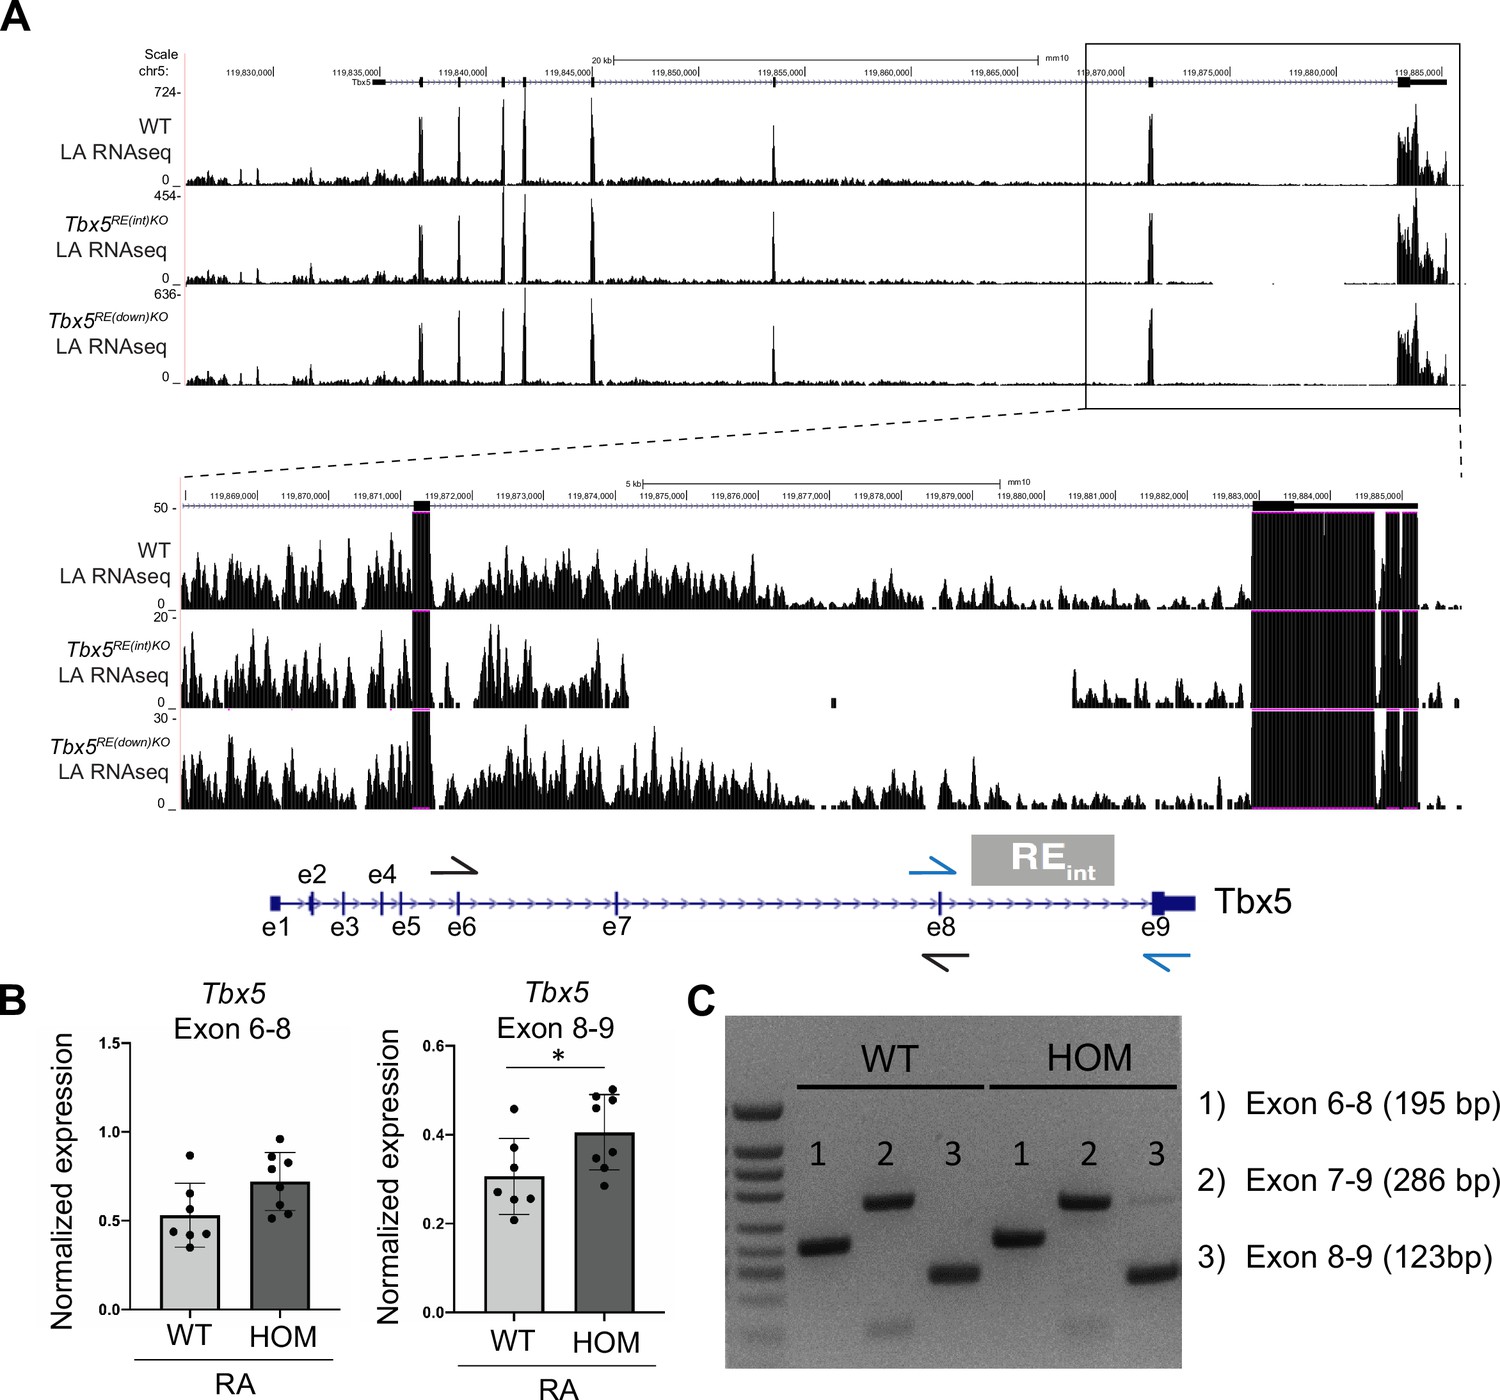
Tbx5 splicing is not affected in deletion mutants.
(A) UCSC browser view shows exon read coverage including the ones flanking the intronic deletion is similar across genotypes. (B) RTq-PCR of WT and Tbx5RE(int)KO (HOM) left and right atria using primers spanning exons 6–8 and 8–9. (C) Resulting amplicon sizes are not different in homozygous mice.
-
Figure 2—figure supplement 3—source data 1
Raw gel for Figure 2—figure supplement 3.
- https://cdn.elifesciences.org/articles/80317/elife-80317-fig2-figsupp3-data1-v2.zip
Figure 3 with 1 supplement
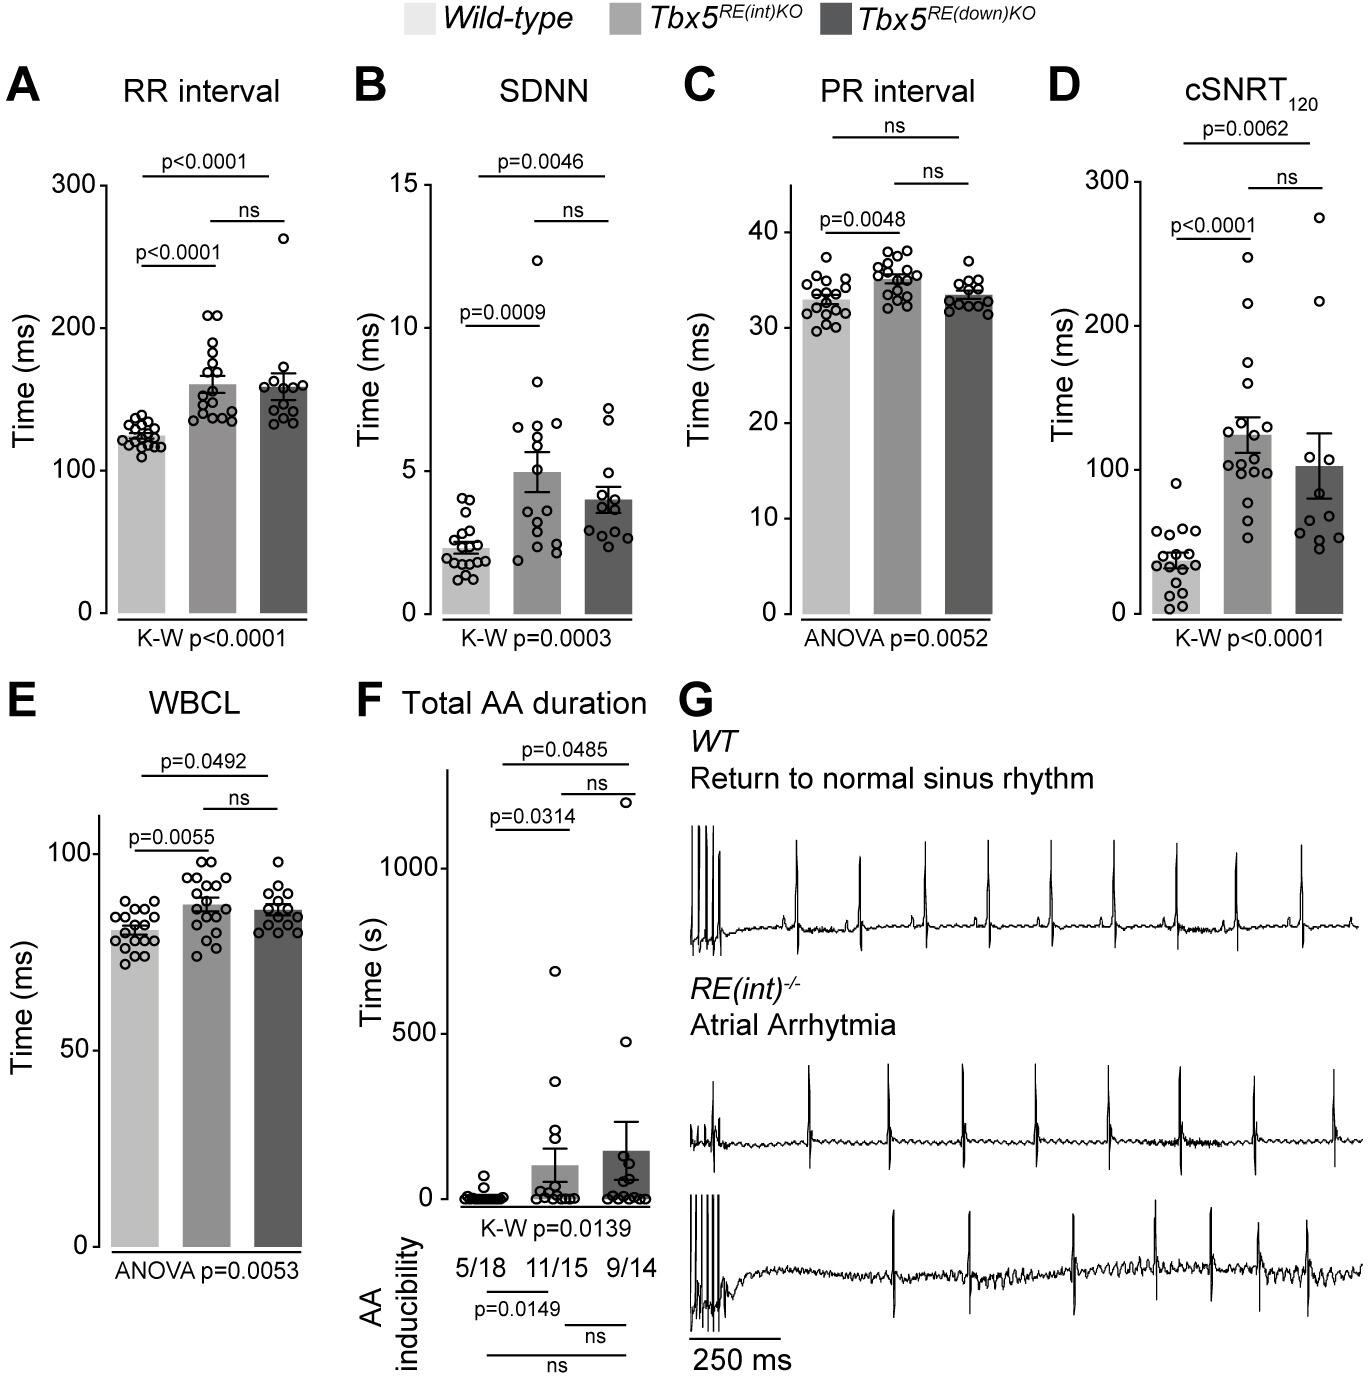
Increased Tbx5 in adult atria results in altered in vivo electrophysiology.
(A–C) Graphs show individual and average ECG measurements for heart rate (RR) (A), heart rate variation (SDNN) (B), and PR-interval (C) of adult wild-type, Tbx5RE(int)KO, and Tbx5RE(down)KO mice. (D, E) Graphs show changes in heart rate-corrected sinus node recovery times at 120ms (cSNRT120) (D), and Wenckebach cycle length (WBCL) (E). (F) Bar graph depicts the total time each mouse spent in an atrial arrhythmia (AA) episode after two pacing passes, with the number of mice in which at least one episode lasting >1 s was observed below each bar. (G) Representative traces from wild-type (top) and two Tbx5RE(int)KO (bottom) individuals showing disappearance of p waves or the start of atrial arrhythmia with variability in ventricular response after pacing stimulus. Significance for in vivo parameters was determined with Kruskal-Wallis test followed by Dunn’s multiple comparison tests in A, B, D, and AA duration in F (top graph), and one-way ANOVA followed by Tukey’s multiple comparisons test in C and E. AA inducibility significance was determined with pairwise Fisher’s exact test (F bottom of graph).
Figure 3—figure supplement 1
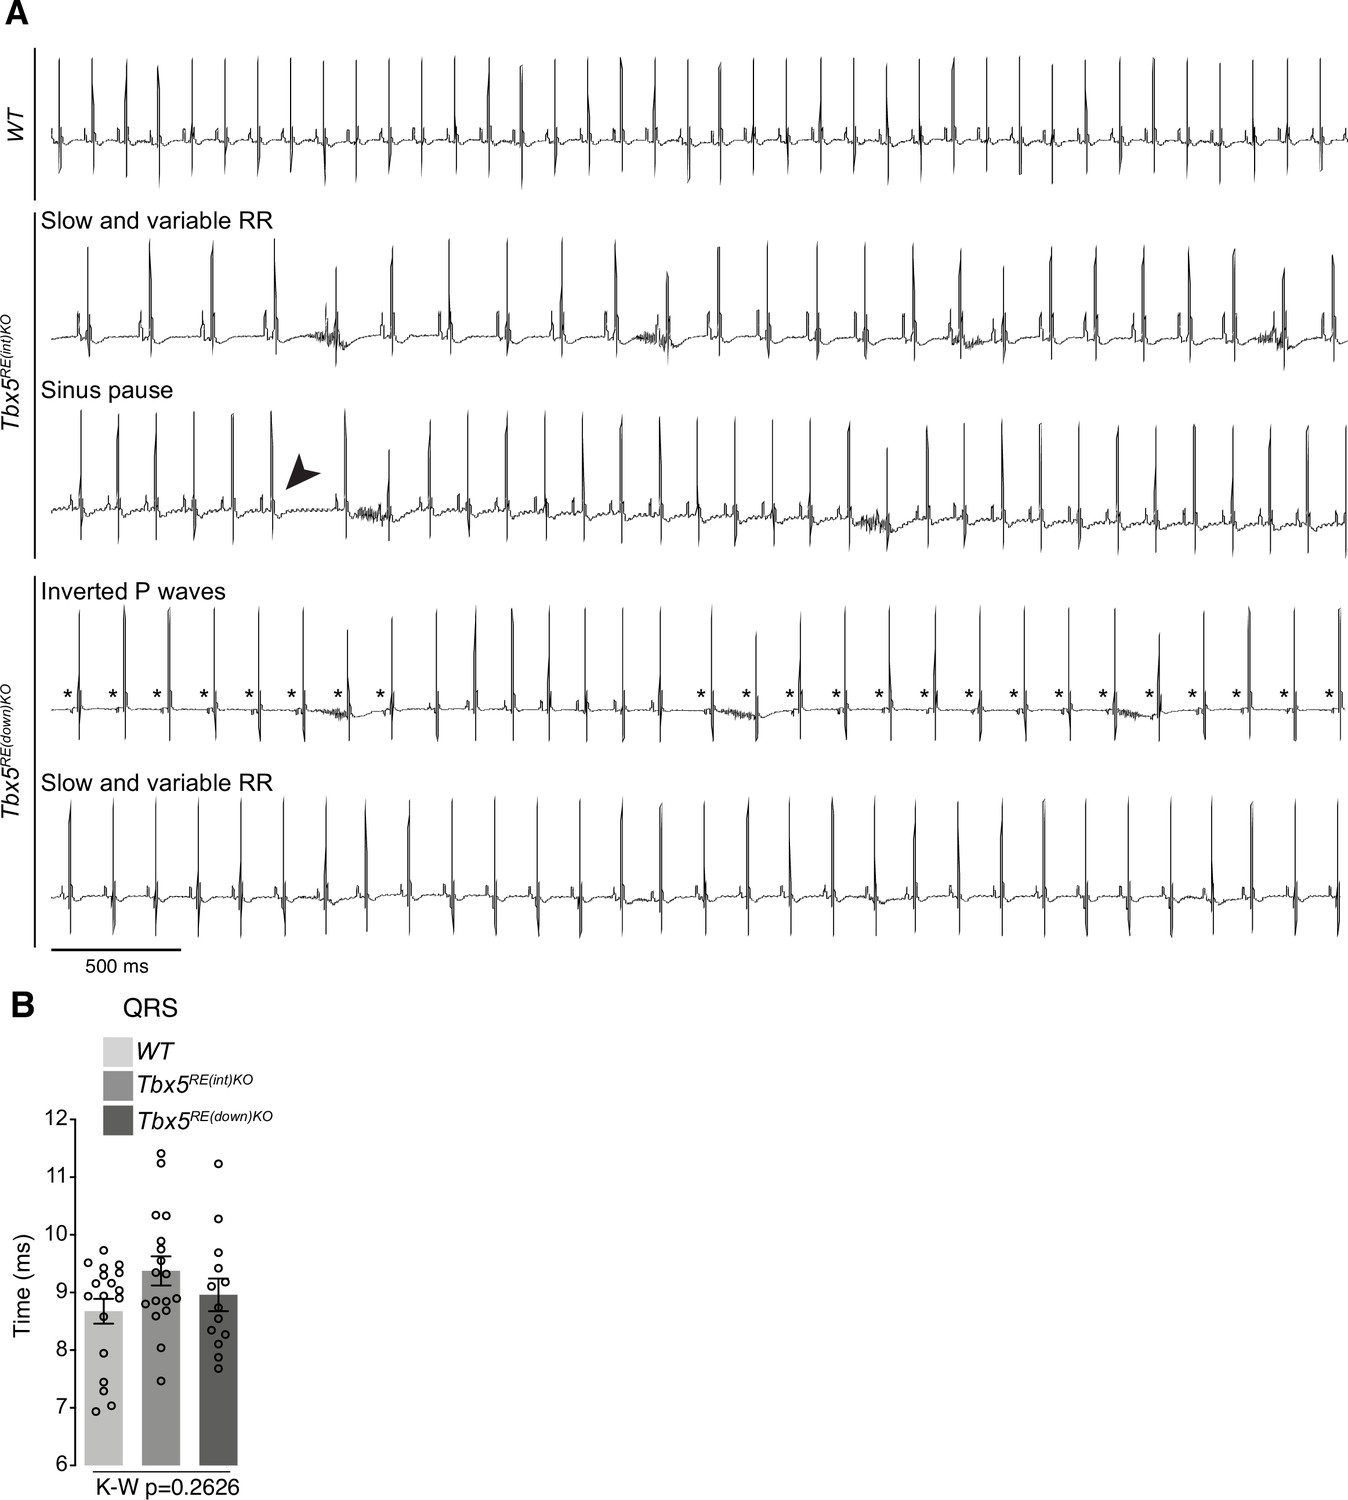
Additional in vivo electrophysiology parameters.
(A) Lead 2 traces of WT, Tbx5RE(int)KO, and Tbx5RE(down)KO mice showing slow and variable RR, a sinus pause (arrowhead), or abnormal P waves (asterisk). (B) Graph shows no significant change in QRS duration in either mutant. Statistical significance was determined in B with Kruskal-Wallis test.
Figure 4
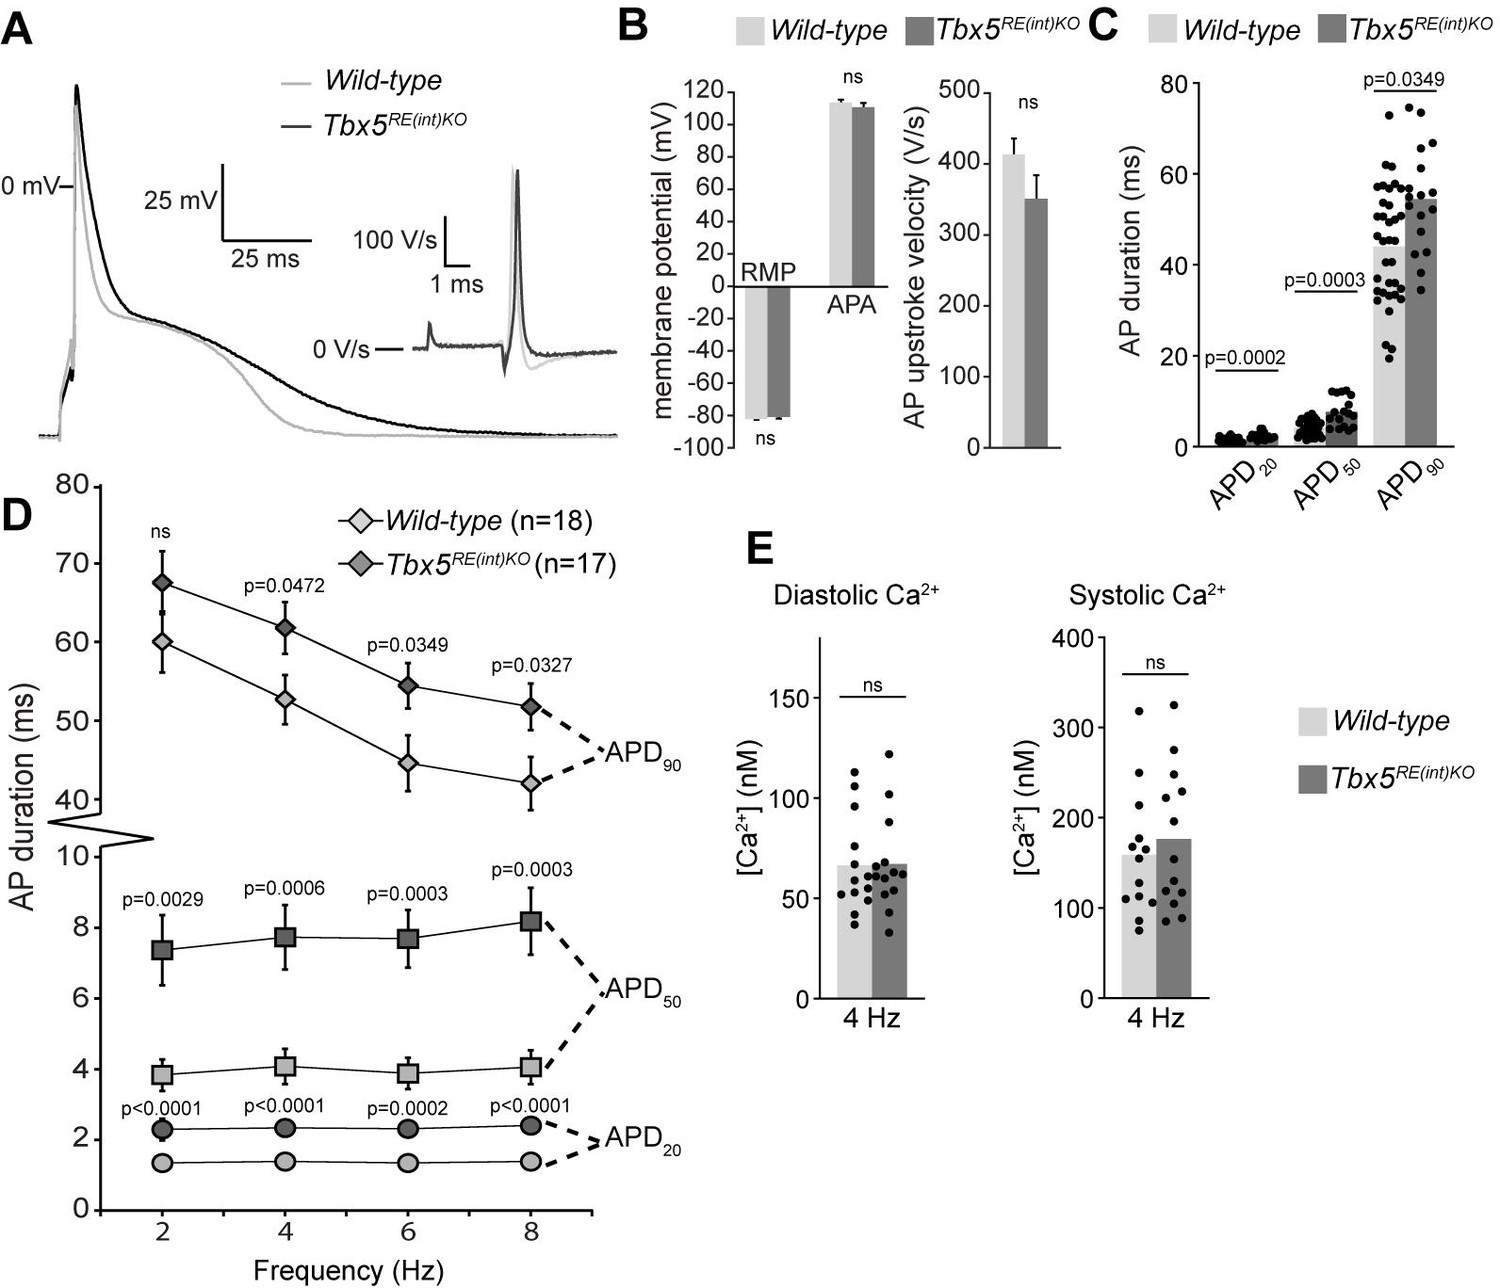
Atrial function abnormalities in Tbx5RE(int)KO mice.
(A) Typical action potentials (APs) and upstroke velocity measured at 6 Hz in single left atrial cardiomyocytes using the amphotericin-perforated patch clamp technique. (B) Average resting membrane potential (RMP), AP amplitude (APA), and AP upstroke velocity remain unchanged in mutants. (C) AP duration at 20, 50, and 90% of repolarization (APD20, APD50, APD90, respectively) is increased in mutants. (D) APD90 was prolonged at all tested frequencies in mutant left atrial cardiomyocytes. Error bars are SD. (E) Diastolic and systolic intracellular Ca2+ concentrations ([Ca2+]i) were not changed in Tbx5RE(int)KO compared to controls. Statistical significance in B was determined with unpaired t-tests with Welch’s correction, and unpaired t-tests were used in B. Experimental groups were compared using two-way repeated measures ANOVA (D, E), followed by pairwise unpaired t-tests (C). Error bars are SEM.
Figure 5 with 4 supplements
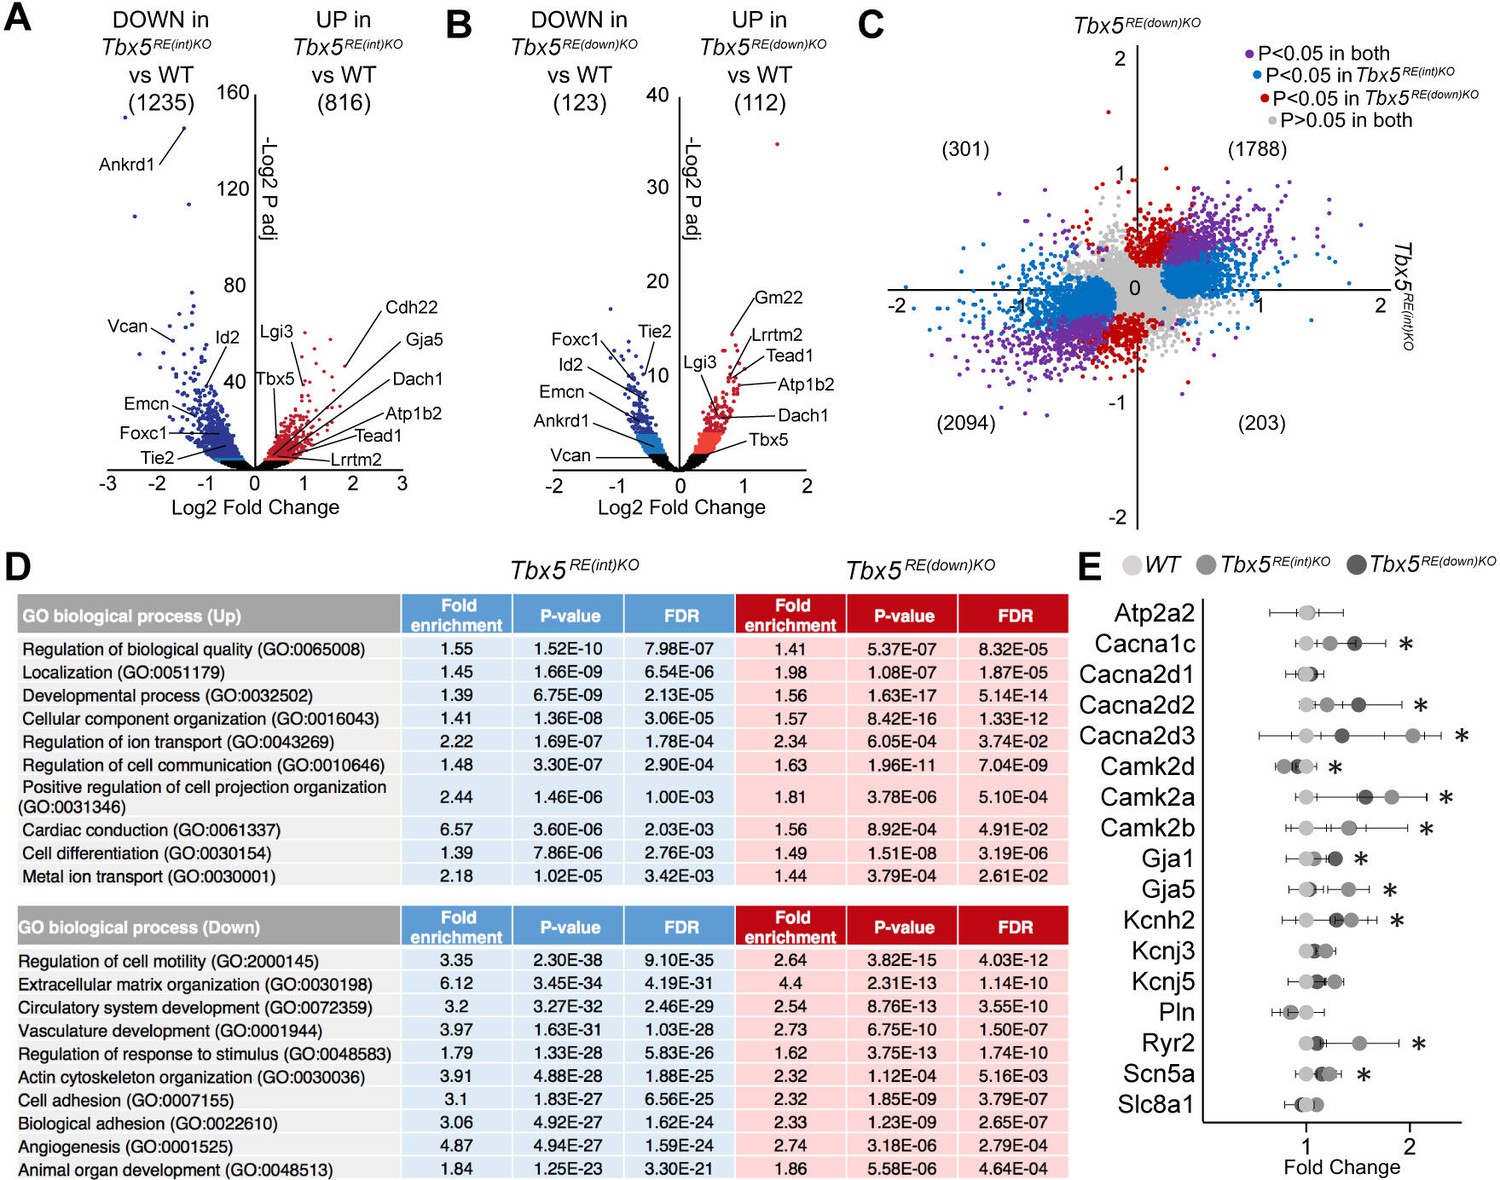
Transcriptomic analysis of Tbx5RE(int)KO left atria.
(A, B) Volcano plot showing differentially expressed transcripts in Tbx5RE(int)KO (n=3)(A) and Tbx5RE(down)KO (n=3) (B) from wild-type (n=4) left atria. Dark red and light red dots indicate significantly upregulated genes by raw p-value and p-adjusted for multiple testing, respectively. Correspondingly, dark blue and light blue dots indicate downregulated genes. p Values were adjusted for multiple testing using the false discovery rate (FDR) method of Benjamini-Hochberg. (C) X-Y plot of all transcripts in Tbx5RE(int)KO (x axis) and Tbx5RE(down)KO (y axis), with deregulated genes common to both deletion mutants in purple, Tbx5RE(int)KO deregulated genes in blue, and Tbx5RE(down)KO deregulated genes in red. (D) Gene ontology (GO) analysis of upregulated and downregulated genes in Tbx5RE(int)KO and Tbx5RE(down)KO mutants. (F) Graph depicts fold change expression in control and mutant samples of genes known to affect action potential duration. * denotes significantly deregulated in one or both mutant lines.
Figure 5—figure supplement 1
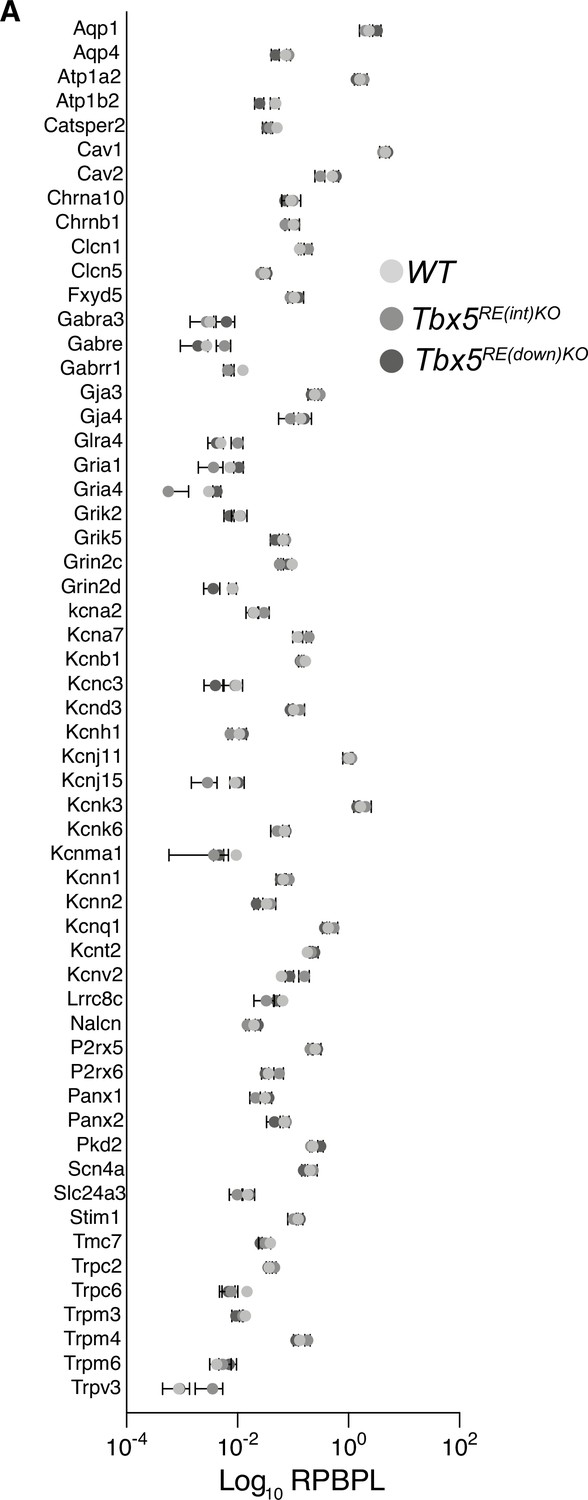
Ion channel expression in left atria of deletion mutants.
(A) Graph depicts differential ion channel expression (fold change) in control and mutant left atria. RPBPL; Reads per (transcript) base pair length.
Figure 5—figure supplement 2
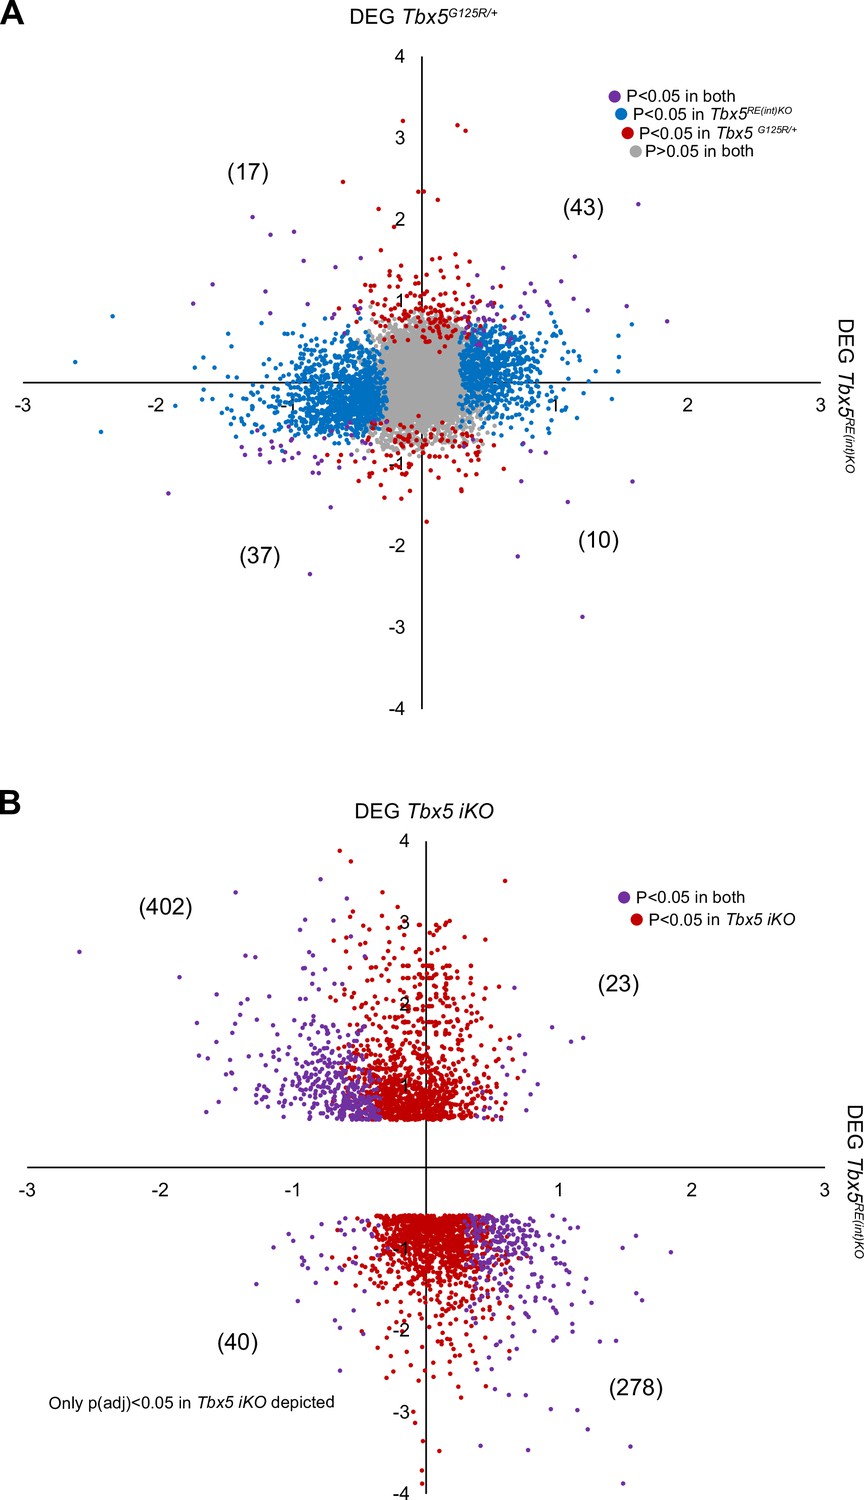
Comparison of genes differentially expressed between left atria of Tbx5RE(int)KO and control mice, Tbx5G125R/+ and control mice and Tbx5 iKO and control mice.
(A–B) Scatterplots of Log2(Fold Change) of transcripts in Tbx5RE(int)KO (x axis) and (A) Tbx5G125R/+ or (B) Tbx5 iKO (y axis), with deregulated genes (Padj <0.05) common to both genotypes in purple, Tbx5RE(int)KO deregulated genes in blue and Tbx5G125R/+ or Tbx5 iKO deregulated genes in red.
Figure 5—figure supplement 3
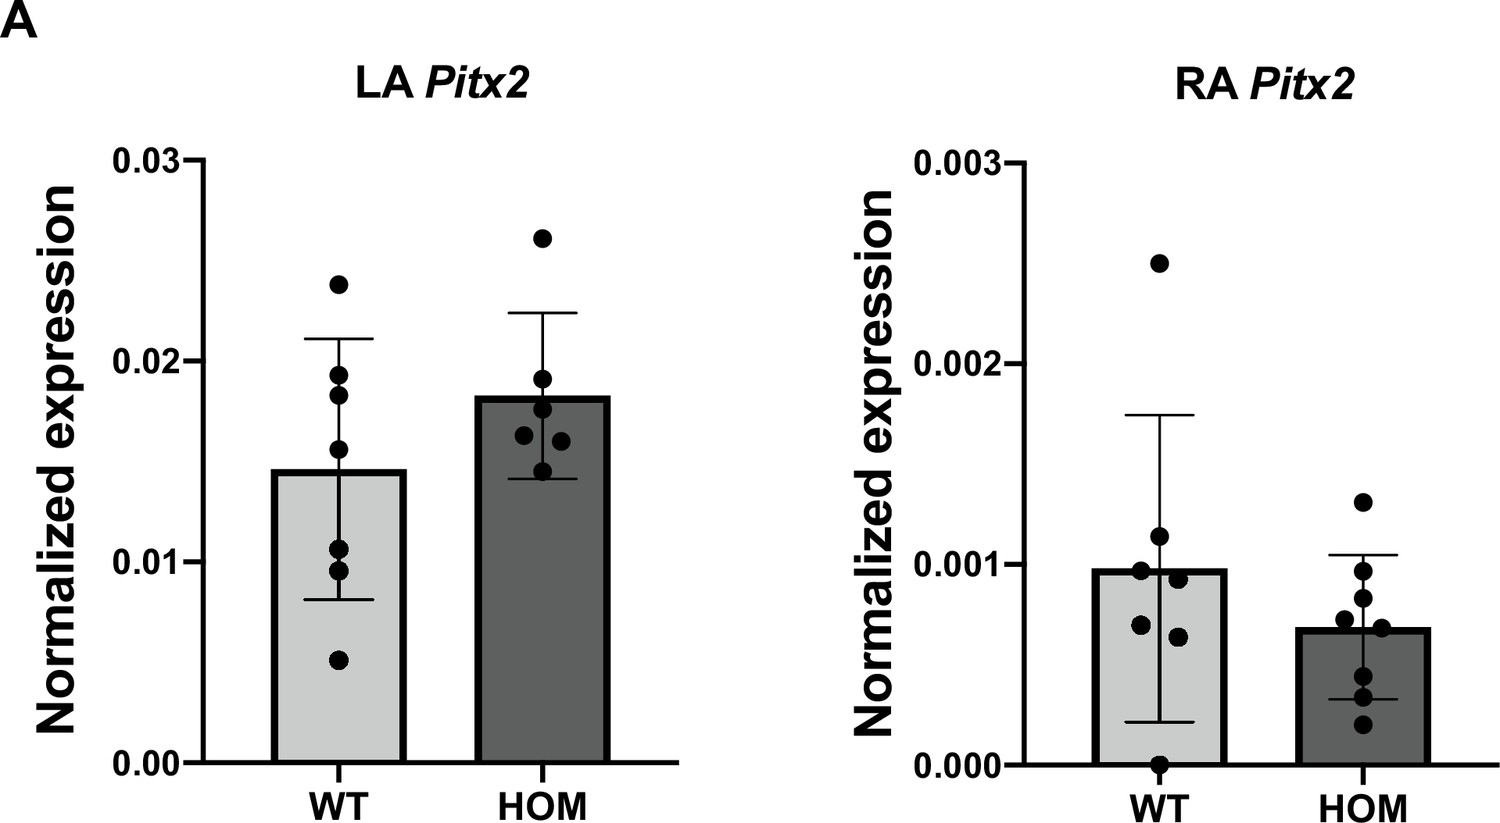
Pitx2 expression is not affected in Tbx5RE(int)KO atria.
(A) RT-qPCR on left and right atria of controls and deletion mutants for Pitx2. Statistical significance was determined by unpaired t-tests (no significant differences detected).
Figure 5—figure supplement 4
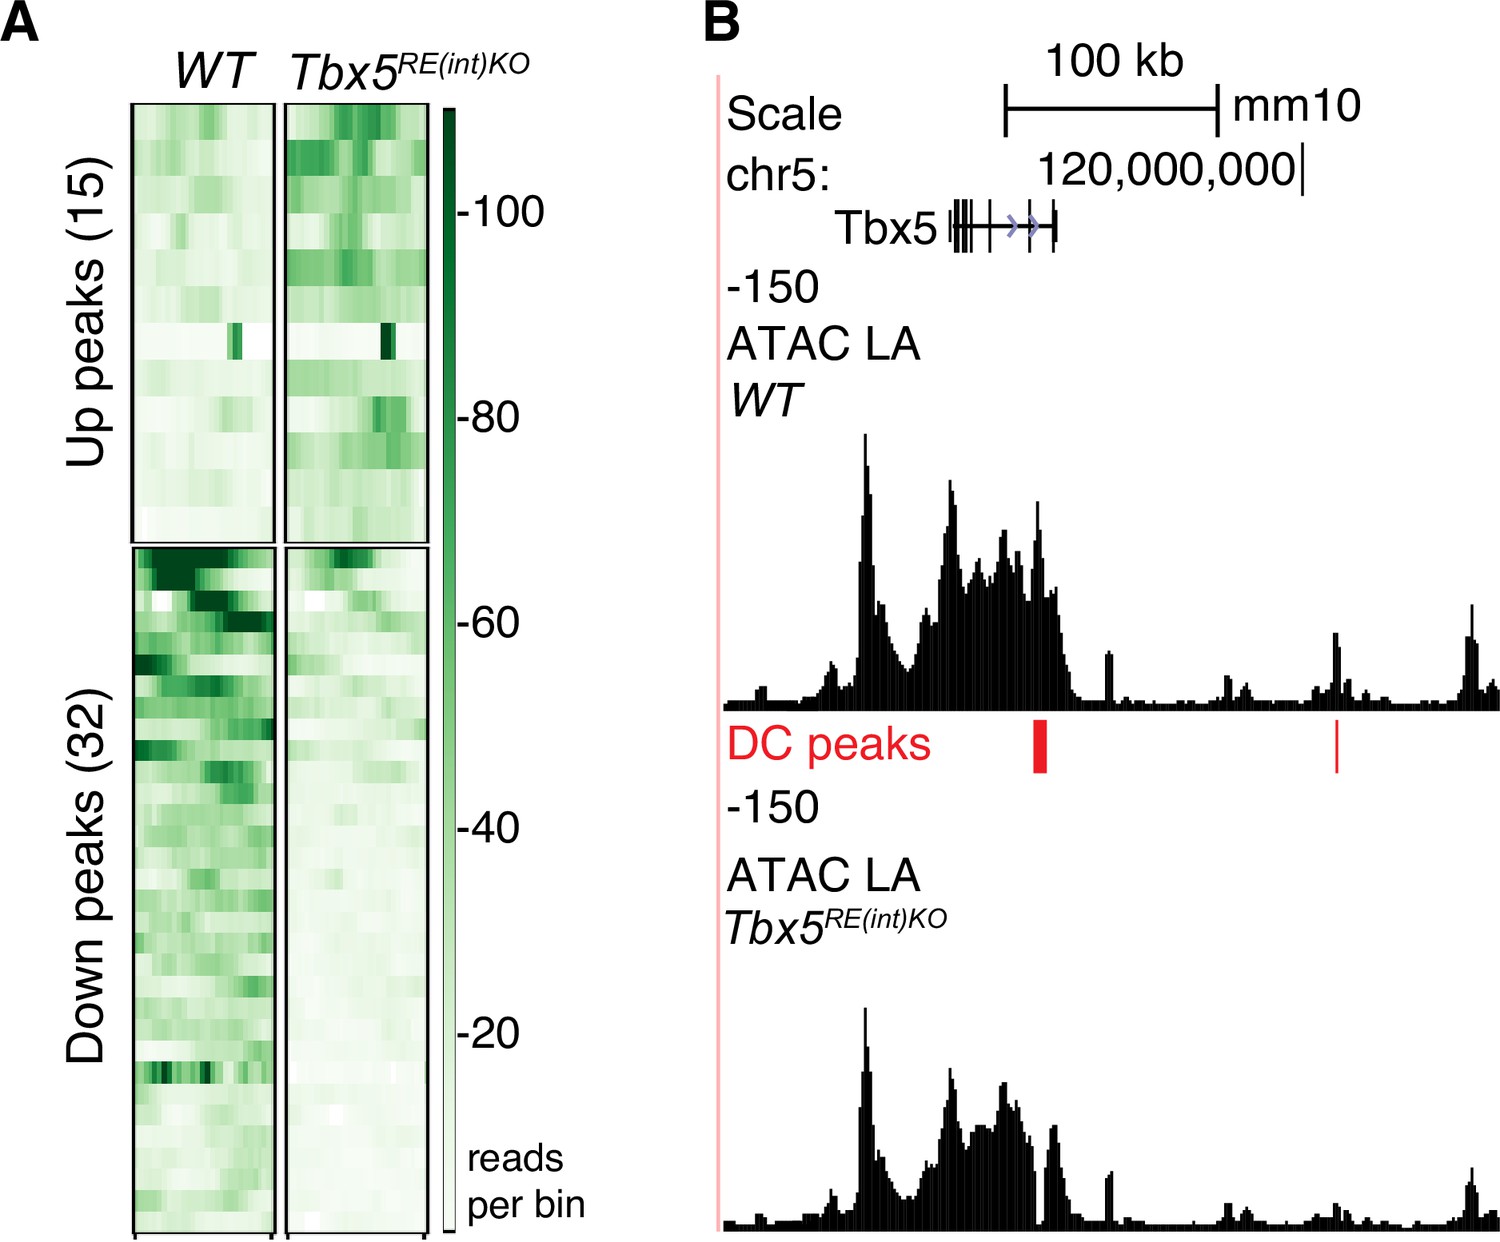
Modest Tbx5 upregulation minimally alters genome-wide chromatin accessibility.
(A) Heatmaps depicting vertically sorted up or downregulated accessible regions spanning 1500 bp bins (Padj <0.05) in Tbx5RE(int)KO (n=4) vs WT (n=4) cardiomyocytes. (B) UCSC browser view of the Tbx5 locus showing differential accessibility profiles in mutants.
Figure 6 with 1 supplement
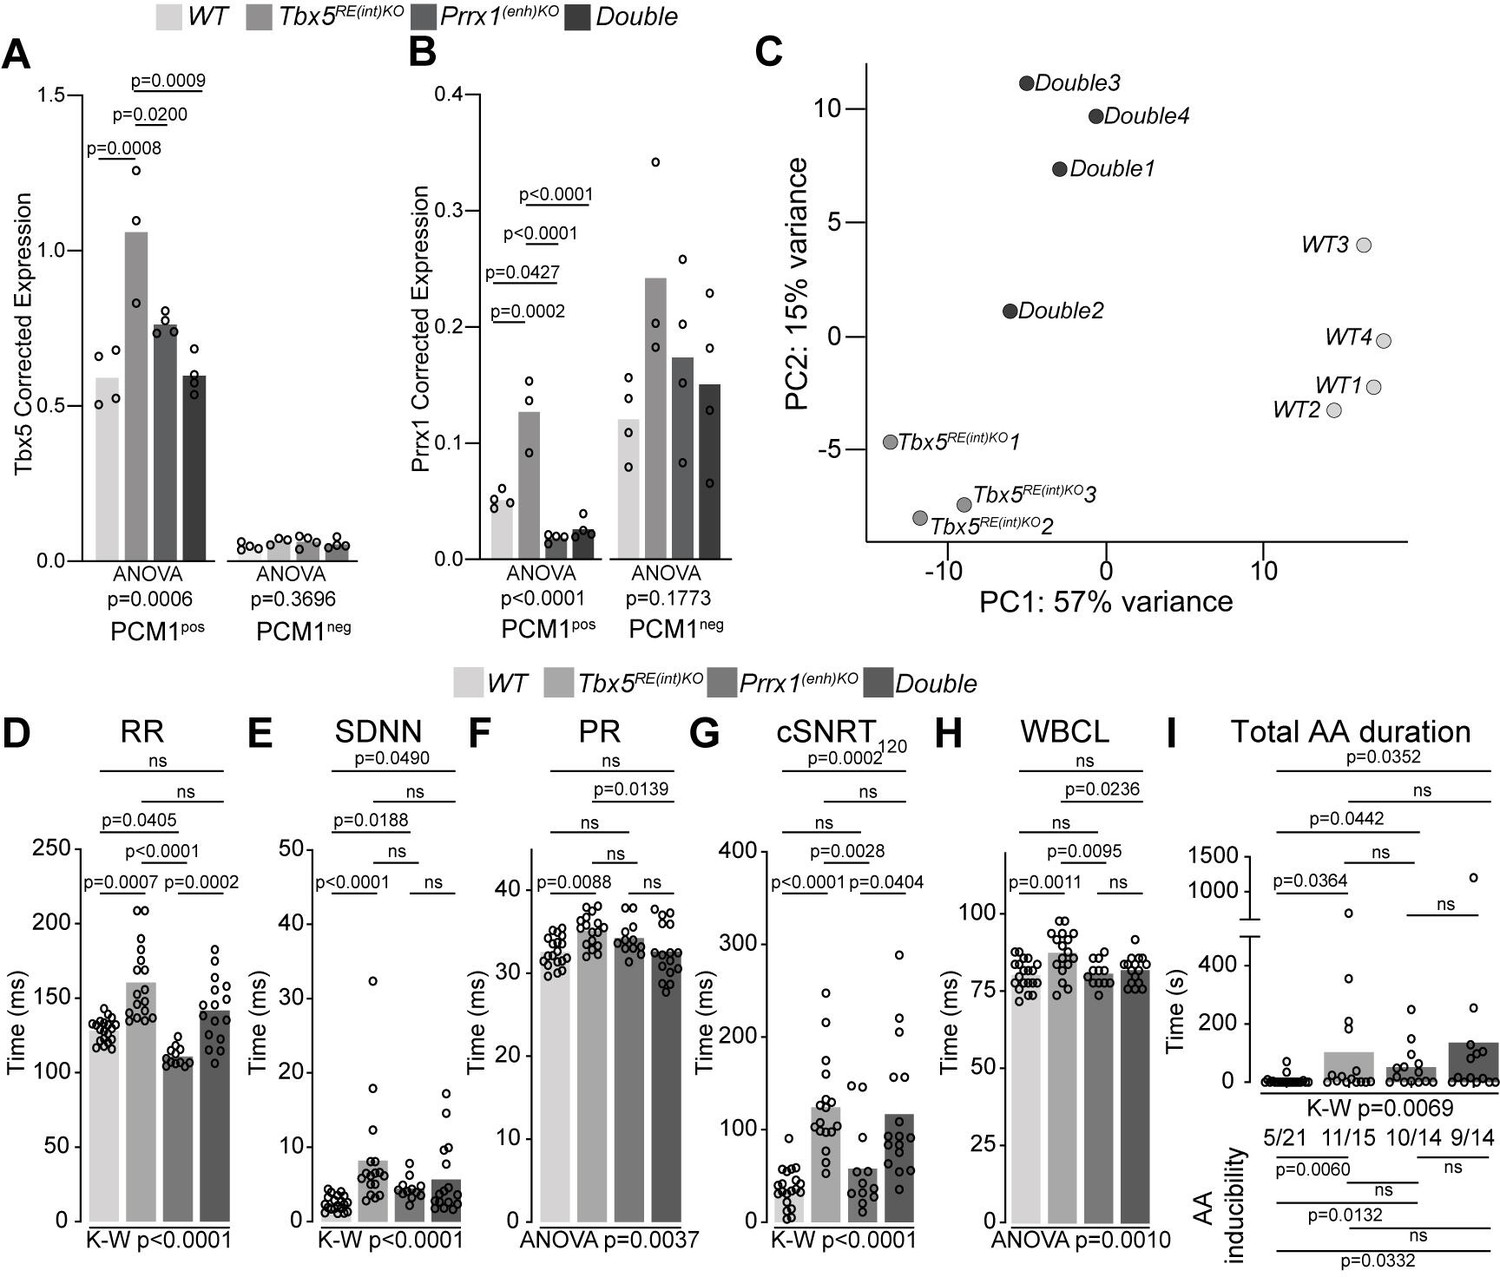
A genetic interaction between Tbx5 and Prrx1.
(A, B) Graph shows reference gene-corrected expression of Tbx5 (A), and Prrx1 (B) in PCM1-positive and -negative nuclei fractions of wild-type, Tbx5RE(int)KO, Prrx1(enh)KO and double mutant whole hearts determined by RT-qPCR. (C) Principal component analysis of transcriptomes of wild-type, Tbx5RE(int)KO and DoubleKO left atrial samples. (D–H) Graphs show individual and average ECG measurements for RR (D), heart rate variation (SDNN) (E), PR interval (F), cSNRT at 120ms pacing (G), and WBCL (H) of wild-type, Tbx5RE(int)KO, Prrx1(enh)KO and DoubleKO mice. (I) Bar graph depicts the total time each mouse spent in an AA episode after two pacing passes, with the number of mice in which at least one episode lasting >1 s was observed below each bar. Statistical significance was determined using one-way ANOVA followed by Tukey’s test for pairwise comparisons in A, B, F, H, Kruskal-Wallis test followed by Dunn’s test for pairwise comparisons in D, E, G, and AA duration in I (top of graph), Fisher’s exact test for pairwise comparisons of AA inducibility in I (bottom of graph).
Figure 6—figure supplement 1
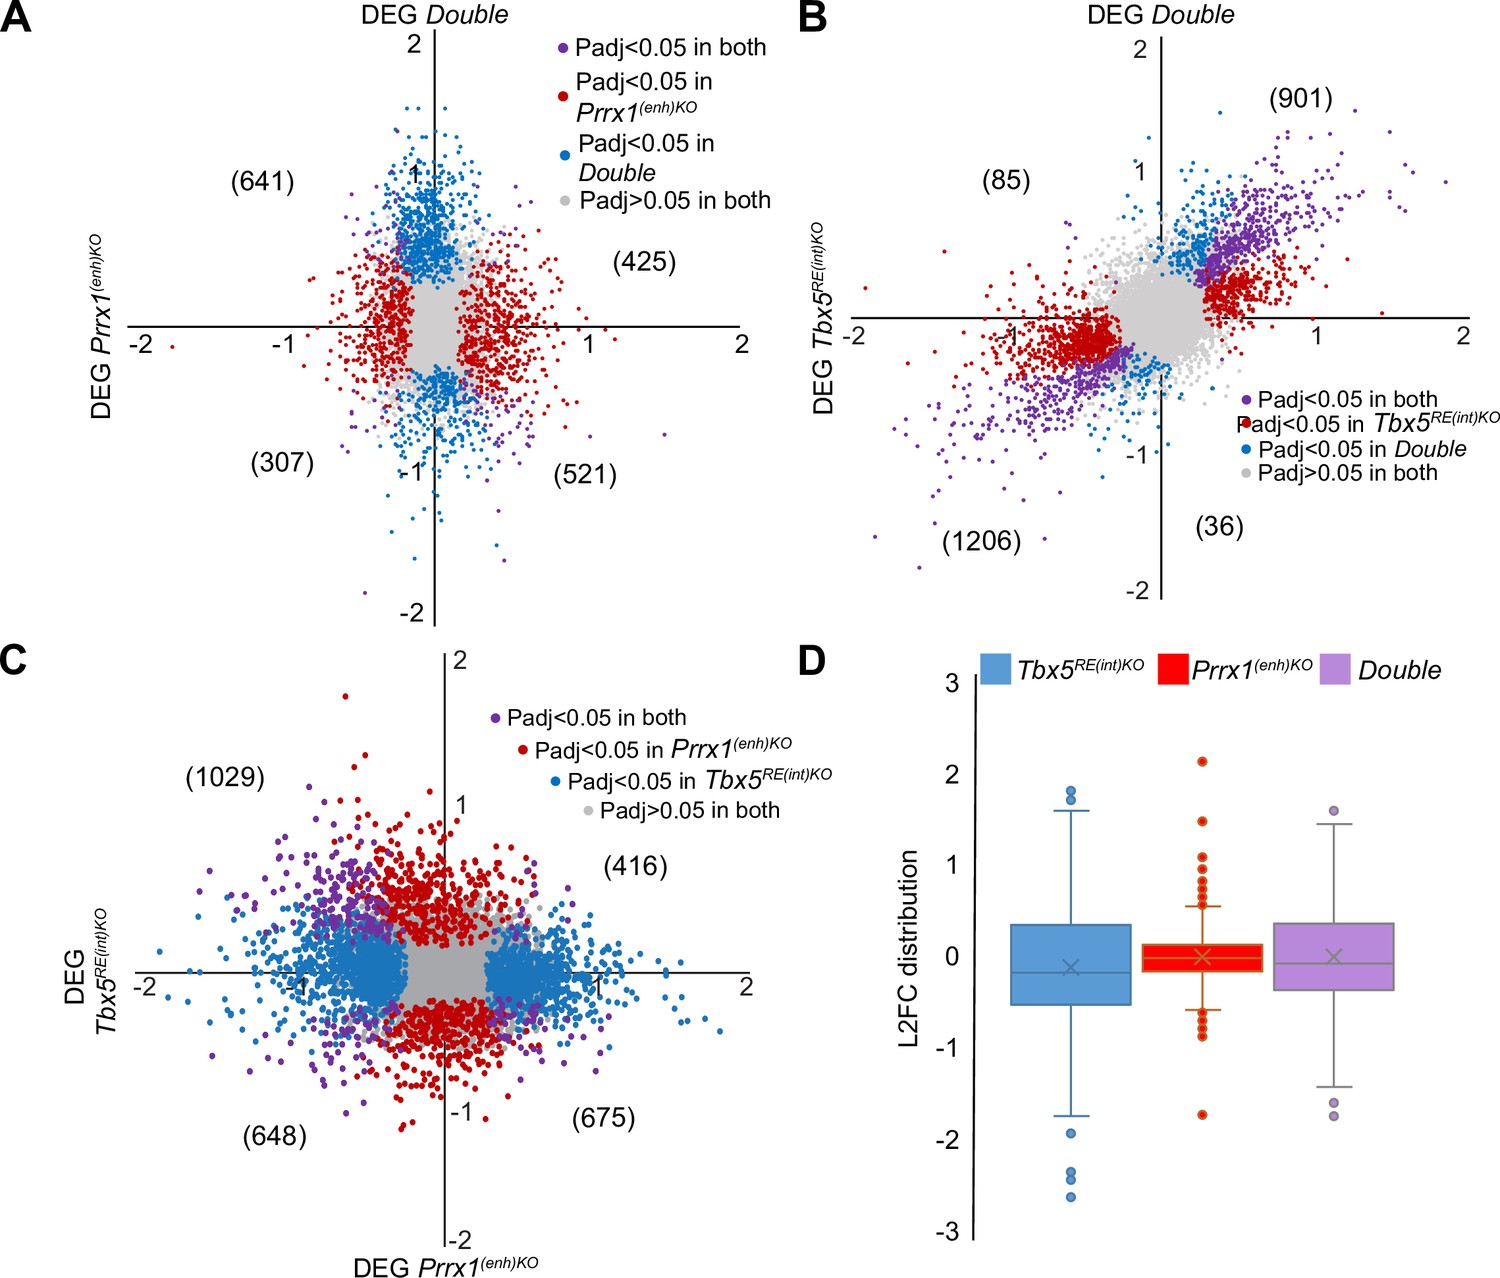
Comparison of genes differentially expressed between left atria of Prrx1(enh)KO and control mice, Tbx5RE(int)KO and control mice, and Double homozygous mutants and control mice.
(A–B) X-Y plot of all transcripts in Prrx1(enh)KO (A) or Tbx5RE(int)KO (B) (x axis) and Double homozygous (y axis), with deregulated genes (Padj <0.05) common to both genotypes in purple, Prrx1(enh)KO, or Tbx5RE(int)KO deregulated genes in red and Double homozygous deregulated genes in blue. (C) Plot depicts comparison between Tbx5RE(int)KO (x axis) and Prrx1(enh)KO (y axis). (D) Box plots showing differences in Log2(Fold Change) distribution of Prrx1(enh)KO, Tbx5RE(int)KO, and Double homozygous left atria.
Tables
Table 1
Gene ontology (GO) analysis of upregulated and downregulated genes in Tbx5RE(int)KO, Prrx1(enh)KO, and Double homozygous adult left atria.
| Prrx1(enh)KO | Tbx5RE(int)KO | Double | ||||||||||
|---|---|---|---|---|---|---|---|---|---|---|---|---|
| GO biological process | UP/DOWN | Fold enrich | P-value | FDR | UP/DOWN | Fold enrich | P-value | FDR | UP/DOWN | Fold enrich | P-value | FDR |
| Regulation of biological quality (GO:0065008) | DOWN | 1.64 | 1.7E-08 | 3E-06 | UP | 1.55 | 1.5E-10 | 8E-07 | UP | 1.56 | 3.4E-08 | 1.5E-05 |
| Localization (GO:0051179) | DOWN | 2.11 | 1.5E-14 | 1.6E-11 | UP | 1.45 | 1.7E-09 | 6.5E-06 | UP | 1.44 | 2.9E-07 | 8E-05 |
| Developmental process (GO:0032502) | UP | 2.33 | 6.1E-20 | 1.6E-16 | UP | 1.39 | 6.8E-09 | 2.1E-05 | UP | 1.61 | 1.8E-14 | 2.9E-10 |
| Cellular component organization (GO:0016043) | DOWN | 1.85 | 4.3E-08 | 6.9E-06 | UP | 1.41 | 1.4E-08 | 3.1E-05 | UP | 1.54 | 1.3E-10 | 2.2E-07 |
| Regulation of ion transport (GO:0043269) | DOWN | 2.68 | 8.7E-08 | 1.3E-05 | UP | 2.22 | 1.7E-07 | 0.00018 | UP | 2.36 | 7.6E-07 | 0.00018 |
| Regulation of cell communication (GO:0010646) | DOWN | 2.18 | 2.8E-18 | 1.1E-14 | UP | 1.48 | 3.3E-07 | 0.00029 | UP | 1.57 | 3.4E-07 | 8.9E-05 |
| Positive regulation of cell projection organization (GO:0031346) | DOWN | 2.07 | 0.00033 | 0.0158 | UP | 2.44 | 1.5E-06 | 0.001 | UP | 2.08 | 3.9E-07 | 0.0001 |
| Cardiac conduction (GO:0061337) | DOWN | 7.1 | 0.00011 | 0.00597 | UP | 6.57 | 3.6E-06 | 0.00203 | UP | 7.36 | 1E-05 | 0.0015 |
| Cell differentiation (GO:0030154) | UP | 2.25 | 2.8E-11 | 8.2E-09 | UP | 1.39 | 7.9E-06 | 0.00276 | UP | 1.65 | 4.8E-10 | 5.8E-07 |
| Metal ion transport (GO:0030001) | DOWN | 3.43 | 4.5E-08 | 7.3E-06 | UP | 2.18 | 1E-05 | 0.00342 | UP | 2.25 | 0.00069 | 0.049 |
| Regulation of cell motility (GO:2000145) | UP | 2.96 | 2.1E-14 | 1.2E-11 | DOWN | 3.35 | 2.3E-38 | 9.1E-35 | DOWN | 2.28 | 2.5E-05 | 0.00564 |
| Extracellular matrix organization (GO:0030198) | UP | 7.57 | 2E-24 | 3.1E-20 | DOWN | 6.12 | 3.5E-34 | 4.2E-31 | DOWN | 7.87 | 3.2E-17 | 5.1E-13 |
| Circulatory system development (GO:0072359) | UP | 3.3 | 2.8E-17 | 3.7E-14 | DOWN | 3.2 | 3.3E-32 | 2.5E-29 | DOWN | 3.14 | 2.3E-10 | 9.1E-07 |
| Vasculature development (GO:0001944) | UP | 4.11 | 4.6E-17 | 4.8E-14 | DOWN | 3.97 | 1.6E-31 | 1E-28 | DOWN | 3.23 | 3.2E-07 | 0.00017 |
| Regulation of response to stimulus (GO:0048583) | UP | 1.91 | 1.8E-17 | 2.6E-14 | DOWN | 1.79 | 1.3E-28 | 5.8E-26 | DOWN | 1.61 | 2.2E-06 | 0.00072 |
| Actin cytoskeleton organization (GO:0030036) | DOWN | 3.17 | 4.6E-08 | 7.3E-06 | DOWN | 3.91 | 4.9E-28 | 1.9E-25 | DOWN | 3.26 | 7.9E-07 | 0.00034 |
| Cell adhesion (GO:0007155) | UP | 2.92 | 3.9E-12 | 1.5E-09 | DOWN | 3.1 | 1.8E-27 | 6.6E-25 | DOWN | 2.99 | 1.1E-08 | 1.9E-05 |
| Biological adhesion (GO:0022610) | UP | 2.94 | 2E-12 | 8.2E-10 | DOWN | 3.06 | 4.9E-27 | 1.6E-24 | DOWN | 2.95 | 1.4E-08 | 2E-05 |
| Angiogenesis (GO:0001525) | UP | 4.5 | 4.9E-12 | 1.8E-09 | DOWN | 4.87 | 4.9E-27 | 1.6E-24 | DOWN | 4.17 | 3.7E-07 | 0.00019 |
| Animal organ development (GO:0048513) | UP | 2.03 | 8.4E-17 | 7.4E-14 | DOWN | 1.84 | 1.3E-23 | 3.3E-21 | DOWN | 1.78 | 3.4E-07 | 0.00018 |
Additional files
-
Supplementary file 1
rs7312625 motif analysis +- 30 bp.
Changed motifs in red.
- https://cdn.elifesciences.org/articles/80317/elife-80317-supp1-v2.xlsx
-
Supplementary file 2
DESeq2 result WT vs Tbx5RE(int)KO adult left atria.
- https://cdn.elifesciences.org/articles/80317/elife-80317-supp2-v2.xlsx
-
Supplementary file 3
DESeq2 result WT vs Tbx5RE(down)KO adult left atria.
- https://cdn.elifesciences.org/articles/80317/elife-80317-supp3-v2.xlsx
-
Supplementary file 4
RNAseq comparison of Tbx5RE(down)KO and Tbx5G125R/+ adult left atria.
- https://cdn.elifesciences.org/articles/80317/elife-80317-supp4-v2.xlsx
-
Supplementary file 5
RNAseq comparison of Tbx5RE(down)KO and Tbx5iKO adult left atria.
- https://cdn.elifesciences.org/articles/80317/elife-80317-supp5-v2.xlsx
-
Supplementary file 6
DESeq2 result WT vs Double adult left atria.
- https://cdn.elifesciences.org/articles/80317/elife-80317-supp6-v2.xlsx
-
Supplementary file 7
DESeq2 result WT v Prrx1(enh)KO adult left atria.
- https://cdn.elifesciences.org/articles/80317/elife-80317-supp7-v2.xlsx
-
Supplementary file 8
Deletion coordinates in mm10.
- https://cdn.elifesciences.org/articles/80317/elife-80317-supp8-v2.xlsx
-
MDAR checklist
- https://cdn.elifesciences.org/articles/80317/elife-80317-mdarchecklist1-v2.docx
Download links
A two-part list of links to download the article, or parts of the article, in various formats.
Downloads (link to download the article as PDF)
Open citations (links to open the citations from this article in various online reference manager services)
Cite this article (links to download the citations from this article in formats compatible with various reference manager tools)
An atrial fibrillation-associated regulatory region modulates cardiac Tbx5 levels and arrhythmia susceptibility
eLife 12:e80317.
https://doi.org/10.7554/eLife.80317


