Gain-of-function variants in the ion channel gene TRPM3 underlie a spectrum of neurodevelopmental disorders
- Centre de référence des malformations et maladies congénitales du cervelet, Départementde Génétique, APHP, Sorbonne University, France
- Developmental Brain Disorders Laboratory, Imagine Institute, France
- Laboratory of Ion Channel Research, Department of cellular and molecular medicine, University of Leuven, Belgium
- VIB Center for Brain & Disease Research, Belgium
- Laboratory of Endometrium, Endometriosis & Reproductive Medicine, Department Development & Regeneration, University of Leuven, Belgium
- Department of Genetics, University Hospital of Angers, France
- Translational Genomics Research Institute (TGen), Neurogenomics Division, Center for Rare Childhood Disorders, United States
- Charité – Universitäts medizin Berlin, corporate member of Freie Universität Berlin and Humboldt-Universität zu Berlin, Institute of Medical Genetics and Human Genetics, Germany
- Institute of Human Genetics, University Hospital Essen, University Duisburg-Essen, Germany
- University Hospital Southampton NHS Foundation Trust, United Kingdom
- Children's Hospital of Philadelphia, United States
- Wessex Clinical Genetics Service, University Hospital Southampton NHS Foundation Trust, United Kingdom
- Service de Radiologie Pédiatrique, Hôpital Armand-Trousseau, Médecine Sorbonne Université, France
- Institute of Cell Biology and Neurobiology, Charité - Universitäts medizin Berlin, Germany
- Department of Pediatric Neurology, Charité - Universitäts medizin Berlin, Germany
- Charité – Universitäts medizin Berlin, Center for Chronically Sick Children, Germany
- Department of Neuropediatrics, University Hospital of Angers, France
- Department of Pharmacology, Physiology and Neuroscience, Rutgers, The State University of New Jersey, United States
- Division Neuropediatrics, University Hospital Liège, Belgium
- Wessex Regional Genetics Laboratory, Salisbury District Hospital, United Kingdom
- Sorbonne Université, Service de Neuropédiatrie, Hôpital Trousseau AP-HP, France
- Centre de Génétique Humaine, Université de Franche-Comté Besançon, France
- Center of Clinical Investigation 1431, National Institute of Health and Medical Research, France
- Children's Hospital of Eastern Ontario Research Institute, University of Ottawa, Canada
Figures
Figure 1 with 3 supplements
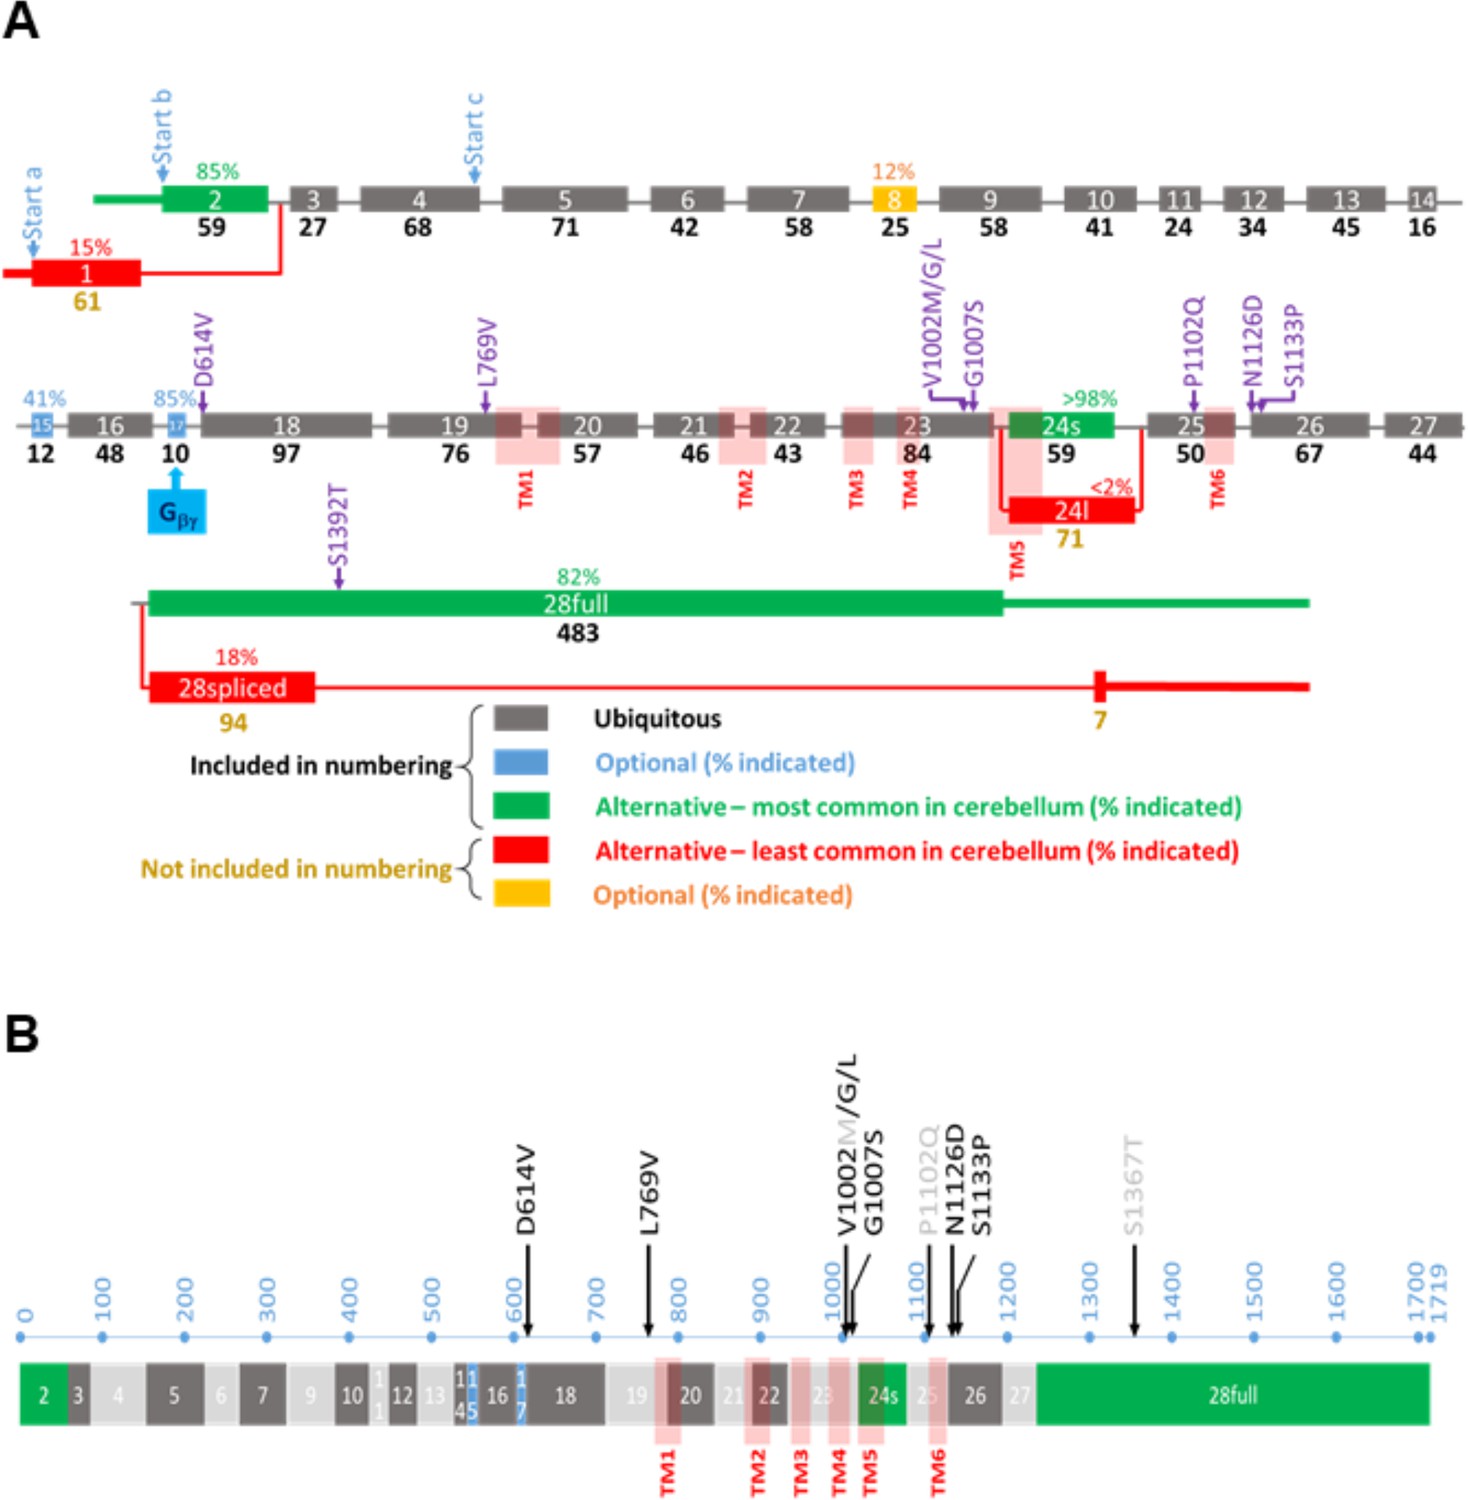
Overview of the TRPM3 gene and location of the different variants.
(A) Exon-intron structure and alternative splicing of TRPM3. Percentages above colored exons indicate the percentage of transcripts that include the indicated exons in human cerebellar RNA-seq analyses. Exons included for numbering of the disease-associated variants are indicated in gray, blue, and green, resulting in the functional channel construct indicated in (B). Variant numbering was based on the amino acid position of the mutated residue in the NM_001366145.2 isoform. See text for more details.
Figure 1—figure supplement 1
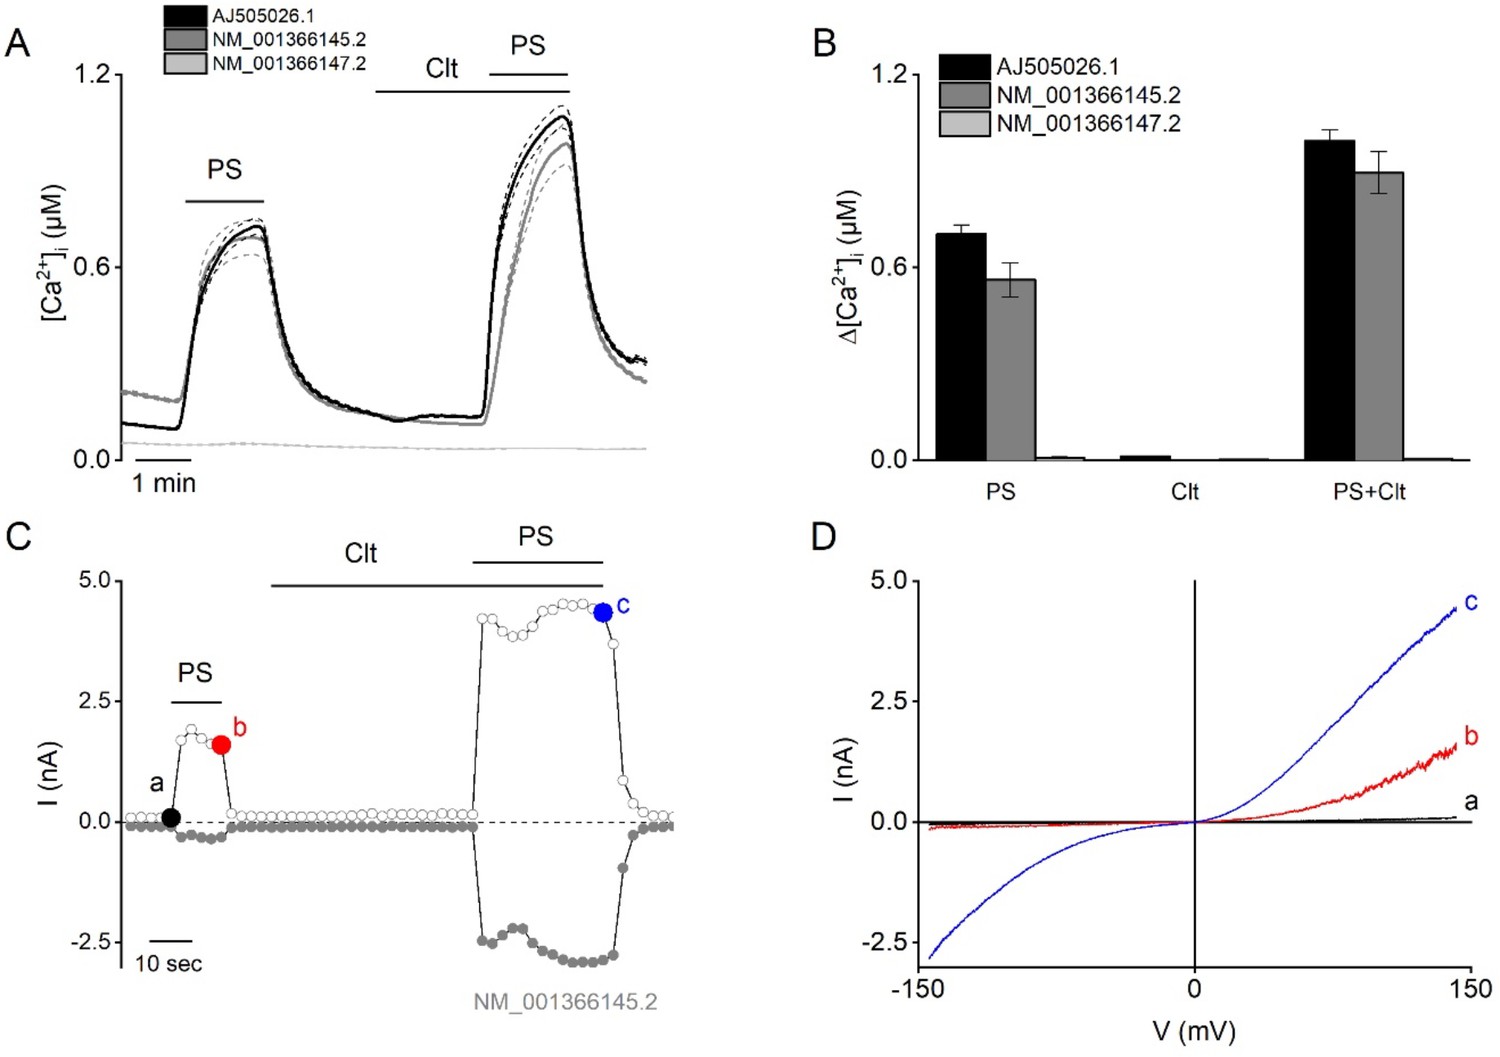
Functional characterization of different human TRPM3 constructs.
(A–B) Three different variants of human TRPM3 (AJ505026.1 black, n=416 cells), NM_001366145.2 (dark gray, n=673), and NM_001366147.2 (light gray, n=644) were functionally characterized via Fura-2 fluorimetric experiments (N≥3 independent experiments). The TRPM3 agonist pregnenolone sulfate (PS; 40 µM) and clotrimazole (Clt; 10 µM) were applied at the indicated time periods. (B) Corresponding calcium amplitudes after stimulation by PS, Clt, and co-application of PS + Clt, represented as mean ± SEM. (C–D) NM_001366145.2 construct was further characterized via whole-cell patch-clamp experiments in HEK293T cells (N=5) after stimulation by PS (40 µM), Clt (10 µM), and co-application PS + Clt. (C) Time course of whole-cell patch clamp recording at holding of +150 mV (open circles) and –150 mV (closed circles) of HEK293T cells expressing the TRPM3 NM_001366145.2 construct. (D) Current-voltage relationship of time points indicated in panel (C).
Figure 1—figure supplement 2
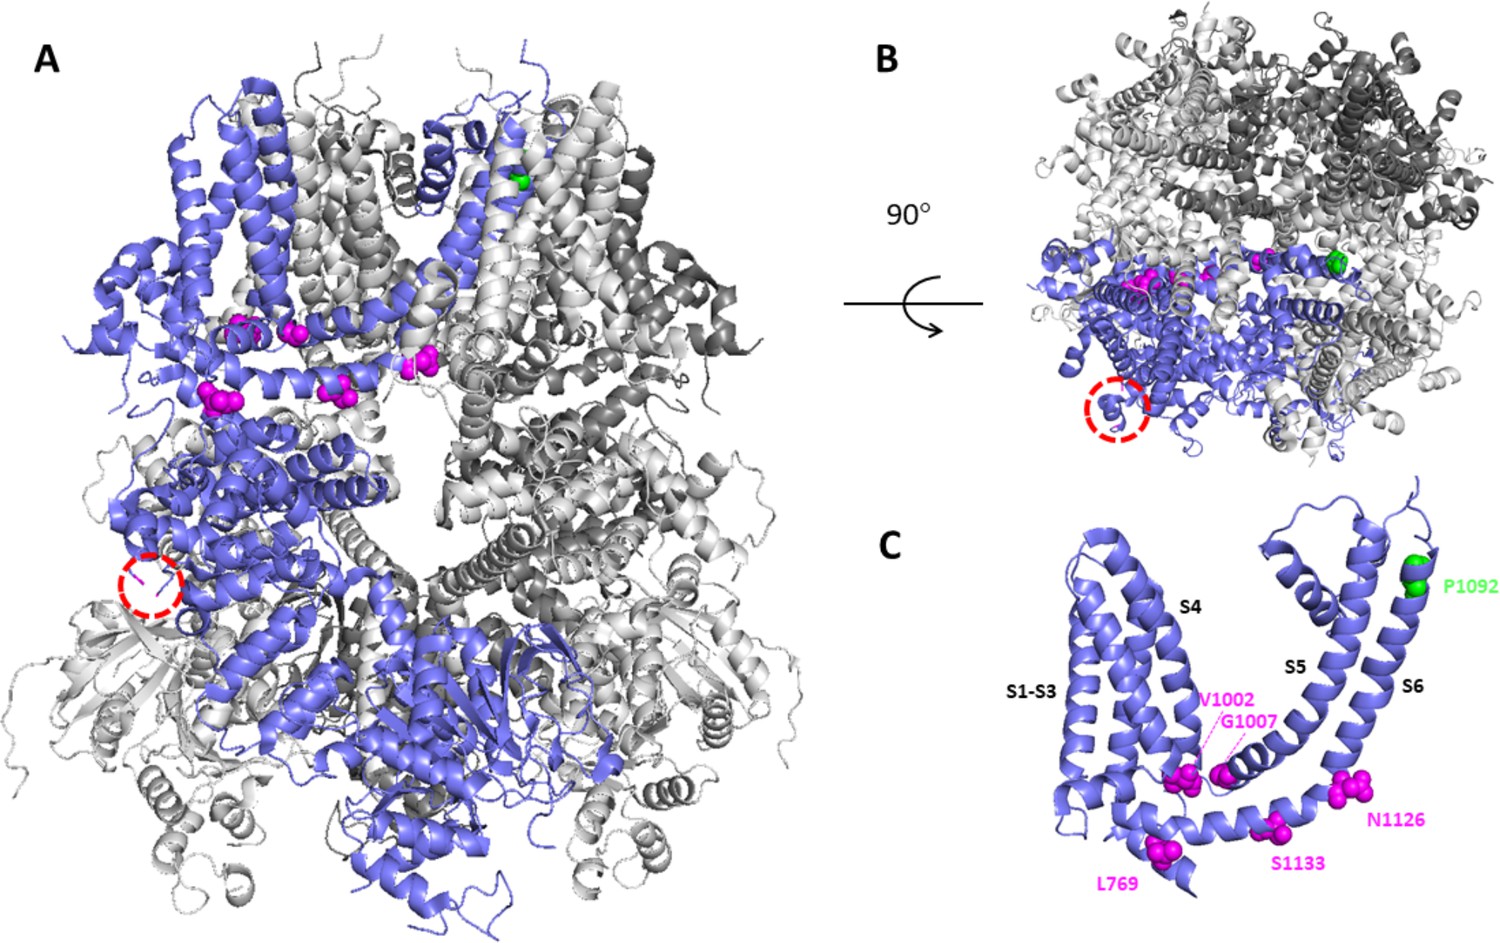
Structural model of TRPM3 based on the cryo-Electron Microscopy (EM) structure (pdb: 8DDQ).
(A–B) Structural model of TRPM3, based on the cryo-EM structure (pdb: 8DDQ), seen from the side (A) and the top (B), indicating residues that are altered in the disease-associated variants. In one of the four subunits (blue), the red circled area indicates the location of the non-resolved loop where D694 is located, close to the interaction site of Gβγ. Other affected residues are indicated in magenta and green. (C) A cluster of disease-associated residues (magenta) is localized at the interface between transmembrane domain and cytosol, whereas P1092 is located at the extracellular part of transmembrane helix S6.
Figure 1—figure supplement 3
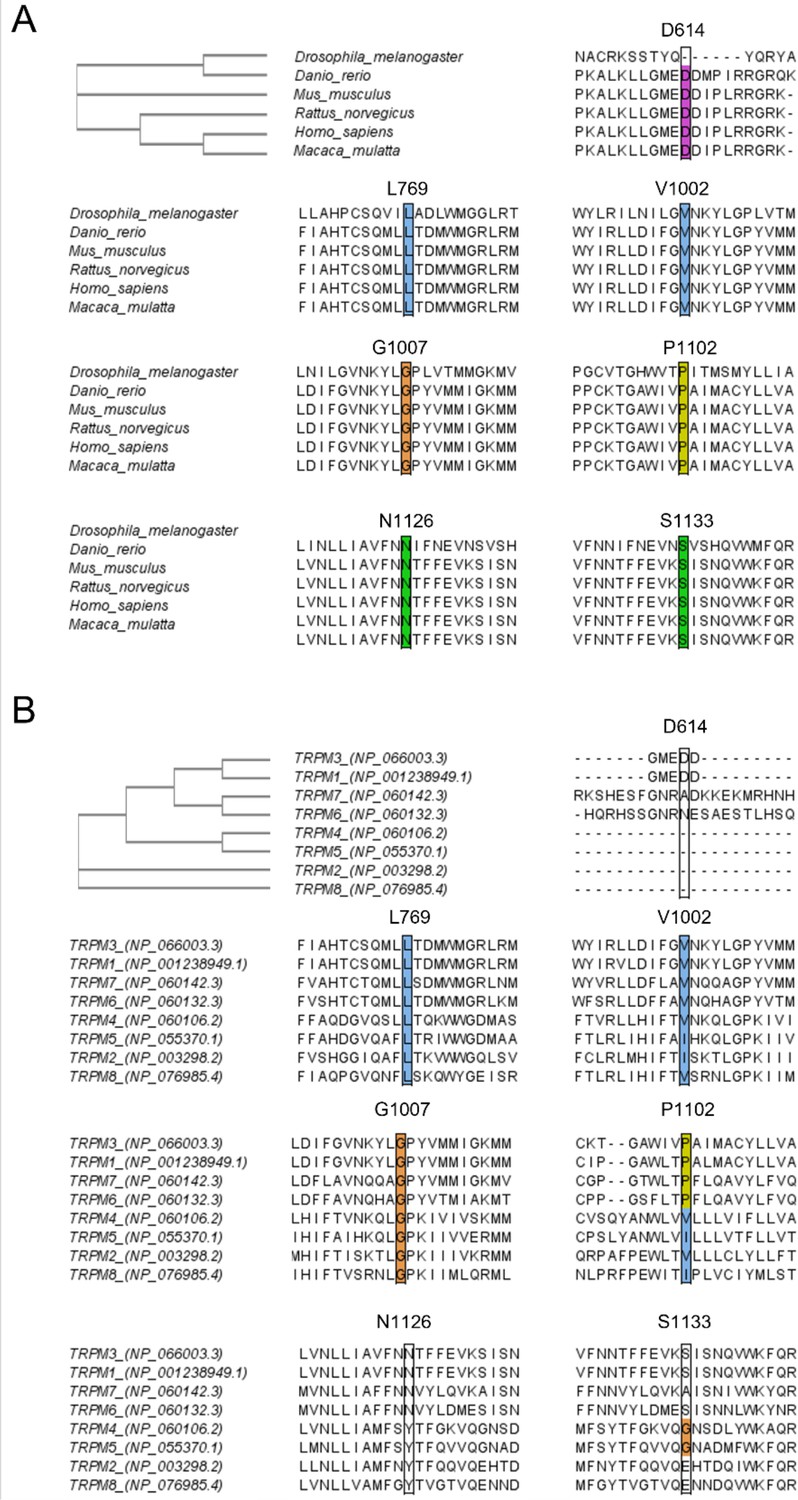
Sequence alignment of TRPM3 with different species and different members of the transient receptor potential (TRP) melastatin (M) family.
CLUSTAL Omega (1.2.4) multiple sequence alignment was used to perform the alignment and to obtain the Phylogenetic Tree as shown on the left top. Sequence alignment at positions D614, L769, V1002, G1007, P1102, N1126, and S1133 is conserved across multiple species (A) and conserved across related members of the TRPM family (B).
Figure 2 with 1 supplement

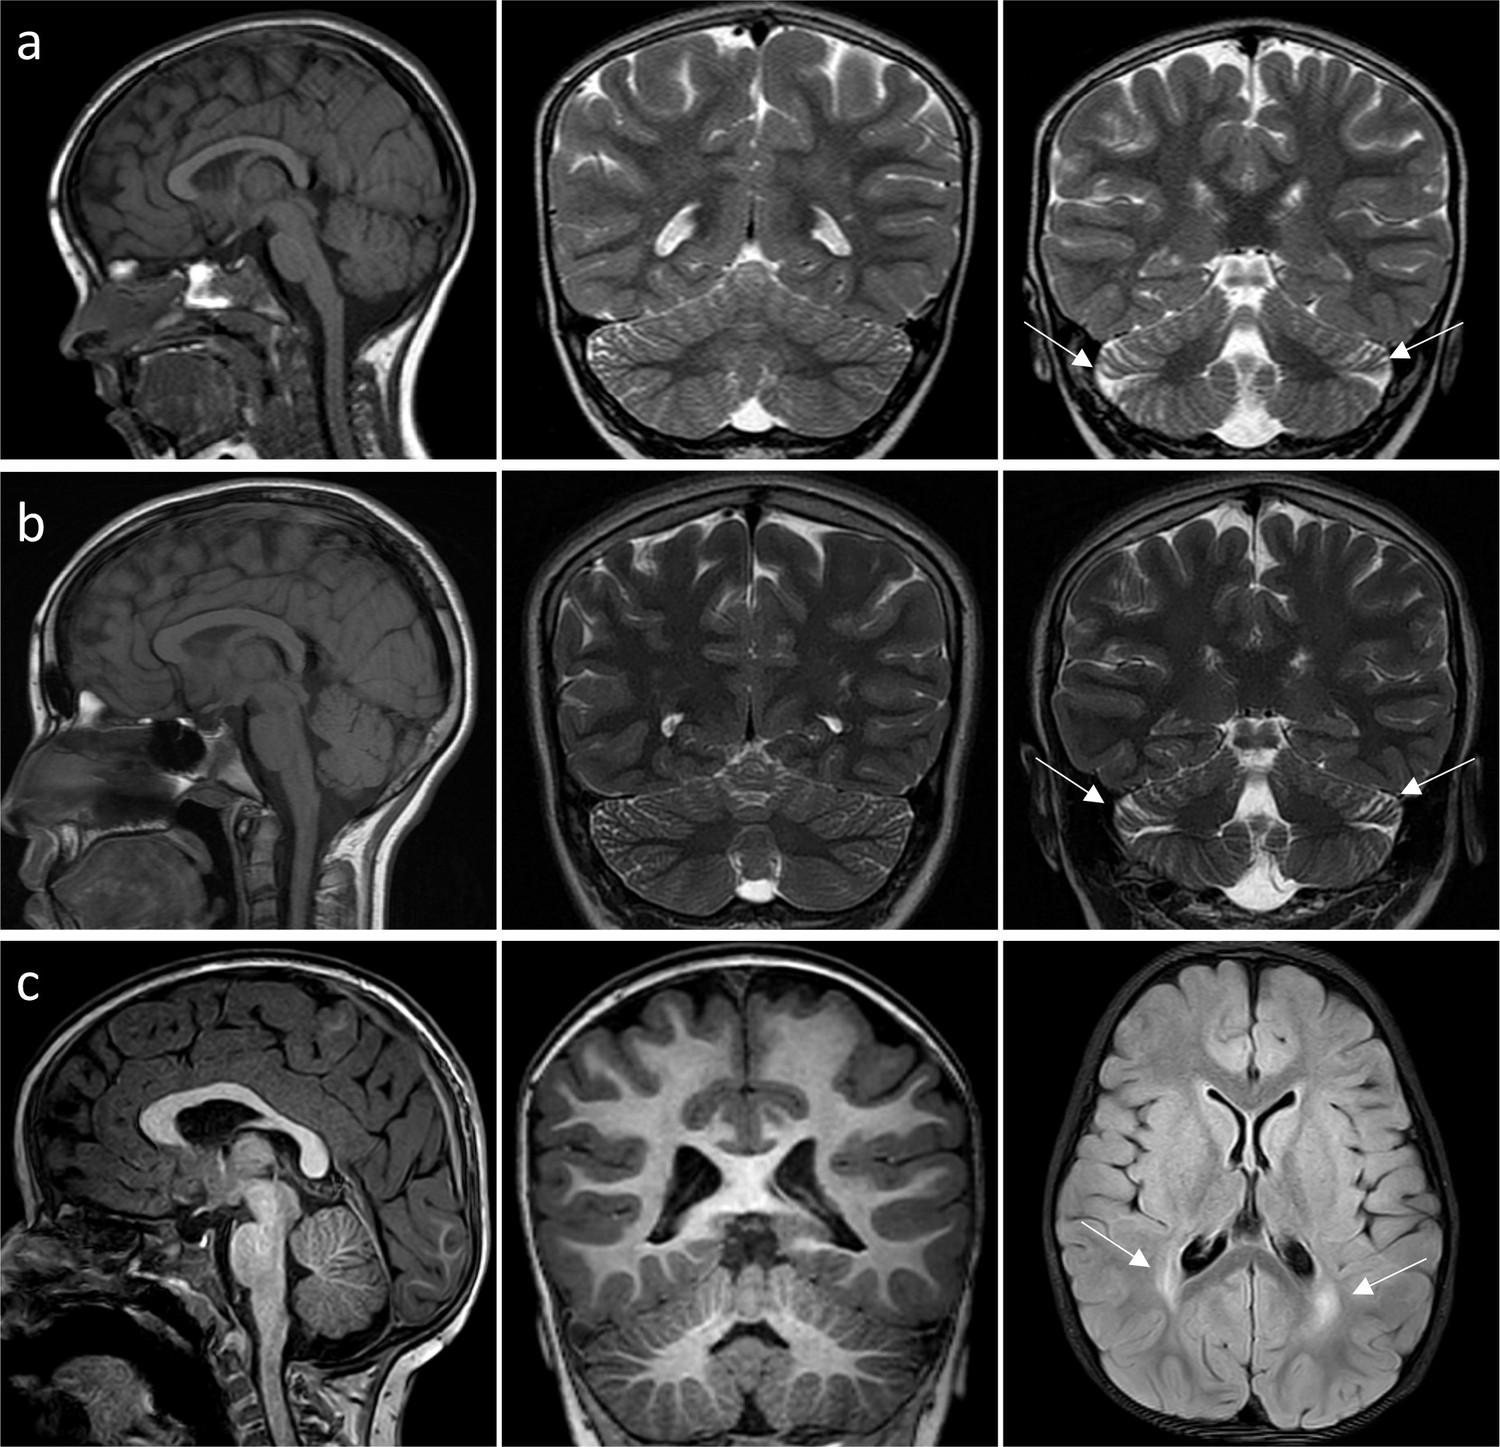
Successive MRI of several patients carrying different TRPM3 variants.
*Normal MRI: the fissures of the vermis and cerebellar hemispheres are nearly virtual. (a–i) MRI of the patients showing variable widening of the cerebellar fissures (arrows) reflecting cerebellar (vermis and/or hemispheres) atrophy. (a–d) Patient 1, MRI at 3 years 8 months showing slight atrophy of the vermis (a-sagittal T1) and cerebellar hemispheres (B-coronal T1); and majoration of the atrophy at 10 years (c-sagittal T1 and d-coronal T2), (e–f) Patient 3; MRI at 8 years 6 months: severe atrophy of the vermis (arrow) and brainstem (star), and atrophy of the cerebellar hemispheres (sagittal and coronal T1). (g–j) successive MRIs in patient showing progressive atrophy (g: 2 years 2 months; h: 6 months; i–j: 4 years 2 months). (k and l) Patient 4; MRI at 1 years 4 months: small vermis, thin brainstem (star) and atrophy of the cerebellar hemispheres (sagittal and coronal T1).
Figure 2—figure supplement 1
MRI of patient 7 and patient 8.
(a–b) Patient 7, very mild and localized atrophy of the cerebellar hemispheres (arrows), stable (2 years 10 months (a); 12 years 1 month (b)). (c) Patient 8, normal posterior fossa at age of 3 years; non-specific bilateral symmetric periventricular white matter hyperintensities on FLAIR axial MRI (arrows).
Figure 3 with 4 supplements
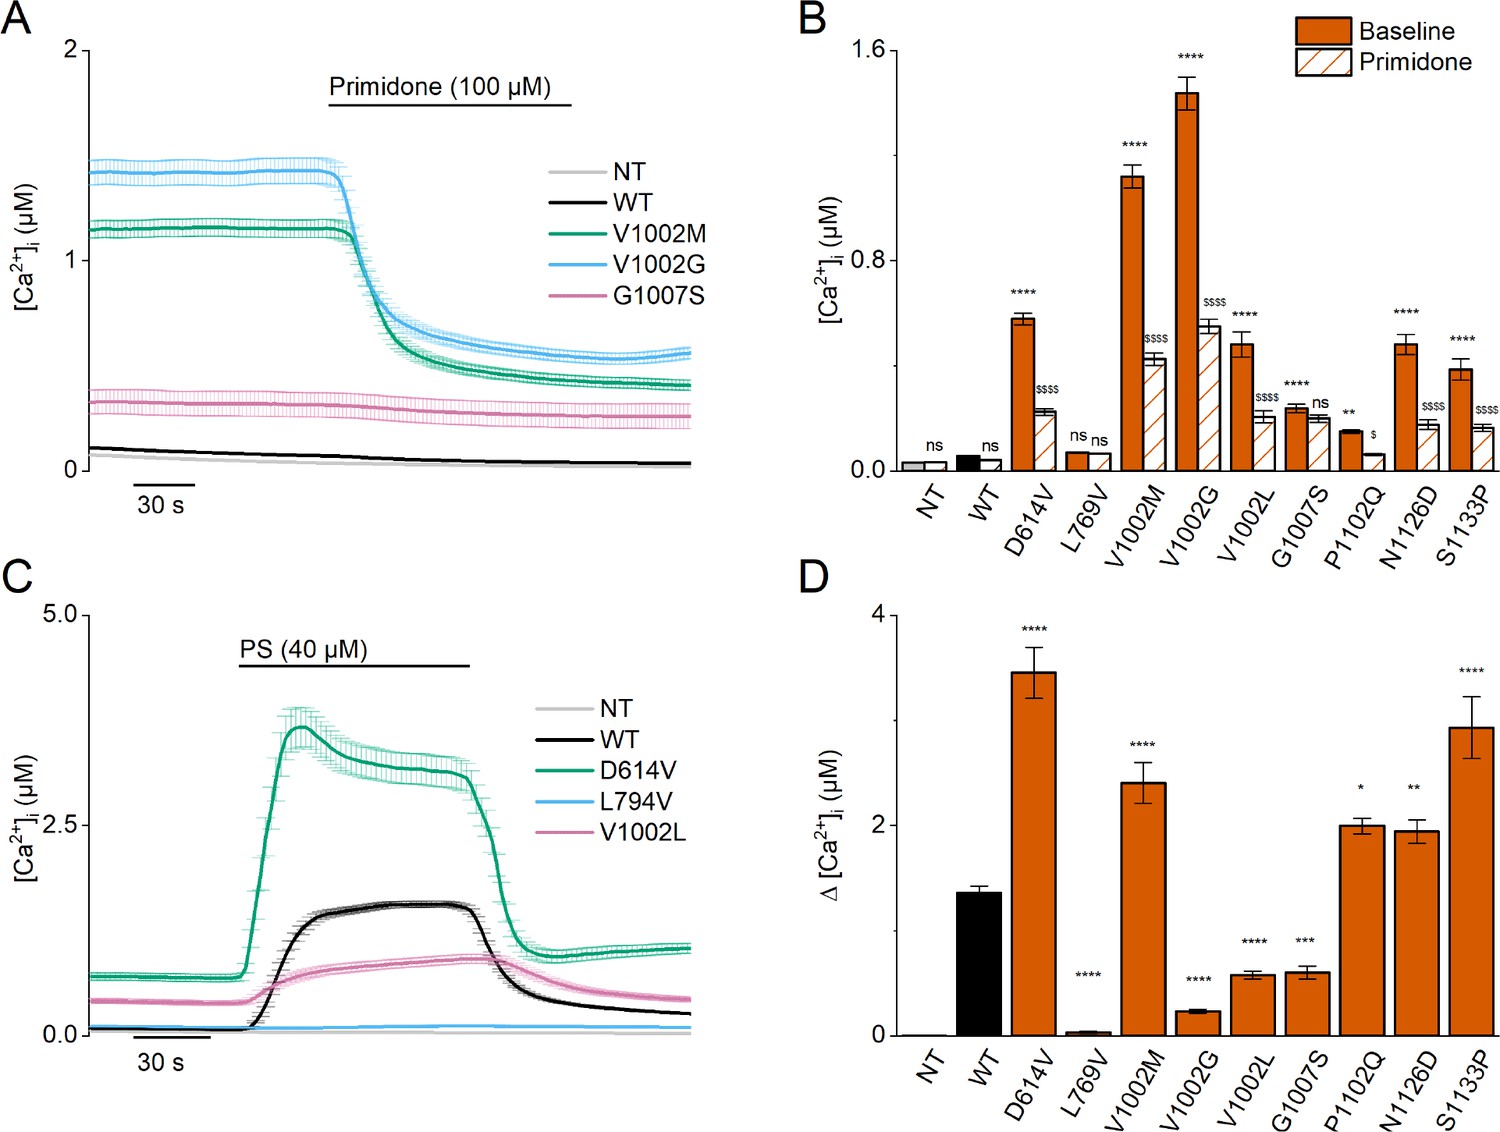
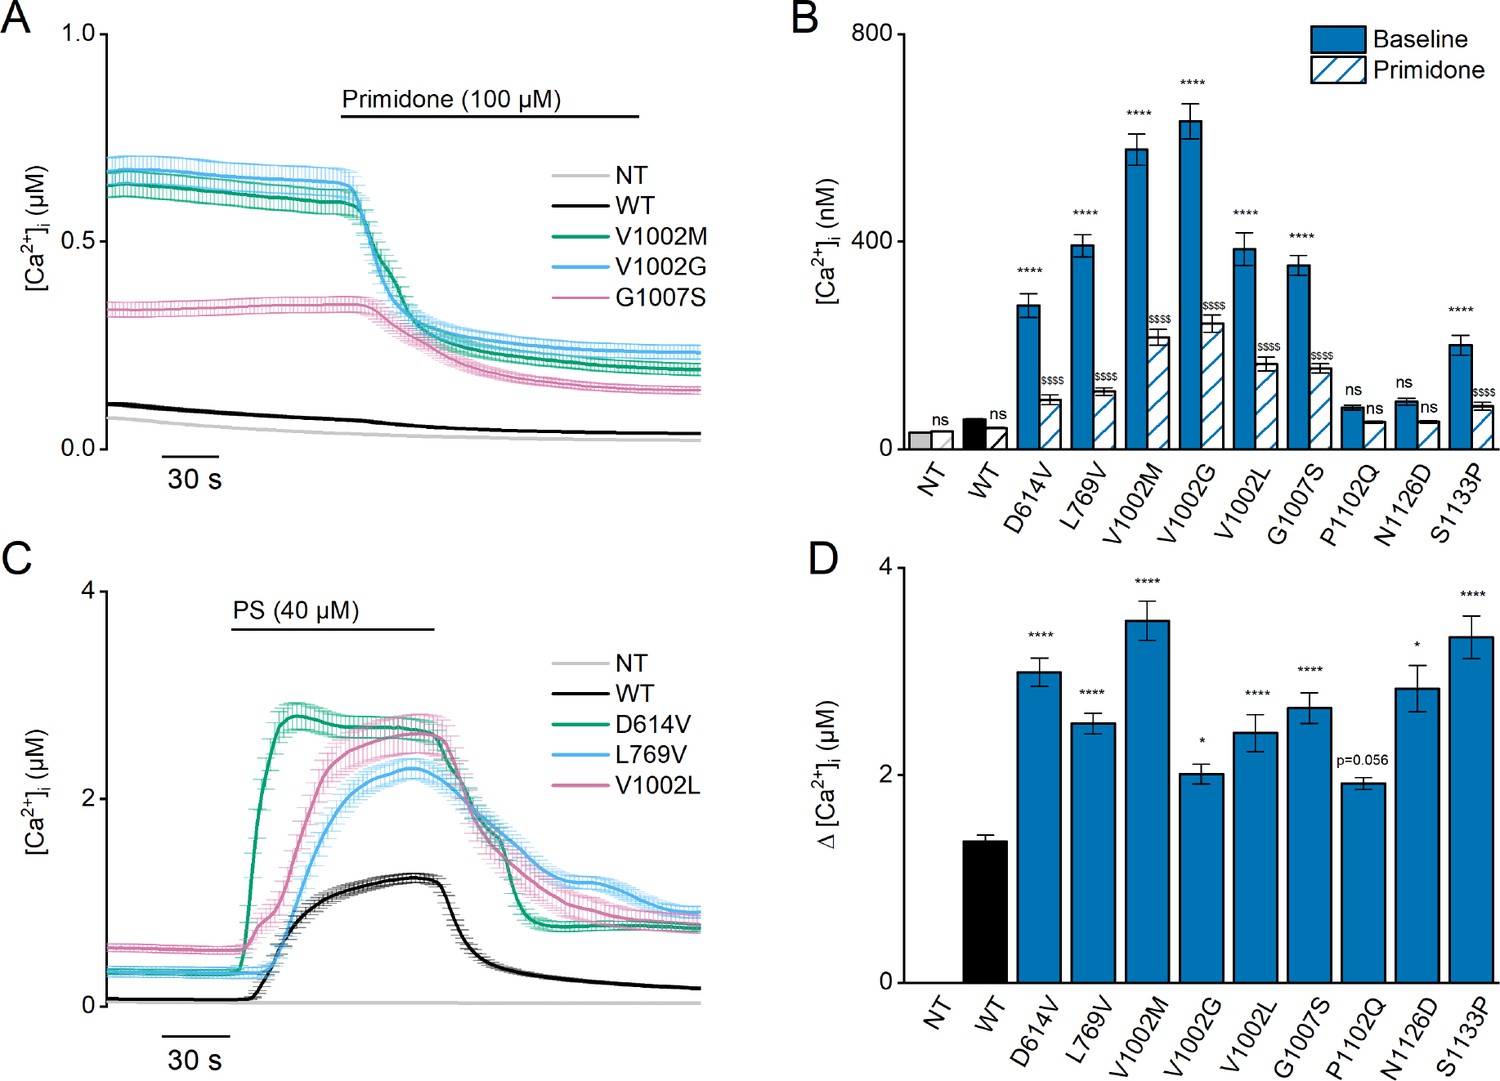
Homozygous mutant expression in HEK293T cells.
(A) Time course of intracellular calcium concentrations ([Ca2+]i) (± SEM) upon application of the TRPM3 inhibitor primidone (100 µM) for wild-type (WT; black; n=449), and homozygous V1002M (green; n=271), V1002G (blue; n=257), and G1007S (red; n=409) transfected HEK293T cells, and non-transfected (NT; gray; n=982; N=3 independent measurements). (B) Mean basal intracellular calcium concentrations, [Ca2+]I, in the absence (full bars) and presence of primidone (100 µM; striped bars). Data are represented as mean ± SEM, using a two-way ANOVA with Sidak’s posthoc test. p-Values of baseline vs WT: NT (p=0.8376), D614V (p<0.0001), L794V (p>0.9999), V1002M (p<0.0001), V1002G (p<0.0001), V1002L (p<0.0001), G1007S (p<0.0001), P1102Q (p=0.0018), N1126D (p<0.0001), S1133P (p<0.0001); p-values baseline vs primidone: NT (p>0.9999), WT (p=0.9994), D614V (p<0.0001), L794V (p>0.9999), V1002M (p<0.0001), V1002G (p<0.0001), V1002L (p<0.0001), G1007S (p=0.5663), P1102Q (p=0.0138), N1126D (p<0.0001), S1133P (p<0.0001). (C) Time course of [Ca2+]I (± SEM) for WT (black) (n=243), D614V (green) (n=220), L794V (blue) (n=420) and V1002L (red) (n=264) transfected HEK293T cells, and non-transfected (NT; gray) (n=452) upon application of pregnenolone sulfate (PS; 40 µM) (N=3 independent measurements). (D) Corresponding calcium amplitudes of the PS response, represented as mean ± SEM, using a Kruskal-Wallis ANOVA with Dunnett’s posthoc test (p-values vs WT: D614V (p<0.0001), L794V (p<0.0001), V1002M (p<0.0001), V1002G (p<0.0001), V1002L (p<0.0001), G1007S (p=0.0006), P1102Q (p=0.0102), N1126D (p=0.0098), S1133P (p<0.0001)). For these experiments, the isoform corresponding to GenBank AJ505026.1 was used.
Figure 3—figure supplement 1
Elevated basal activity in HEK293T cells expressing TRPM3 variants.
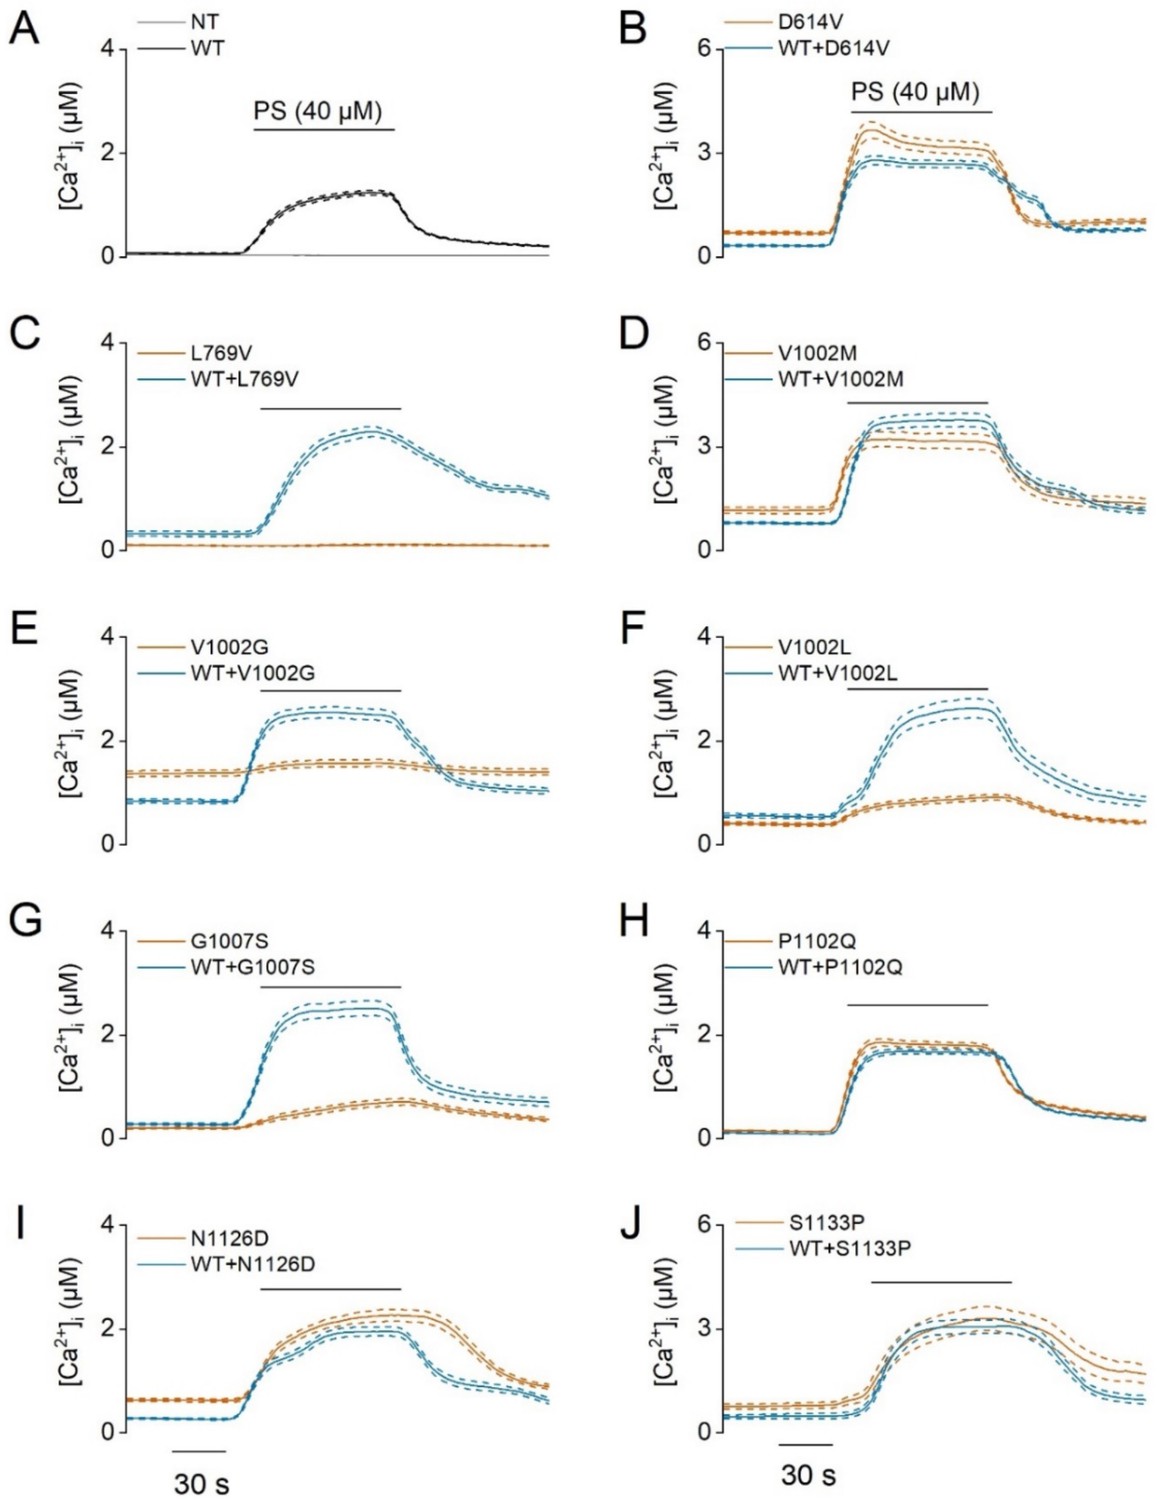
Time course of intracellular calcium concentrations, [Ca2+]I ± SEM upon application of the TRPM3 inhibitor primidone (100 µM) in homozygous (orange) and heterozygous (blue) transfected HEK293T cells. Cells were transfected with (A) TRPM3 wild-type (WT) and non-transfected cells (NT), and the TRPM3 variant D614V (B), L769V (C), V1002M (D), V1002G (E), V1002L (F), G1007S (G), P1102Q (H), N1126D (I) and S1133P (J) (N=3 independent experiments). For these experiments, the isoform corresponding to GenBank AJ505026.1 was used.
Figure 3—figure supplement 2
PS-induced calcium influxes in TRPM3-developmental and epileptic encephalopathy (DEE) mutants.
Time course of intracellular calcium concentrations, [Ca2+]i ± SEM upon application of the pregnenolone sulfate (PS; 40 µM) in homozygous (orange) and heterozygous (blue) transfected HEK293T cells. Cells were transfected with (A) TRPM3 wild-type (WT, black) and non-transfected cells (NT, gray), the TRPM3 variant D614V (B), L769V (C), V1002M (D), V1002G (E), V1002L (F), G1007S (G), P1102Q (H), N1126D (I) and S1133P (J) (N=3 independent experiments). For these experiments, the isoform corresponding to GenBank AJ505026.1 was used.
Figure 3—figure supplement 3
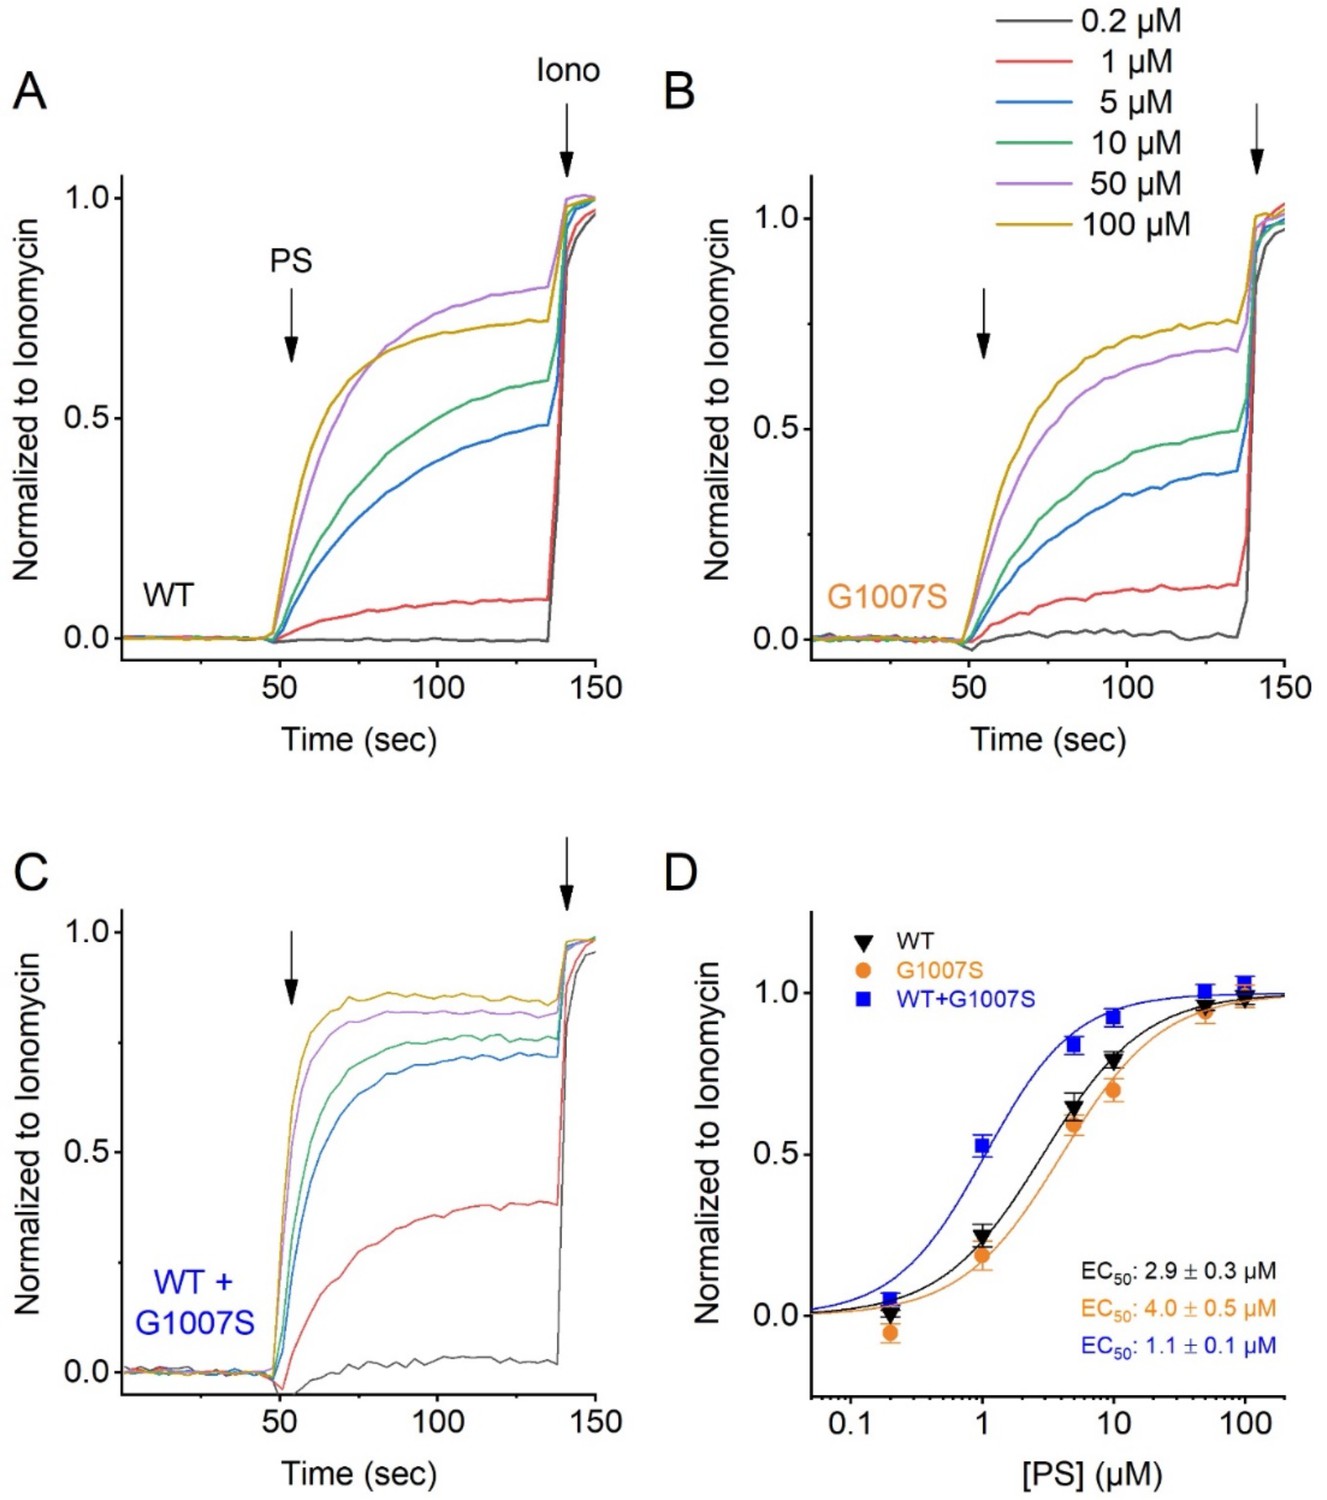
Pregnenolone Sulfate dose dependency of the TRPM3 variant G1007S.
HEK293T cells were transfected with TRPM3 or its mutant G1007S, or a 1:1 ratio of mutant and wild-type TRPM3 plus the calcium sensor GCaMP6. Fluorescence was measured in a 96-well plate reader (Flexstation-3). (A–C) Representative fluorescence traces of wild-type TRPM3 (A), the G1007S mutant (B), co-transfection of TRPM3 and G1007S (1:1 ratio) (C). The applications of various concentrations of PS and ionomycin (Iono; 2 µM) are indicated by the arrows. Basal fluorescence was subtracted and PS-induced Ca2+ signals were normalized to the signal after applying ionomycin. Each single trace shows the average of four replicates from the same transfection. (D) Hill 1 fits of the PS dose dependency of the TRPM3 mutant G1007S. Symbols represent Mean ± SEM from 3 independent experiments. For these experiments, the isoform corresponding to NCBI reference sequence NM_001366141.2 cloned in the pcDNA3.1(+)-N-eGFP vector, was used.
Figure 3—figure supplement 4
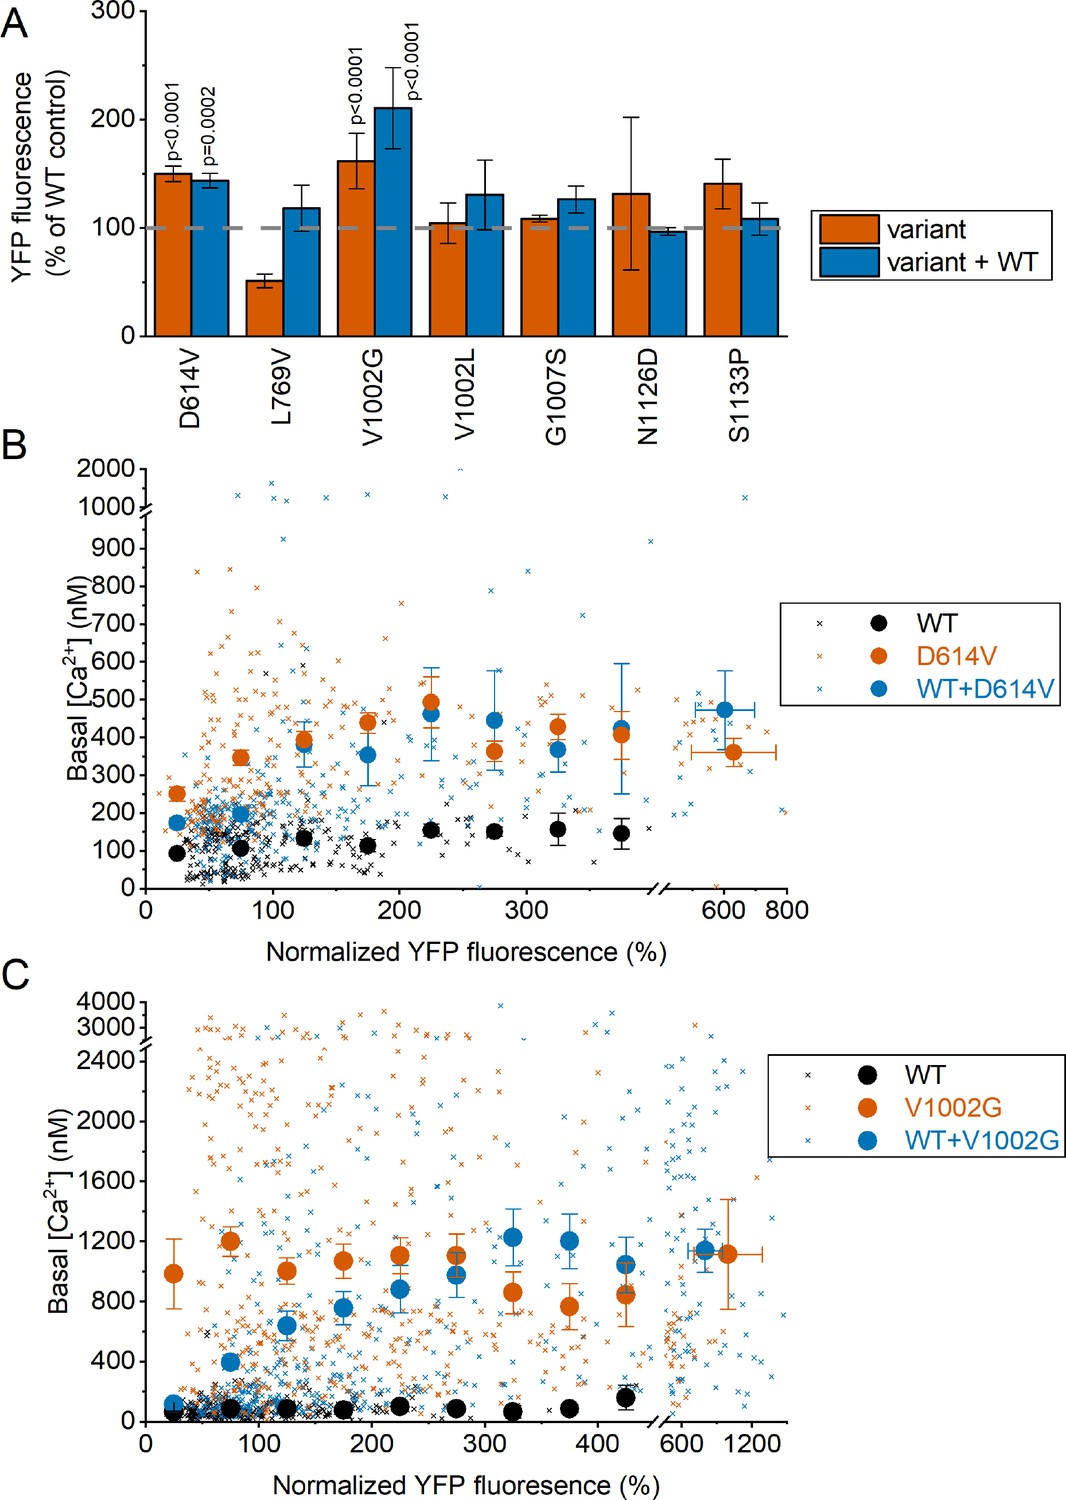
Fluorescence Intensity of channel-linked yellow fluorescence protein (YFP) in cells expressing WT TRPM3 and TRPM3 variants.
(A) YFP fluorescence in HEK293T cells expressing the indicated variants, with (1:1) or without co-expression of the WT subunit. Fluorescence values were normalized to the mean YFP fluorescence of cells expressing WT TRPM3 transfected on the same experimental day. A one-way ANOVA with Dunnett’s posthoc test was used and significant p-values are reported on the graph. (B) Scatter plot (small crosses) of basal [Ca2+]i levels vs normalized YFP fluorescence for cells expressing WT TRPM3, D614V, and WT + D614V. The large filled symbols show the mean basal [Ca2+]i levels for pooled cells with similar YFP fluorescence. Cells were binned according to YFP fluorescence with a bin width of 50%. All cells with YFP levels higher than the highest bin for WT were pooled in the rightmost bin. (C) Same as (B), but for the V1002G variant. Note that the total amount of DNA used for transfection was identical for all conditions. Symbols represent Mean ± SEM.
Figure 4 with 3 supplements
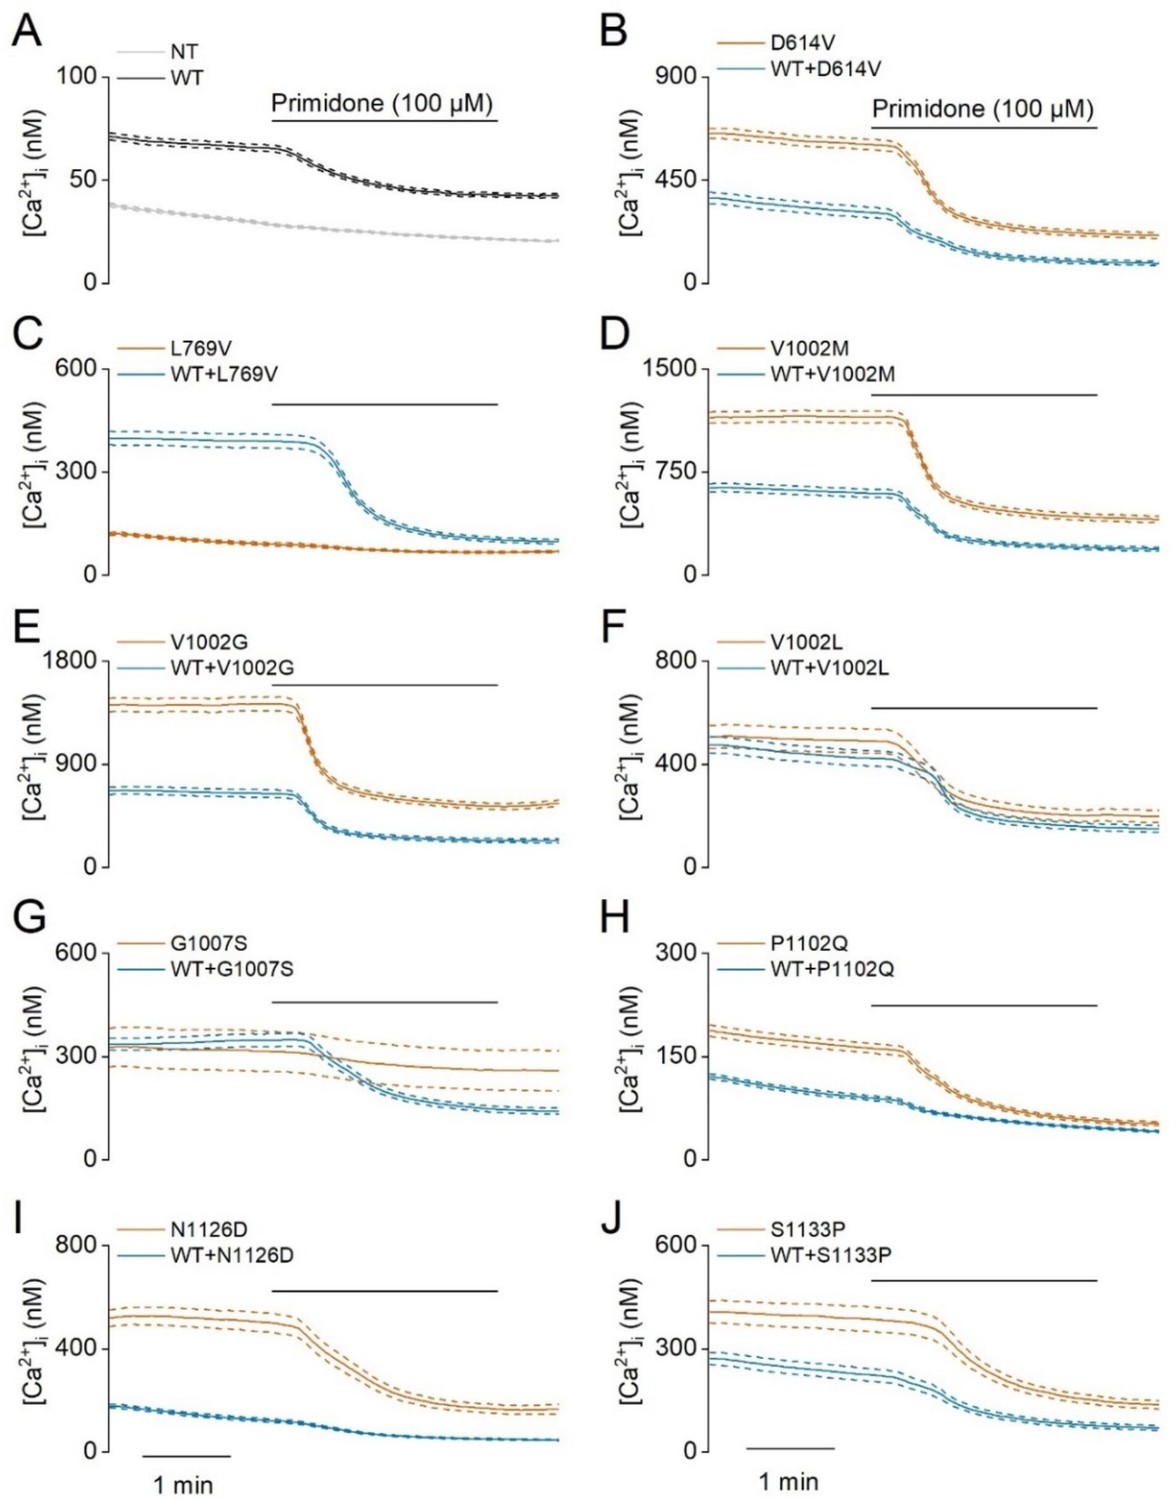
Heterozygous mutant + wild-type (WT) expression in HEK293T cells.
(A) Time course of [Ca2+]I ± SEM upon application of the TRPM3 inhibitor primidone (100 µM) for WT (black; n=449), and heterozygous WT + V1002 M (green; n=373), WT + V1002 G (blue; n=482), and WT + G1007 S (red) (n=561) transfected HEK293T cells, and non-transfected (NT; gray; n=982; N=3 independent measurements). (B) Mean basal [Ca2+]I ± SEM in the absence (full bars) and presence of primidone (striped bars). A two-way ANOVA with Sidak’s posthoc test was used. p-Values of baseline vs WT: NT (p=0.6733), D614V (p<0.0001), L794V (p<0.0001), V1002M (p<0.0001), V1002G (p<0.0001), V1002L (p<0.0001), G1007S (p<0.0001), P1102Q (p=0.9249), N1126D (p=0.5539), and S1133P (p<0.0001); p-Values baseline vs primidone: NT (p>0.9999), WT (p=0.9994), D614V (p<0.0001), L794V (p<0.0001), V1002M (p<0.0001), V1002G (p<0.0001), V1002L (p<0.0001), G1007S (p<0.0001), P1102Q (p=0.8205), N1126D (p=0.5132), and S1133P (p<0.0001). (C) Time course of [Ca2+]I (± SEM) for WT (black; n=243), WT + D614V (green; n=281), WT + L794V (blue; n=497) and WT + V1002L (red; n=276) transfected HEK293T cells, and non-transfected (NT; gray; n=452) upon application of pregnenolone sulfate (PS; 40 µM; N=3 independent measurements). (D) Corresponding calcium amplitudes of the PS response, represented as mean ± SEM, using a Kruskal-Wallis ANOVA with Dunnett’s posthoc test (p-values vs WT: D614V [p<0.0001], L794V [p<0.0001], V1002M [p<0.0001], V1002G [p=0.0155], V1002L [p<0.0001], G1007S [p<0.0001], P1102Q [p=0.0564], N1126D [p=0.0277], and S1133P [p<0.0001]). For these experiments, the isoform corresponding to GenBank AJ505026.1 was used.
Figure 4—figure supplement 1
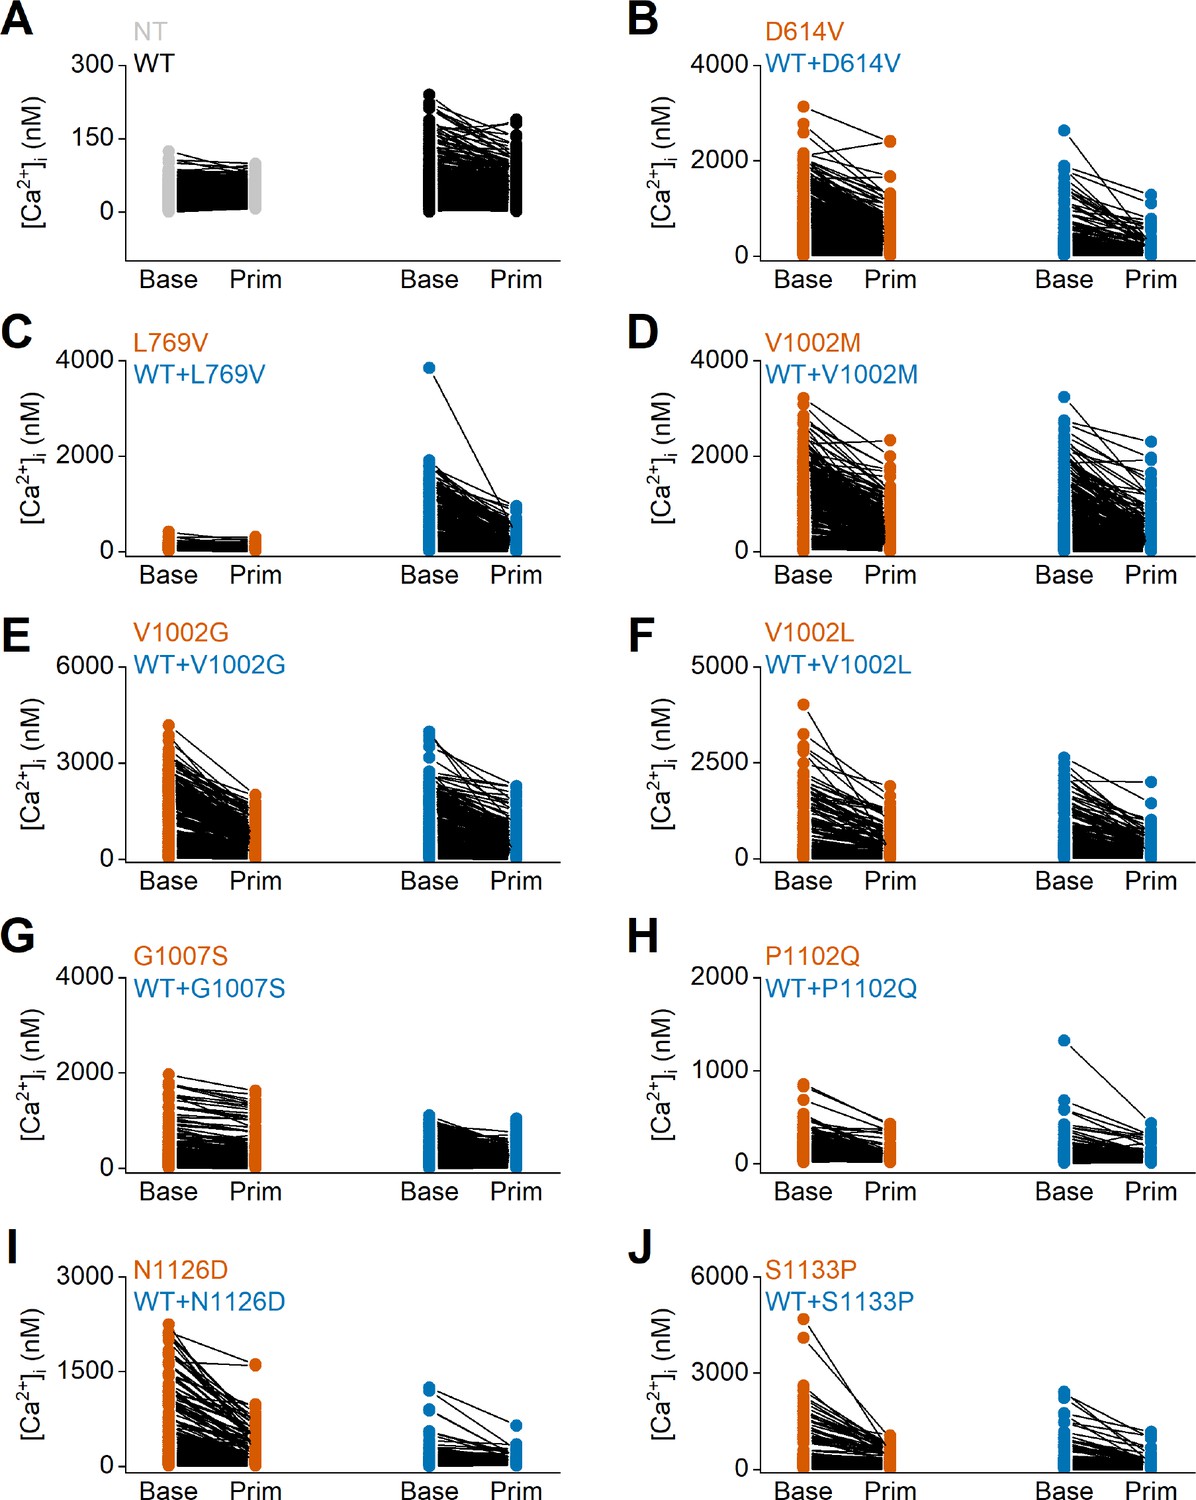
Individual data points of intracellular calcium concentrations at baseline and upon application of the TRPM3 inhibitor primidone.
Time course of intracellular calcium concentrations, [Ca2+]I ± SEM upon application of the pregnenolone sulfate (PS; 40 µM) in homozygous (orange) and heterozygous (blue) transfected HEK293T intracellular calcium concentrations ([Ca2+]I), in the absence (Base) and presence of primidone (Prim; 100 µM). Each individual cells is represented as a single dot, and the same cell is connected with a line before and after the application of primidone. (A) Non-transfected (NT) cells and wild-type (WT) transfected HEK293T cells are represented in gray and black, respectively. (B–J) Homozygous and heterozygous (WT + mutant construct) transfected HEK293T cells are represented in orange and blue, respectively. Including the TRPM3 variant D614V (B), L769V (C), V1002M (D), V1002G (E), V1002L (F), G1007S (G), P1102Q (H), N1126D, (I) and S1133P (J). For these experiments, the isoform corresponding to GenBank AJ505026.1 was used.
Figure 4—figure supplement 2
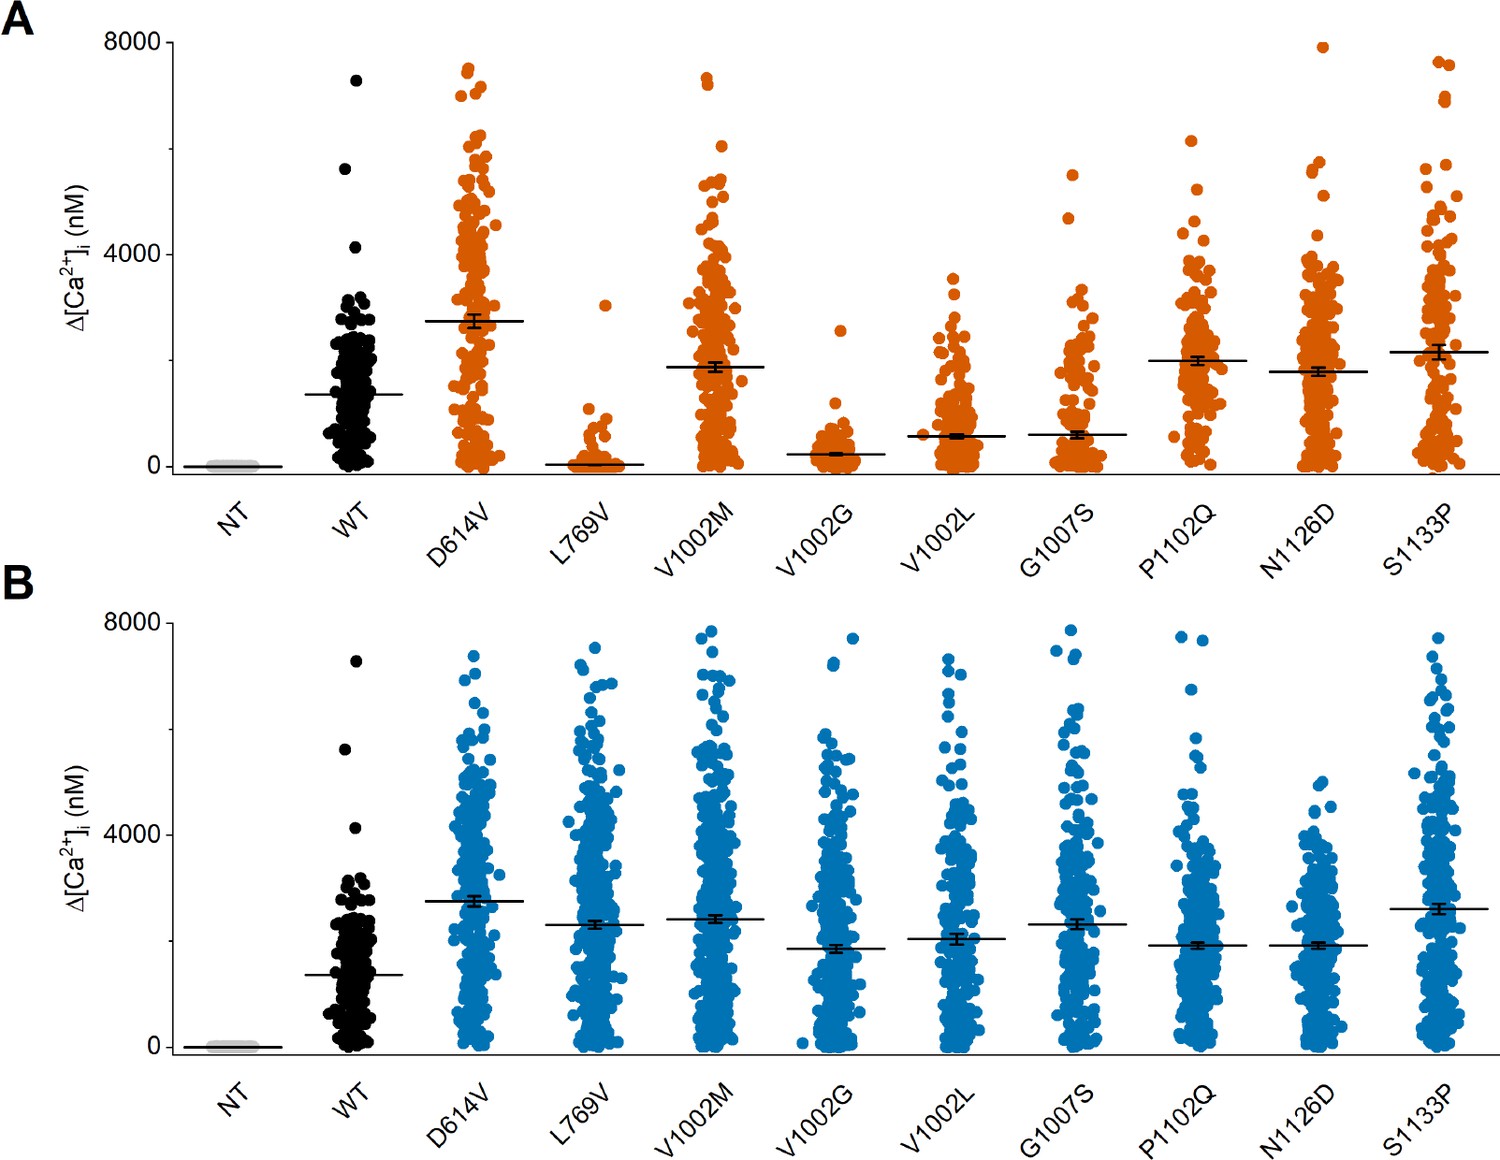
Individual data points of intracellular calcium amplitudes upon application of the TRPM3 agonist pregnenolone sulfate (PS).
Corresponding calcium amplitudes (Δ[Ca2+]I) of the PS responses. Non-transfected (NT) cells and wild-type (WT) transfected HEK293T cells are represented in gray and black, respectively. (A) Homozygous and (B) heterozygous (WT + mutant construct) transfected HEK293T cells are represented in orange and blue, respectively. Each individual cells is represented as a single dot and the line represents mean ± SEM. For these experiments, the isoform corresponding to GenBank AJ505026.1 was used.
Figure 4—figure supplement 3
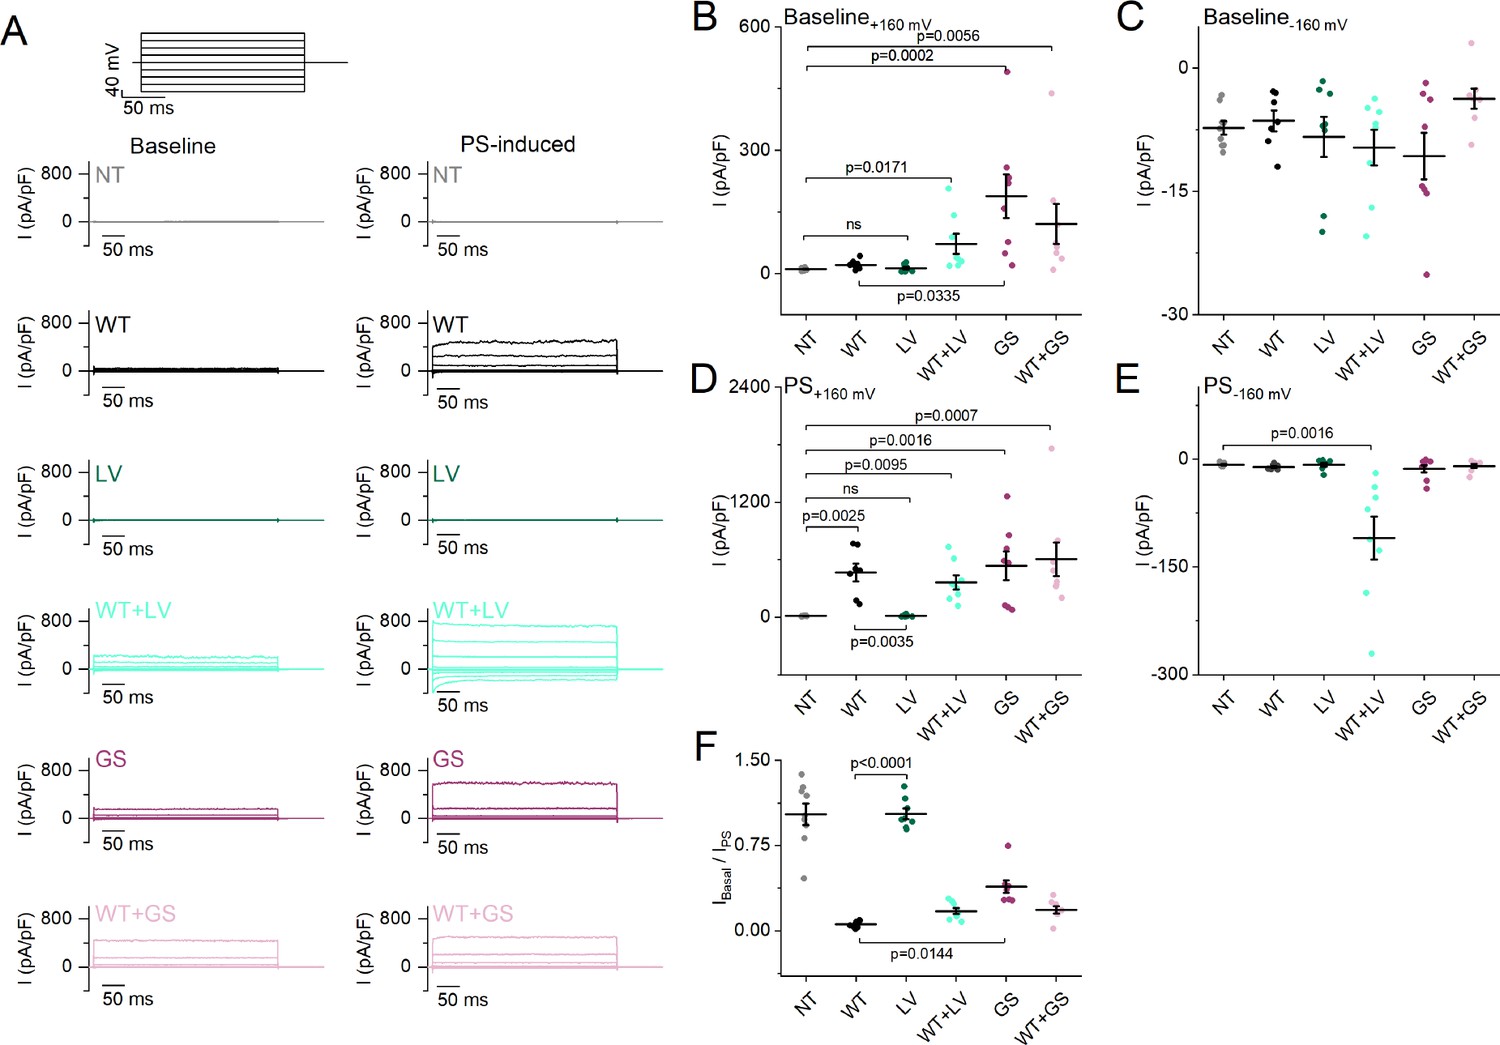
Baseline and pregnenolone sulfate (PS)-induced current densities of the L769V and G1007S substitution.
(A) Representative whole-cell TRPM3 current densities (pA/pF) recorded at baseline without an agonist (left) and during the application of the agonist PS (right) during voltage steps ranging from –160 mV to +160 mV, separated by steps of + 40 mV for non-transfected HEK293T cells (NT), wild-type (WT), L769V (LV), WT + LV, G1007S (GS), and WT + GS transfected HEK293T cells. (B–E) Scatter plot of current densities (pA/pF) for NT, WT, LV, WT + LV, GS, and WT + GS transfected HEK293T cells (N=7 for WT and N=8 for other conditions) without the application of an agonist at + 160 mV (B) and –160 mV (C) and during the application of PS at +160 mV (D) and –160 mV (E). (F) Fraction of current densities (pA/pF) at baseline compared to current densities when the agonist PS was applied (IBaseline/IPS). Data are represented as mean ± SEM, and individual cells are represented as a dot (B–F). A Kruskal-Wallis ANOVA with Dunn’s posthoc test was used. For all plots, relevant p-values are reported on the graphs, and other p-values are reported below. Panel (B) vs NT: WT (p>0.9999), LV (p>0.9999), WT + LV (p=0.0171), GS (p=0.0002), WT + GS (p=0.0056) vs WT: LV (p>0.9999), WT + LV (p=0.5596), and WT + GS (p=0.2871); panel (C) vs NT: WT (p>0.9999), LV (p>0.9999), WT + LV (p>0.9999), GS (p>0.9999), WT + GS (p=0.2326) vs WT: LV (p>0.9999), WT + LV (p>0.9999), GS (p>0.9999), and WT + GS (p>0.9999); panel (D) vs NT: WT (p=0.0025), LV (p>0.9999), WT + LV (p=0.0095), GS (p=0.0016), WT + GS (p=0.0007) vs WT: WT + LV (p>0.9999), GS (p>0.9999), and WT + GS (p>0.9999); panel (E) vs NT: WT (p>0.9999), LV (p>0.9999), WT + LV (p=0.0016), GS (p>0.9999), WT + GS (p>0.9999) vs WT: LV (p=0.8377), WT + LV (p=0.0993), GS (p>0.9999), and WT + GS (p>0.9999); panel (F) vs NT: WT (p<0.0001), LV (p>0.9999), WT + LV (p=0.0010), GS (p=0.2394), WT + GS (p=0.0014) vs WT: WT + LV (p=0.9001), and WT + GS (p=0.7680). For these experiments, the isoform corresponding to GenBank AJ505026.1 was used.
Figure 5 with 2 supplements
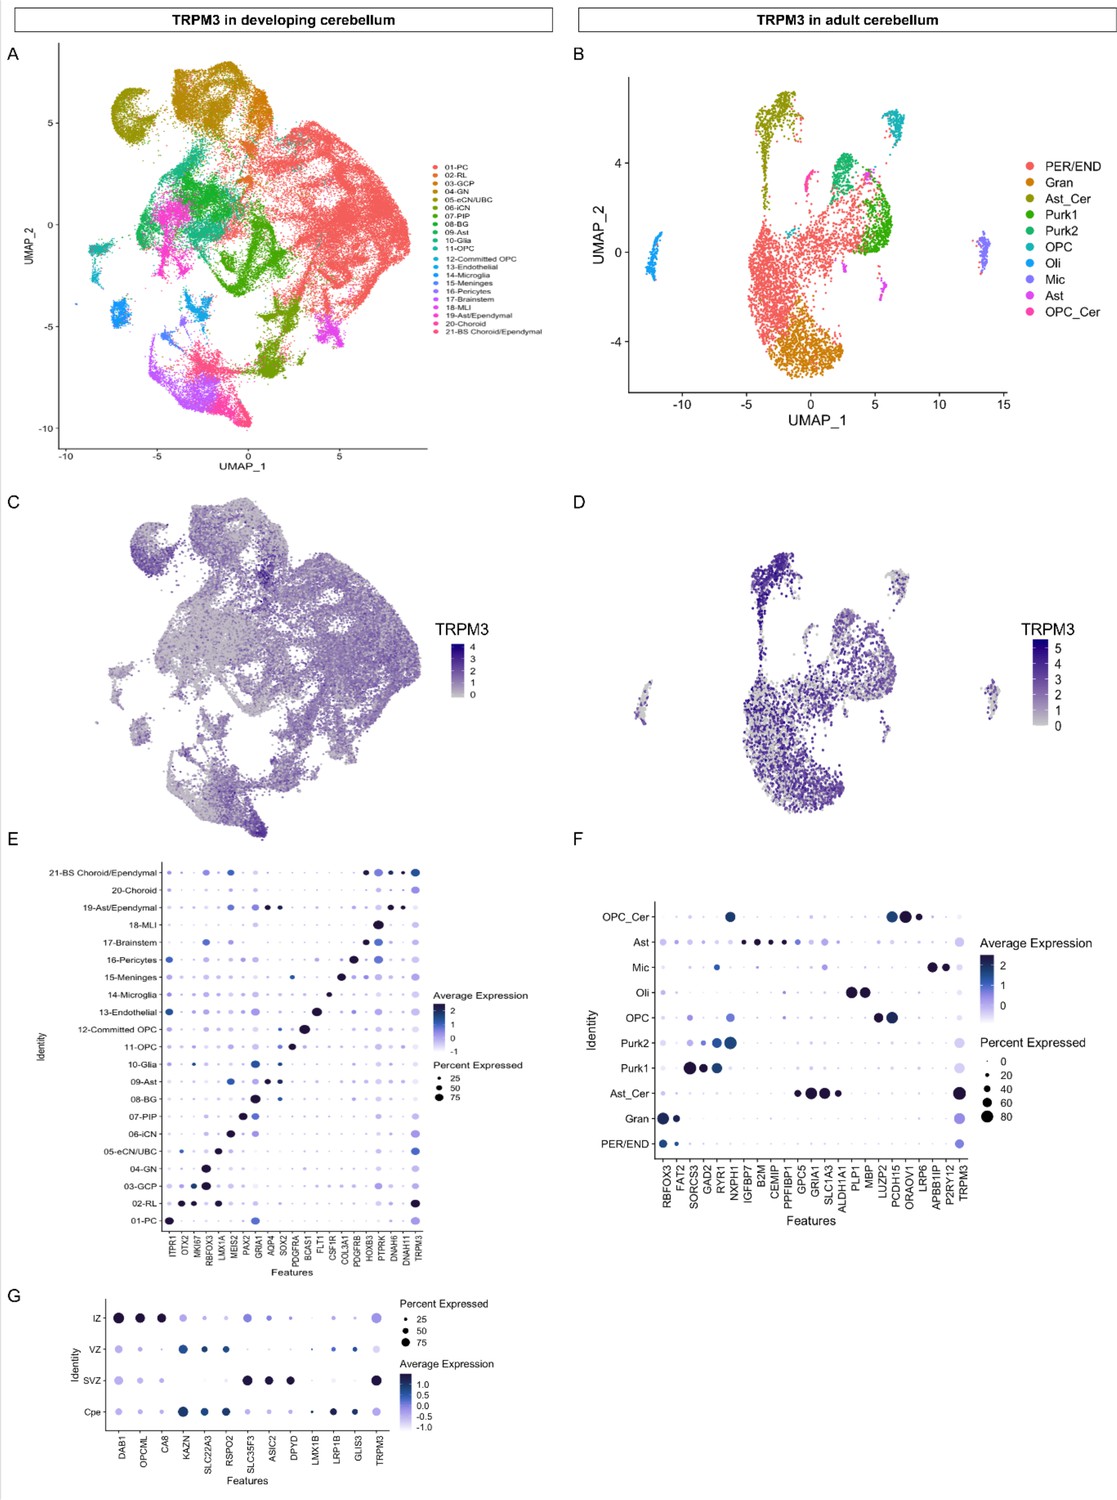
TRPM3 expression in the human cerebellum.
(A and B) Uniform Manifold Approximation and Projection (UMAP) visualization of human cerebellar nuclei annotated on the basis of marker genes for the developing (A) and adult cerebellum (B). (C and D) The same UMAP visualization of human cerebellar nuclei as panel (A) and (B), now representing the expression of TRPM3 for the developing (C) and adult cerebellum (D), respectively. (E and F) Dot plot showing the expression of one selected marker gene per cell type for the developing (E) and adult cerebellum (F). The size of the dot represents the percentage of nuclei within a cell type in which that marker was detected, and its color represents the average expression level. (G) Dot plot showing the expression of one selected marker gene per region of the rhombic lip (RL). Data set of TRPM3 in developing cerebellum adapted from Aldinger et al., 2021. Data set of TRPM3 in adult cerebellum adapted from Lake et al., 2018.
Figure 5—figure supplement 1
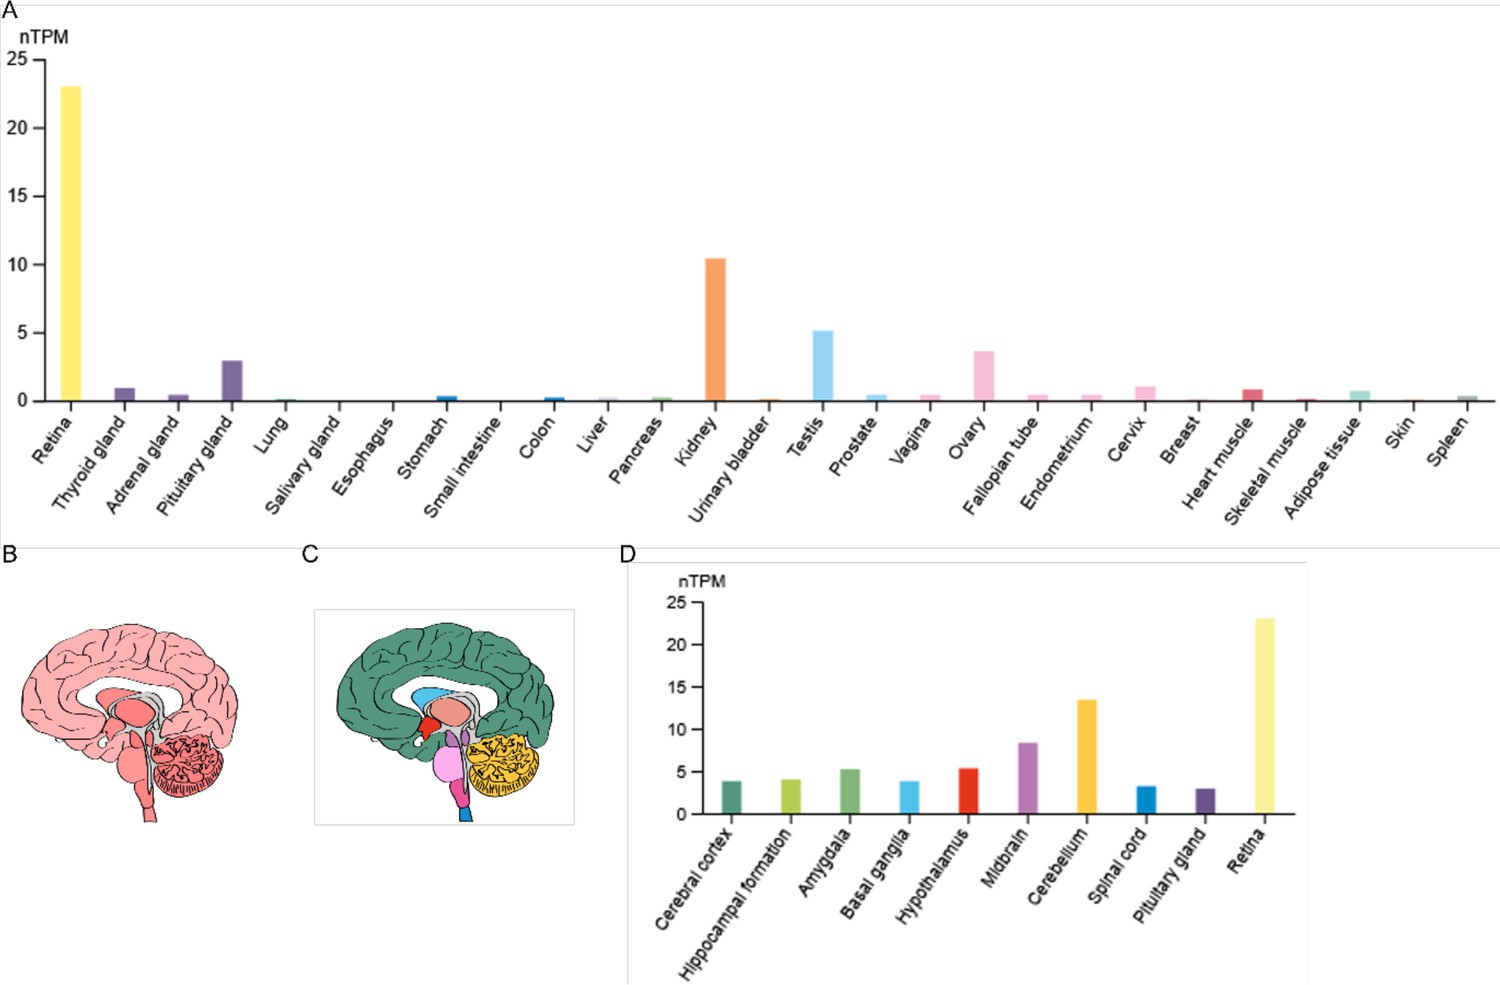
RNA expression of TRPM3 in humans.
(A) RNA-seq tissue data generated by the Genotype-Tissue Expression (GTEx) project, reported as nTPM (normalized protein-coding transcripts per million), corresponding to mean values of the different individual samples from each tissue. (B) Illustration of human brain RNA expression levels, where darker color represents higher expression patterns. (C) Illustration of the human brain, where each color represents a different brain region. (D) GTEx human brain RNA-seq dataset reported as nTPM. Colors correspond to panel (C). Figures were adapted from the human protein atlas (https://www.proteinatlas.org/).
Figure 5—figure supplement 2
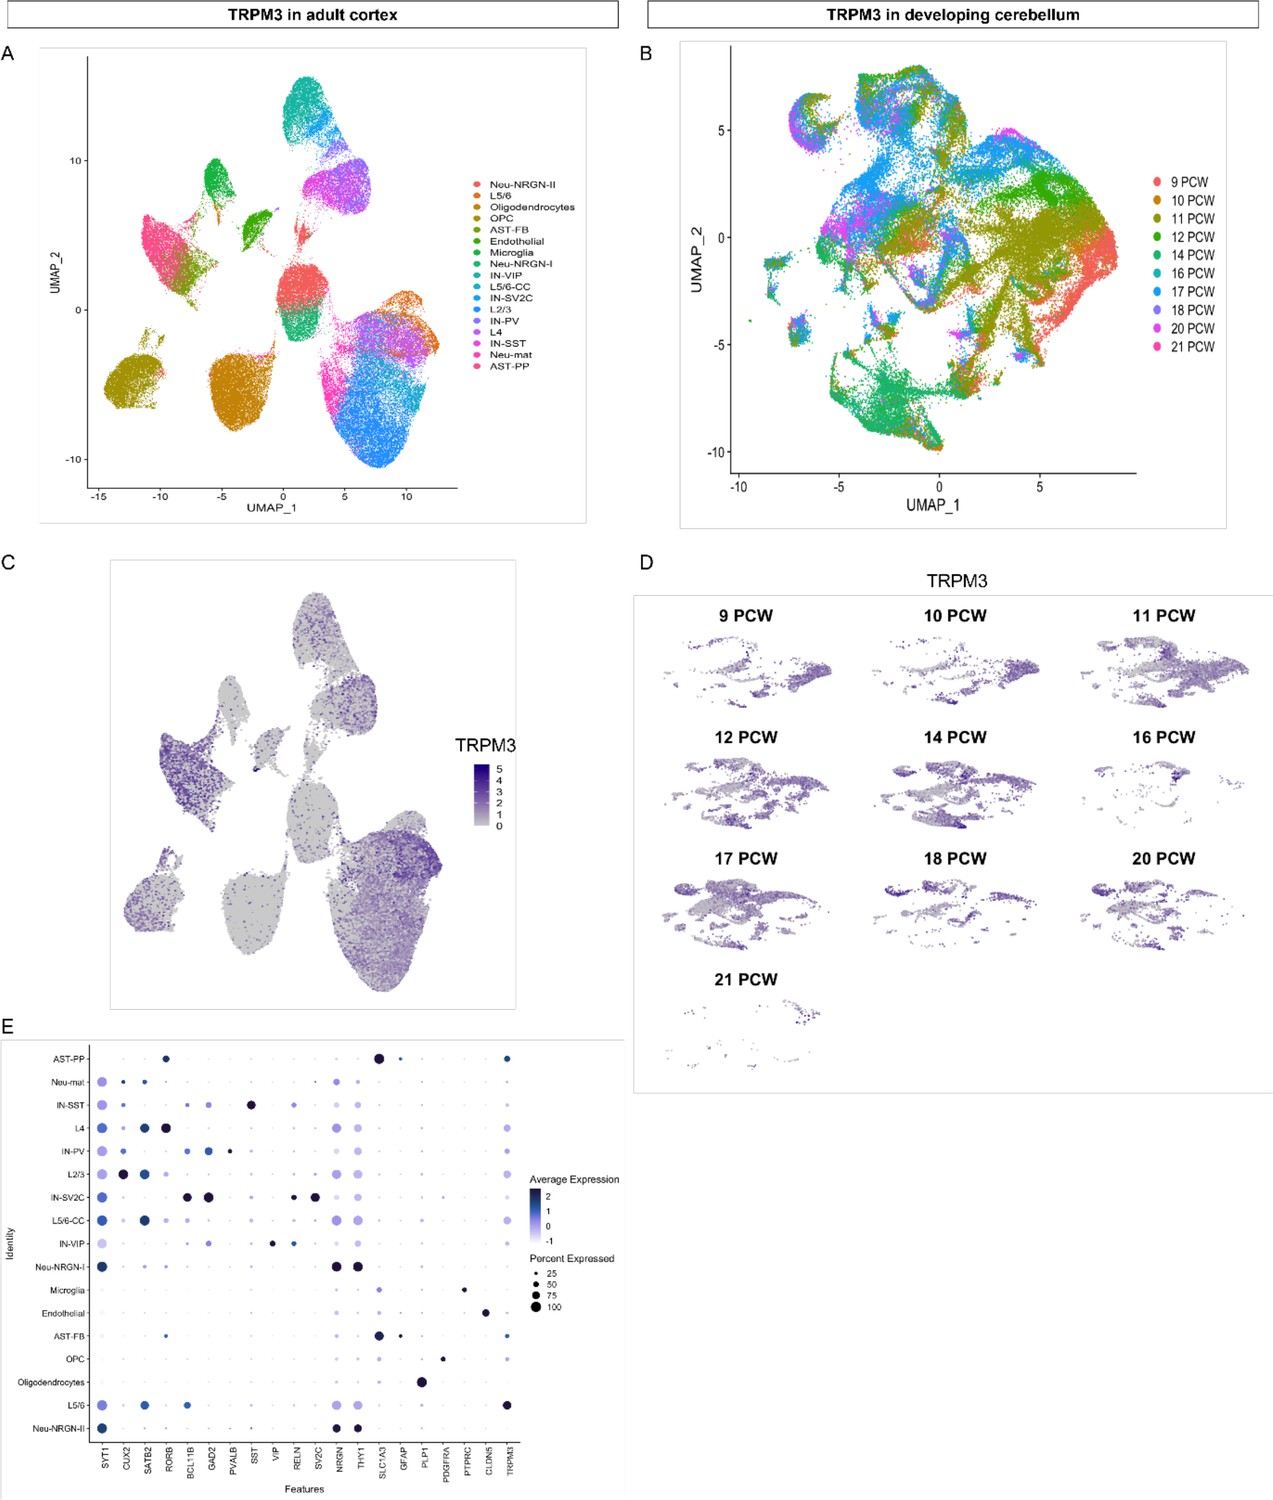
TRPM3 expression in adult cortex and developing cerebellum.
(A) UMAP visualization of human cortical nuclei annotated on the basis of marker genes. (B) UMAP visualization of human developing cerebellar nuclei annotated on the basis of post conception weeks (PCW). (C and D) The same UMAP visualization of human nuclei as panel (A) and (B), now representing the expression of TRPM3 for the adult cortex (C) and developing cerebellum (D), respectively. (E) Dot plot showing the expression of one selected marker gene per cell type for the adult cortex. The size of the dot represents the percentage of nuclei within a cell type in which that marker was detected, and its color represents the average expression level. Data set of TRPM3 in adult cortex adapted from Velmeshev et al., 2019. Data set of TRPM3 in developing cerebellum adapted from Aldinger et al., 2021.
Tables
Table 1
Overview patient information.
| Patient | 1 | 2 | 3 | 4 | 5 (Son of 6) | 6 (Father of 5) | 7 | 8 | 9 | 10 |
|---|---|---|---|---|---|---|---|---|---|---|
| Method | Exome trio | Exome trio | Panel NGS | Panel NGS | Exome trio | Genome trio | Panel NGS | Exome trio | Exome trio | Exome trio |
| Age at last examination | 13 years | 7.5 years | 20 years | 30 months | 21 years | 45 years | 16 years | 4 years | 10 years | 3 years |
| Sex | F | F | F | F | M | M | F | F | F | F |
| OFC (SD) | 0 | −2.5 | −2 | −2.5 | M | M | −1 | −1.8 | +1 | +1.5 |
| Height (SD) | 0 | na | −3 | −2.5 | +0.5 | +0.5 | −1.8 | 96.5 cm | na | 0 |
| Weight (SD) | +0.5 | na | na | −2.5 | <+5 | 0 | na | 16 kg | −0.5 | +1.8 |
| Pregnancy or delivery event | No | Placenta accreta | No | Club foot | Mild pre-eclampsia | Reduced fetal movements | No | C-section Breech position | Pre-eclampsia C-section | No |
| Maternal treatment | No | No | No | No | Enoxaparin injections | Codeine –tooth abscess | Antiretroviral therapy | No | No | Heparine therapy |
| Birth (weeks) | 40 | Full term | 41 | 40 | Full term | 42 | na | 39 | 37 | 40 |
| Birth OFC (cm) | 33.5 | na | 36 | 34.5 | na | na | 34 | 35.6 | na | na |
| Birth weight (g) | 3020 | 3500 | 3140 | 3150 | 3090 | 3360 | 3080 | 3570 | 2637 | 3430 |
| Birth length (cm) | 44 | na | 48 | 47 | na | na | 47.5 | 50.8 | na | 50 |
| First signs (age) | Unstable gait (14 months) | Poor visual contact (1 month) | Hypotonia and poor visual contact (first weeks) | Lack of visual pursuit (3 months) | Motor delay (first months) | Mild learning difficulties | Poor visual contact (first weeks) and abnormal ocular movements | Feeding difficulties hypotonia and no visual tracking (3 months) | Neonatal hypotonia and abnormal ocular movements | Motor delay (first months) |
| Hypotonia first months | No | Yes | Yes | Yes | Yes | Yes | Yes | Yes | Yes | No |
| Achieved psychomotor milestones | Able to walk unaided (ataxic) | Able to walk with aid | Able to sit, hypotonia, moves on the buttocks, and poor visual contact | Unstable head, hypotonia, and unable to follow | Able to walk unaided after motor delay | Able to sit unaided with delay | Able to walk unaided after motor delay | Unable to walk | Unable to walk | Able to sit: 12 months |
| Walking age | 25 m (ataxic) | 4 years with aid | Not acquired | Not acquired | 19 months | Normal | 20 months | Not acquired | Not acquired | 24 months |
| Ataxia | Yes | Yes | Severe hypotonia | na | No | No | Yes, improving; at 16: very mild | na (unable to walk) | No | Yes |
| Tremor | Yes | No | No | No | No | No | Yes (hands) | No | No | No |
| Dysmetria | Yes | na | na | na | No | No | Very mild and adiadococinesia | Yes | No | na |
| Dysarthria | Yes | na | na | na | No | No | na | Non-verbal | No | na |
| Dystonia | No | na | Yes | No | No | No | hand ‘crispation’ | No | na | No |
| Abnormal movements | Myoclonies | na | Saccadic gesticulation | No | No | No | Syncinesia | Stereotyped hand movement | na | Ataxia |
| Amyotrophy | Yes | na | na | na | na | na | na | na | na | No |
| Epilepsy (age and treatment) | No | Febrile seizures (5 years, no treatment) | No | Doubtful seizures and abundant interictal discharges (4 years, primidone) | Nocturnal epilepsy generalized tonic-clonic (7 years, no treatment) | No | No | Doubtful | Neonatal episodes (uncertain) | Yes (30 m, primidone) |
| EEG: age/findings/(Wake W/Sleep S) | na | 5 years: Background slowing (W); episodes of sharp waves in the fronto-central regions (S) | 1/8 years: Normal (W/S) | 30 months: Normal EEG 4 years: Background slowing, alpha central since 6 m, biparietal spikes, no epilepticus during slow-wave sleep (ESES; W/S) | 7 years: bifrontal synchronous spike and waves discharges (W) | na | na | 3 years: Generalized -background slowing, no eptileptic dicharges (W/S) | Several before 10 years: Normal (W/S) | 2.5 years: ESES (W/S) |
| Pain insensitivity (Y/N)? | No | Yes | na | na | Yes | Yes | na | na | No | Yes |
| Heat insensitivity | No | No | na | na | No | Yes | na | Yes | No | na |
| Language | Normal | Monosyllabic | Absent | Absent | Delayed | Normal | Slightly delayed then normal | Non-verbal (picture cards) | Non-verbal (picture cards) | Delayed |
| Intellectual deficiency | Normal low/mild ID | Severe–moderate | Severe | Probably severe | Moderate | Mild | Very mild-low normal | Moderate | Severe | Yes |
| Behavior anomalies | No | No | No | No | Food-seeking | No | No | Yes | Occasional outbursts and stereotypies ‡ | Aggressivity |
| Autism spectrum disorder (Y/N)? | No | No | Poor contact (severe ID) | Poor contact (severe ID) | No | No | No | No | Yes | Yes |
| School | Special school (attention deficit and slow) | Specialized institution | Institution for children with profound intellectual and multiple disabilities | na | Special education | Normal then special education | Mainstream school with support measures, able to read, writing difficulties, and slow | Foundation for Blind School making slow progress | na | na |
| Evolution | Progress | Progress | Stable | Stable | Progress | Progress | Progress | Progress but episodes of mild psychomotor regression concomitant with behavioral fluctuations | na | Progress |
| Ocular anomalies | Strabismus, saccadic breakdown of smooth pursuit | Abnormal eye pursuit | Strabismus | No | Hypermetropia and left convergent squint | No | Nystagmus | Cortical visual impairment, nystagmus, and strabismus | Disconjugate nystagmus | Strabismus |
| Skeletal anomalies | 12th hypoplastic rib pair | Pes calcaneovalgus | Congenital hip luxation – later paralytic kyphoscoliosis | na | Left Perthes’ disease | No | Valgus foot and patellar dislocation | No | Hip dysplasia | Brachydactyly |
| Others | Small genitalia, delayed puberty, and gynecomastia | Skin tags and dry palmar skin | Prognathism | Failure to thrive (milk protein allergy and GERD) | Feedings difficulties G-tube fed | Immune thrombocytopenia and hypochromic microcytic anemia | ||||
| MRI (age) | 3 years 8 months: cerebellar atrophy, increased at 10 years | 6 months: normal 2 years 2 months: cerebellar vermis and hemispheres atrophy | 4 months: ‘normal’ 8 months: brainstem and cerebellar atrophy, short corpus callosum | 1 years 4 months: brainstem and cerebellar atrophy | Normal | Not done† | Very mild localized atrophy of cerebellar hemispheres | Normal | Not done* | Normal (3 years) |
| Mutation NM_001366145.2 | c.1841A>T p.(Asp614Val) | c.2305C>G p.(Leu769Val) | c.3004G>T p.(Val1002Leu) | c.3005T>G p.(Val1002Gly) | c.3019G>A p.(Gly1007Ser) | c.3019G>A p.(Gly1007Ser) | c.3019G>A p.(Gly1007Ser) | c.3376A>G p.(Asn1126Asp) | c.3376A>G p.(Asn1126Asp) | c.3397T>C p.(Ser1133Pro) |
| Inheritance | de novo | de novo | de novo | de novo | Inherited from the father | de novo | de novo | de novo | de novo | de novo |
-
Abbreviations: NGS = Next Generation Sequencing; OFC = occipitofrontal circumference.
-
*
Cerebral computed tomography (CT) at 5 years: Periventricular white matter loss.
-
†
CT normal.
-
‡
repetitive hyperventilation.
Table 2
Overview used splice isoforms.
| Splice isoform | Start | Exon 8 | Exon 15 | Exon 17 | Exon 24 | Exon 28 | Functionality* |
|---|---|---|---|---|---|---|---|
| AJ505026.1 | Exon 2 | − | − | + | Short | Spliced | Normal |
| NM_001366141.2 | Exon 1 | − | − | + | Short | Full | Normal |
| NM_001366145.2 | Exon 2 | − | + | + | Short | Full | Normal |
| NM_001366147.2 | Exon 2 | + | + | + | Short | Full | No activity |
-
*
Normal functionality refers to whole-cell currents activated by ligands including pregnenolone sulfate (PS), CIM0216, and clotrimazole, with biophysical properties as described in Held et al., 2015 and Vriens et al., 2014.
Table 3
Characteristics of the variants.
| Variant | gnomAD | SIFT | CADD | PROVEAN | DANN |
|---|---|---|---|---|---|
| c.1841A>T p.(Asp614Val) | Absent | Deleterious | 25.3 | Damaging | 0.9865 |
| c.2305C>G p.(Leu769Val) | Absent | Tolerated | 25.9 | Damaging | 0.9986 |
| c.3004G>T p.(Val1002Leu) | Absent | Tolerated | 24.8 | Damaging | 0.9969 |
| c.3005T>G p.(Val1002Gly) | Absent | Deleterious | 26.3 | Damaging | 0.9973 |
| c.3019G>A p.(Gly1007Ser) | Absent | Deleterious | 27.8 | Damaging | 0.9986 |
| c.3376A>G p.(Asn1126Asp) | Absent | Tolerated | 28.4 | Damaging | 0.9977 |
| c.3397T>C p.(Ser1133Pro) | Absent | Deleterious | 27.2 | Damaging | 0.9987 |
-
Characteristics of the variants (database, predicted pathogenicity). Overview of the different variants and the identification protocol.
Additional files
Download links
A two-part list of links to download the article, or parts of the article, in various formats.
Downloads (link to download the article as PDF)
Open citations (links to open the citations from this article in various online reference manager services)
Cite this article (links to download the citations from this article in formats compatible with various reference manager tools)
Gain-of-function variants in the ion channel gene TRPM3 underlie a spectrum of neurodevelopmental disorders
eLife 12:e81032.
https://doi.org/10.7554/eLife.81032


