A crosstalk between hepcidin and IRE/IRP pathways controls ferroportin expression and determines serum iron levels in mice
- Lady Davis Institute for Medical Research, Jewish General Hospital and Department of Medicine, McGill University, Canada
- Ferring Research Institute Inc, United States
- Department of Medicine II, Hematology/Oncology, University Hospital Frankfurt, Germany
- Institute of Pathology, University Medical Center Göttingen (UMG), Germany
- Helmholtz Zentrum München GmbH – German Research Center for Environmental Health, Research Unit Analytical BioGeoChemistry, Germany
Figures
Figure 1
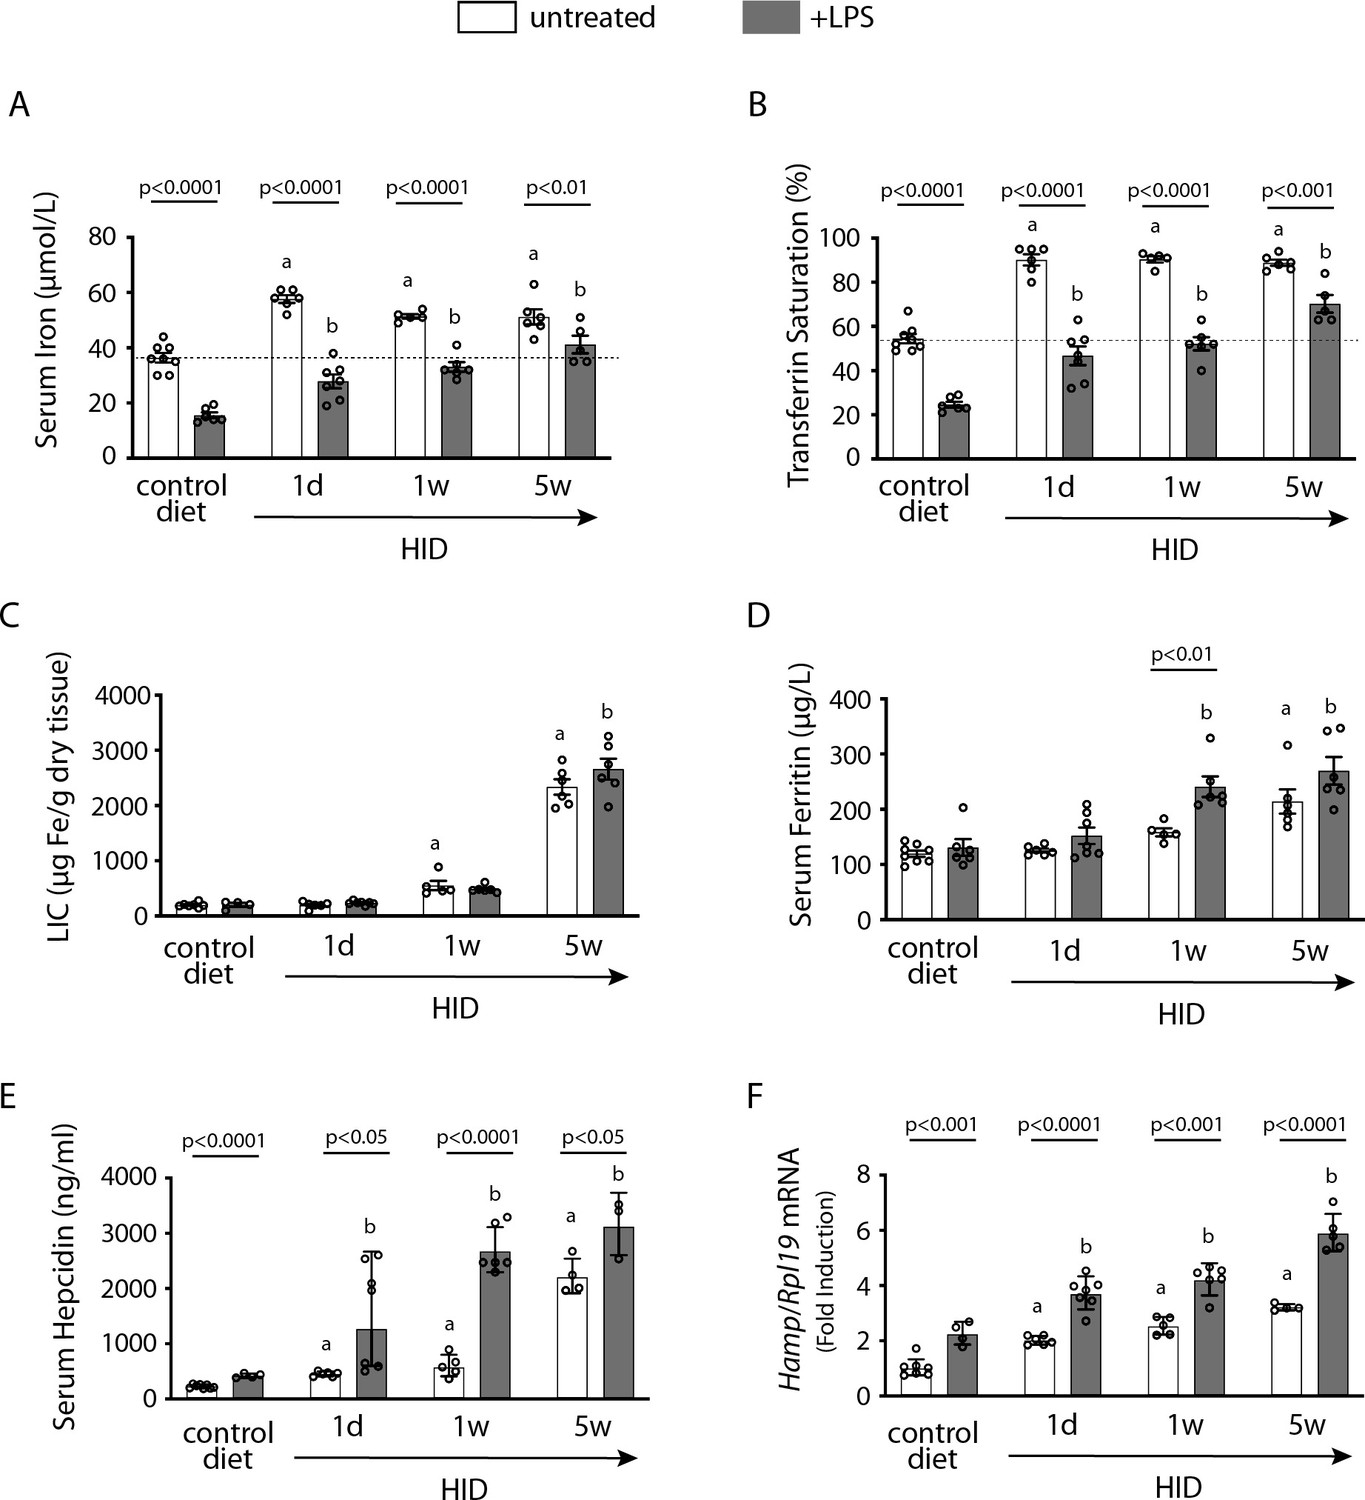
Dietary iron loading does not disrupt inflammatory hepcidin induction in LPS-treated wild type mice but blunts hepcidin-mediated hypoferremia.
Nine-week-old male mice (n=12–14 per group) were fed control diet or high-iron diet (HID) for 1 day, 1 week, or 5 weeks prior to sacrifice. Half of the mice were injected intraperitoneally with saline and the other half with 1 µg/g LPS 4 hr before sacrifice. Sera were collected by cardiac puncture and analyzed for: (A) iron, (B) transferrin saturation, (D) ferritin, and (E) hepcidin. Livers were dissected and processed for biochemical analysis of: (C) liver iron content (LIC) by the ferrozine assay and (F) Hamp mRNA by qPCR. The dotted line in (A) and (B) indicates baseline serum iron and transferrin saturation, respectively, from mice on control diet. Data (A–E) are presented as the mean ± SEM and in (F) as geometric mean ± SD. Statistically significant differences (p<0.05) over time compared to values from saline- or LPS-treated control mice are indicated by a or b, respectively.
-
Figure 1—source data 1
qPCR data.
- https://cdn.elifesciences.org/articles/81332/elife-81332-fig1-data1-v2.xlsx
-
Figure 1—source data 2
Serum hepcidin calculations.
- https://cdn.elifesciences.org/articles/81332/elife-81332-fig1-data2-v2.xls
-
Figure 1—source data 3
Liver iron quantification.
- https://cdn.elifesciences.org/articles/81332/elife-81332-fig1-data3-v2.xlsx
-
Figure 1—source data 4
Serum iron and transferrin saturation values.
- https://cdn.elifesciences.org/articles/81332/elife-81332-fig1-data4-v2.xlsx
Figure 2 with 1 supplement
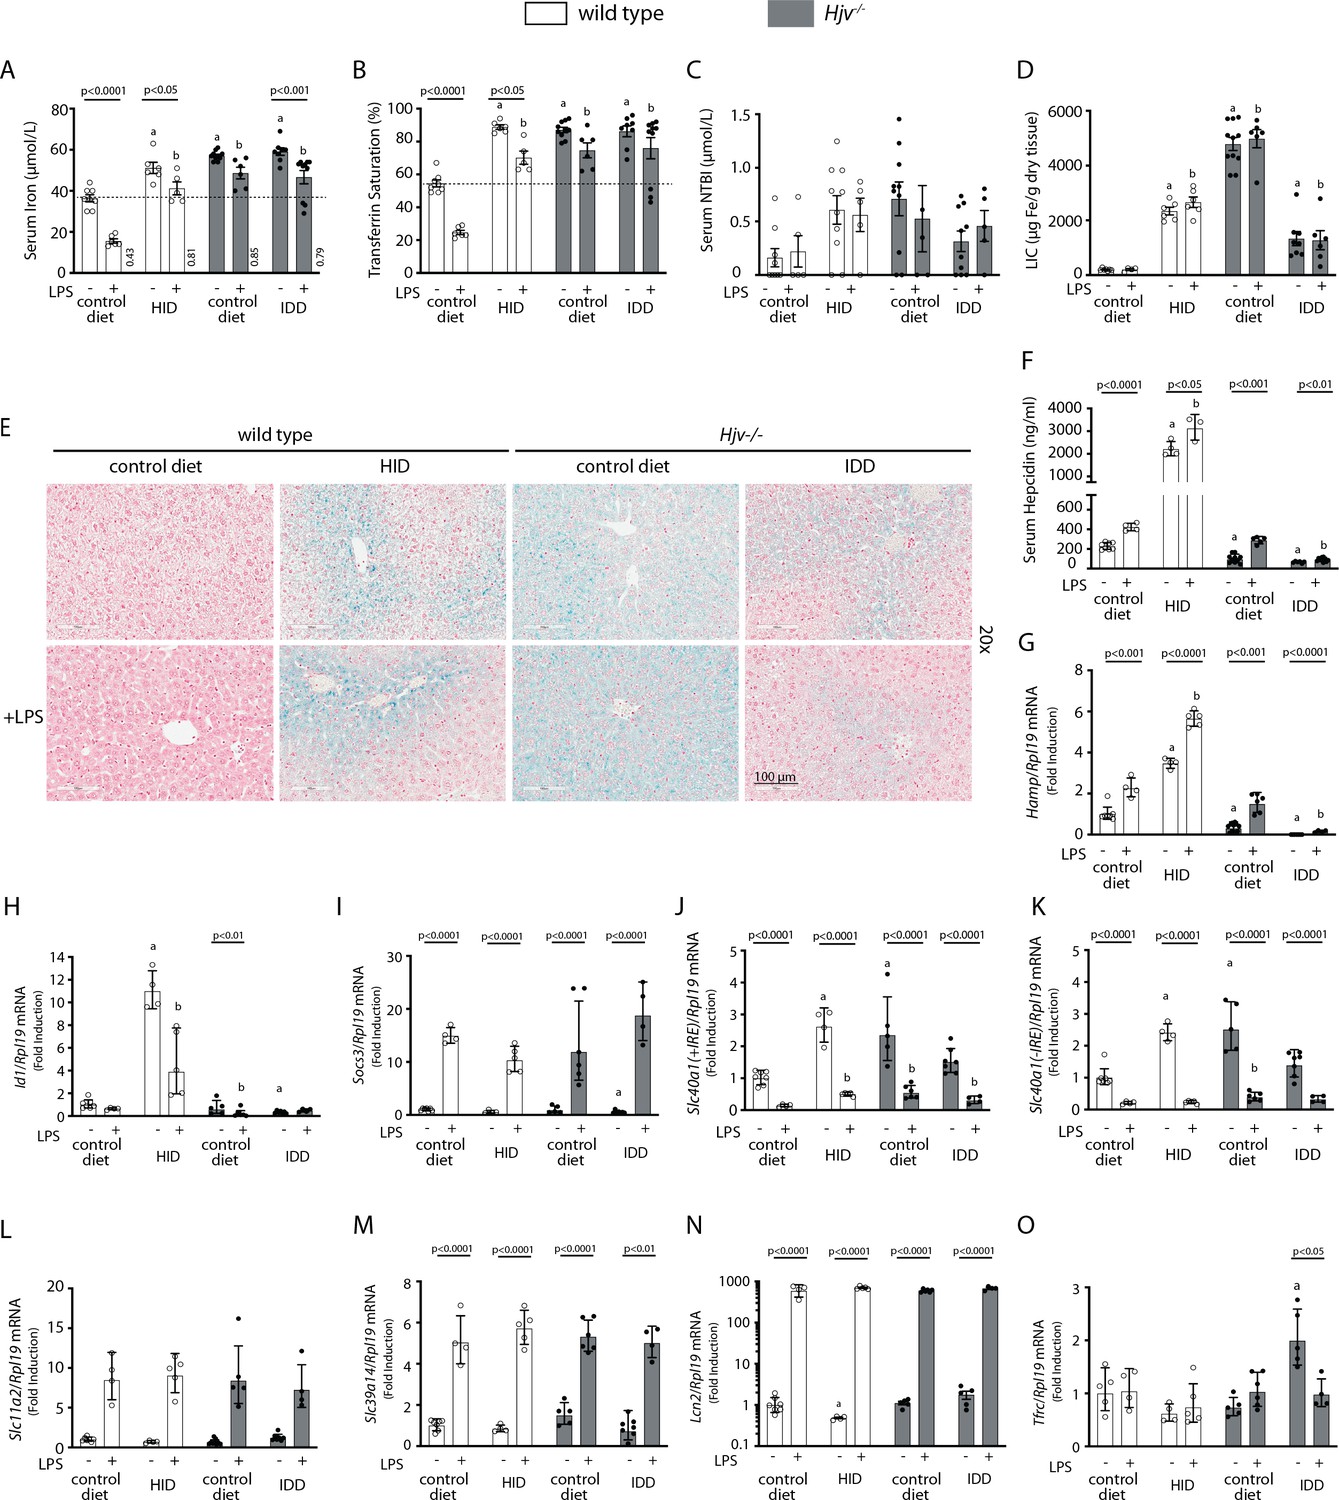
Iron overload blunts hepcidin responsiveness to LPS-induced inflammation.
Four-week-old male wild type mice (n=12–14 per group) were placed on high-iron diet (HID) for 5 weeks. Conversely, age- and sex-matched isogenic Hjv-/- mice (n=12–14 per group) were placed on iron-deficient diet (IDD) for 5 weeks to prevent excessive iron overload. Other animals from both genotypes were kept on control diet. Half of the mice were injected with saline and the other half with 1 µg/g LPS; all animals were sacrificed 4 hr later. Sera were collected by cardiac puncture and analyzed for: (A) iron, (B) transferrin saturation, (C) non-transferrin bound iron (NTBI), and (F) hepcidin. Livers were dissected and processed for LIC quantification by the ferrozine assay (D) and for histological detection of iron deposits by Perls’ staining (E; magnification: 20 ×). Livers were also used for qPCR analysis of following mRNAs: (G) Hamp, (H) Id1, (I) Socs3, (J) Slc40a1(+IRE), (K) Slc40a1(-IRE), (L) Slc11a2, (M) Slc39a14, (N) Lcn2, and (O) Tfrc. The dotted line in (A) and (B) indicates baseline serum iron and transferrin saturation, respectively, of wild type mice on control diet. Values in (A) represent ratios of serum iron levels between untreated and LPS-treated mice. Data in (A–F) are presented as the mean ± SEM while in (G–O) are presented as geometric mean ± SD. Statistically significant differences (p<0.05) compared to values from saline- or LPS-treated wild type control mice are indicated by a or b, respectively.
-
Figure 2—source data 1
qPCR data.
- https://cdn.elifesciences.org/articles/81332/elife-81332-fig2-data1-v2.xlsx
-
Figure 2—source data 2
Serum NTBI calculations.
- https://cdn.elifesciences.org/articles/81332/elife-81332-fig2-data2-v2.xlsx
-
Figure 2—source data 3
Serum iron ratios.
- https://cdn.elifesciences.org/articles/81332/elife-81332-fig2-data3-v2.xlsx
-
Figure 2—source data 4
Serum hepcidin calculations.
- https://cdn.elifesciences.org/articles/81332/elife-81332-fig2-data4-v2.xls
-
Figure 2—source data 5
Liver iron quantification.
- https://cdn.elifesciences.org/articles/81332/elife-81332-fig2-data5-v2.xlsx
-
Figure 2—source data 6
Serum iron and transferrin saturation values.
- https://cdn.elifesciences.org/articles/81332/elife-81332-fig2-data6-v2.xlsx
Figure 2—figure supplement 1
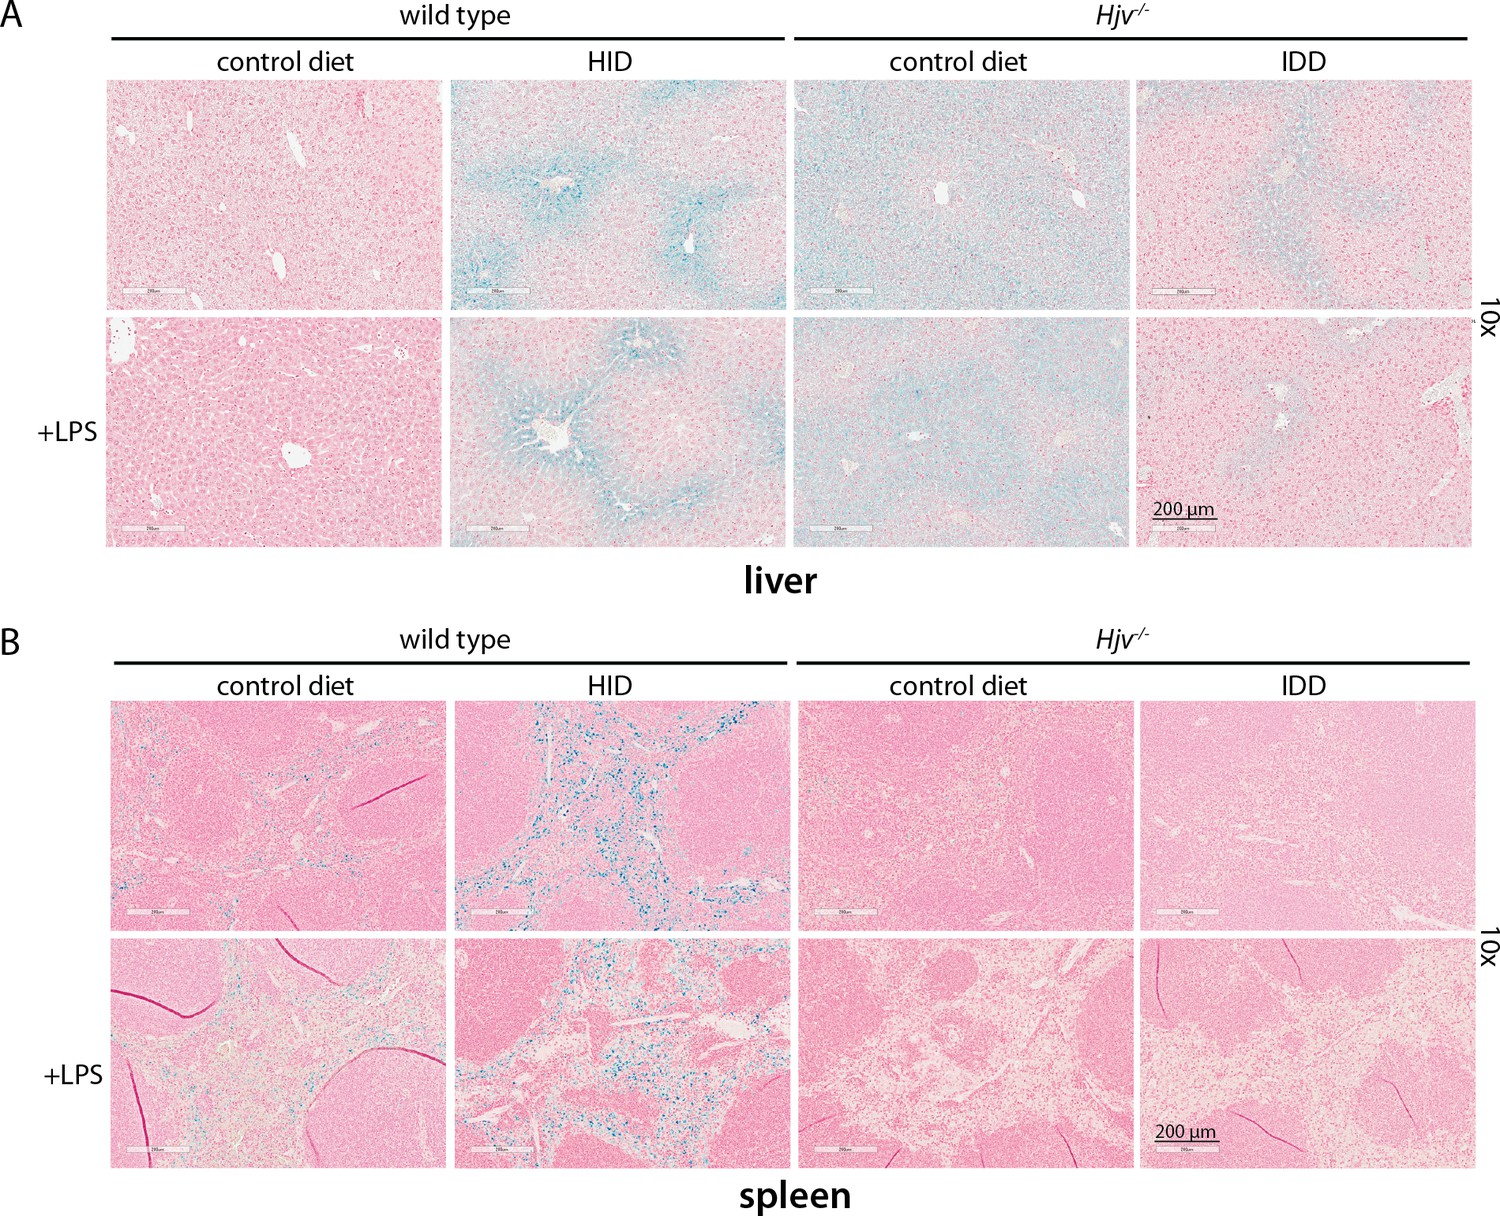
Effects of dietary iron manipulations in hepatic and splenic iron of wild type and Hjv-/- mice.
(A) Liver and (B) spleen sections from mice described in Figure 2 were analyzed histologically for iron deposits by Perls staining (magnification: 10 ×). HID: high-iron diet; IDD: iron-deficient diet.
Figure 3 with 2 supplements
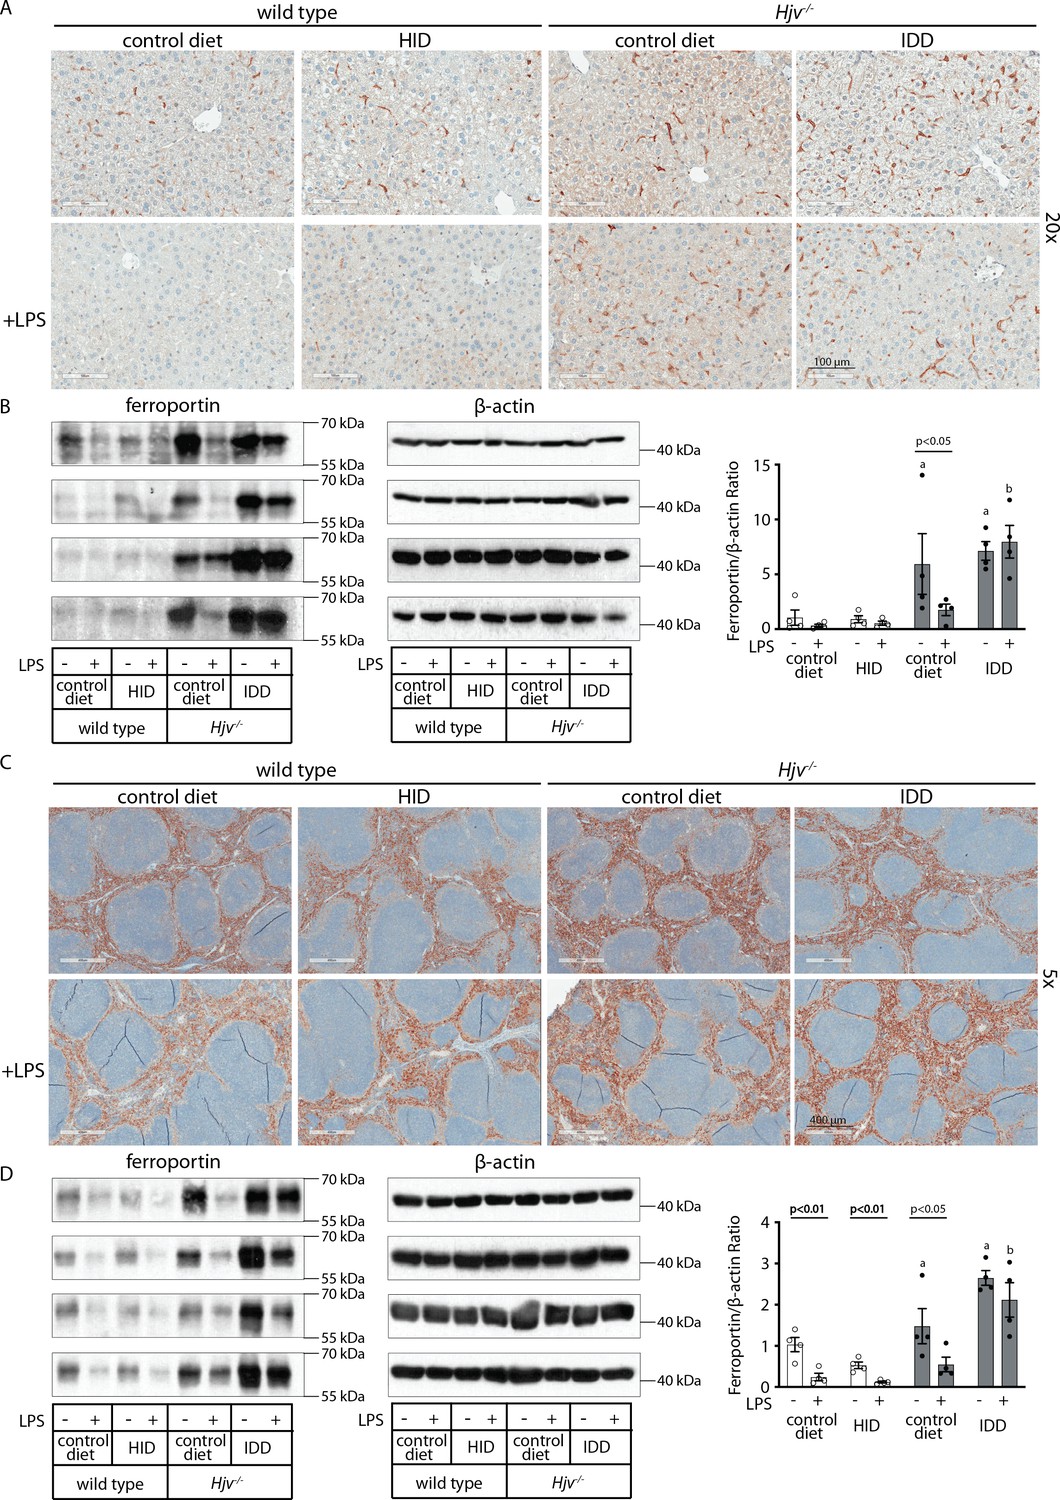
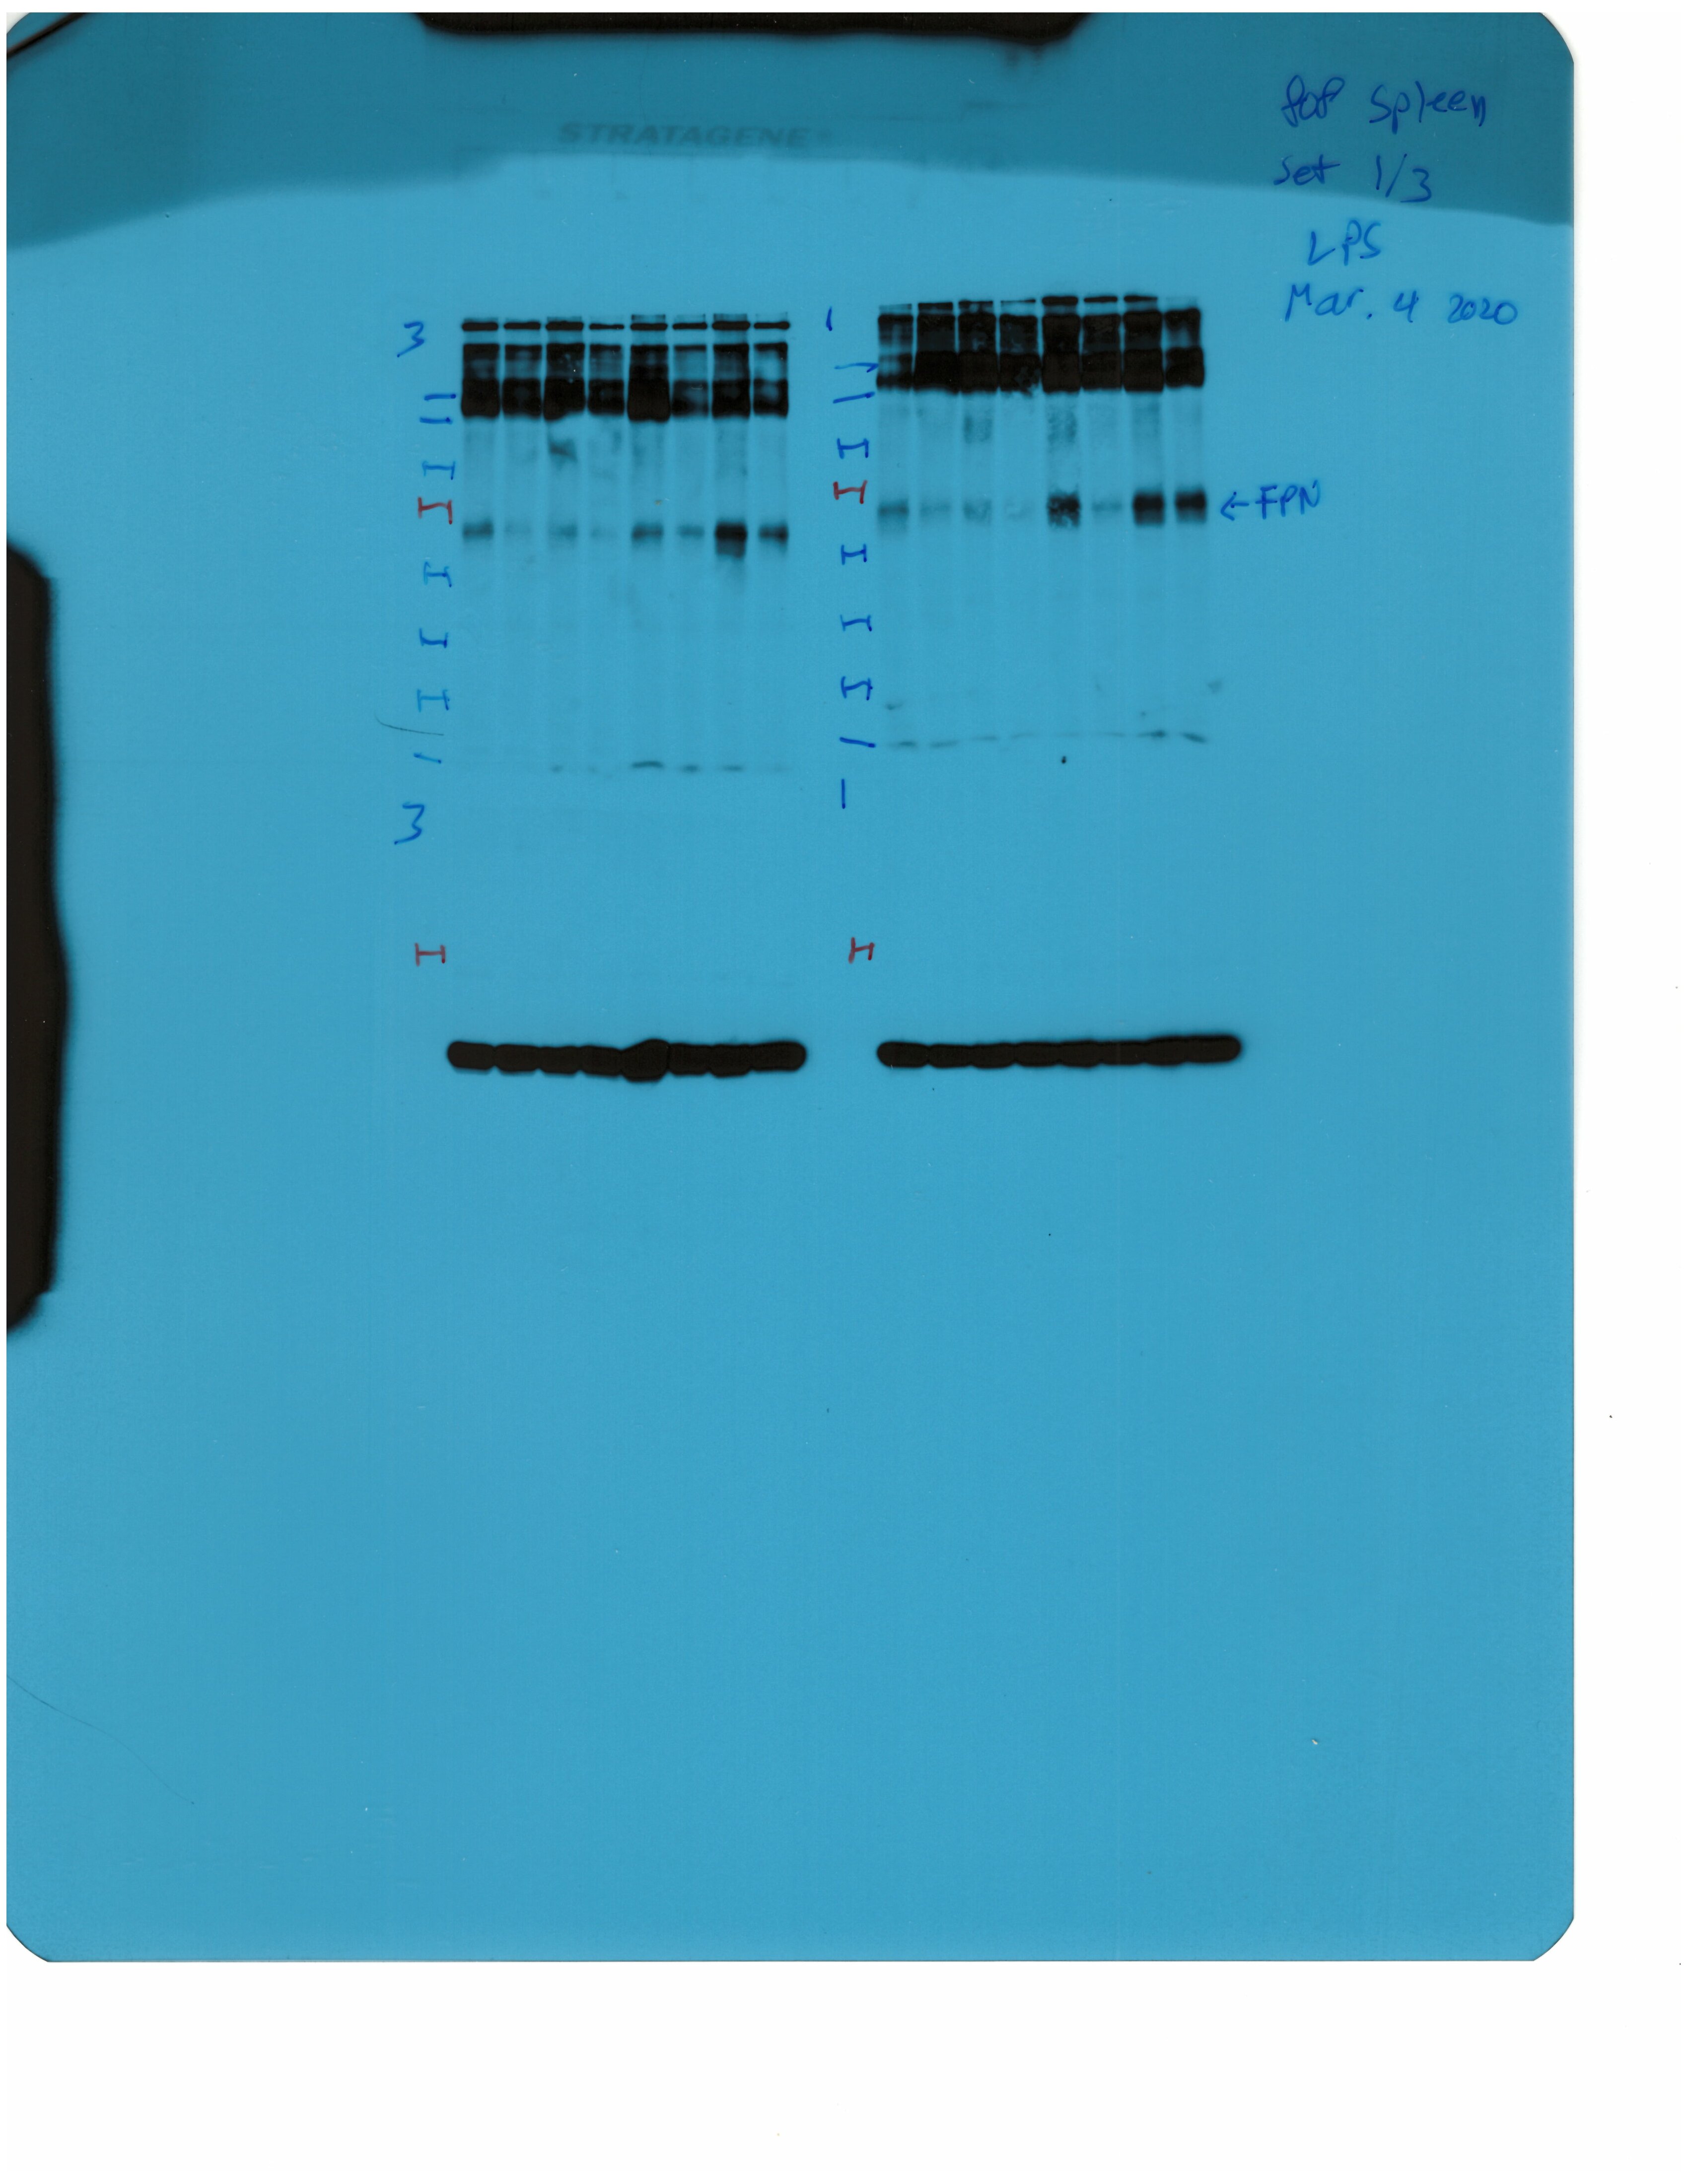
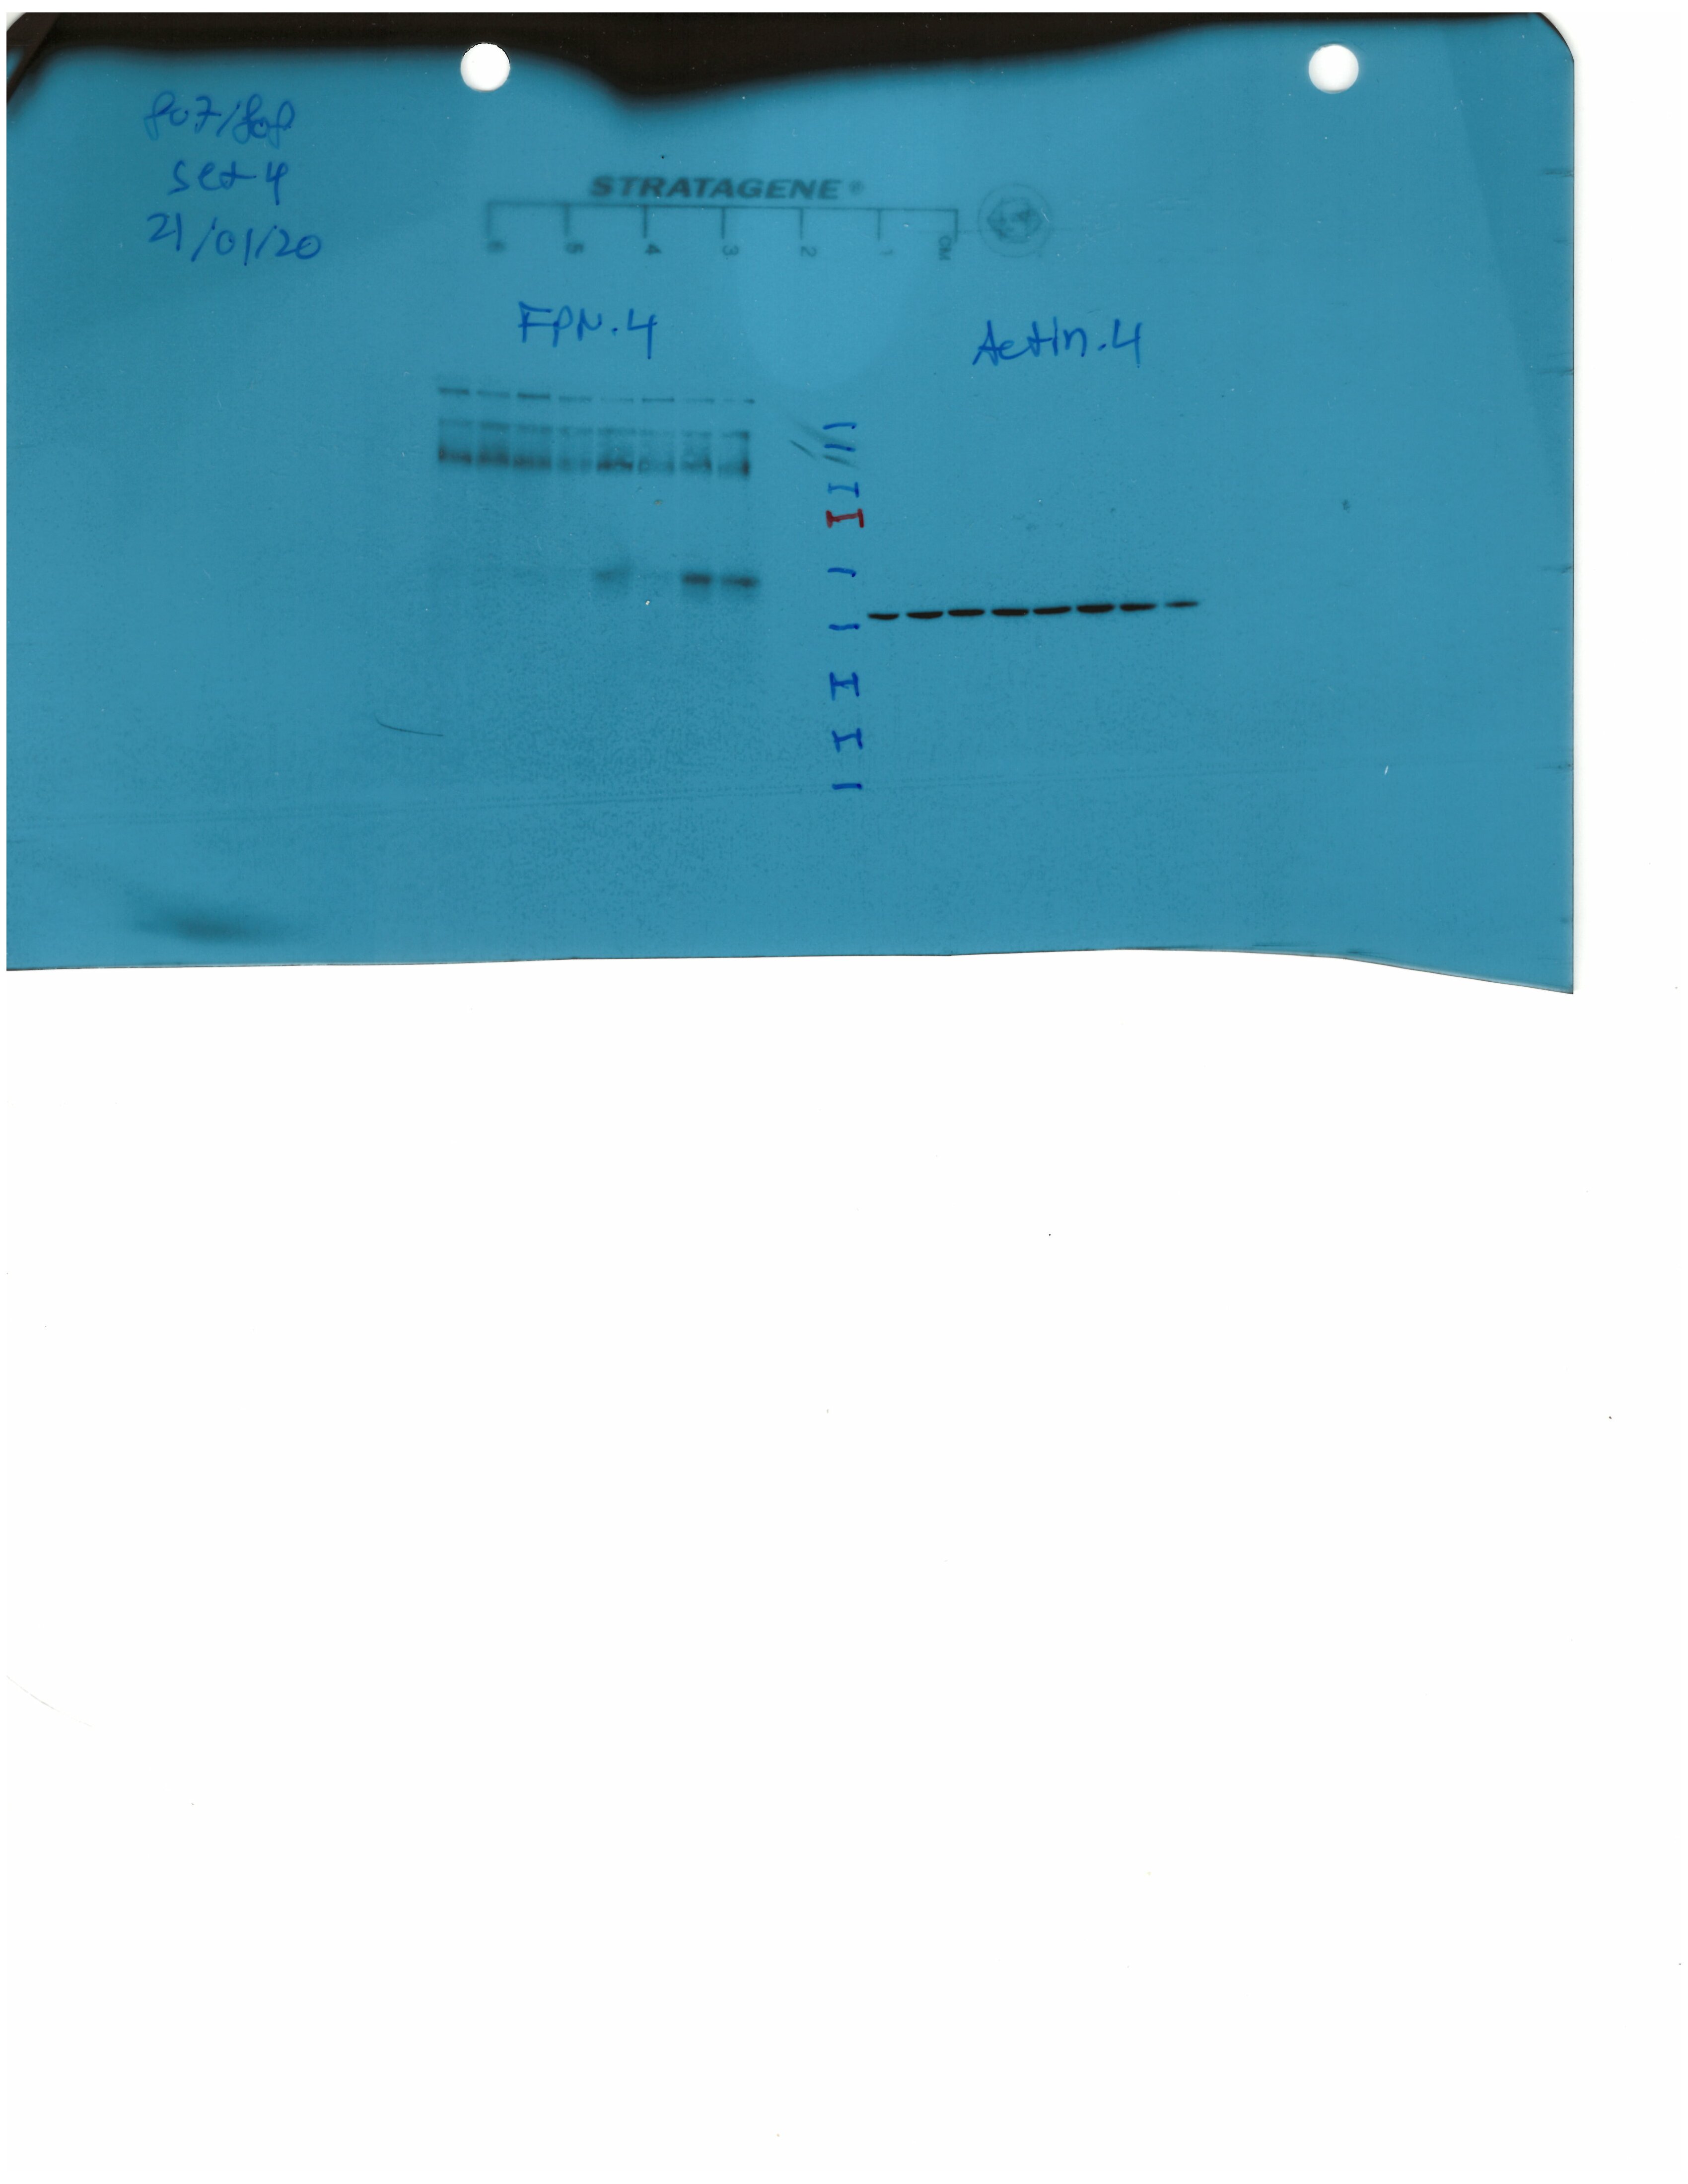
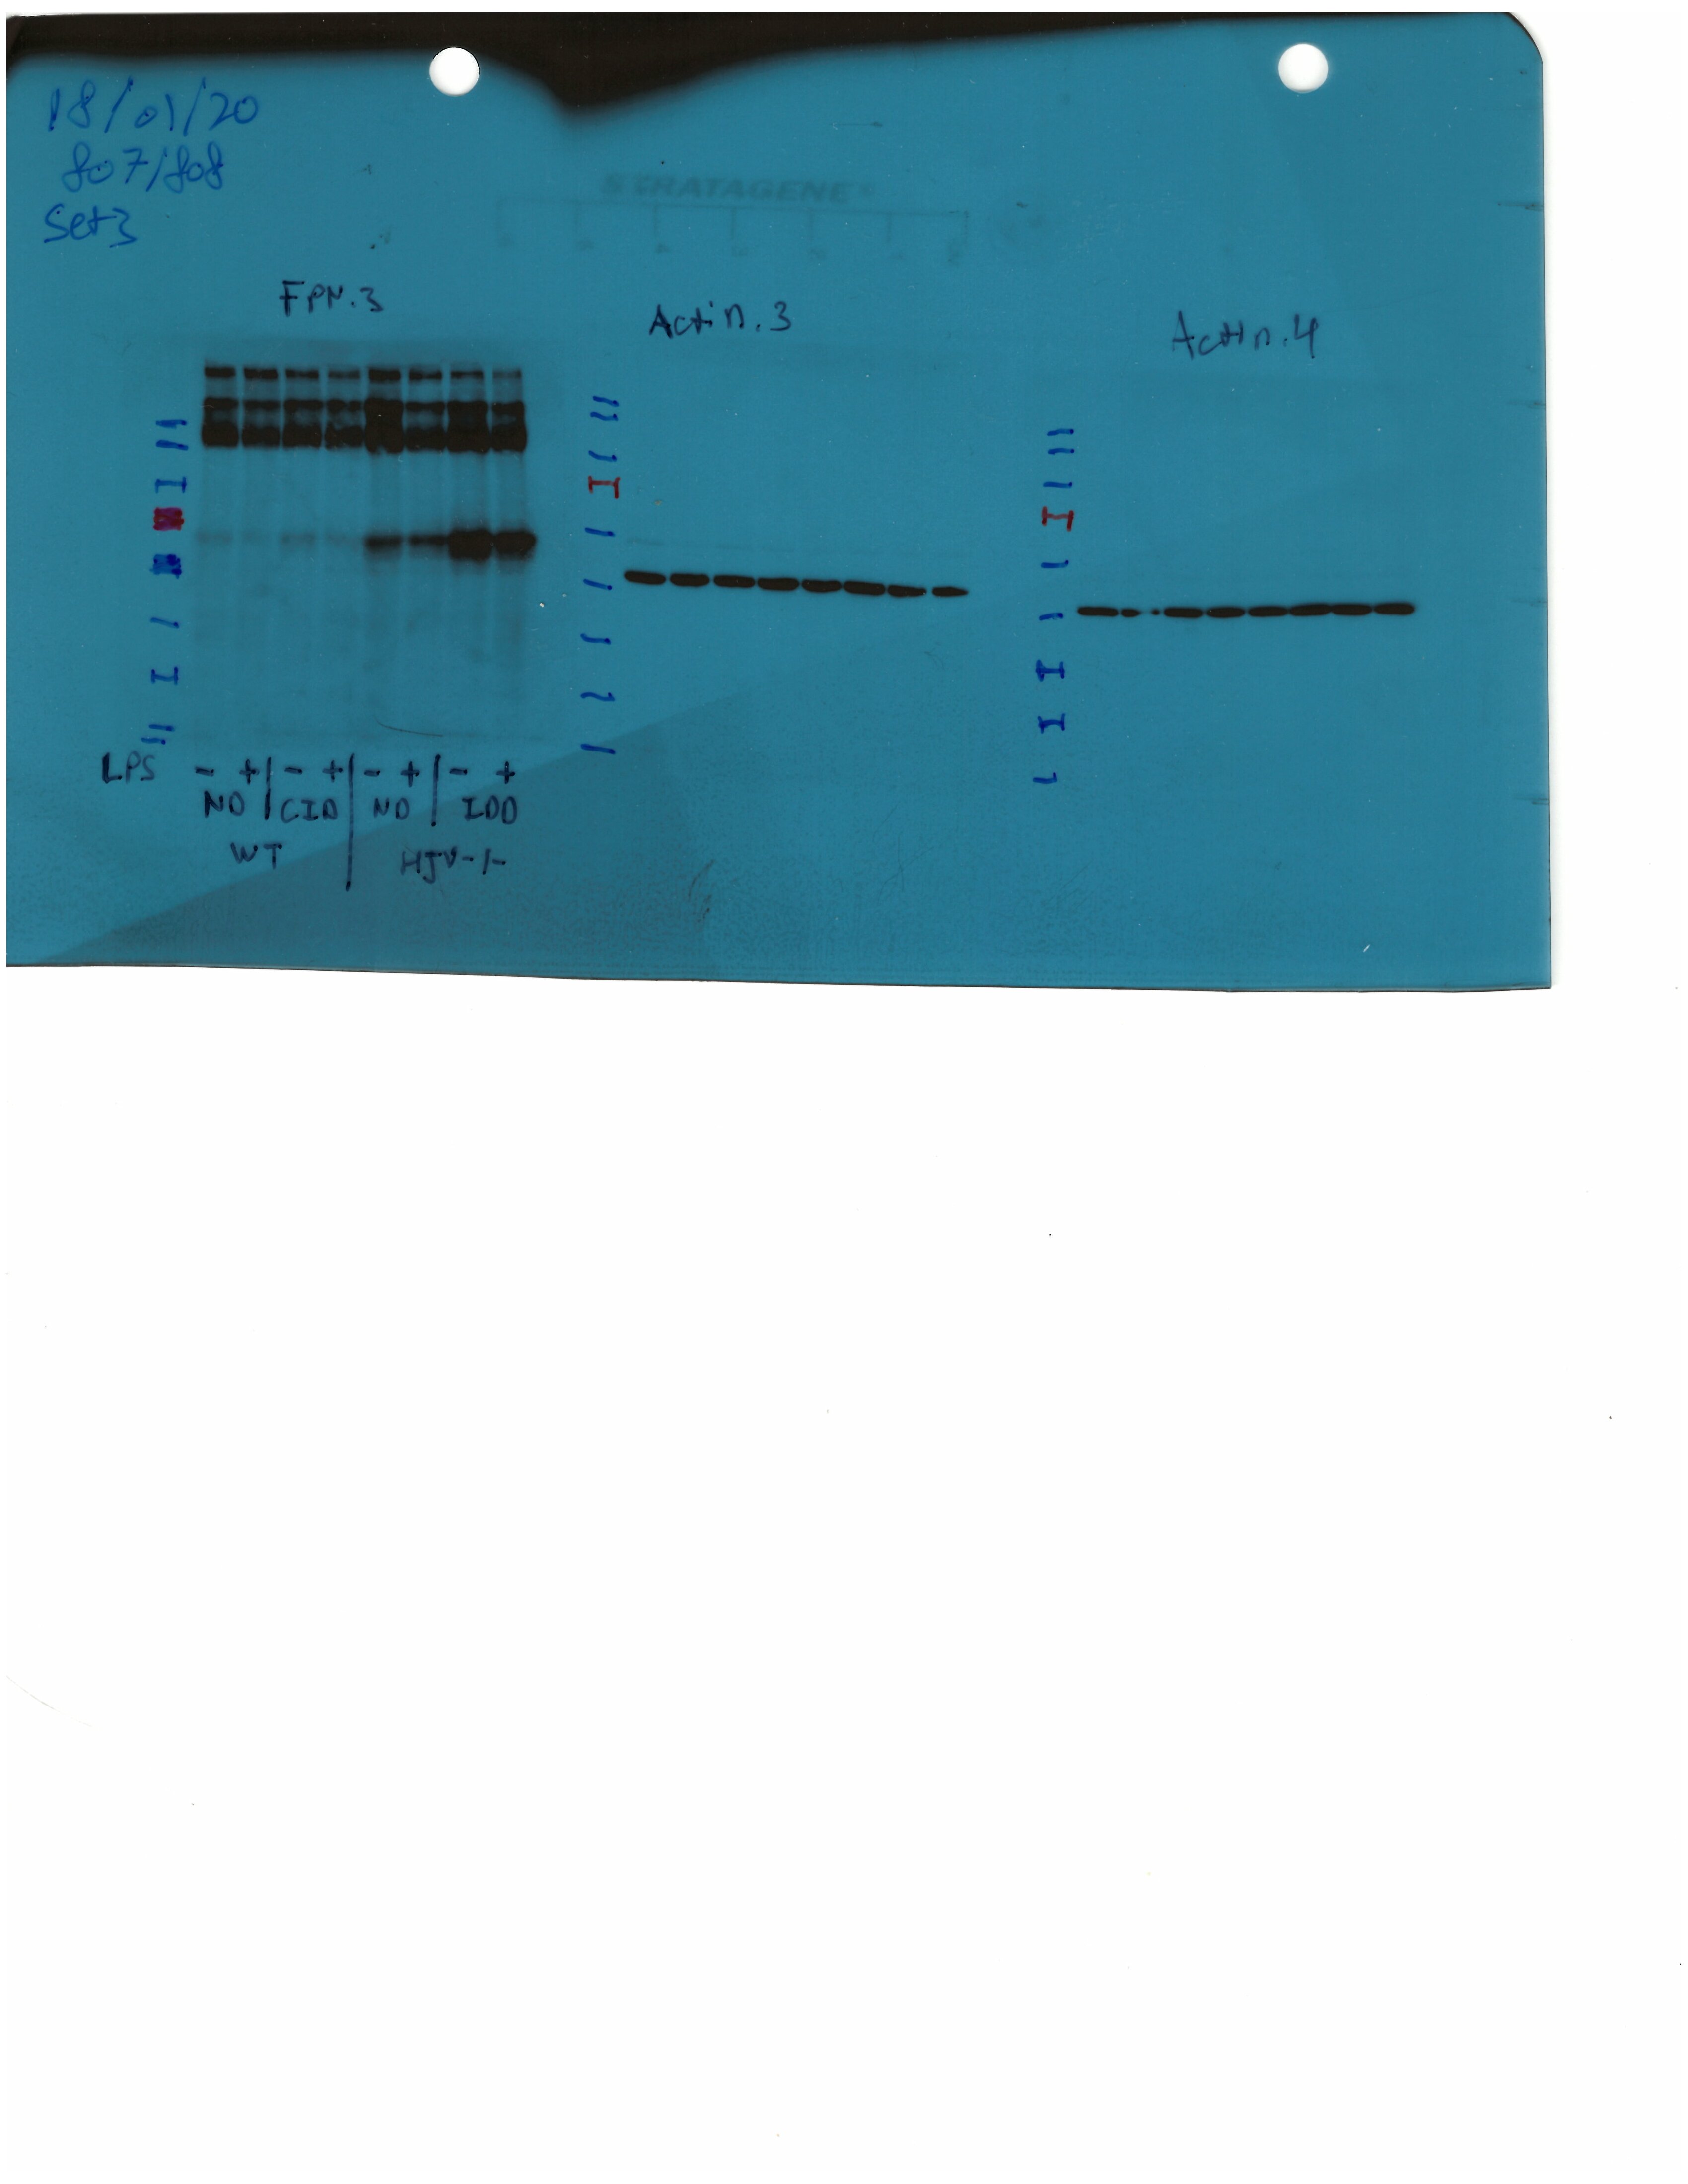
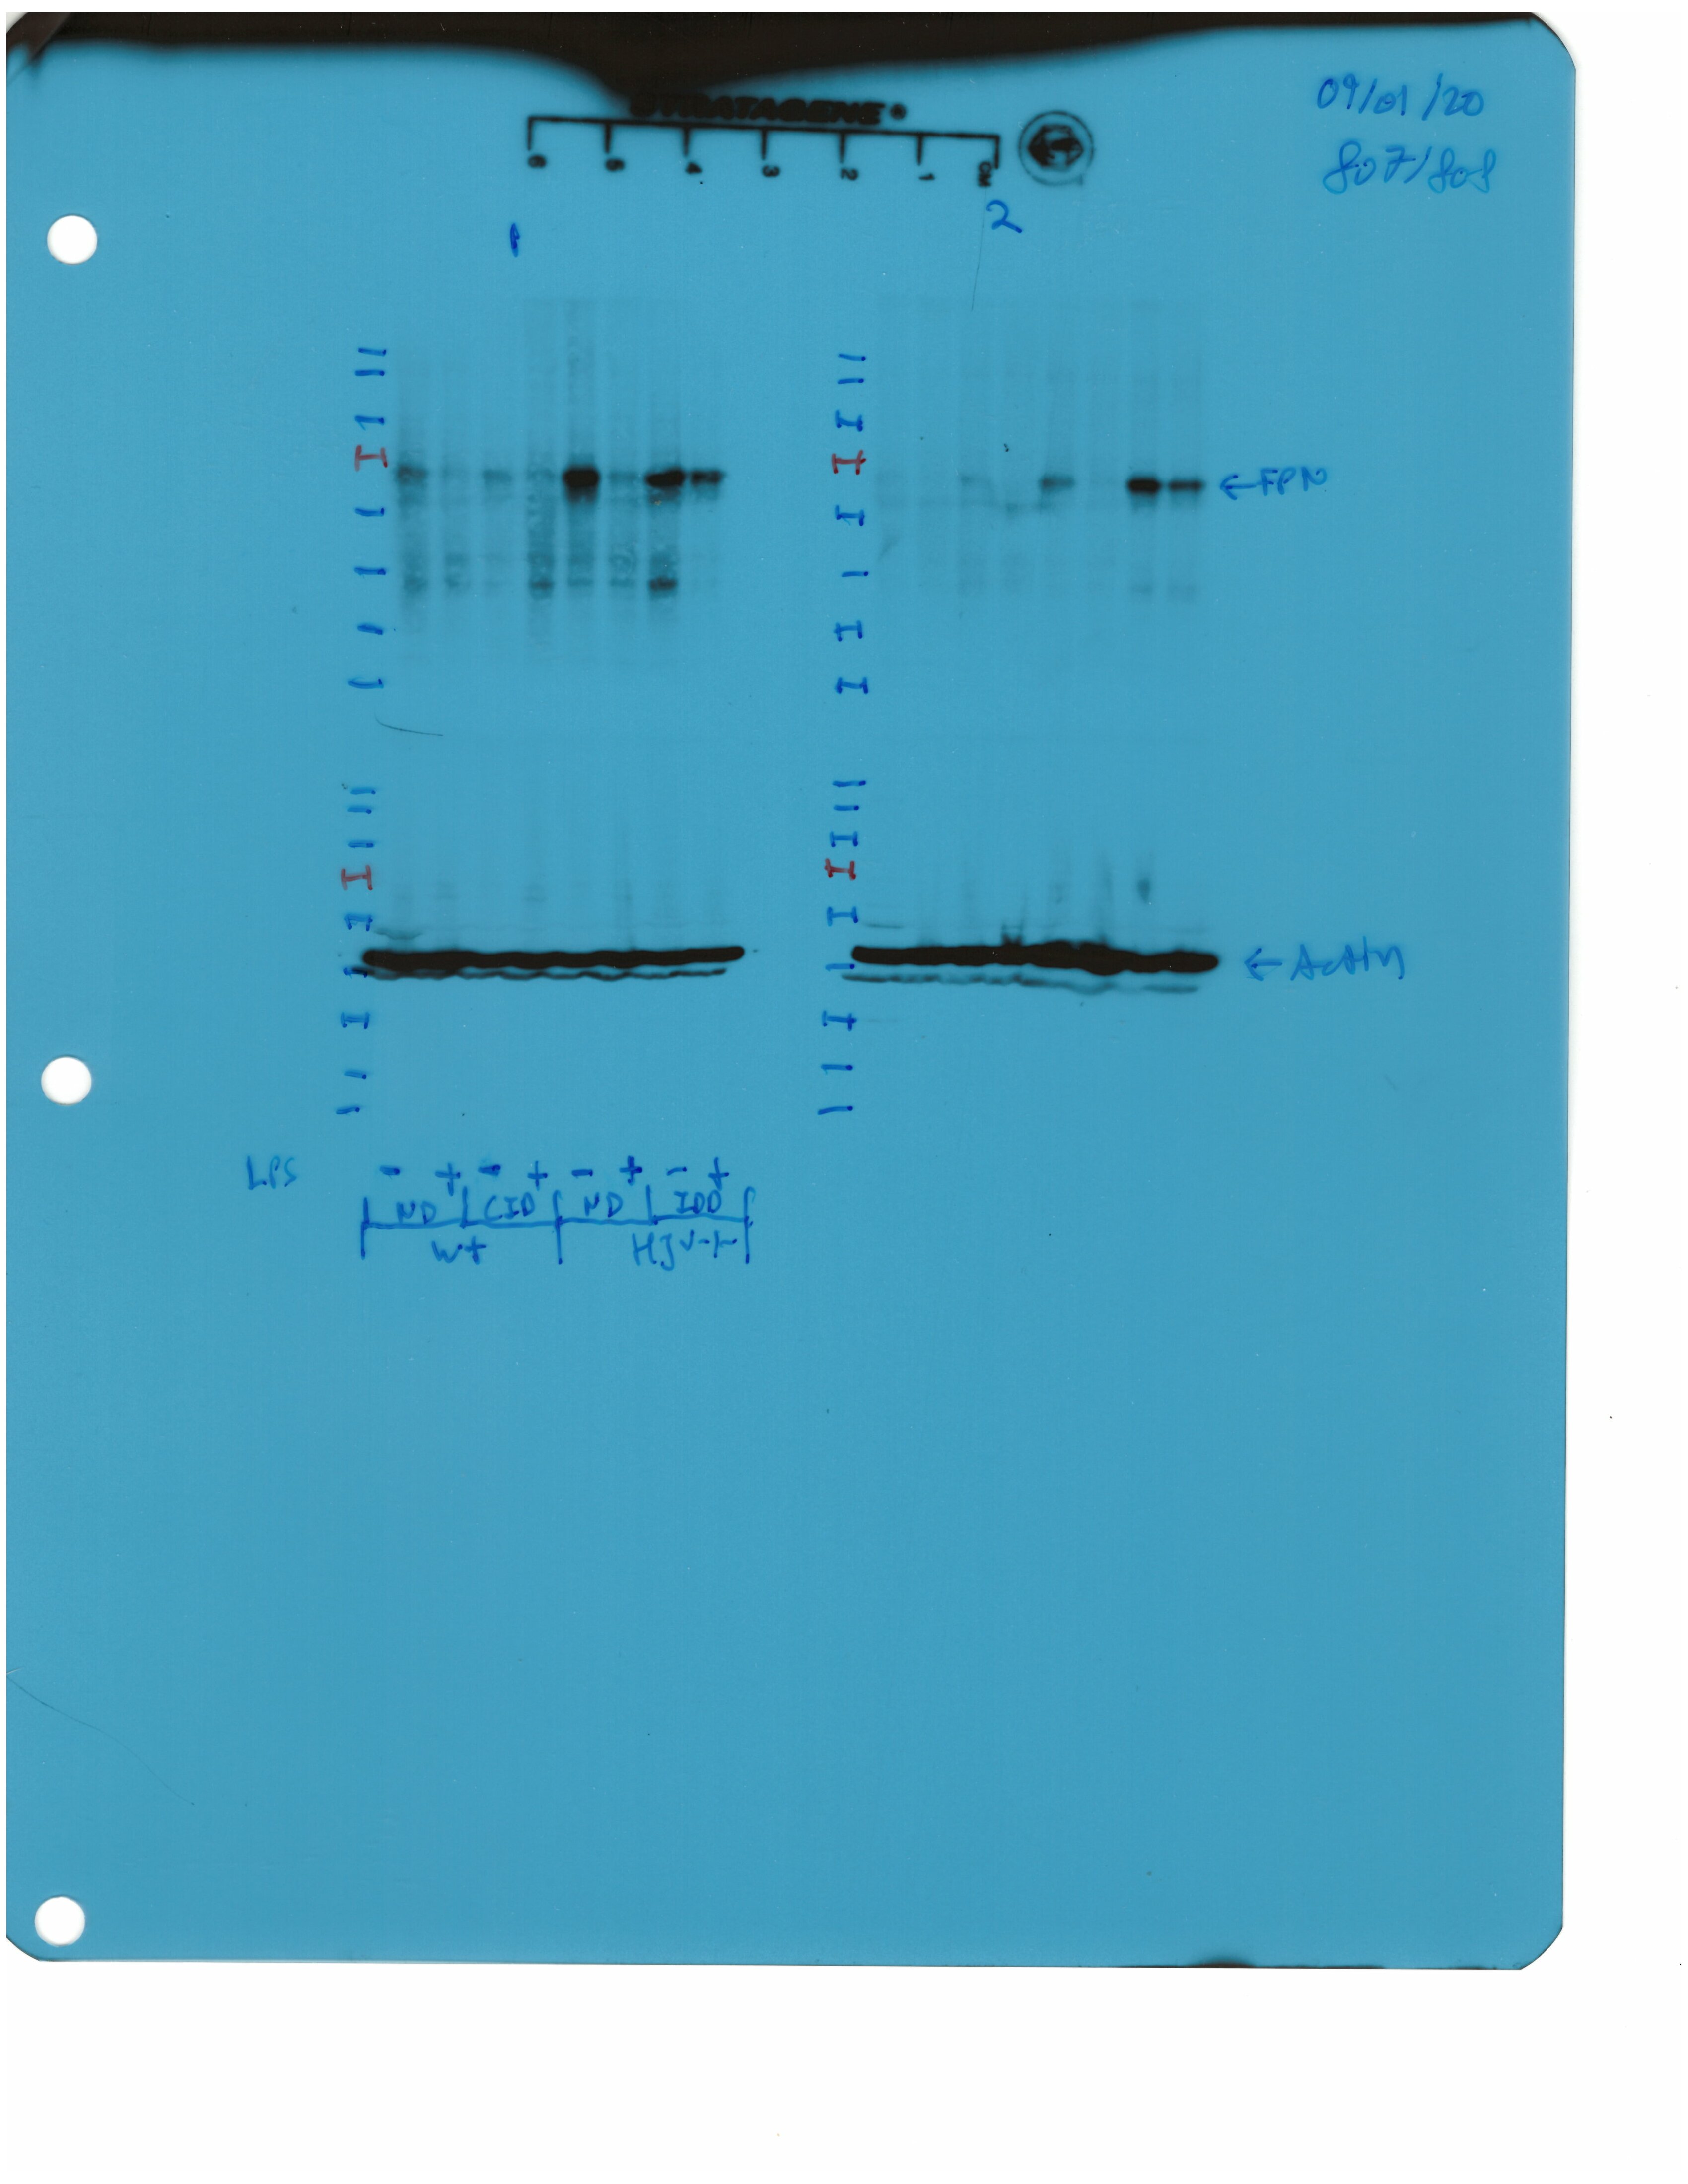
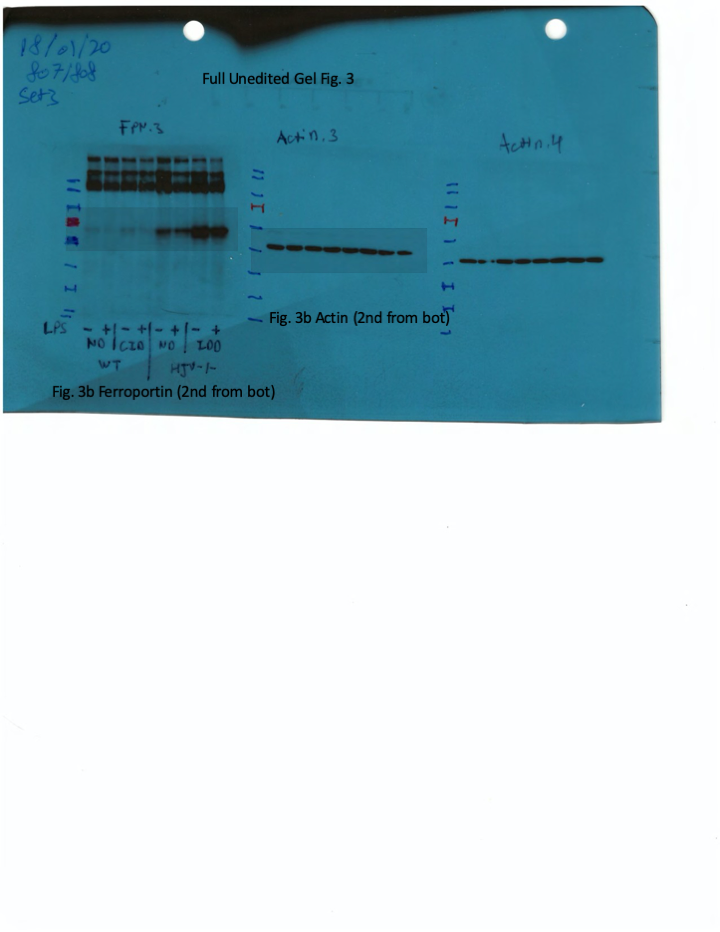
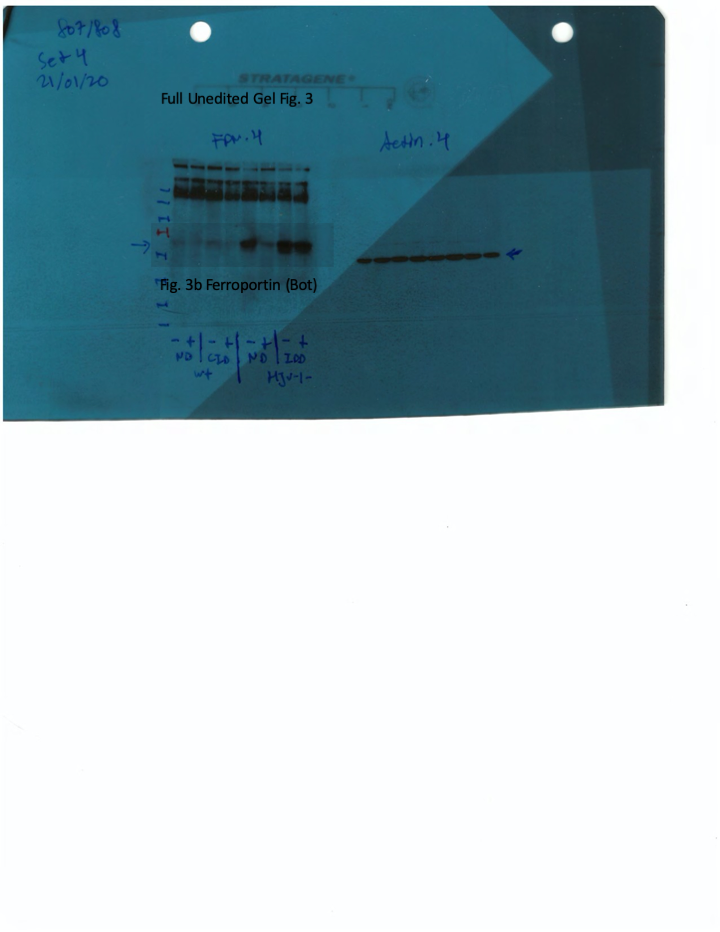
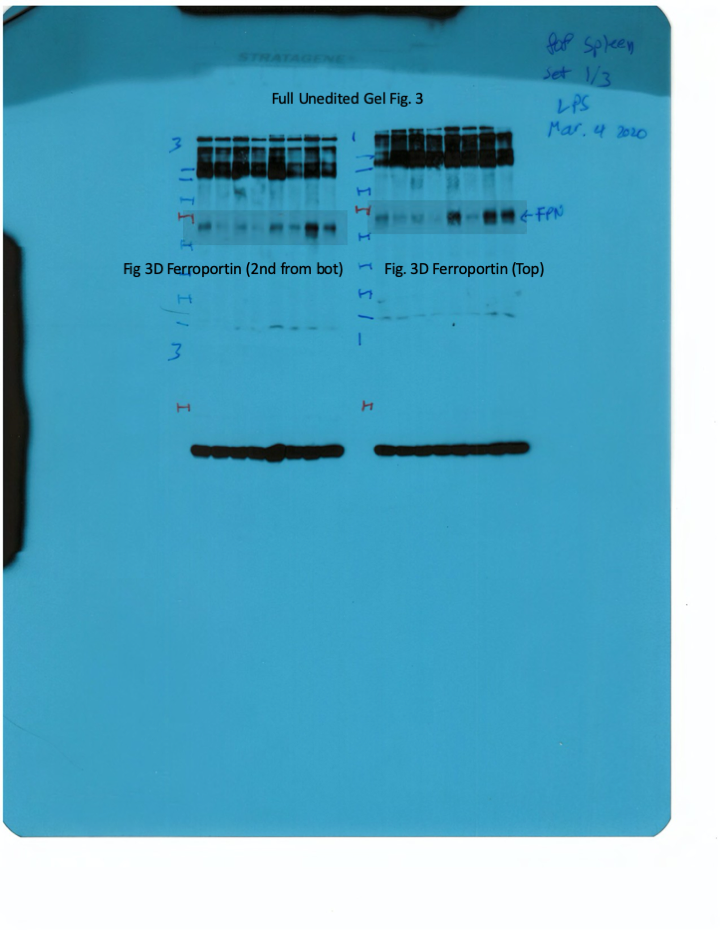
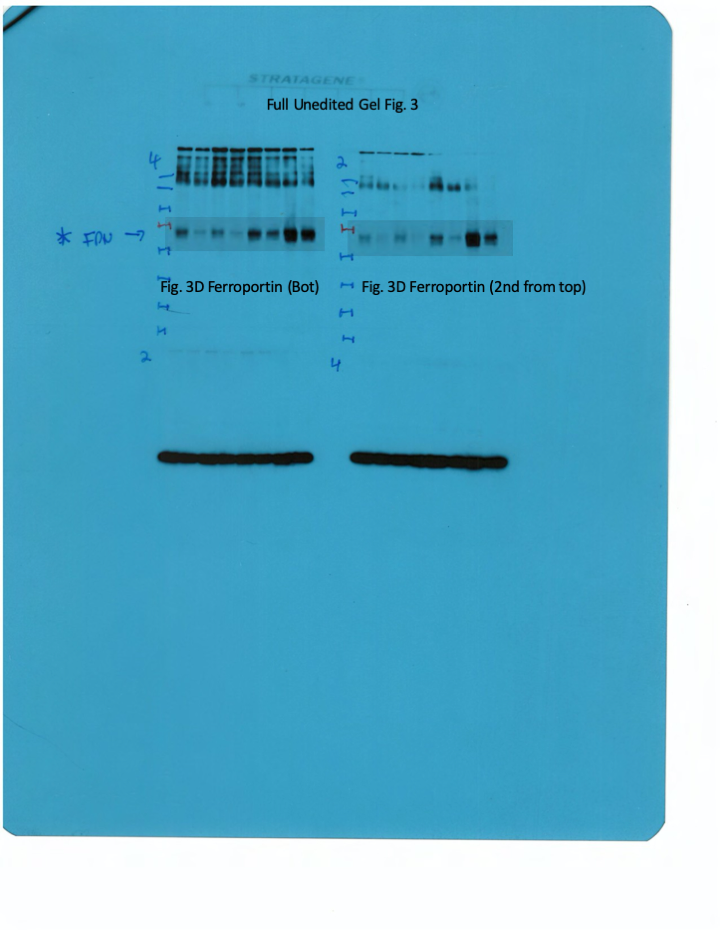
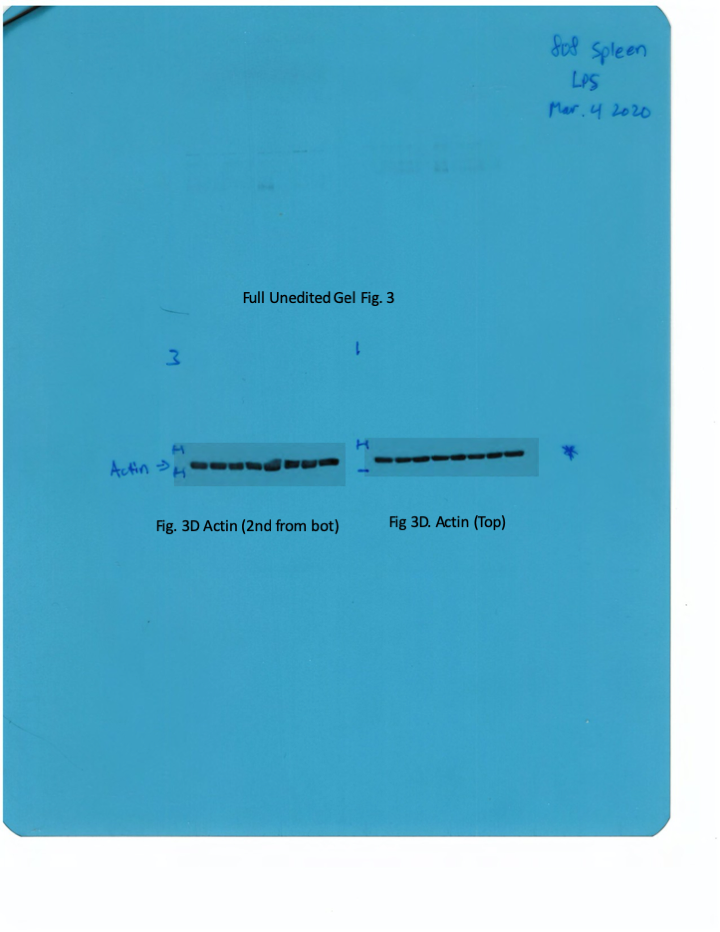
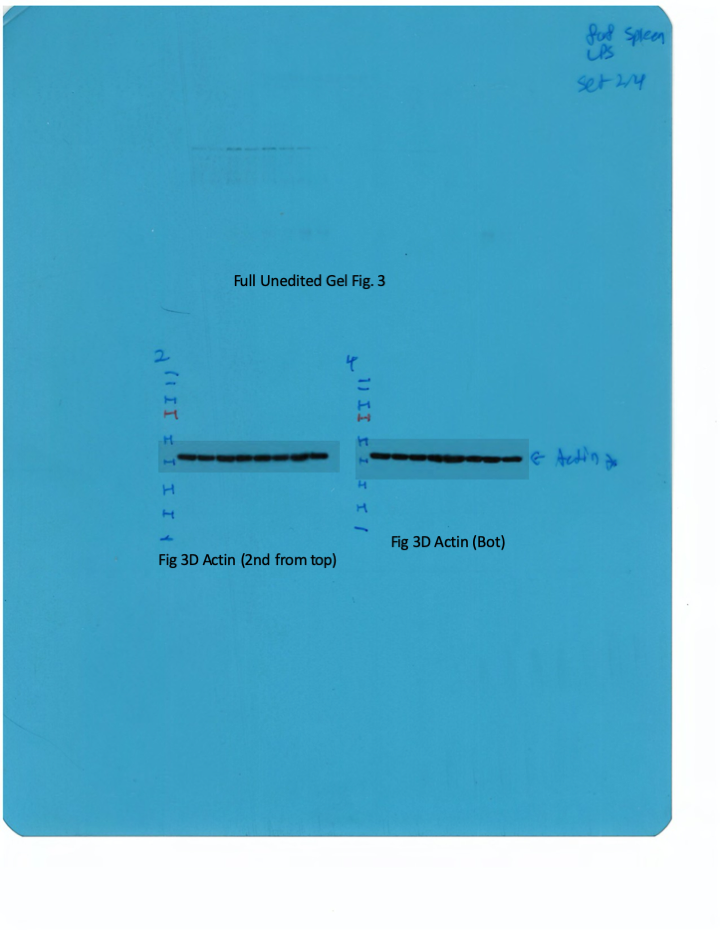
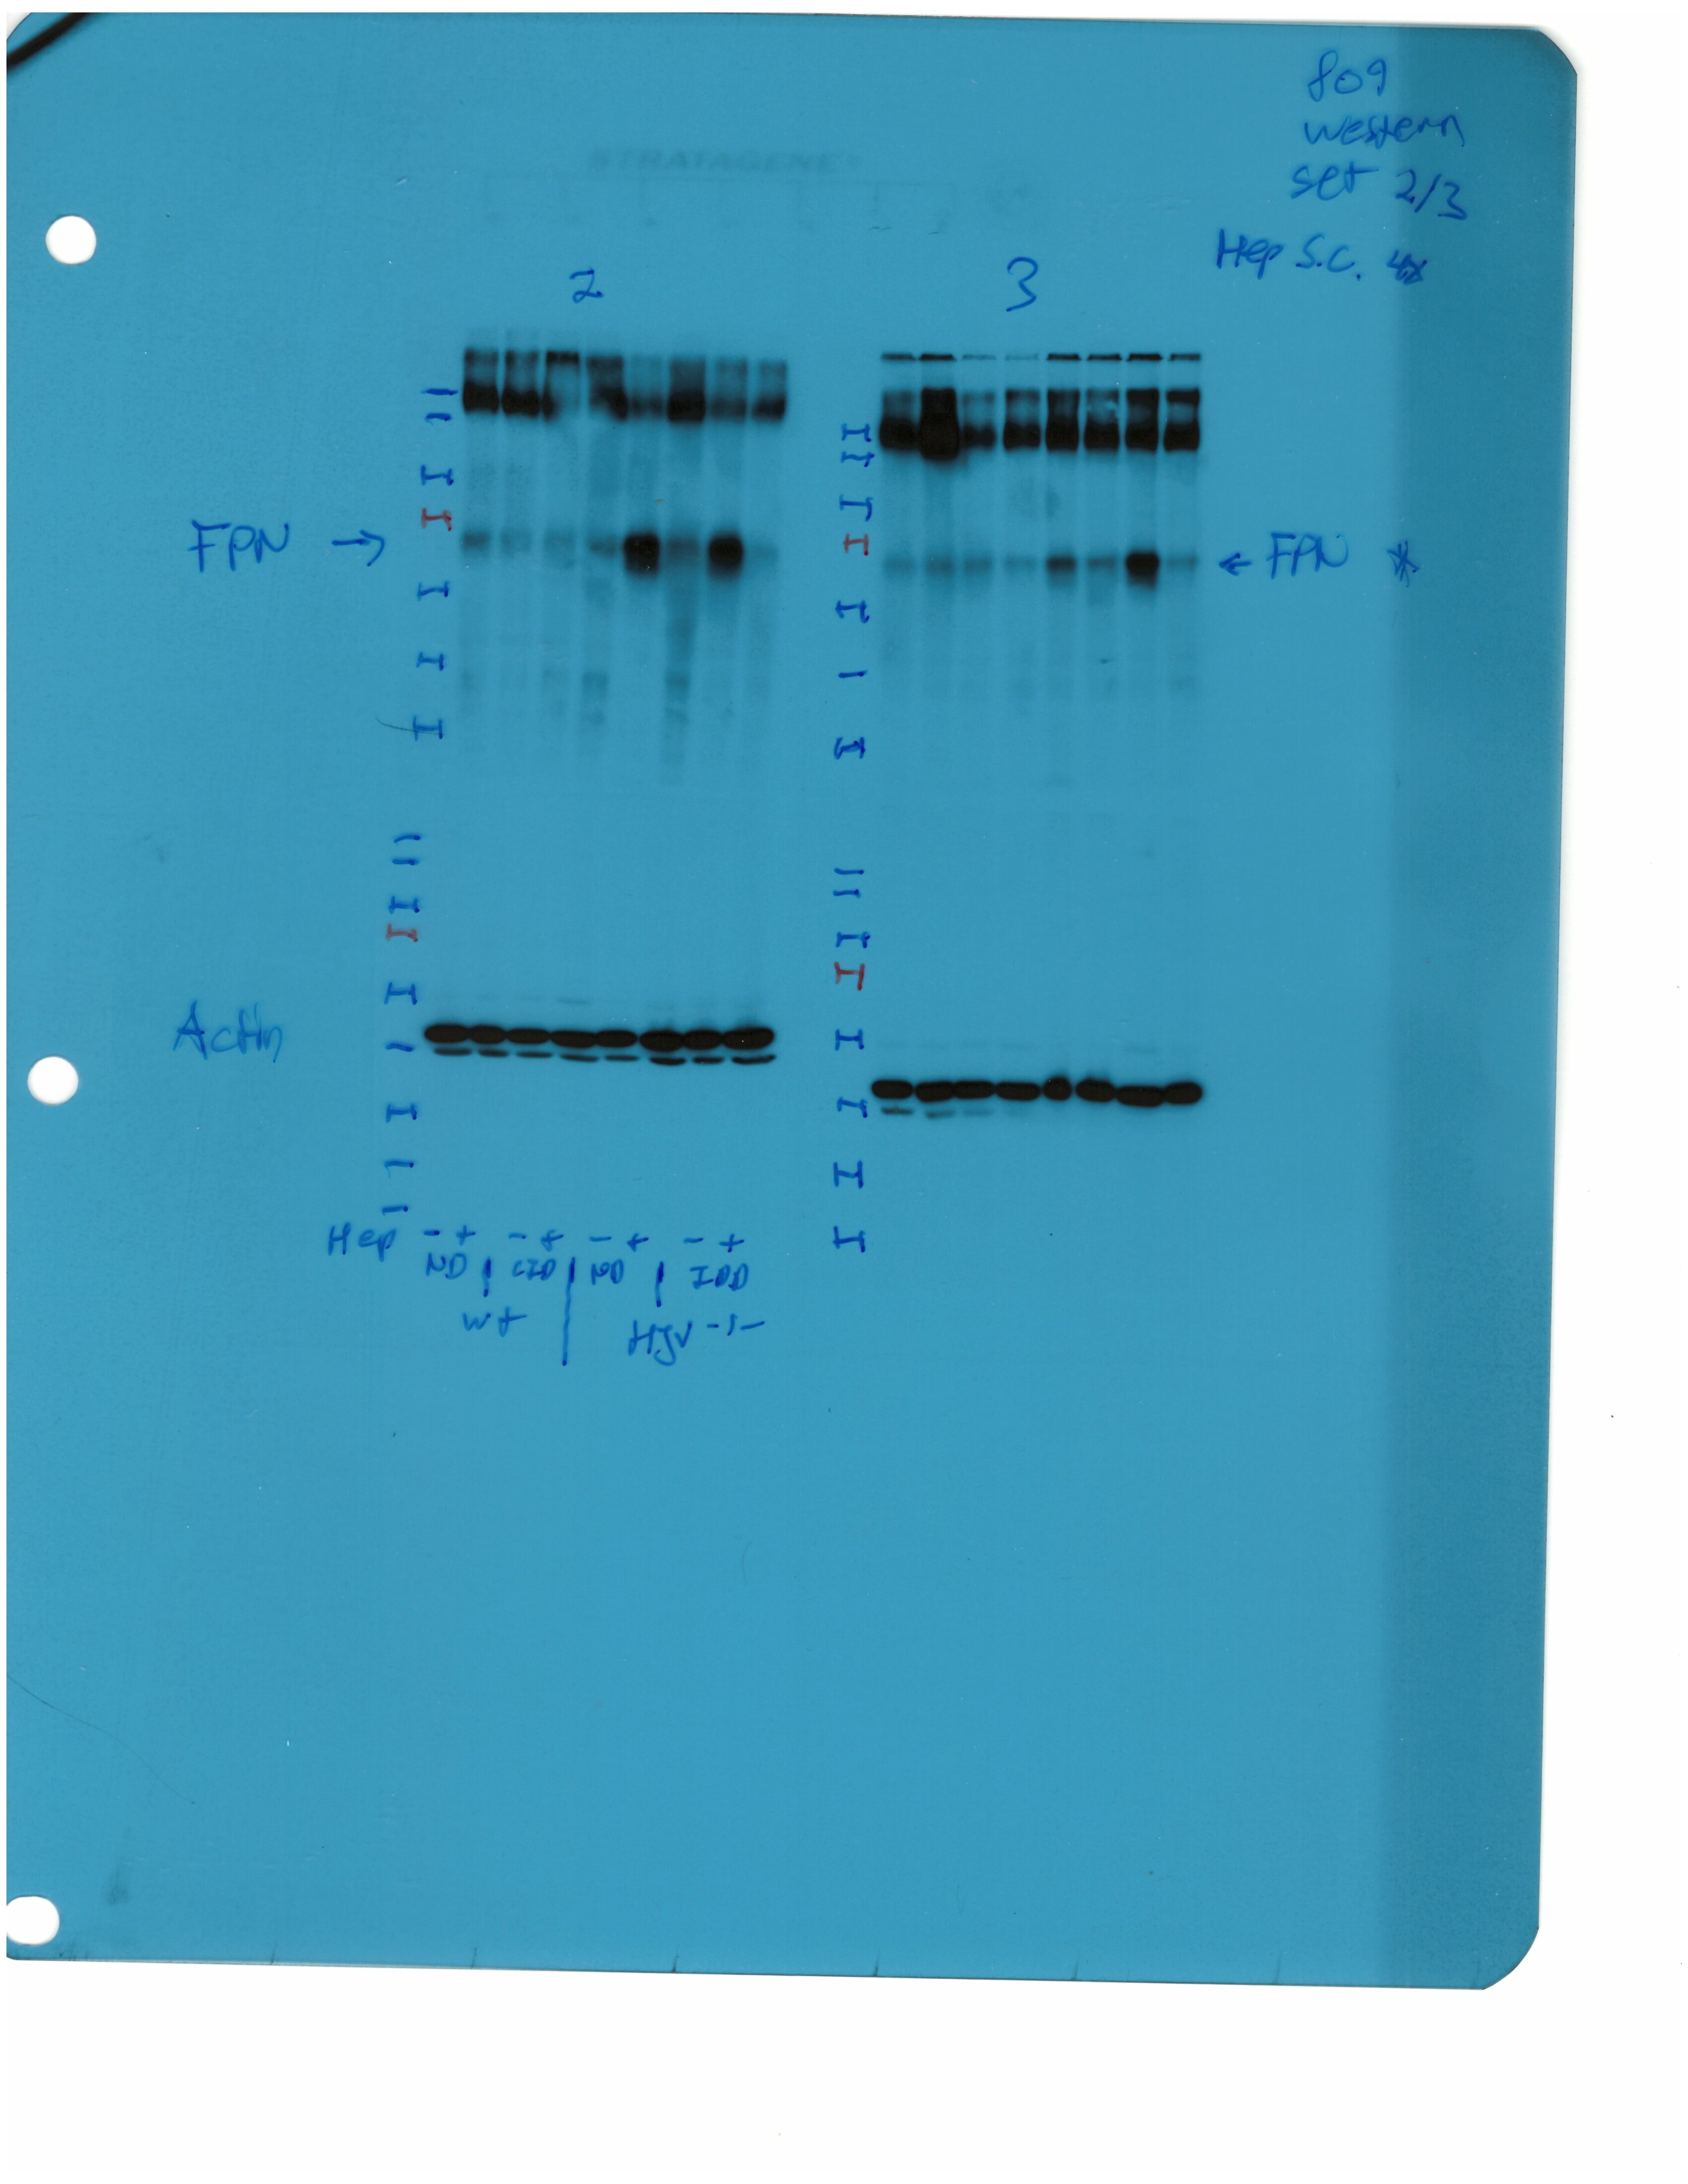
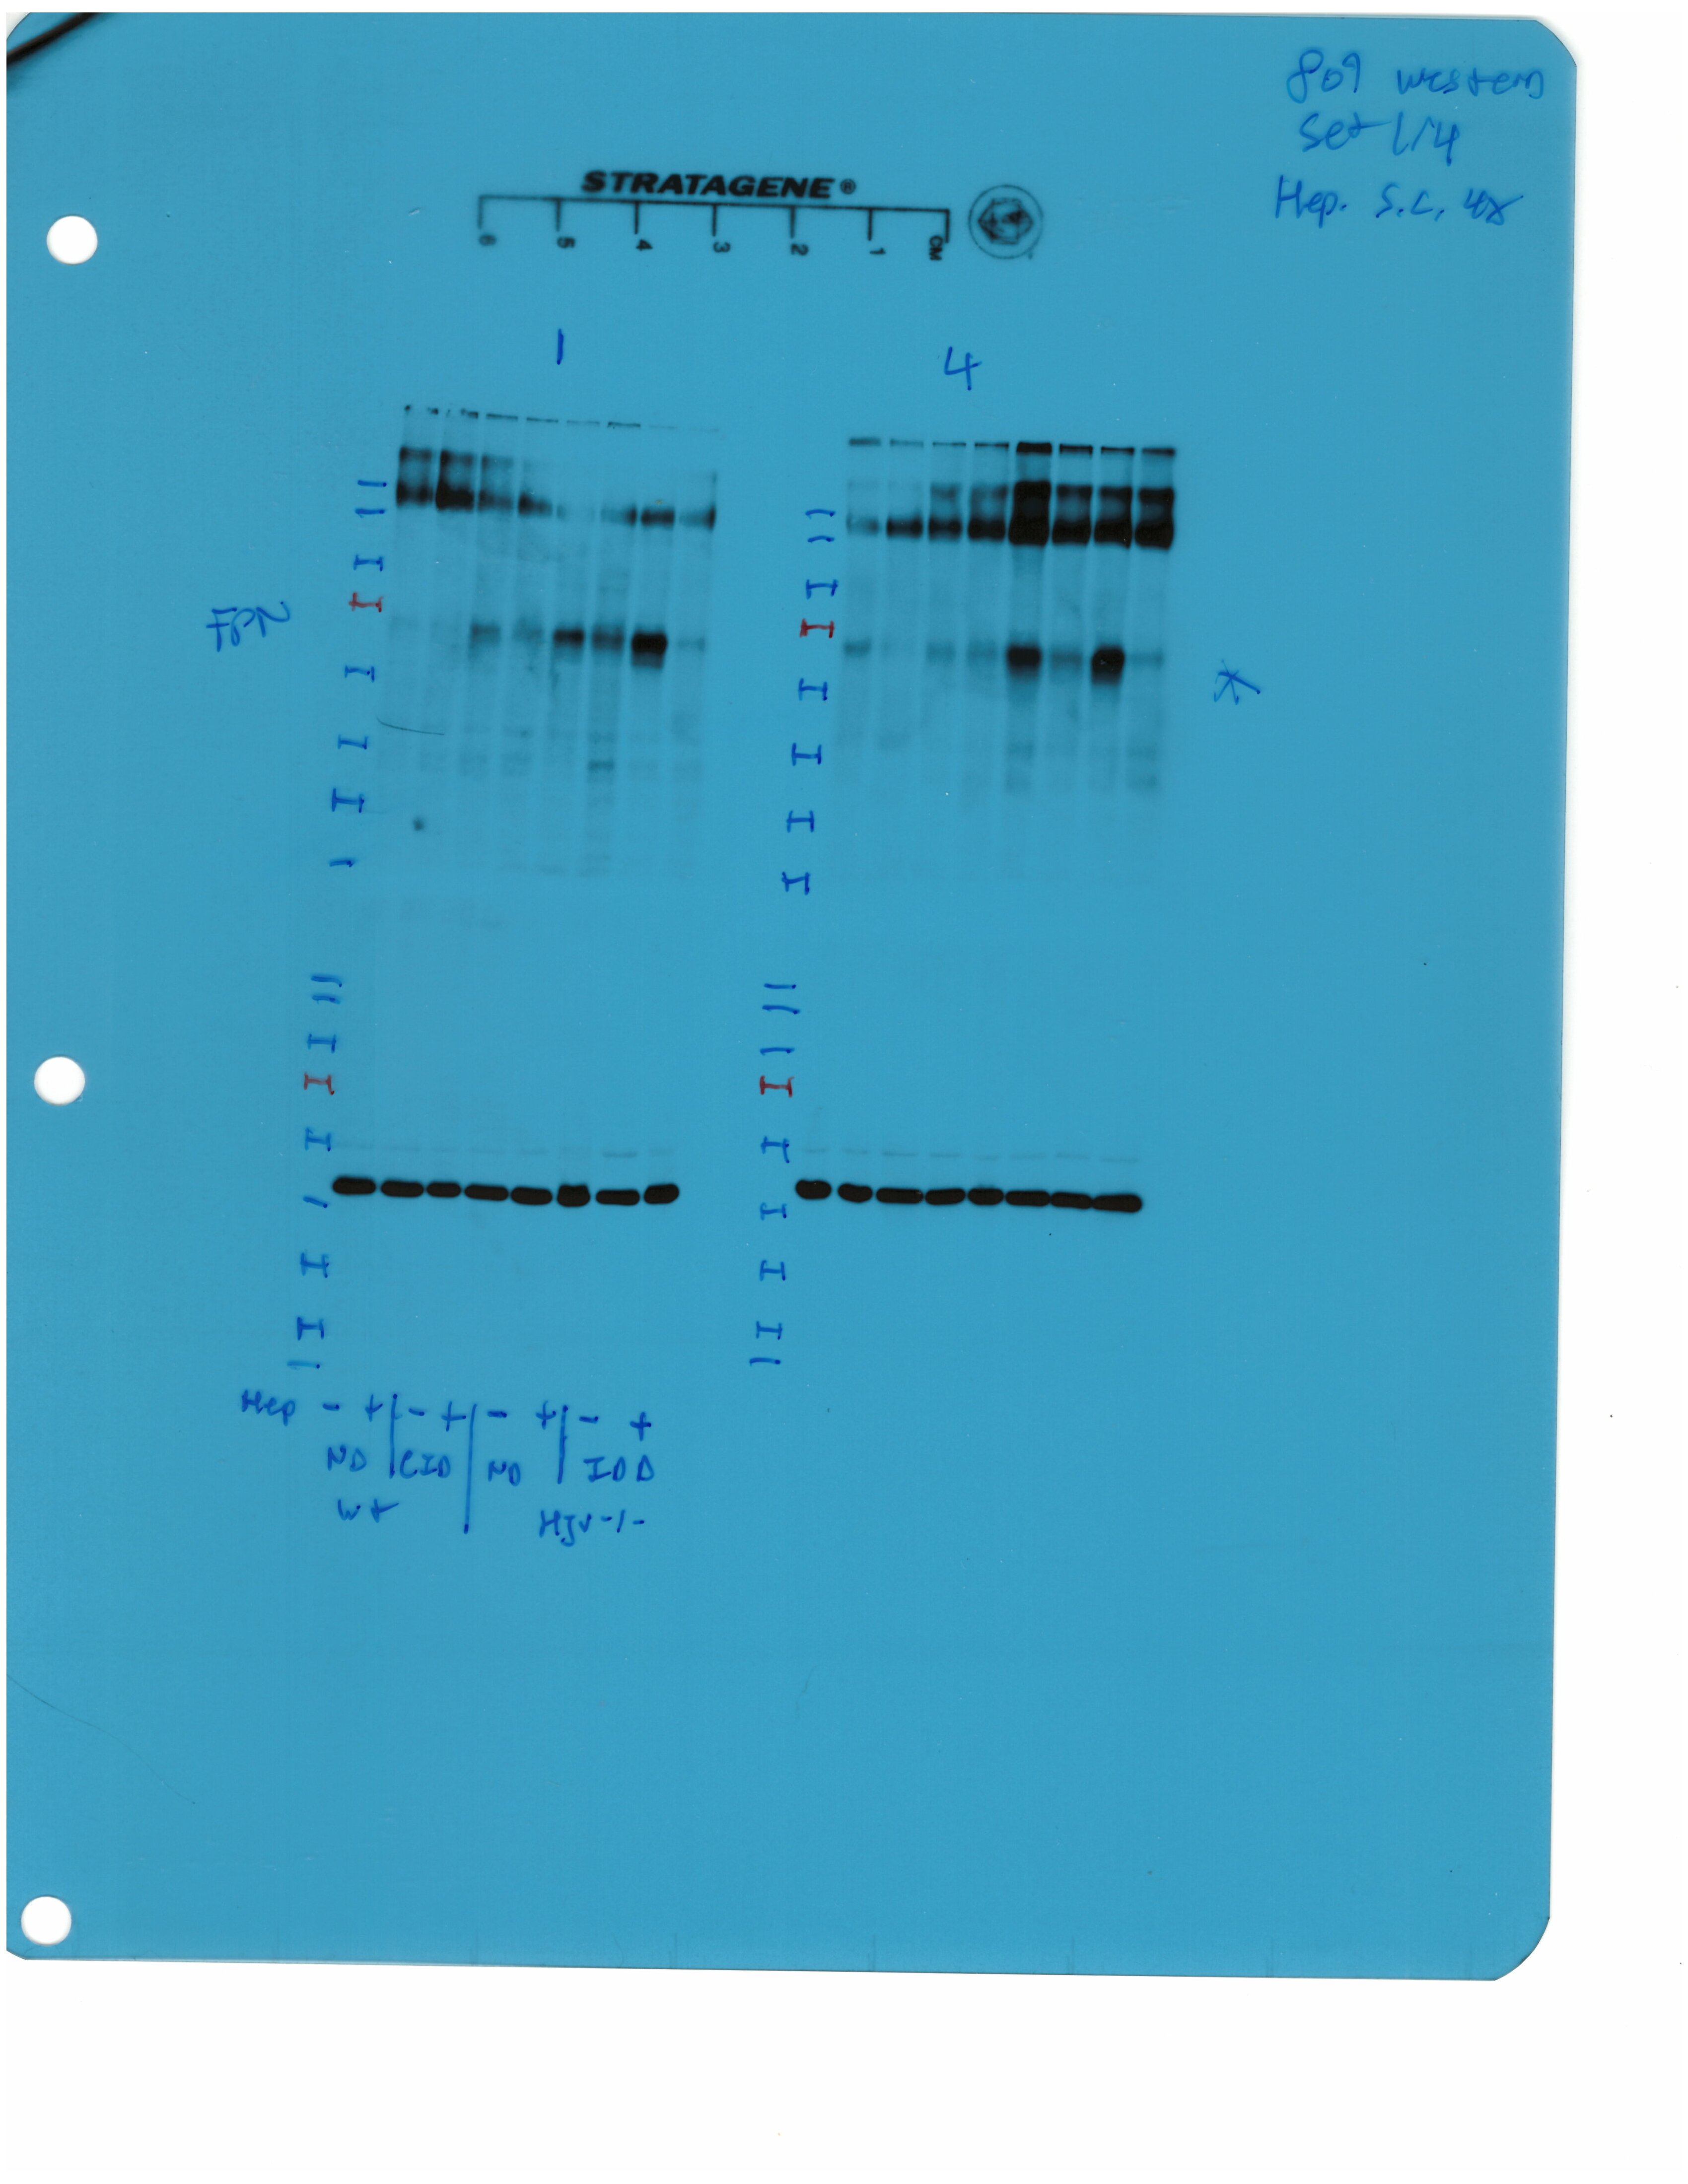
Effects of LPS on hepatic and splenic ferroportin of iron-manipulated wild type and Hjv-/- mice.
Livers and spleens from mice described in Figure 2 were dissected and processed for immunohistochemical and biochemical analysis of ferroportin. Immunohistochemical staining of ferroportin in liver (A) and spleen (C) sections (magnification for liver is 20 × and for spleen 5 ×). Western blot for ferroportin and β-actin in liver (B) and spleen (D) extracts from four representative mice in each condition. Blots were quantified by densitometry and ferroportin/β-actin ratios are shown on the right. Densitometric data are presented as the mean ± SEM. Statistically significant differences (p<0.05) compared to values from saline- or LPS-treated wild type control mice are indicated by a or b, respectively. Statistics in bold were performed using unpaired Student’s t test. HID: high-iron diet; IDD: iron-deficient diet.
-
Figure 3—source data 1
Western blot quantifications.
- https://cdn.elifesciences.org/articles/81332/elife-81332-fig3-data1-v2.xlsx
-
Figure 3—source data 2
Raw unlabeled Western blot ferroportin Figure 3D (a).
- https://cdn.elifesciences.org/articles/81332/elife-81332-fig3-data2-v2.jpg
-
Figure 3—source data 3
Raw unlabeled Western blot ferroportin Figure 3D (b).
- https://cdn.elifesciences.org/articles/81332/elife-81332-fig3-data3-v2.jpg
-
Figure 3—source data 4
Raw unlabeled Western blot β-actin Figure 3D.
- https://cdn.elifesciences.org/articles/81332/elife-81332-fig3-data4-v2.jpg
-
Figure 3—source data 5
Raw unlabeled Western blot β-actin Figure 3D (b).
- https://cdn.elifesciences.org/articles/81332/elife-81332-fig3-data5-v2.jpg
-
Figure 3—source data 6
Raw unlabeled Western blot ferroportin Figure 3B (a).
- https://cdn.elifesciences.org/articles/81332/elife-81332-fig3-data6-v2.jpg
-
Figure 3—source data 7
Raw unlabeled Western blot β-actin Figure 3B (a).
- https://cdn.elifesciences.org/articles/81332/elife-81332-fig3-data7-v2.jpg
-
Figure 3—source data 8
Raw unlabeled Western blot ferroportin and β-actin Figure 3B (a).
- https://cdn.elifesciences.org/articles/81332/elife-81332-fig3-data8-v2.jpg
-
Figure 3—source data 9
Raw unlabeled Western blot ferroportin Figure 3B (b).
- https://cdn.elifesciences.org/articles/81332/elife-81332-fig3-data9-v2.jpg
-
Figure 3—source data 10
Raw unlabeled Western blot β-actin Figure 3B (b).
- https://cdn.elifesciences.org/articles/81332/elife-81332-fig3-data10-v2.jpg
-
Figure 3—source data 11
Raw labeled Western blot β-actin Figure 3B (b).
- https://cdn.elifesciences.org/articles/81332/elife-81332-fig3-data11-v2.bmp
-
Figure 3—source data 12
Raw labeled Western blot ferroportin Figure 3B (b).
- https://cdn.elifesciences.org/articles/81332/elife-81332-fig3-data12-v2.bmp
-
Figure 3—source data 13
Raw labeled Western blot ferroportin and β-actin Figure 3B (a).
- https://cdn.elifesciences.org/articles/81332/elife-81332-fig3-data13-v2.bmp
-
Figure 3—source data 14
Raw labeled Western blot ferroportin Figure 3B (a).
- https://cdn.elifesciences.org/articles/81332/elife-81332-fig3-data14-v2.bmp
-
Figure 3—source data 15
Raw labeled Western blot β-actin Figure 3B (a).
- https://cdn.elifesciences.org/articles/81332/elife-81332-fig3-data15-v2.bmp
-
Figure 3—source data 16
Raw labeled Western blot ferroportin Figure 3D (b).
- https://cdn.elifesciences.org/articles/81332/elife-81332-fig3-data16-v2.bmp
-
Figure 3—source data 17
Raw labeled Western blot ferroportin Figure 3D (a).
- https://cdn.elifesciences.org/articles/81332/elife-81332-fig3-data17-v2.bmp
-
Figure 3—source data 18
Raw labeled Western blot β-actin Figure 3D (b).
- https://cdn.elifesciences.org/articles/81332/elife-81332-fig3-data18-v2.bmp
-
Figure 3—source data 19
Raw labeled Western blot β-actin Figure 3D (a).
- https://cdn.elifesciences.org/articles/81332/elife-81332-fig3-data19-v2.bmp
Figure 3—figure supplement 1
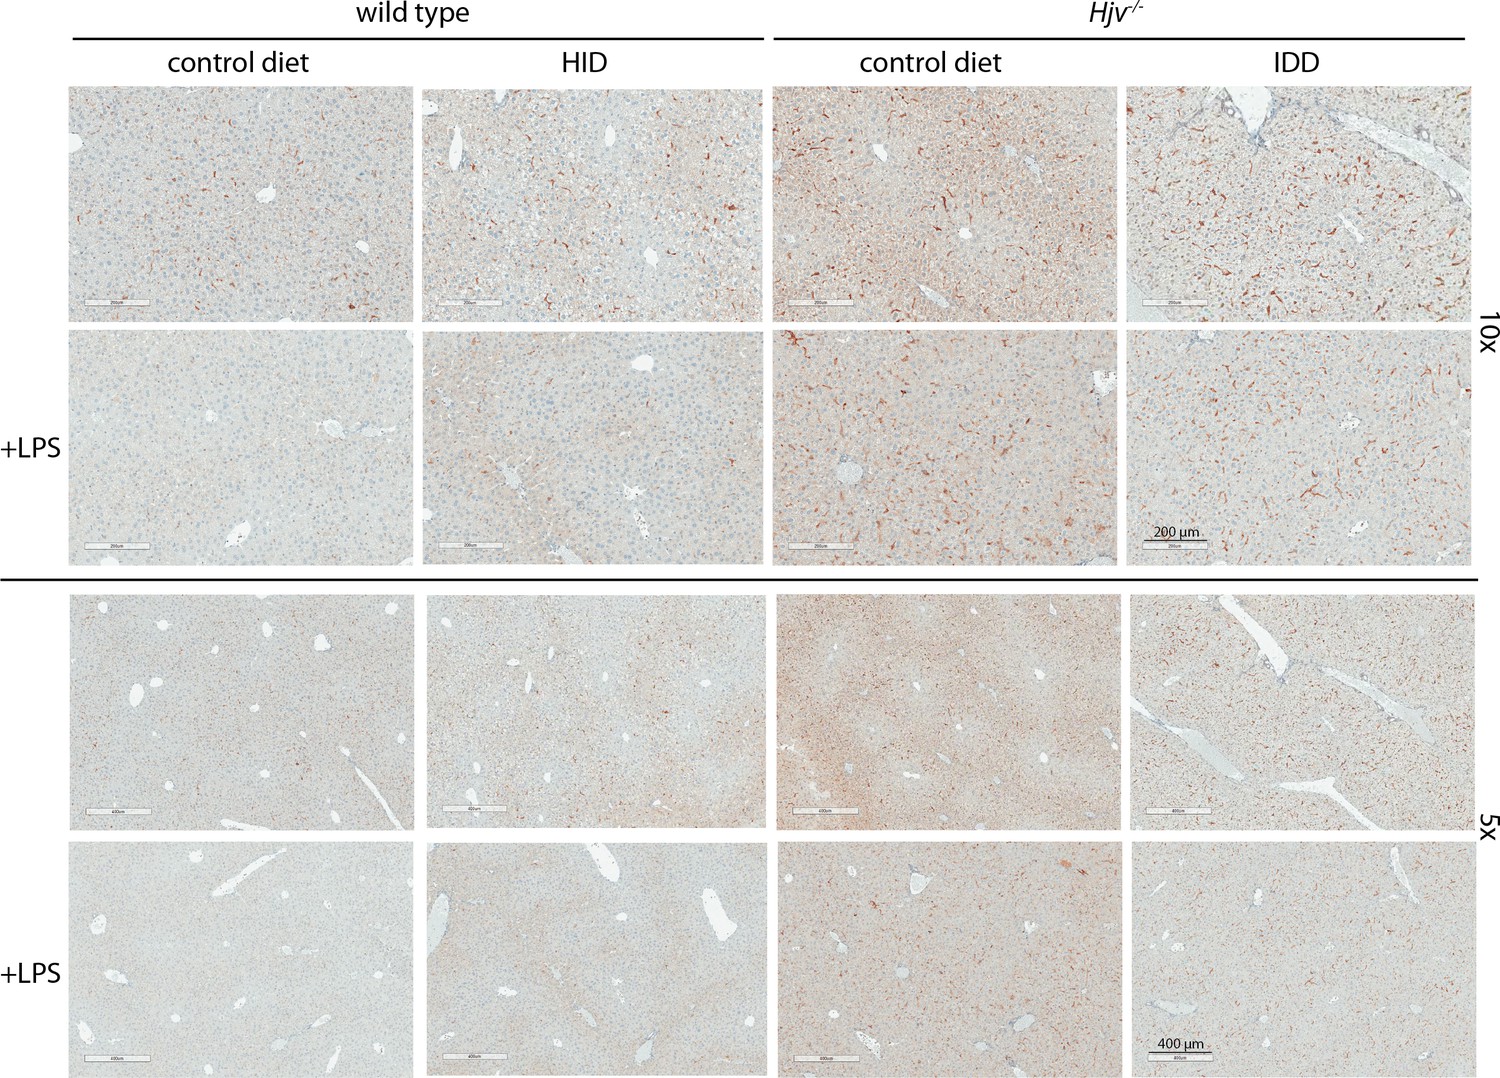
Low magnification immunohistochemical images of ferroportin in liver sections of dietary iron-manipulated wild type and Hjv-/- mice following LPS treatment.
Liver sections from mice described in Figure 2 were used for immunohistochemical analysis of ferroportin (magnifications: 10 × and 5 ×). HID: high-iron diet; IDD: iron-deficient diet.
Figure 3—figure supplement 2
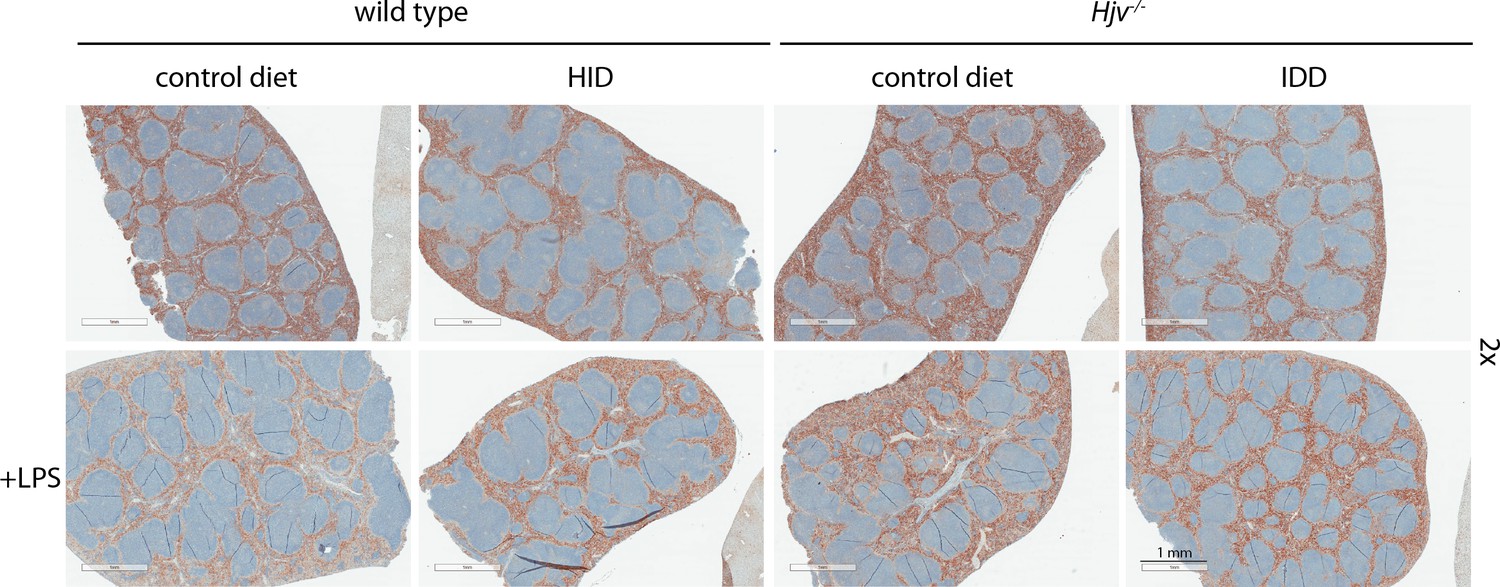
Low magnification immunohistochemical images of ferroportin in spleen sections of dietary iron-manipulated wild type and Hjv-/- mice following LPS treatment.
Spleen sections from mice described in Figure 2 were used for immunohistochemical analysis of ferroportin (magnification: 2 ×). HID: high-iron diet; IDD: iron-deficient diet.
Figure 4 with 3 supplements
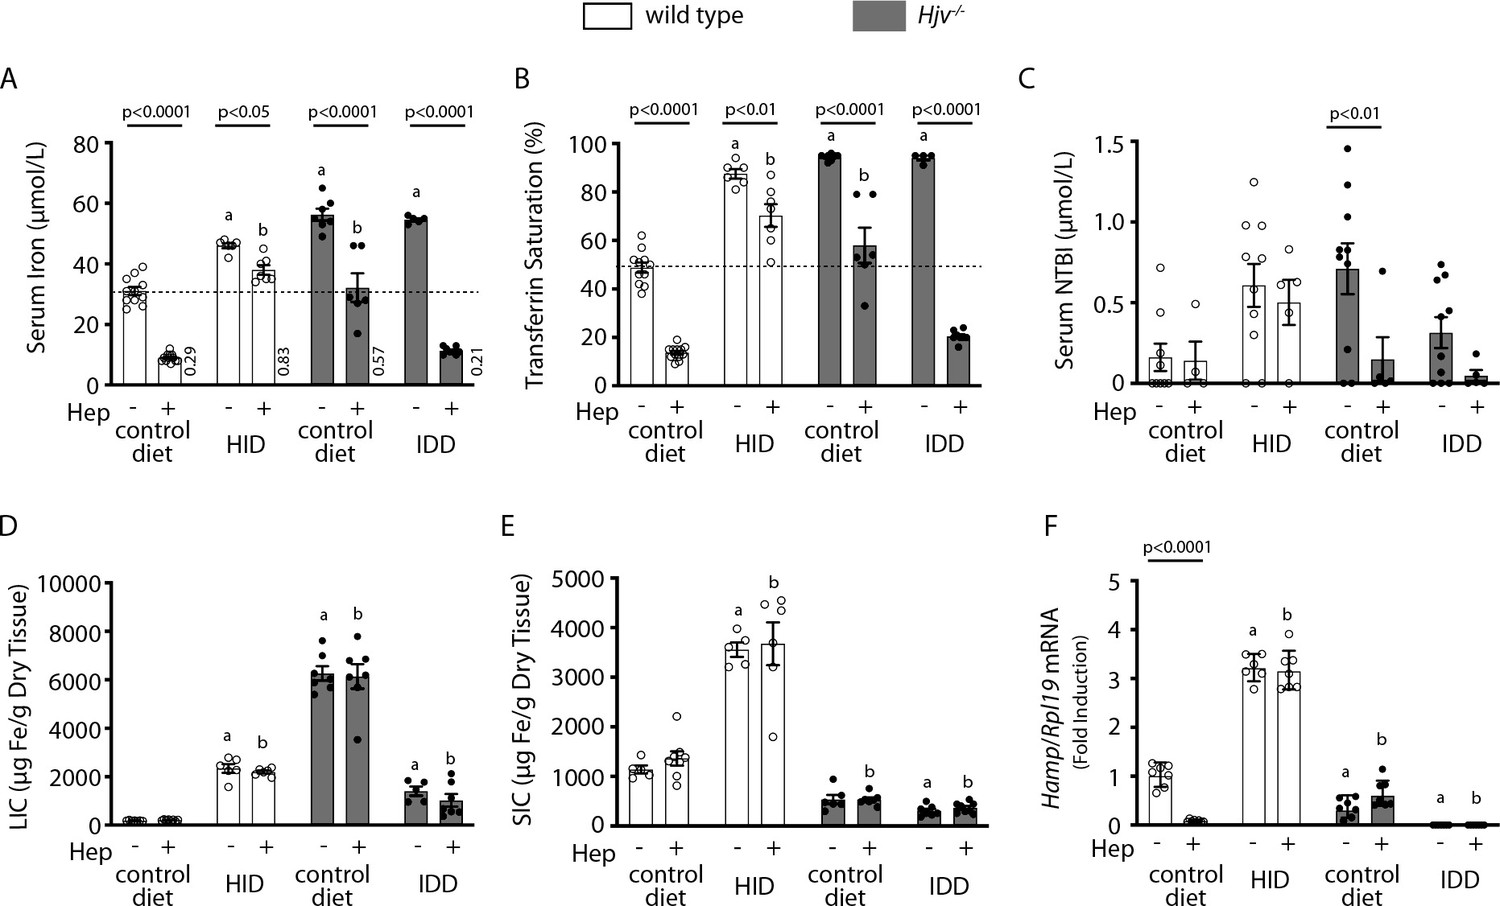
Iron depletion of Hjv-/- mice improves the efficacy of synthetic hepcidin to promote hypoferremia.
Four-week-old wild type male mice (n=12–14 per group) were placed on HID for 5 weeks. Conversely, age- and sex-matched isogenic Hjv-/- mice (n=12–14 per group) were placed on IDD for 5 weeks to prevent excessive iron overload. Other animals from both genotypes were kept on standard diet. Half of the mice were injected every 2 hr for a total of 4 injections with saline, and the other half with 2.5 µg/g synthetic hepcidin. Sera were collected by cardiac puncture and analyzed for: (A) iron, (B) transferrin saturation, and (C) non-transferrin bound iron (NTBI). Livers and spleens were dissected and processed for analysis of: (D) liver iron content (LIC) and (E) splenic iron content (SIC) by the ferrozine assay. (F) qPCR analysis of liver Hamp mRNA. The dotted line in (A) and (B) indicates baseline serum iron and transferrin saturation, respectively, of wild type mice on control diet. Values in (A) represent ratios of serum iron levels between untreated and hepcidin-treated mice. Data in (A–E) are presented as the mean ± SEM and in (F) as geometric mean ± SD. Statistically significant differences (p<0.05) compared to values from saline- or hepcidin-treated wild type control mice are indicated by a or b, respectively. HID: high-iron diet; IDD: iron-deficient diet.
-
Figure 4—source data 1
qPCR data.
- https://cdn.elifesciences.org/articles/81332/elife-81332-fig4-data1-v2.xlsx
-
Figure 4—source data 2
Liver and spleen iron quantification.
- https://cdn.elifesciences.org/articles/81332/elife-81332-fig4-data2-v2.xlsx
-
Figure 4—source data 3
Serum NTBI calculations.
- https://cdn.elifesciences.org/articles/81332/elife-81332-fig4-data3-v2.xlsx
-
Figure 4—source data 4
Serum hepcidin calculations.
- https://cdn.elifesciences.org/articles/81332/elife-81332-fig4-data4-v2.xls
-
Figure 4—source data 5
Serum iron ratios.
- https://cdn.elifesciences.org/articles/81332/elife-81332-fig4-data5-v2.xlsx
-
Figure 4—source data 6
Serum iron and transferrin saturation values.
- https://cdn.elifesciences.org/articles/81332/elife-81332-fig4-data6-v2.xlsx
Figure 4—figure supplement 1
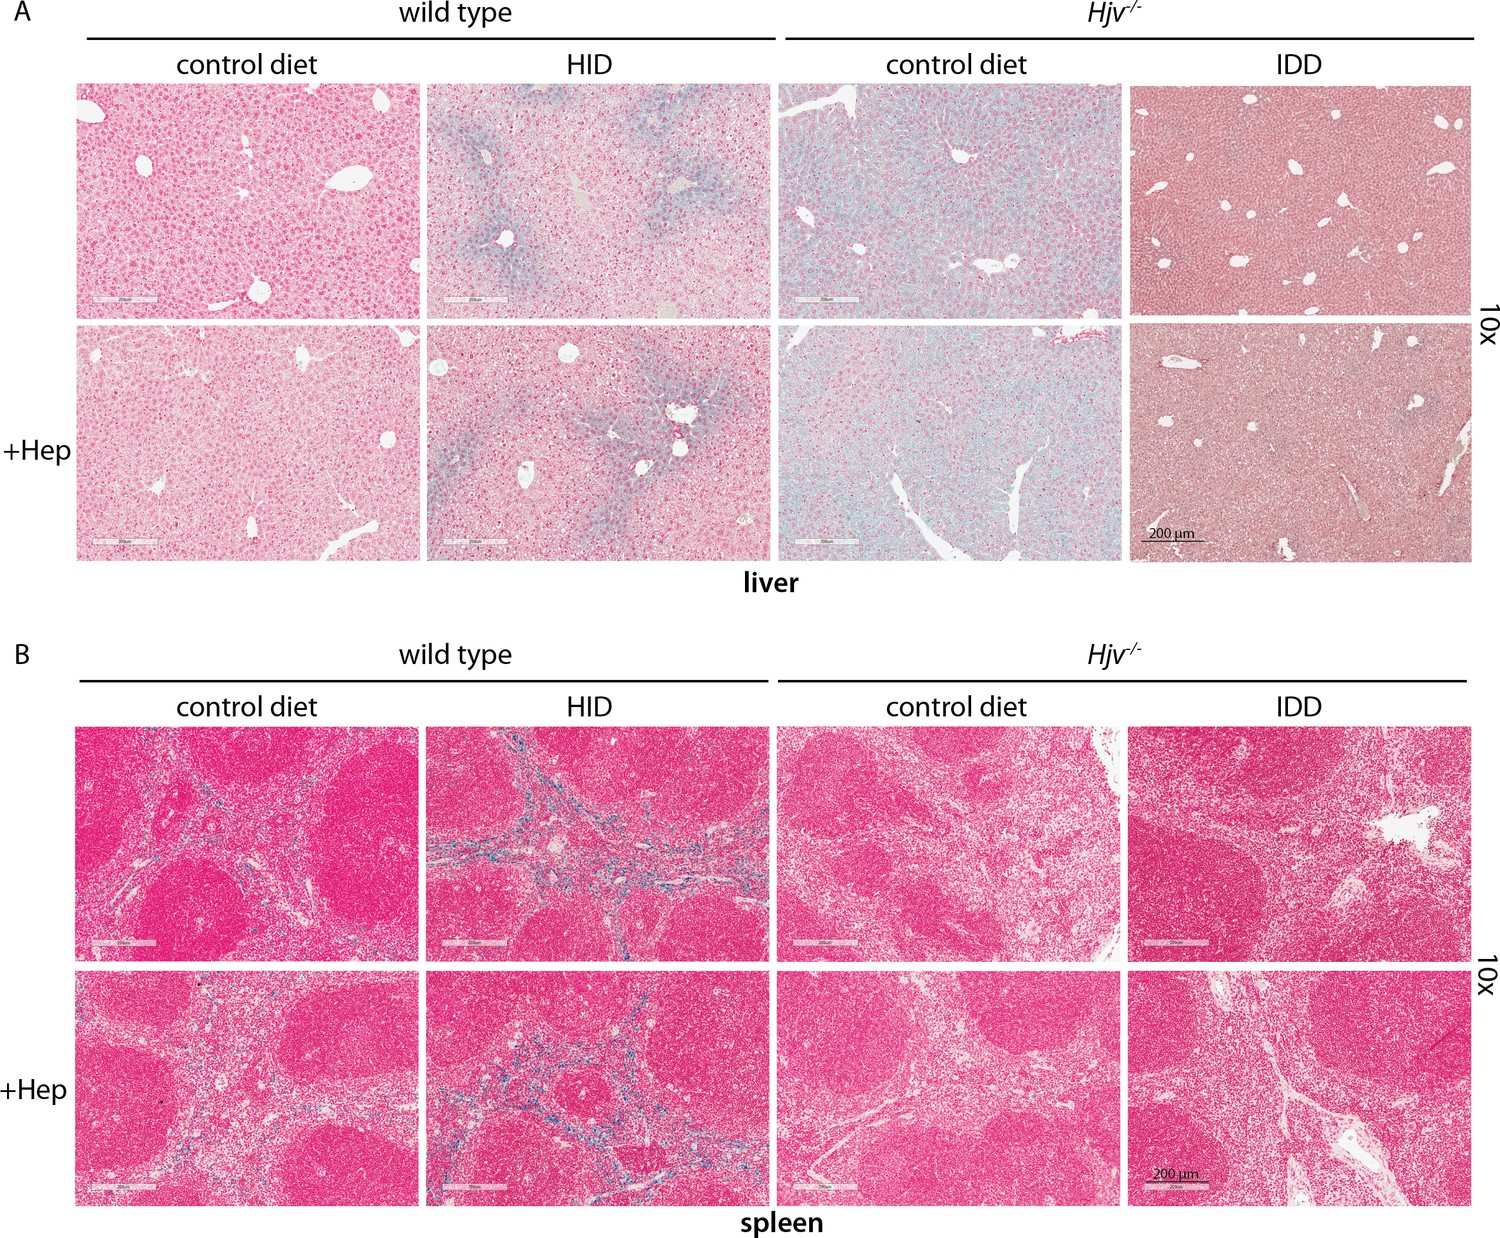
Perls staining for iron deposits in liver and spleen sections of dietary iron-manipulated wild type and Hjv-/- mice following treatment with synthetic hepcidin.
(A) Liver and (B) spleen sections from mice described in Figure 4 were stained with Perls Prussian blue (magnification: 10 ×). HID: high-iron diet; IDD: iron-deficient diet.
Figure 4—figure supplement 2

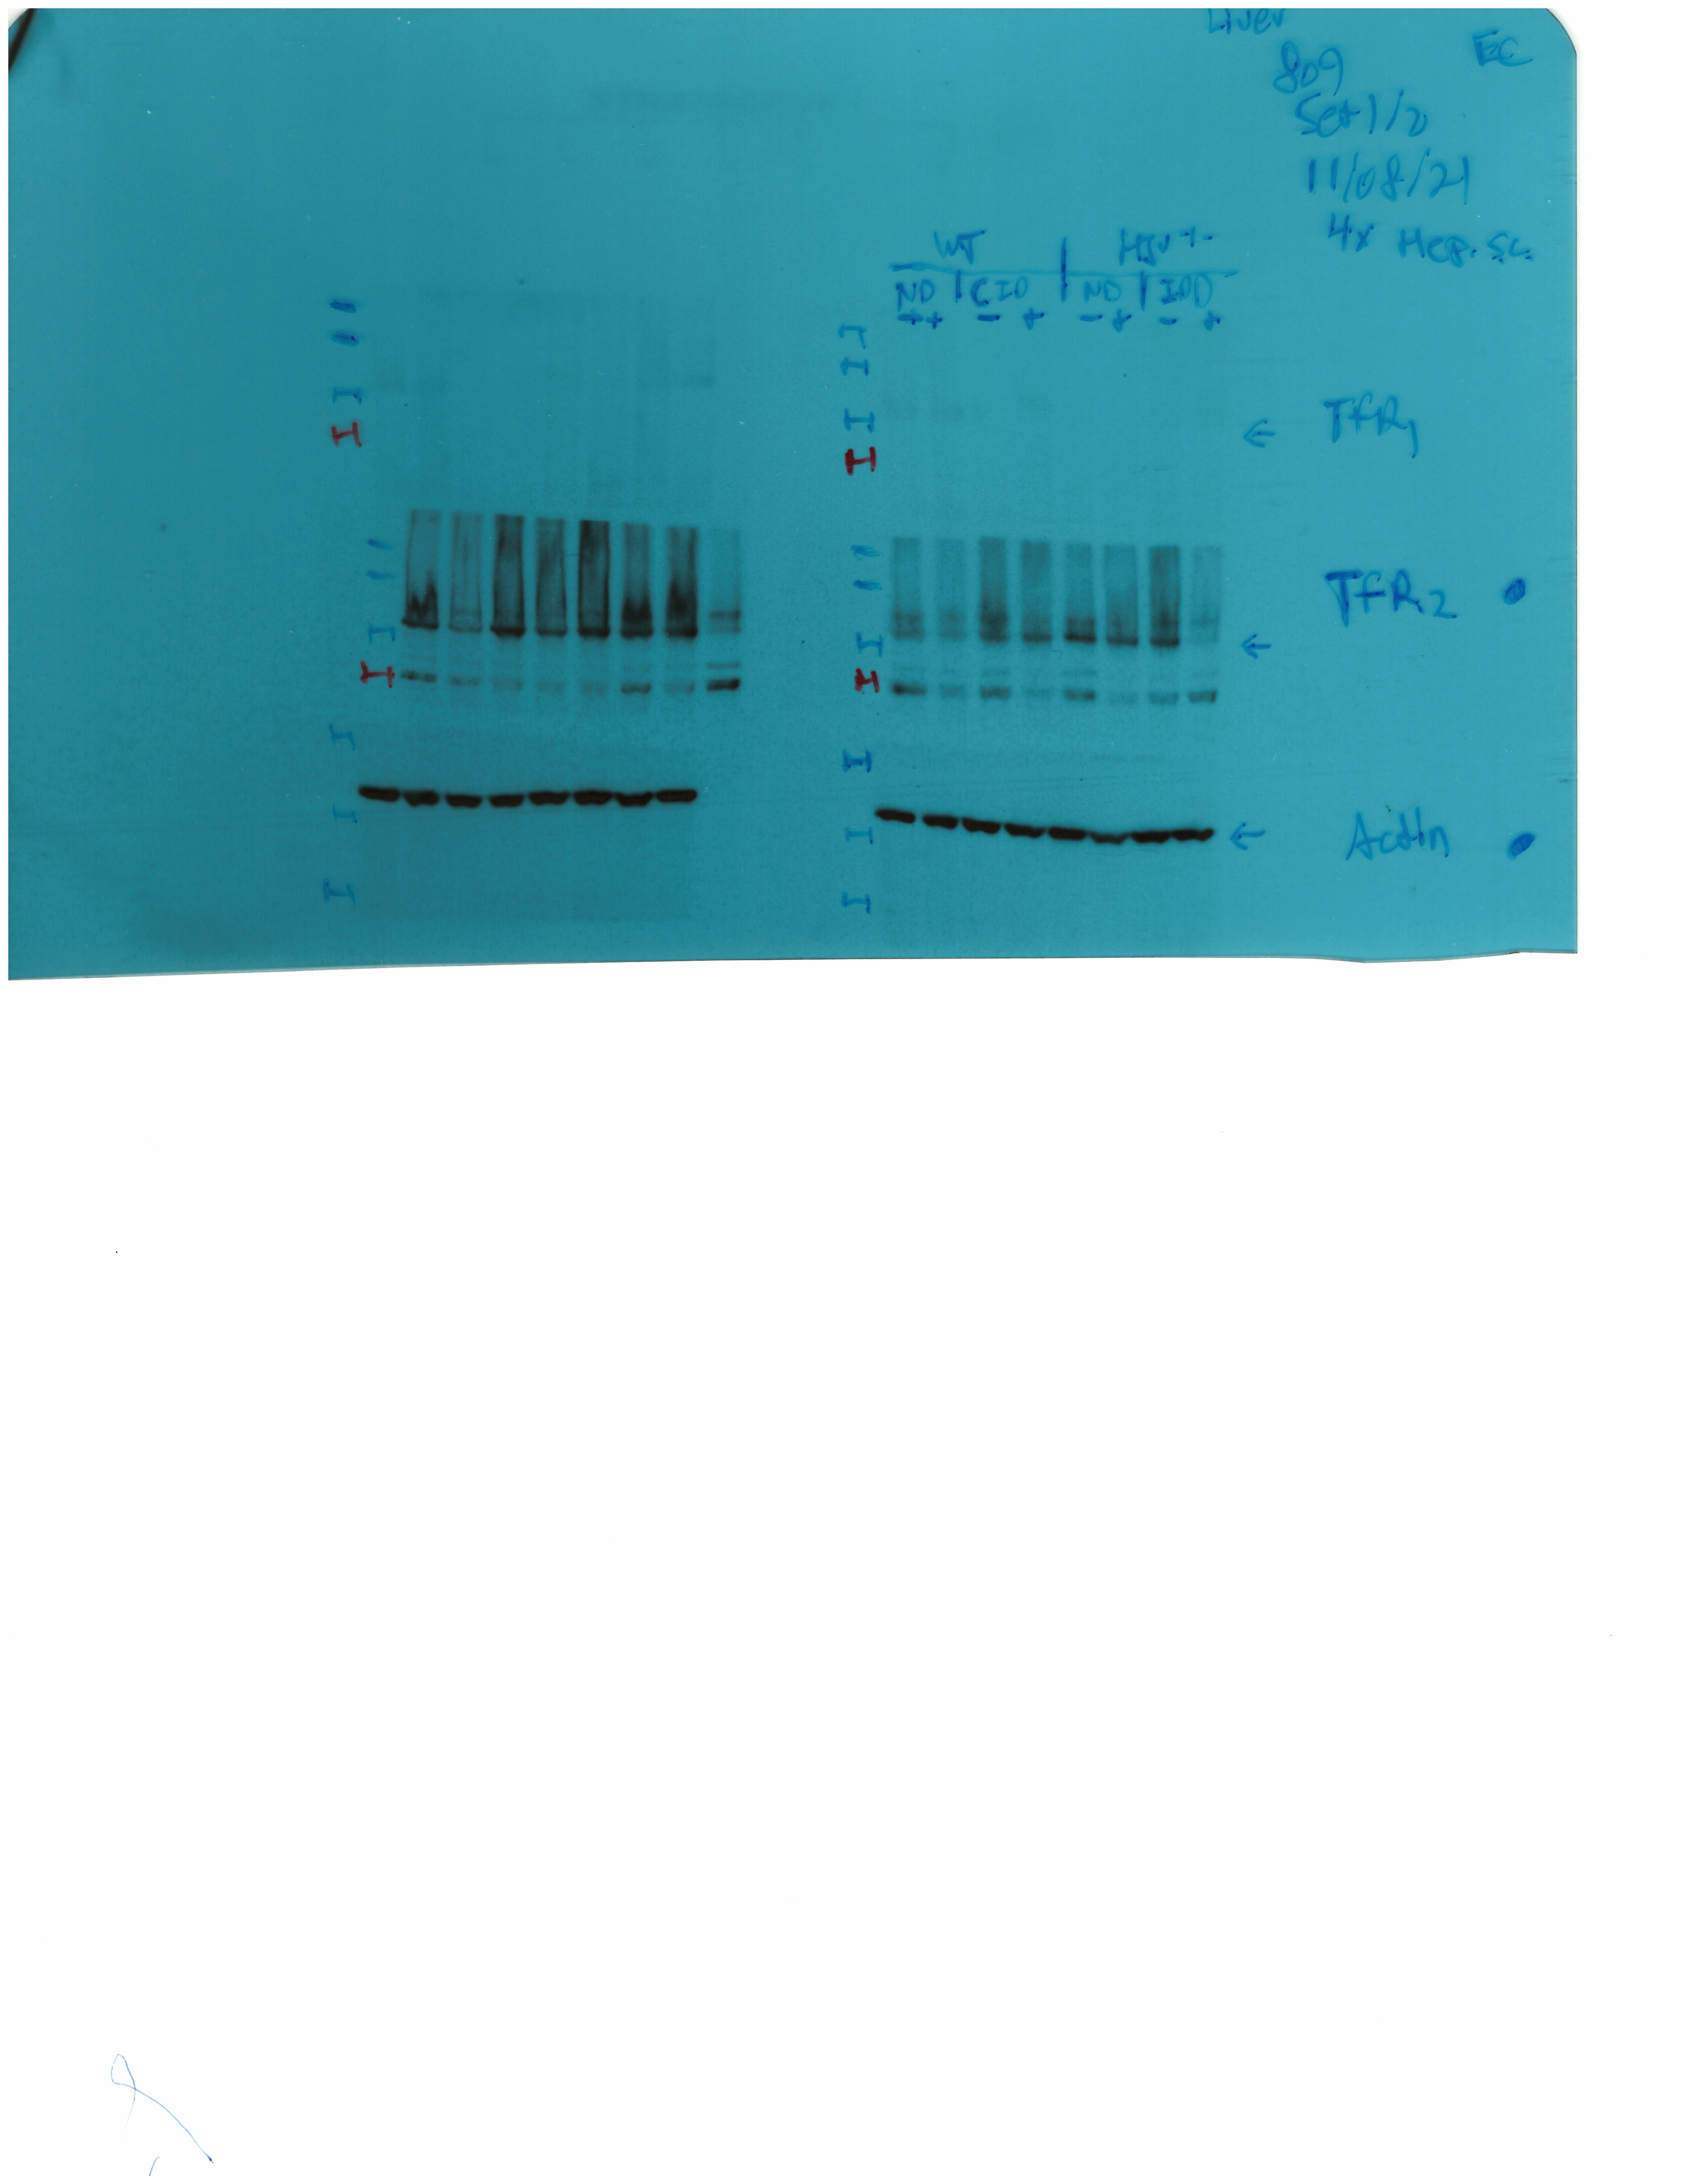
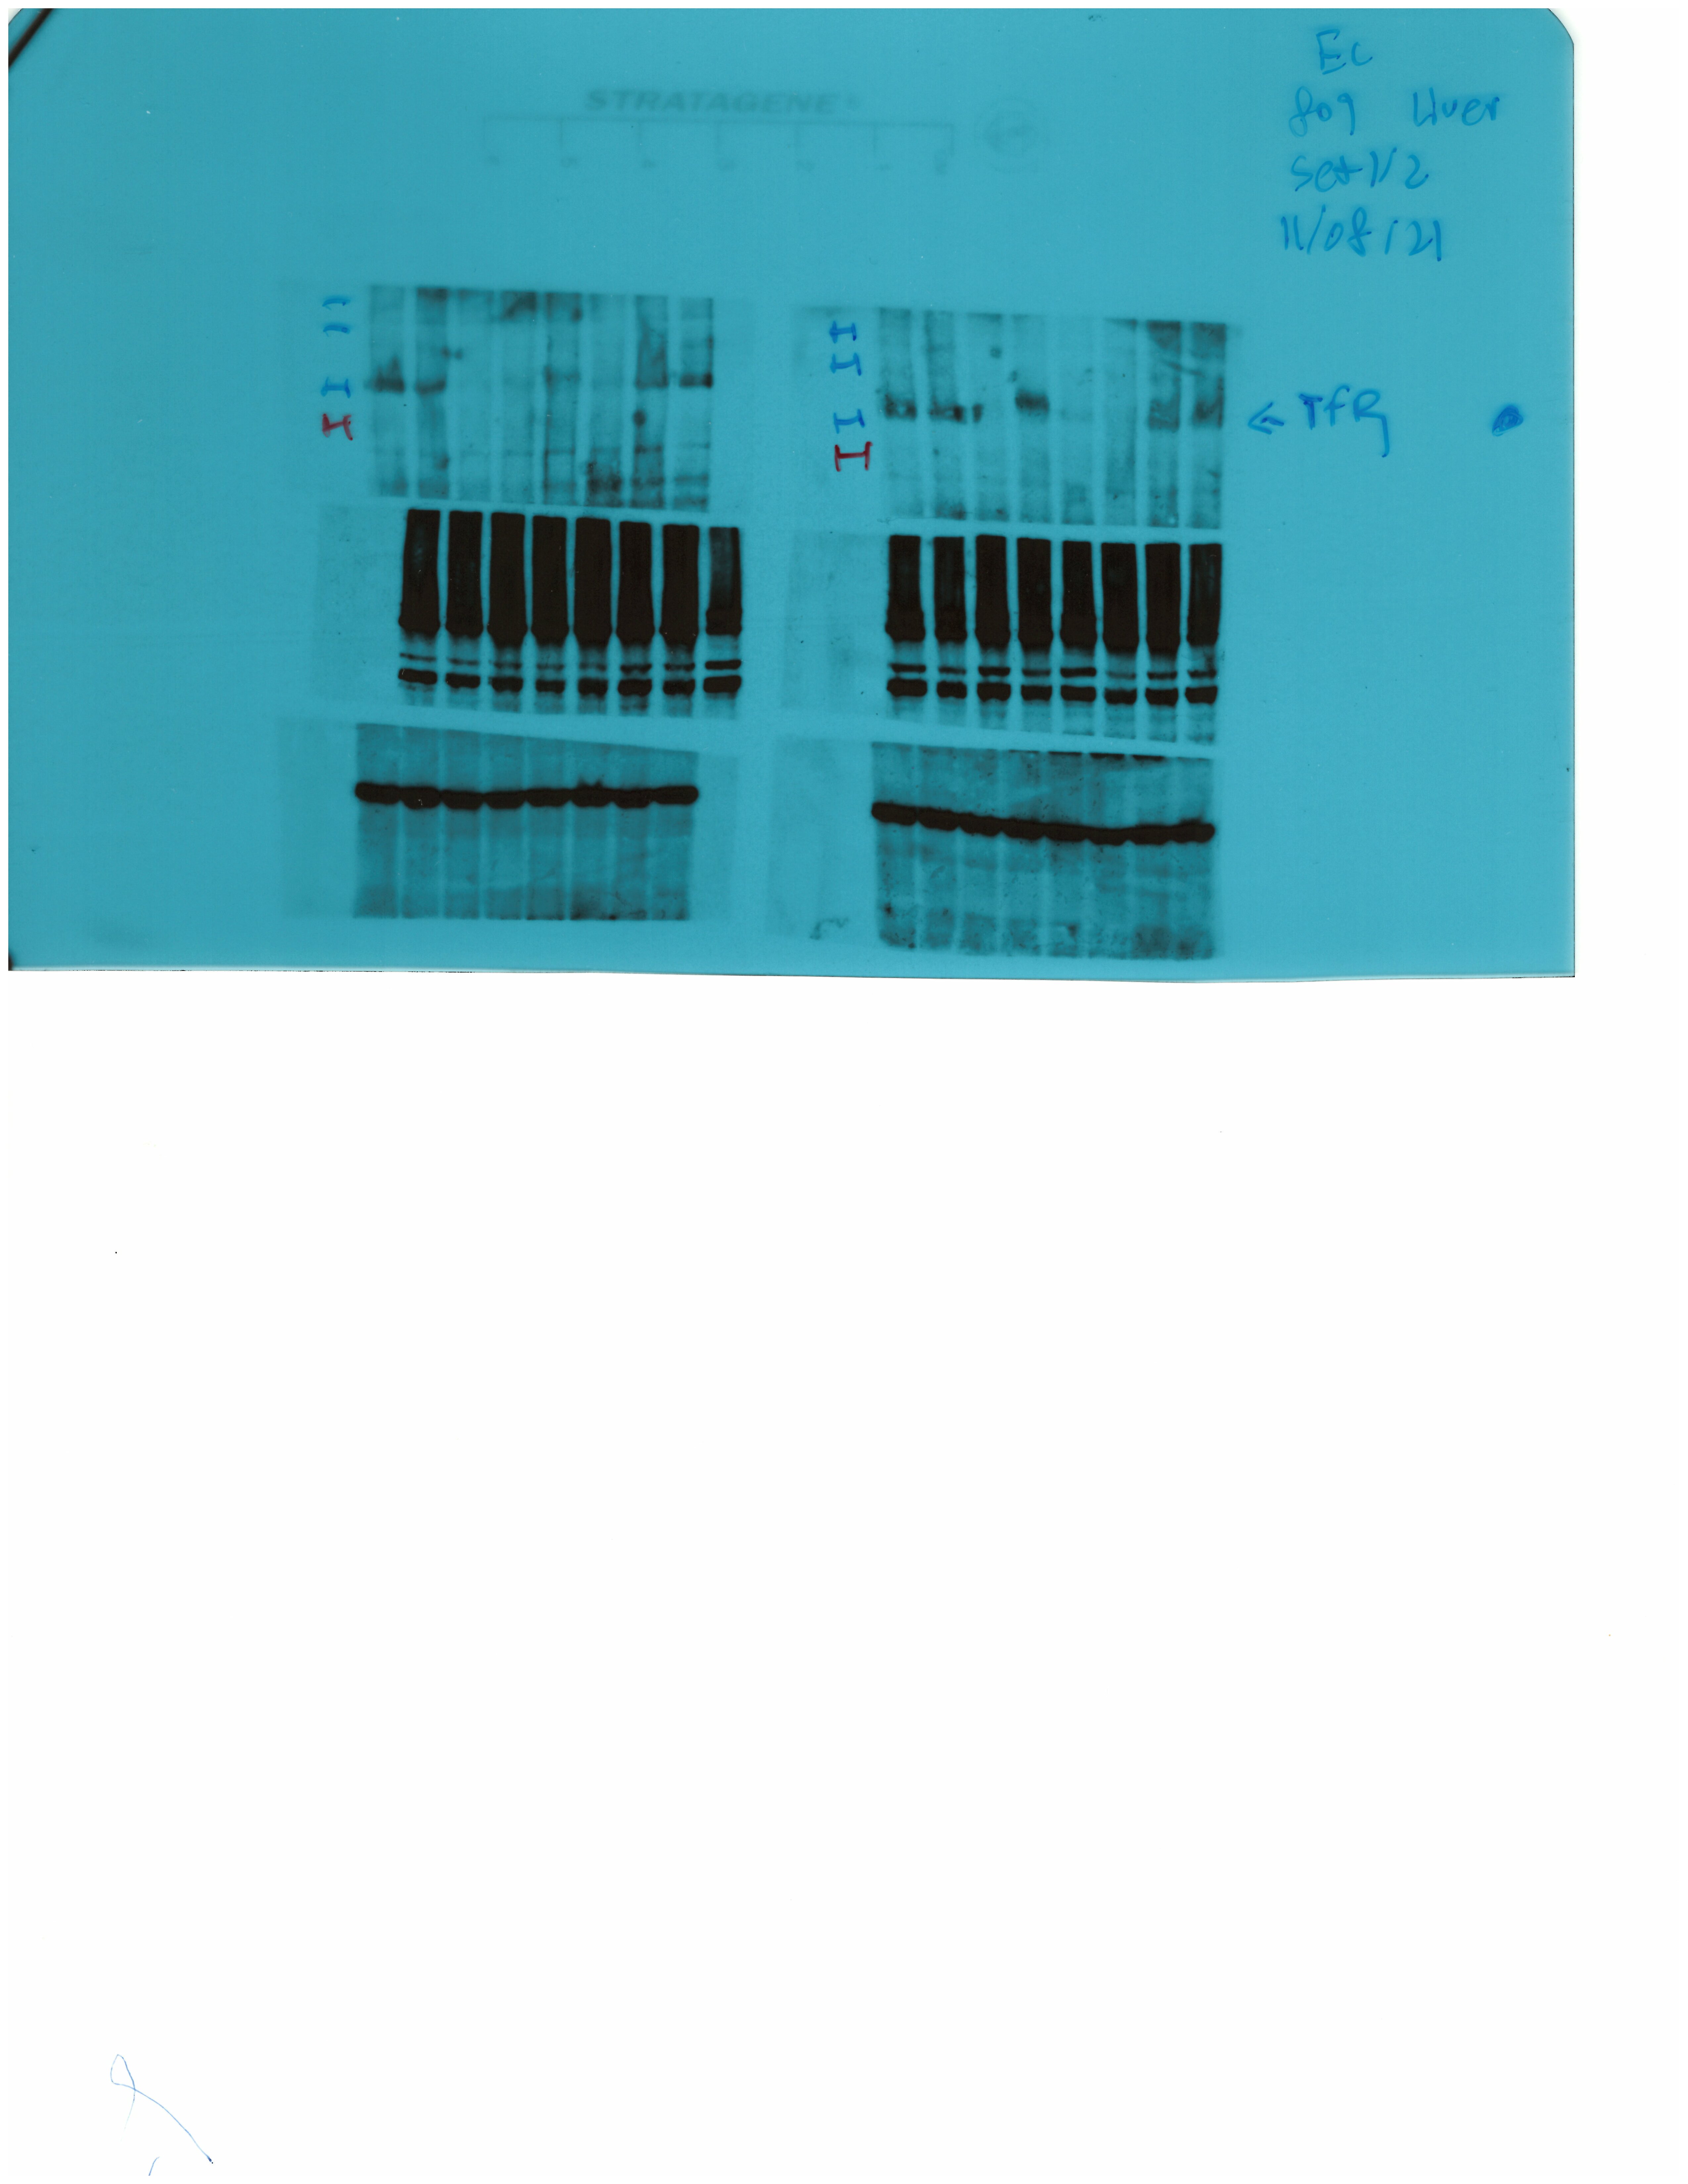
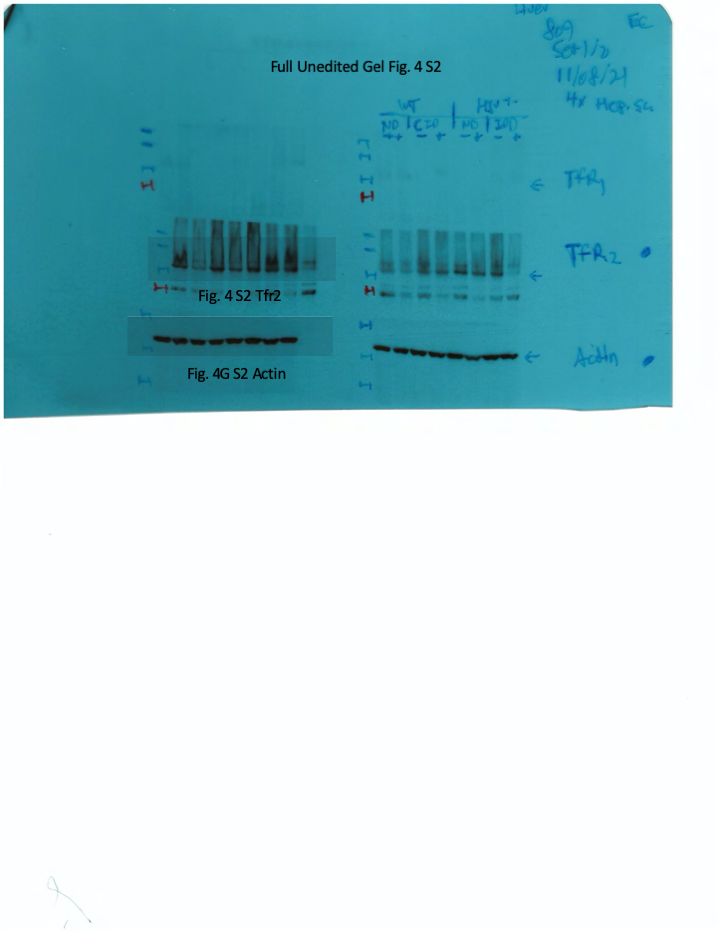
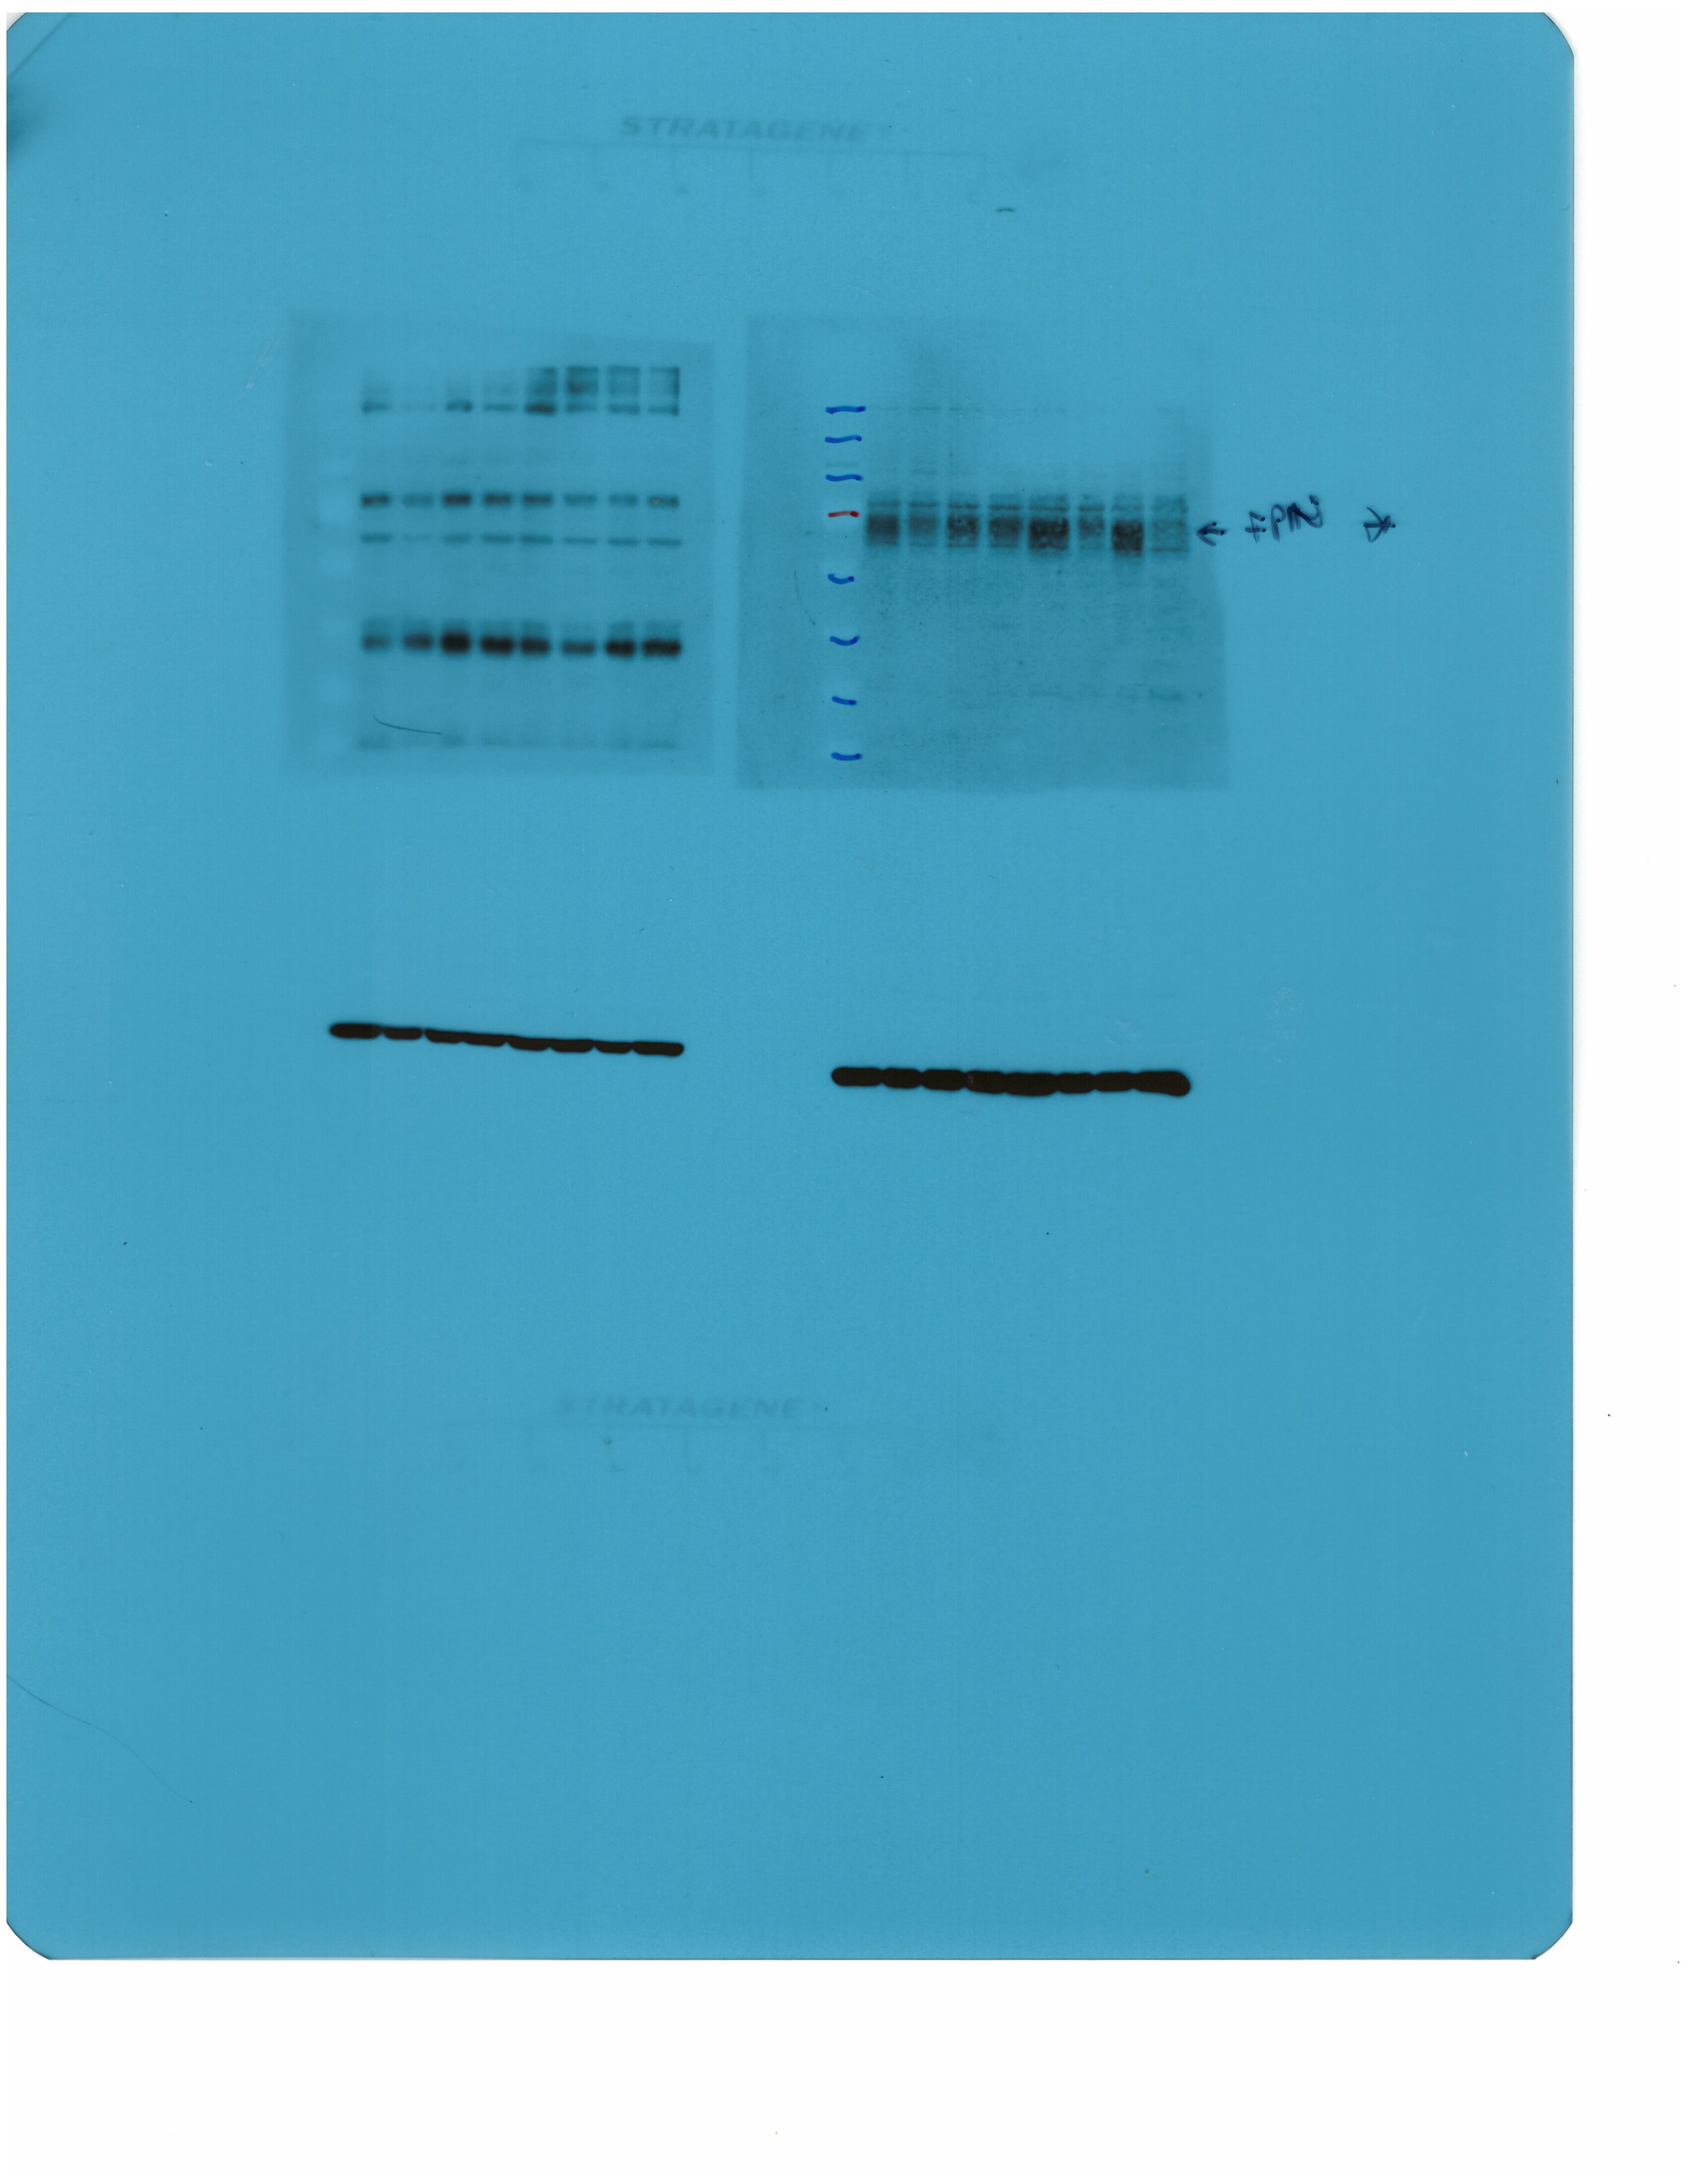
Western analysis of transferrin receptors (Tfr1 and Tfr2) of dietary iron-manipulated wild type and Hjv-/- mice following treatment with synthetic hepcidin.
Livers from mice described in Figure 4 were analyzed by Western blot for expression of Tfr1, Tfr2, and β-actin; a representative image (out of n=2 samples) is shown on the left. The blots were quantified by densitometry and Tfr1/β-actin or Tfr2/β-actin ratios are shown on the right. HID: high-iron diet; IDD: iron-deficient diet.
-
Figure 4—figure supplement 2—source data 1
Western blot quantifications.
- https://cdn.elifesciences.org/articles/81332/elife-81332-fig4-figsupp2-data1-v2.xlsx
-
Figure 4—figure supplement 2—source data 2
Raw unlabeled Western blot Tfr2 and β-actin.
- https://cdn.elifesciences.org/articles/81332/elife-81332-fig4-figsupp2-data2-v2.jpg
-
Figure 4—figure supplement 2—source data 3
Raw unlabeled Western blot Tfr1.
- https://cdn.elifesciences.org/articles/81332/elife-81332-fig4-figsupp2-data3-v2.jpg
-
Figure 4—figure supplement 2—source data 4
Raw labeled Western blot Tfr1.
- https://cdn.elifesciences.org/articles/81332/elife-81332-fig4-figsupp2-data4-v2.bmp
-
Figure 4—figure supplement 2—source data 5
Raw labeled Western blot Tfr2 and β-actin.
- https://cdn.elifesciences.org/articles/81332/elife-81332-fig4-figsupp2-data5-v2.bmp
Figure 4—figure supplement 3
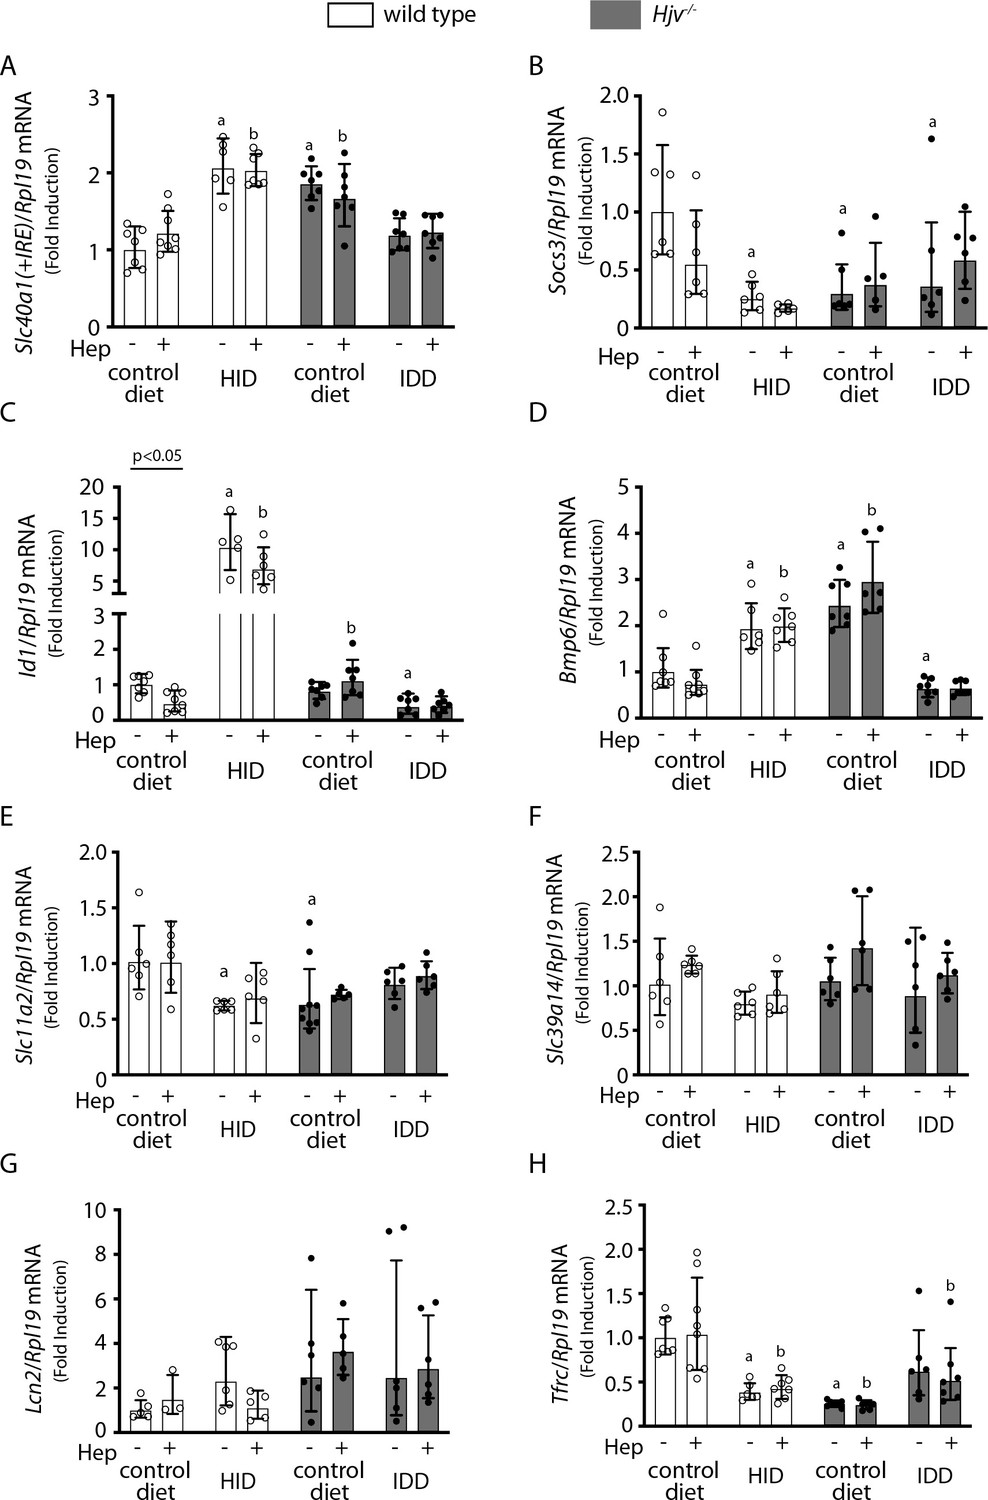
Effects of LPS treatment on expression of mRNAs encoding iron transport proteins and signaling endpoints in the liver of dietary iron-manipulated wild type and Hjv-/- mice.
Livers from mice described in Figure 4 were dissected and processed for qPCR analysis of mRNAs encoding iron transport proteins and signaling endpoints. (A) Slc40a1(+IRE), (B) Socs3, (C) Id1, (D) Bmp6, (E) Slc11a2, (F) Slc39a14, (G) Lcn2, and (H) Tfrc. All data are presented as the geometric mean ± SD. Statistically significant differences (p<0.05) compared to values from saline- or hepcidin-treated control mice are indicated by a or b, respectively. HID: high-iron diet; IDD: iron-deficient diet.
-
Figure 4—figure supplement 3—source data 1
qPCR data.
- https://cdn.elifesciences.org/articles/81332/elife-81332-fig4-figsupp3-data1-v2.xlsx
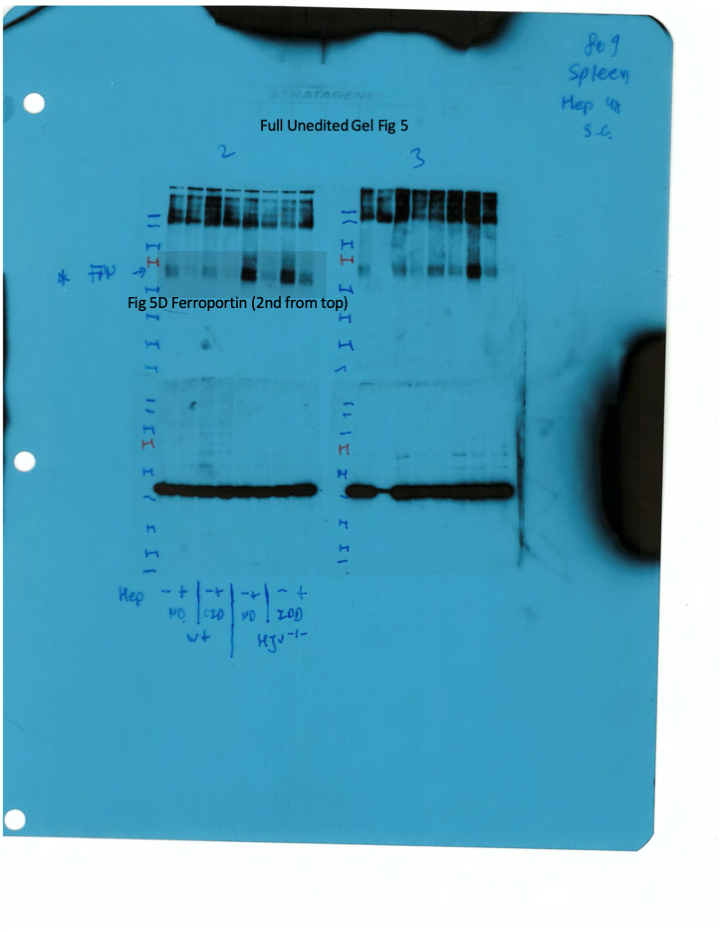
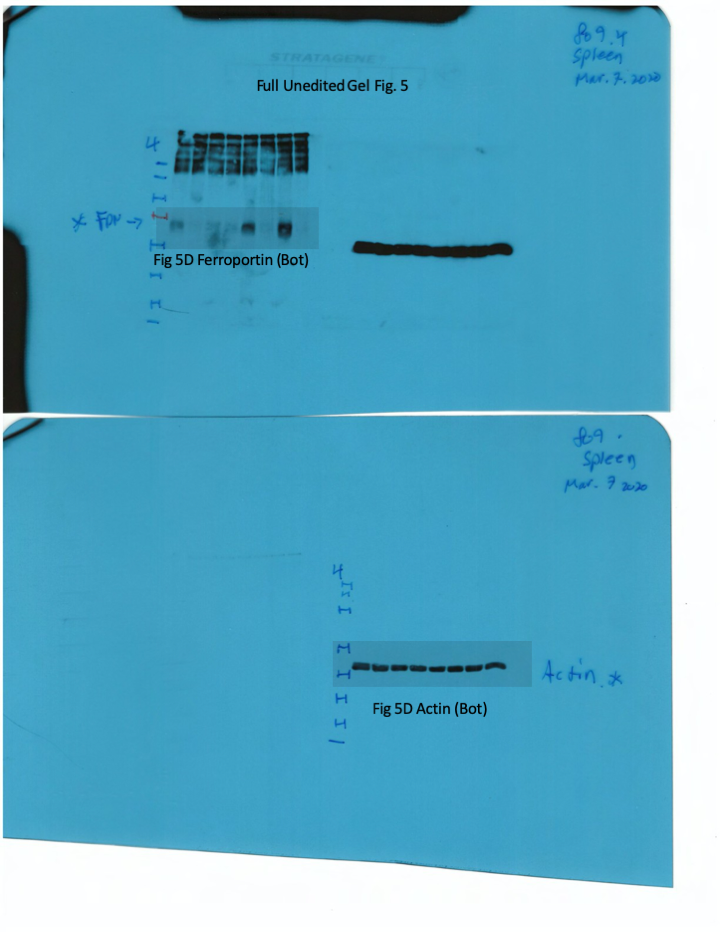
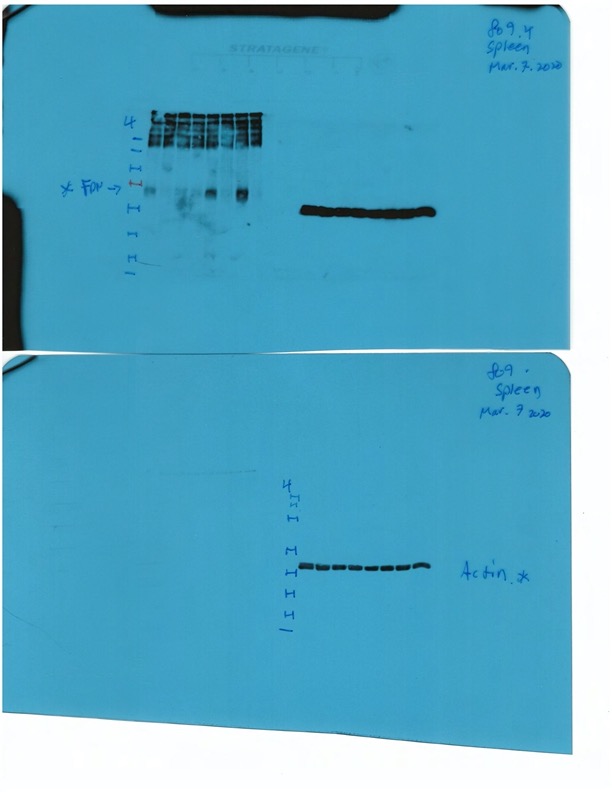
Figure 5 with 2 supplements
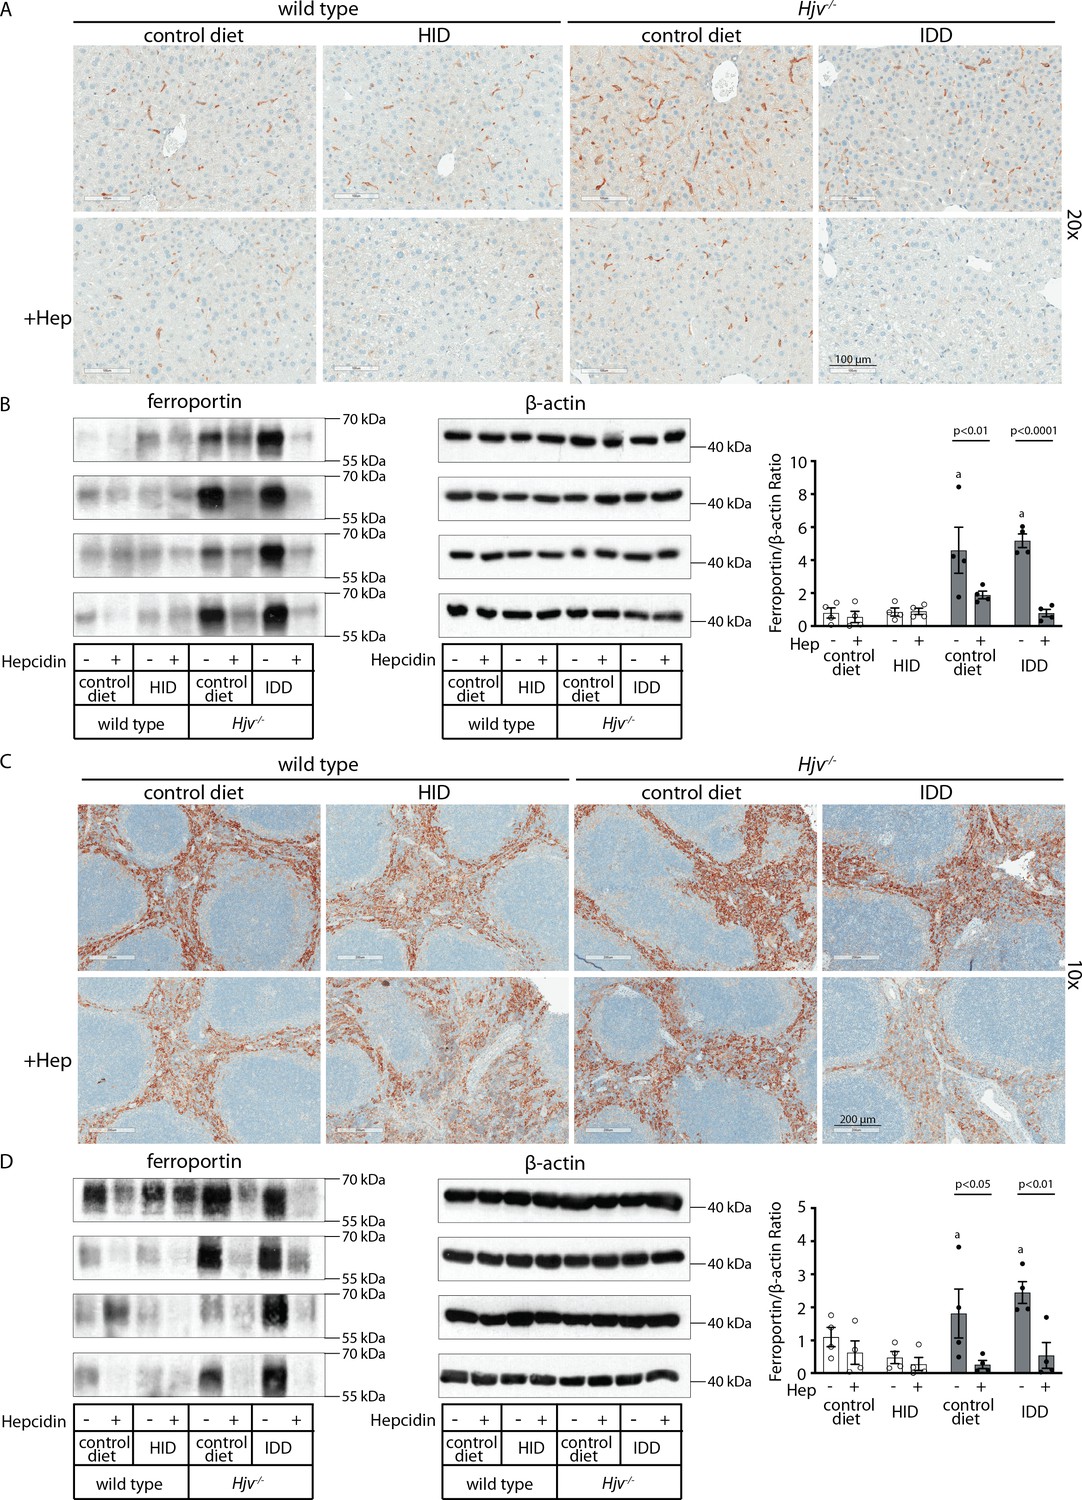
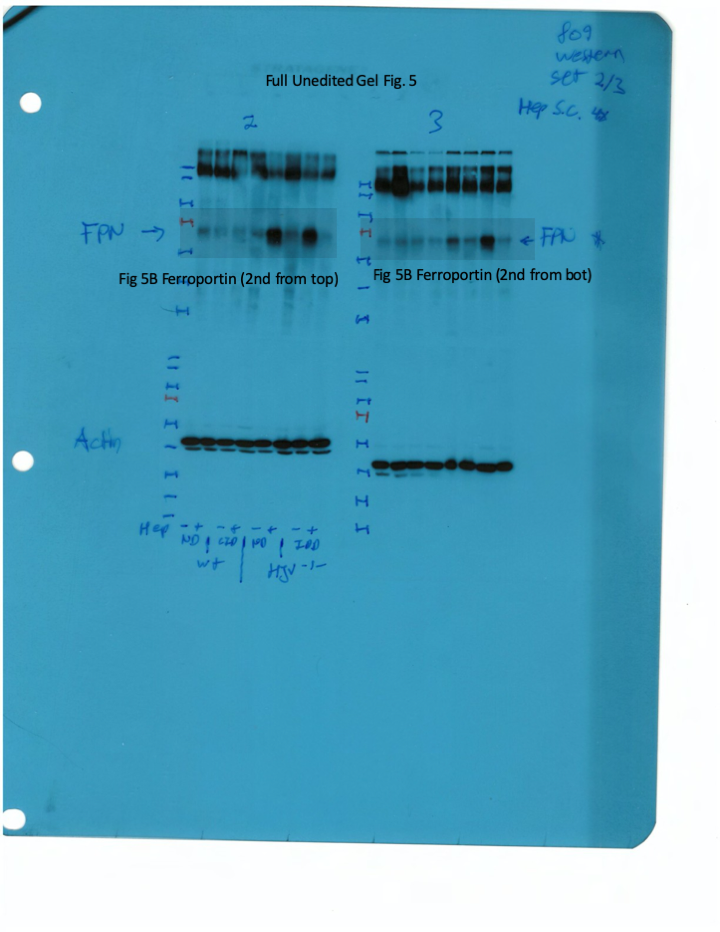
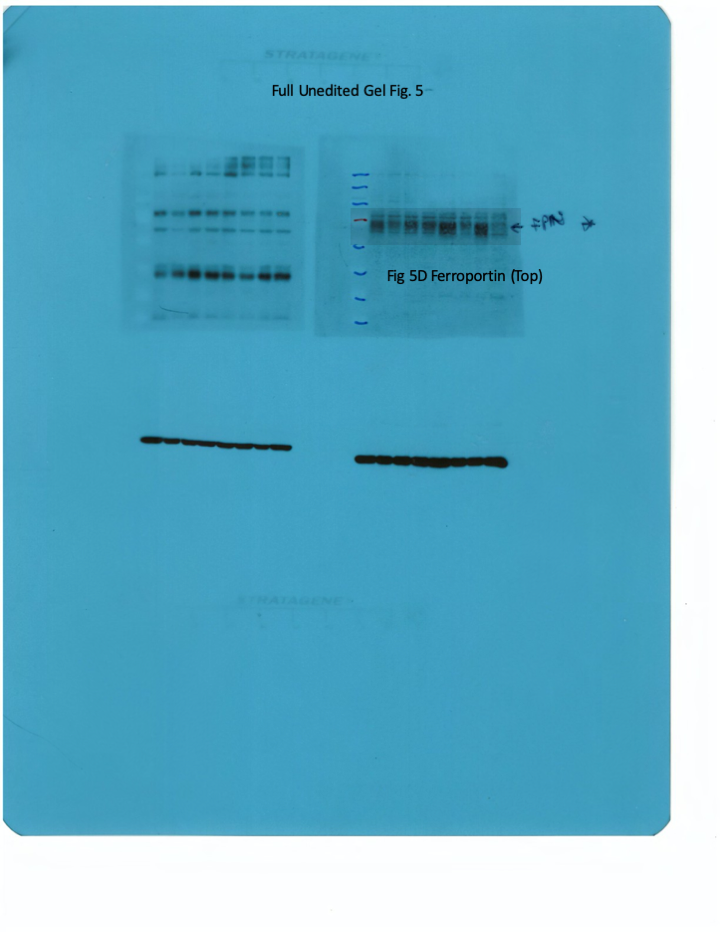
Effects of synthetic hepcidin on hepatic and splenic ferroportin of iron-manipulatedwild type and Hjv-/- mice.
Livers and spleens from mice described in Figure 4 were dissected and processed for immunohistochemical and biochemical analysis of ferroportin. Immunohistochemical staining of ferroportin in liver (A) and spleen (C) sections (magnification for liver is 20 × and for spleen 10 ×). Western blot for ferroportin and β-actin in liver (B) and spleen (D) extracts from four representative mice in each condition. Blots were quantified by densitometry and ferroportin/β-actin ratios are shown on the right. Densitometric data are presented as the mean ± SEM. Statistically significant differences (p<0.05) compared to values from saline- or hepcidin-treatedwild type control mice are indicated by a or b, respectively. HID: high-iron diet; IDD: iron-deficient diet.
-
Figure 5—source data 1
Western blot quantifications.
- https://cdn.elifesciences.org/articles/81332/elife-81332-fig5-data1-v2.xlsx
-
Figure 5—source data 2
Raw unlabeled Western blot ferroportin Figure 5D (a).
- https://cdn.elifesciences.org/articles/81332/elife-81332-fig5-data2-v2.jpg
-
Figure 5—source data 3
Raw unlabeled Western blot β-actin Figure 5D (a).
- https://cdn.elifesciences.org/articles/81332/elife-81332-fig5-data3-v2.jpg
-
Figure 5—source data 4
Raw unlabeled Western blot ferroportin Figure 5B (a).
- https://cdn.elifesciences.org/articles/81332/elife-81332-fig5-data4-v2.jpg
-
Figure 5—source data 5
Raw unlabeled Western blot ferroportin Figure 5B (b).
- https://cdn.elifesciences.org/articles/81332/elife-81332-fig5-data5-v2.jpg
-
Figure 5—source data 6
Raw unlabeled Western blot ferroportin Figure 5D (b).
- https://cdn.elifesciences.org/articles/81332/elife-81332-fig5-data6-v2.jpg
-
Figure 5—source data 7
Raw unlabeled Western blot.
- https://cdn.elifesciences.org/articles/81332/elife-81332-fig5-data7-v2.jpg
-
Figure 5—source data 8
Raw unlabeled Western blot ferroportin Figure 5D (c).
- https://cdn.elifesciences.org/articles/81332/elife-81332-fig5-data8-v2.jpg
-
Figure 5—source data 9
Raw unlabeled Western blot β-actin Figure 5D (c).
- https://cdn.elifesciences.org/articles/81332/elife-81332-fig5-data9-v2.jpg
-
Figure 5—source data 10
Raw unlabeled Western blot β-actin Figure 5B (a).
- https://cdn.elifesciences.org/articles/81332/elife-81332-fig5-data10-v2.jpg
-
Figure 5—source data 11
Raw unlabeled Western blot β-actin Figure 5B (b).
- https://cdn.elifesciences.org/articles/81332/elife-81332-fig5-data11-v2.jpg
-
Figure 5—source data 12
Raw labeled Western blot β-actin Figure 5B (b).
- https://cdn.elifesciences.org/articles/81332/elife-81332-fig5-data12-v2.bmp
-
Figure 5—source data 13
Raw labeled Western blot β-actin Figure 5B (a).
- https://cdn.elifesciences.org/articles/81332/elife-81332-fig5-data13-v2.bmp
-
Figure 5—source data 14
Raw labeled Western blot ferroportin Figure 5B (b).
- https://cdn.elifesciences.org/articles/81332/elife-81332-fig5-data14-v2.bmp
-
Figure 5—source data 15
Raw labeled Western blot ferroportin Figure 5B (a).
- https://cdn.elifesciences.org/articles/81332/elife-81332-fig5-data15-v2.bmp
-
Figure 5—source data 16
Raw labeled Western blot β-actin Figure 5D (a).
- https://cdn.elifesciences.org/articles/81332/elife-81332-fig5-data16-v2.bmp
-
Figure 5—source data 17
Raw labeled Western blot ferroportin Figure 5D (a).
- https://cdn.elifesciences.org/articles/81332/elife-81332-fig5-data17-v2.bmp
-
Figure 5—source data 18
Raw labeled Western blot β-actin Figure 5D (c).
- https://cdn.elifesciences.org/articles/81332/elife-81332-fig5-data18-v2.bmp
-
Figure 5—source data 19
Raw labeled Western blot ferroportin Figure 5D (c).
- https://cdn.elifesciences.org/articles/81332/elife-81332-fig5-data19-v2.bmp
-
Figure 5—source data 20
Raw labeled Western blot β-actin Figure 5D (b).
- https://cdn.elifesciences.org/articles/81332/elife-81332-fig5-data20-v2.bmp
-
Figure 5—source data 21
Raw labeled Western blot ferroportin Figure 5D (b).
- https://cdn.elifesciences.org/articles/81332/elife-81332-fig5-data21-v2.bmp
-
Figure 5—source data 22
Raw labeled Western blot ferroportin and β-actin Figure 5D (a).
- https://cdn.elifesciences.org/articles/81332/elife-81332-fig5-data22-v2.bmp
-
Figure 5—source data 23
Raw unlabeled Western blot ferroportin and β-actin Figure 5D (a).
- https://cdn.elifesciences.org/articles/81332/elife-81332-fig5-data23-v2.jpg
Figure 5—figure supplement 1
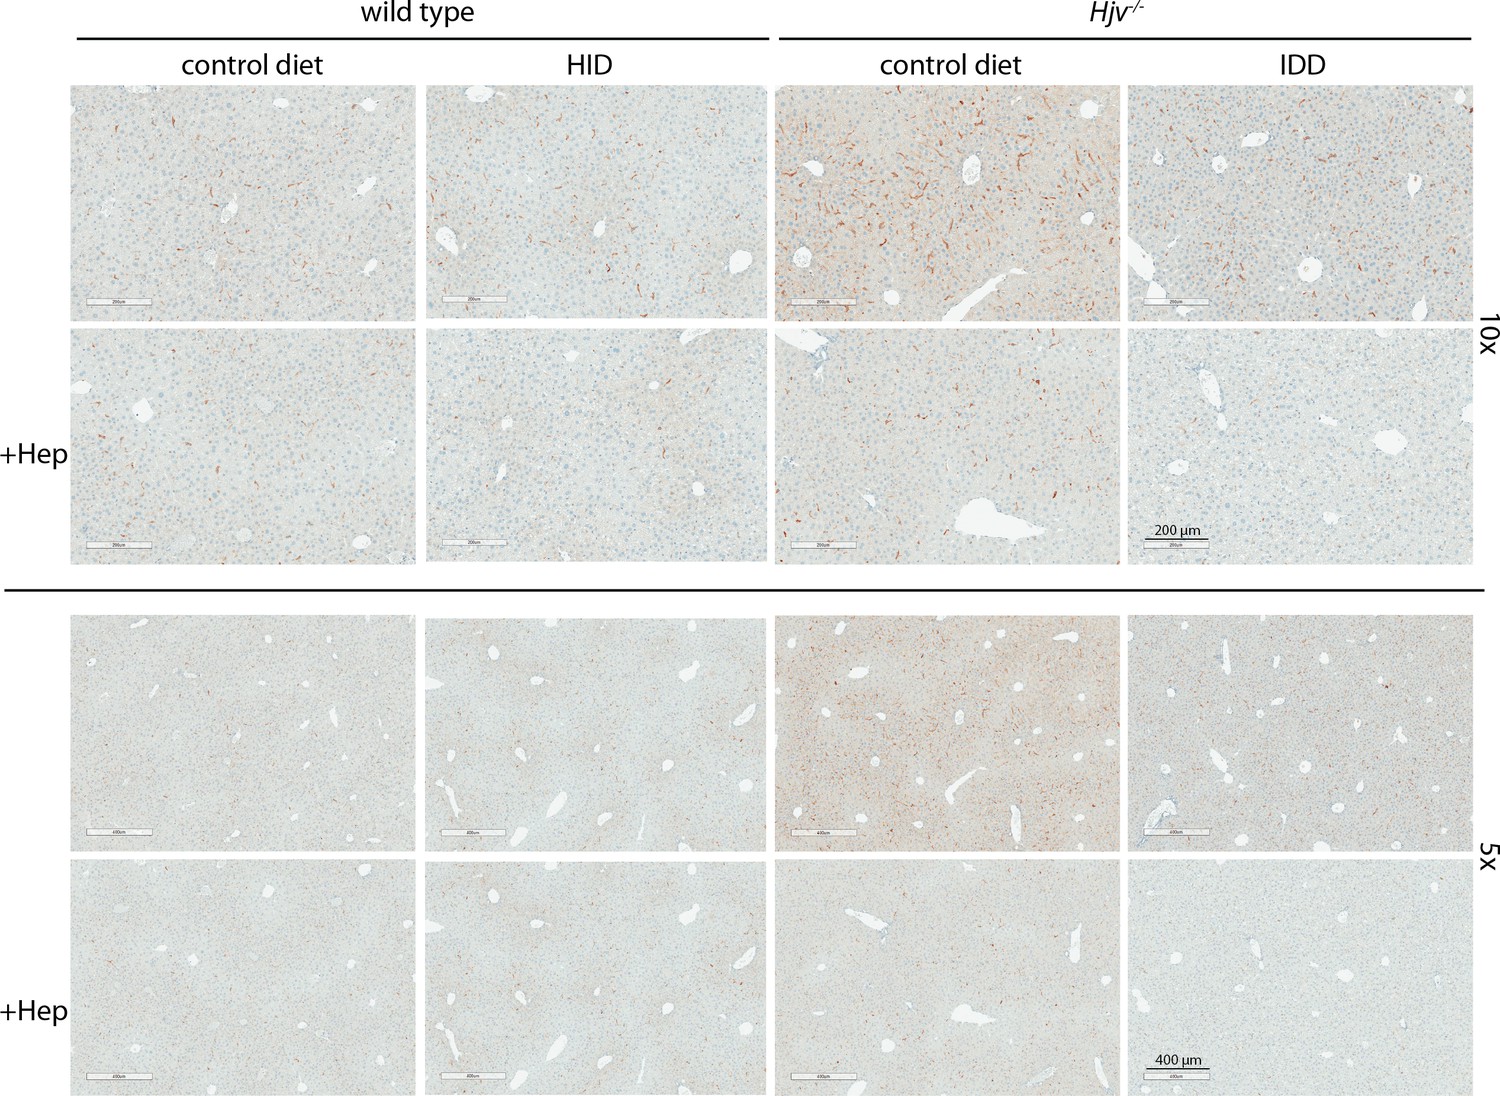
Low magnification immunohistochemical images of ferroportin in liver sections of dietary iron-manipulated wild type and Hjv-/- mice following treatment with synthetic hepcidin.
Liver sections from mice described in Figure 4 were used for immunohistochemical analysis of ferroportin (magnifications: 10 × and 5 ×). HID: high-iron diet; IDD: iron-deficient diet.
Figure 5—figure supplement 2
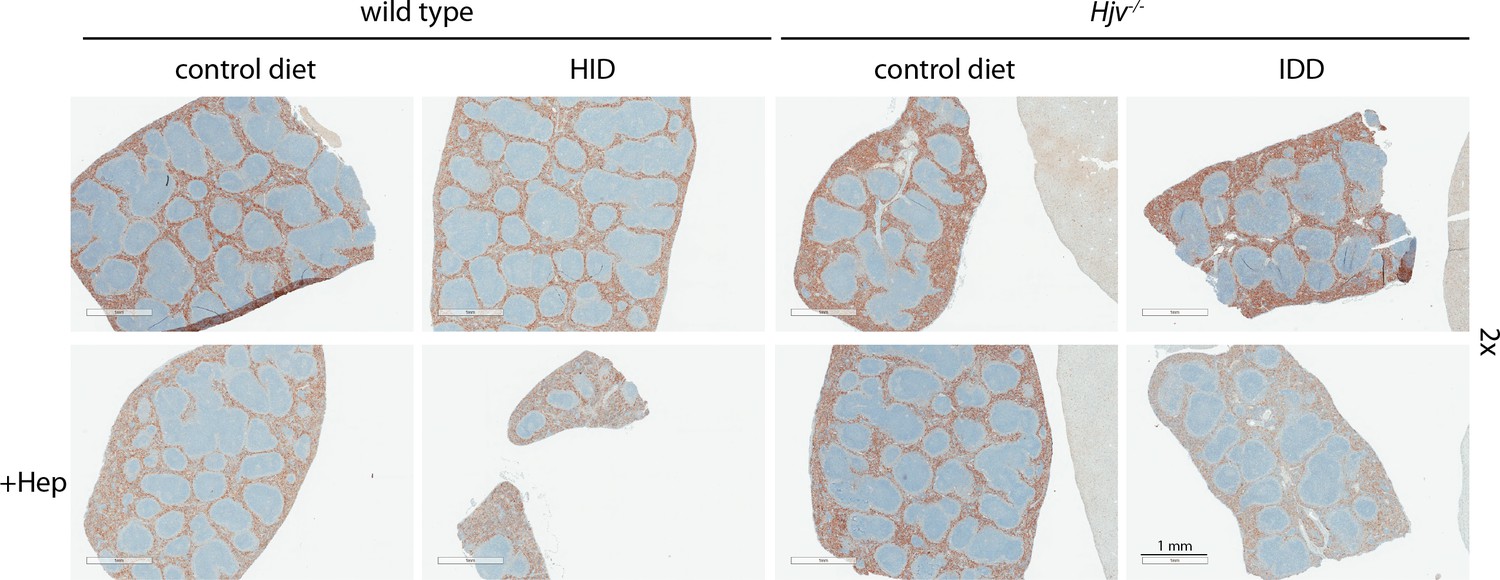
Low magnification immunohistochemical images of ferroportin in spleen sections of dietary iron-manipulated wild type and Hjv-/- mice following treatment with synthetic hepcidin.
Spleen sections from mice described in Figure 4 were used for immunohistochemical analysis of ferroportin (magnification: 2 ×). HID: high-iron diet; IDD: iron-deficient diet.
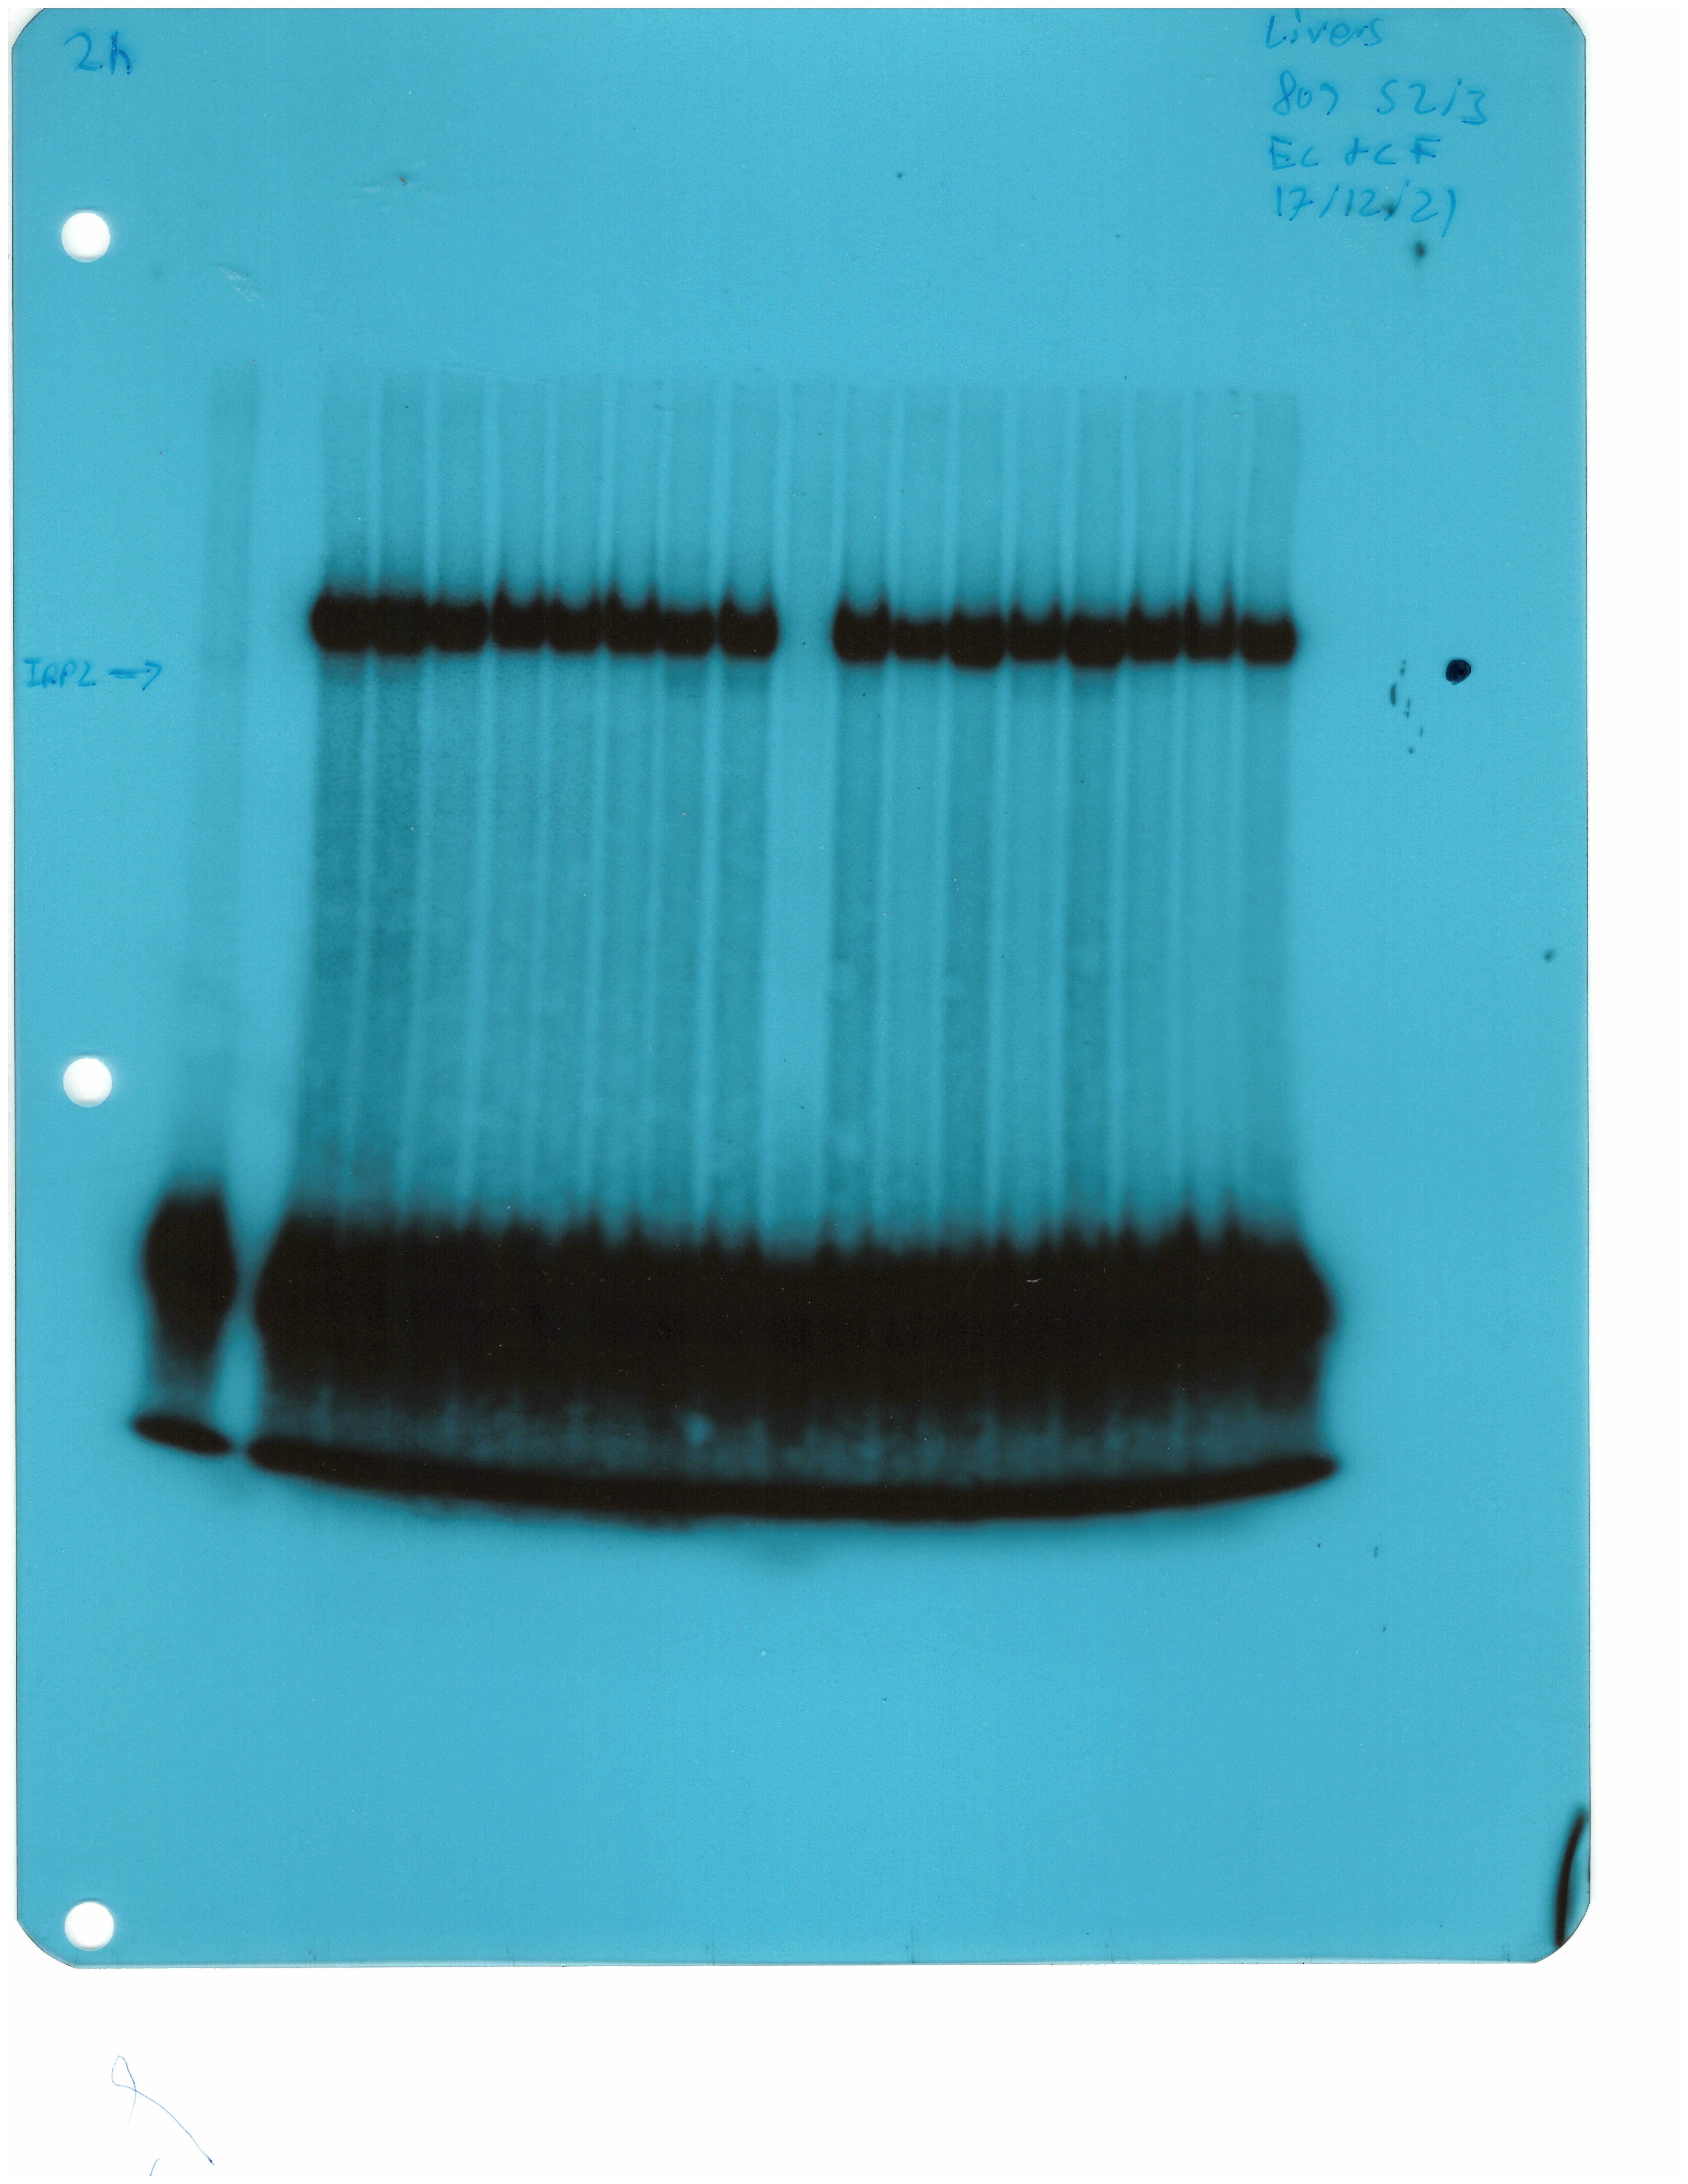
Figure 6
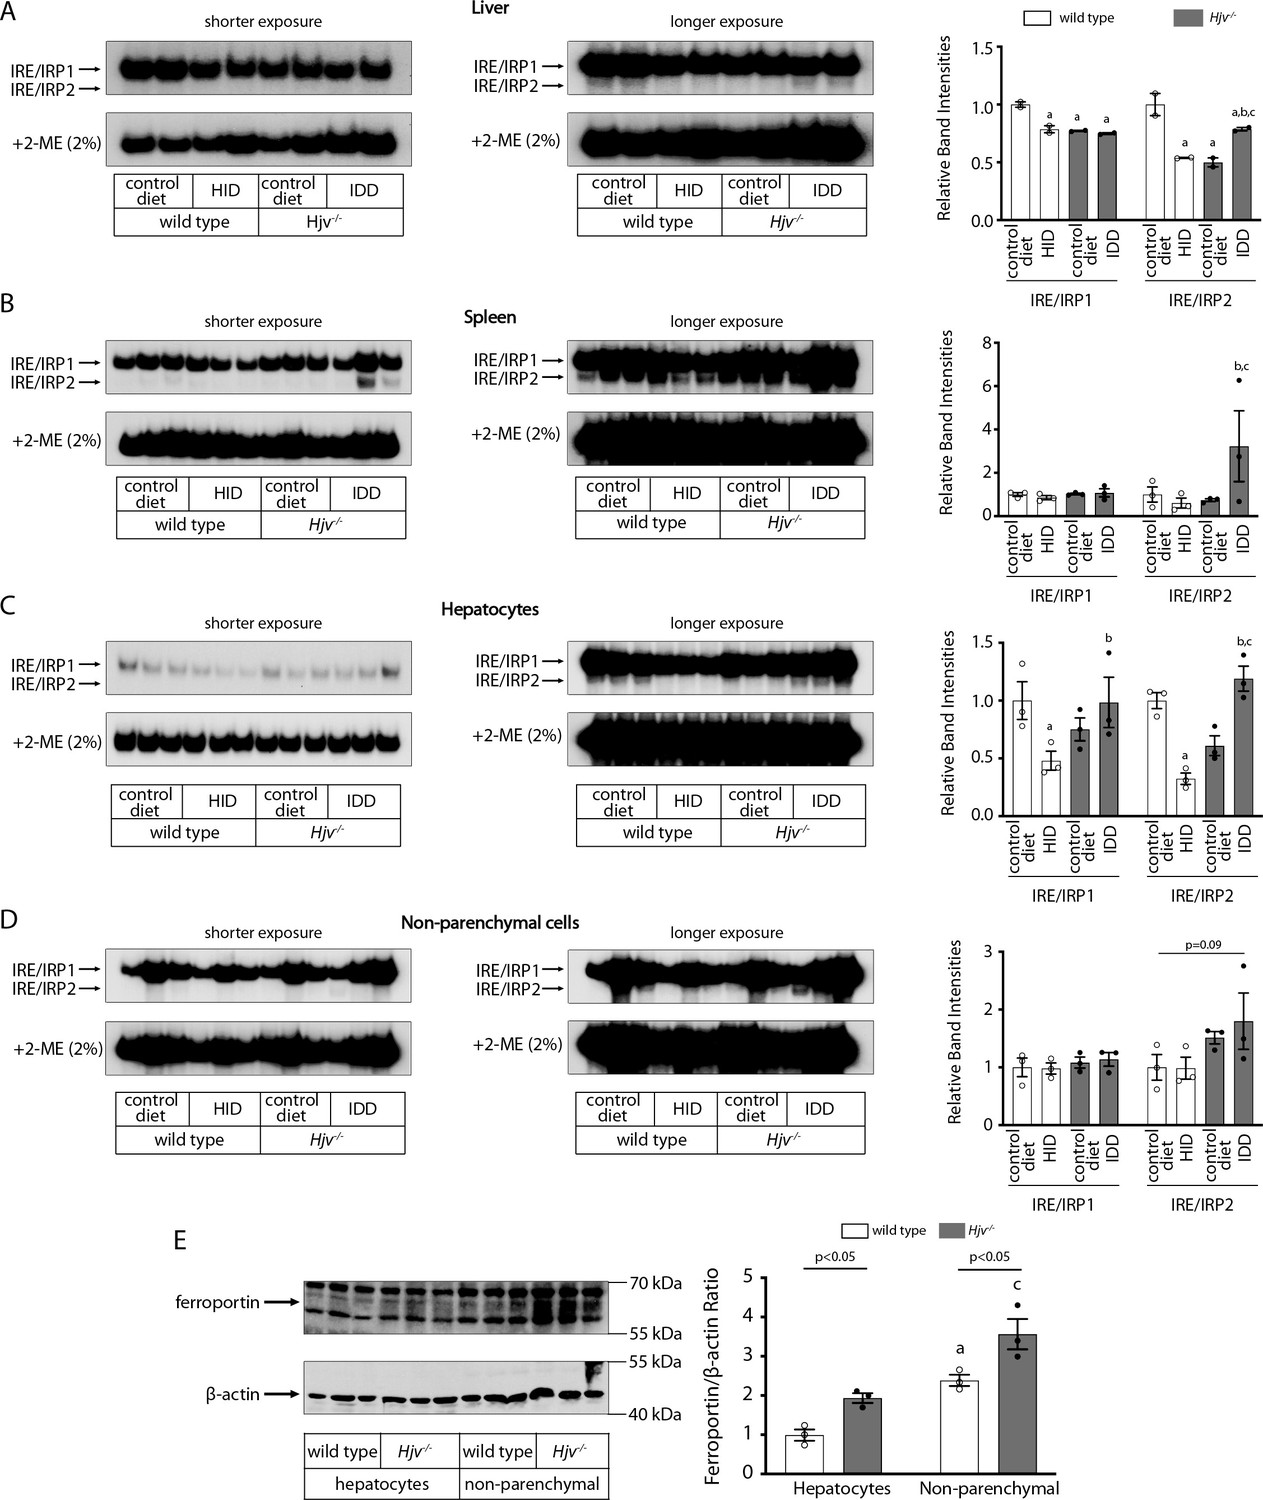
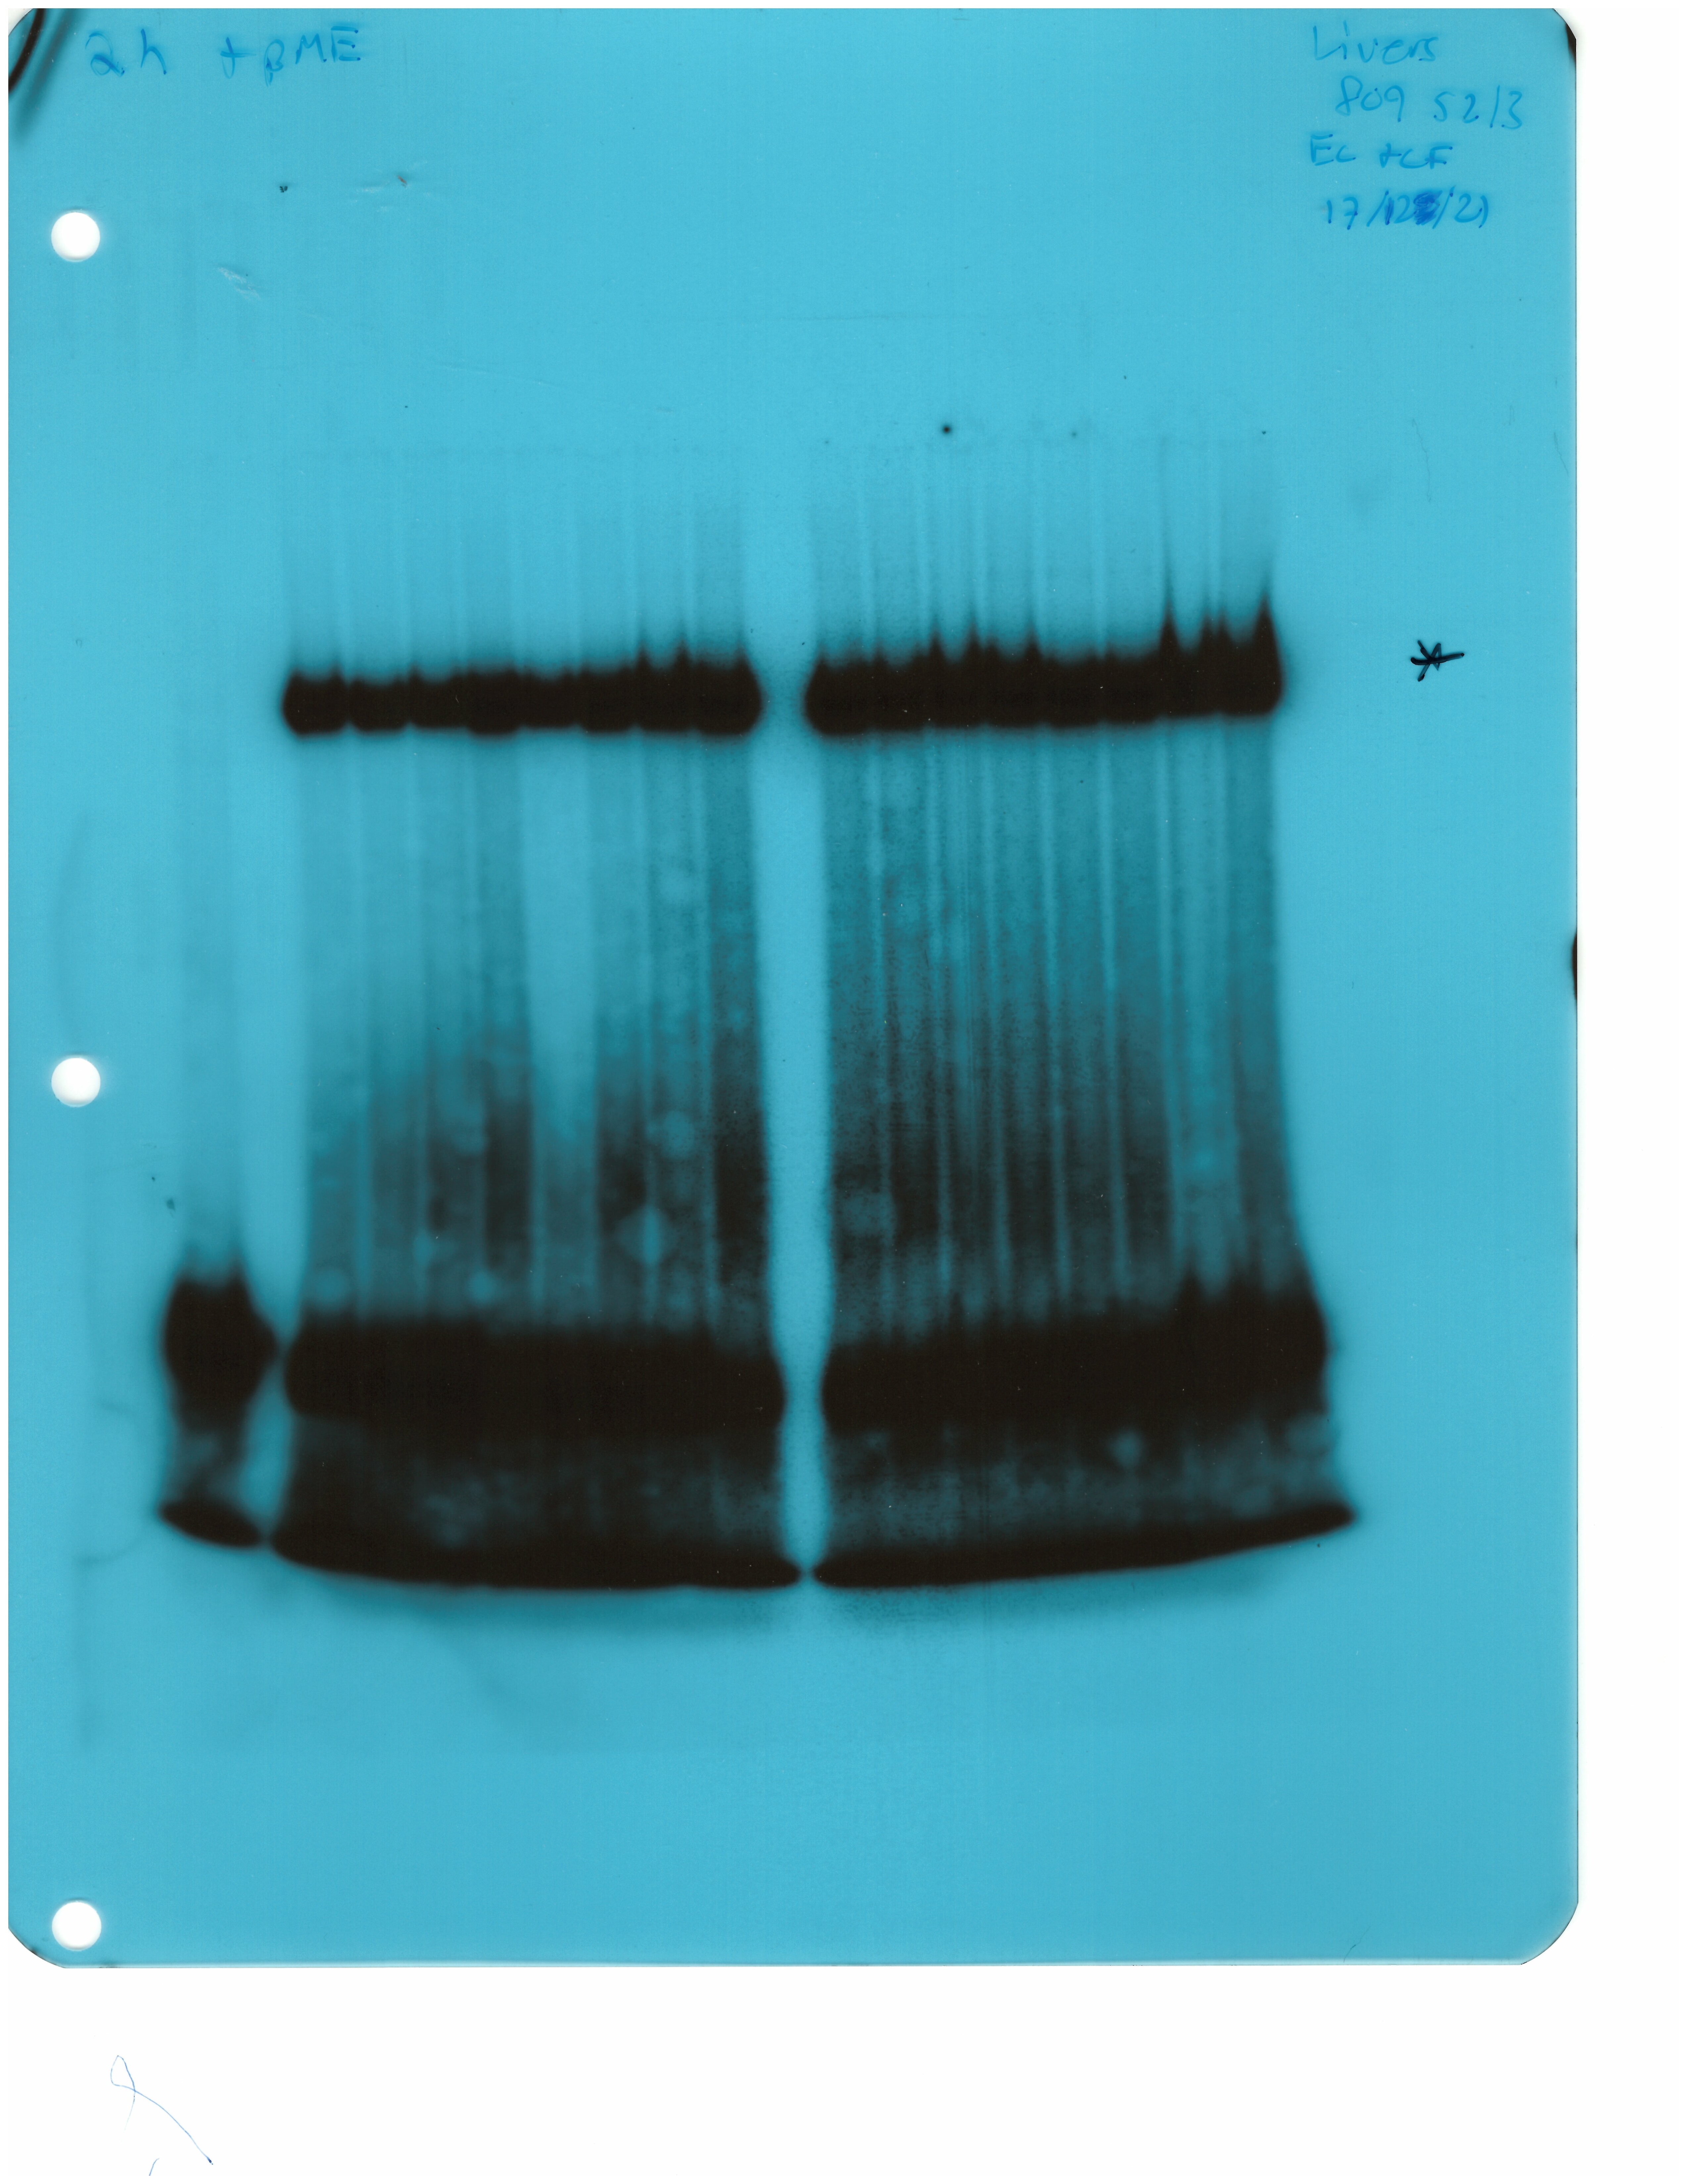
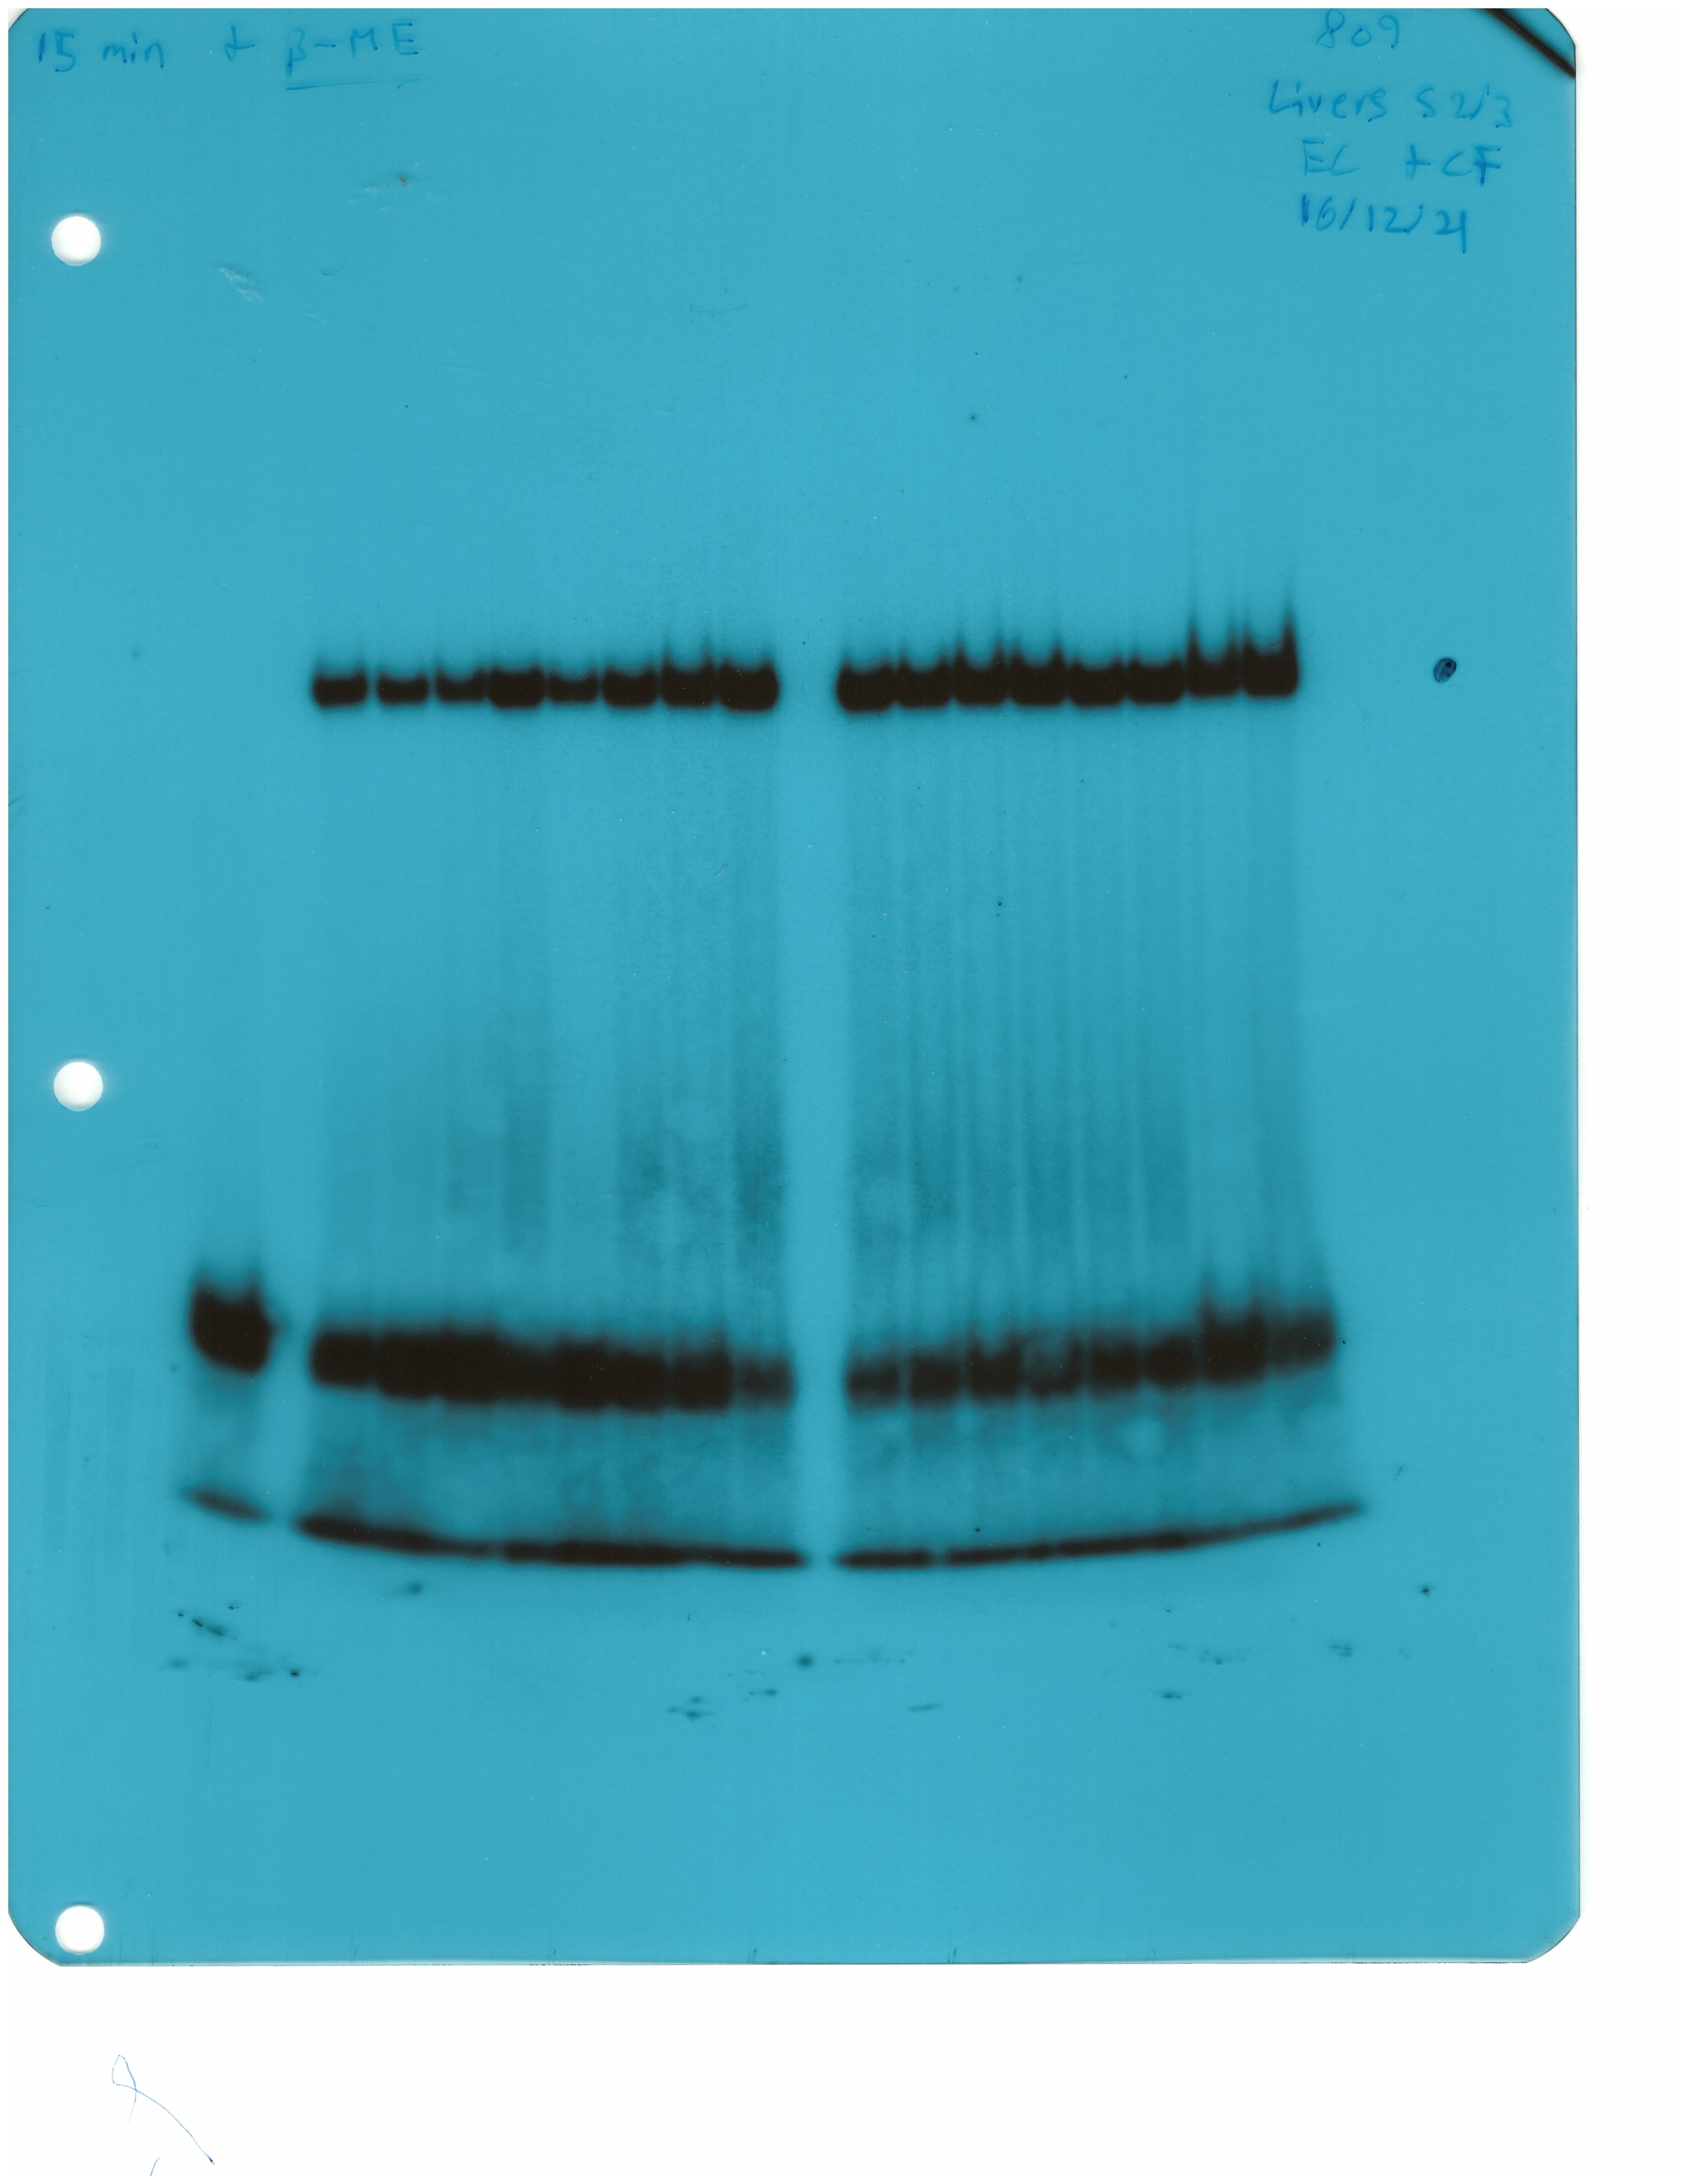
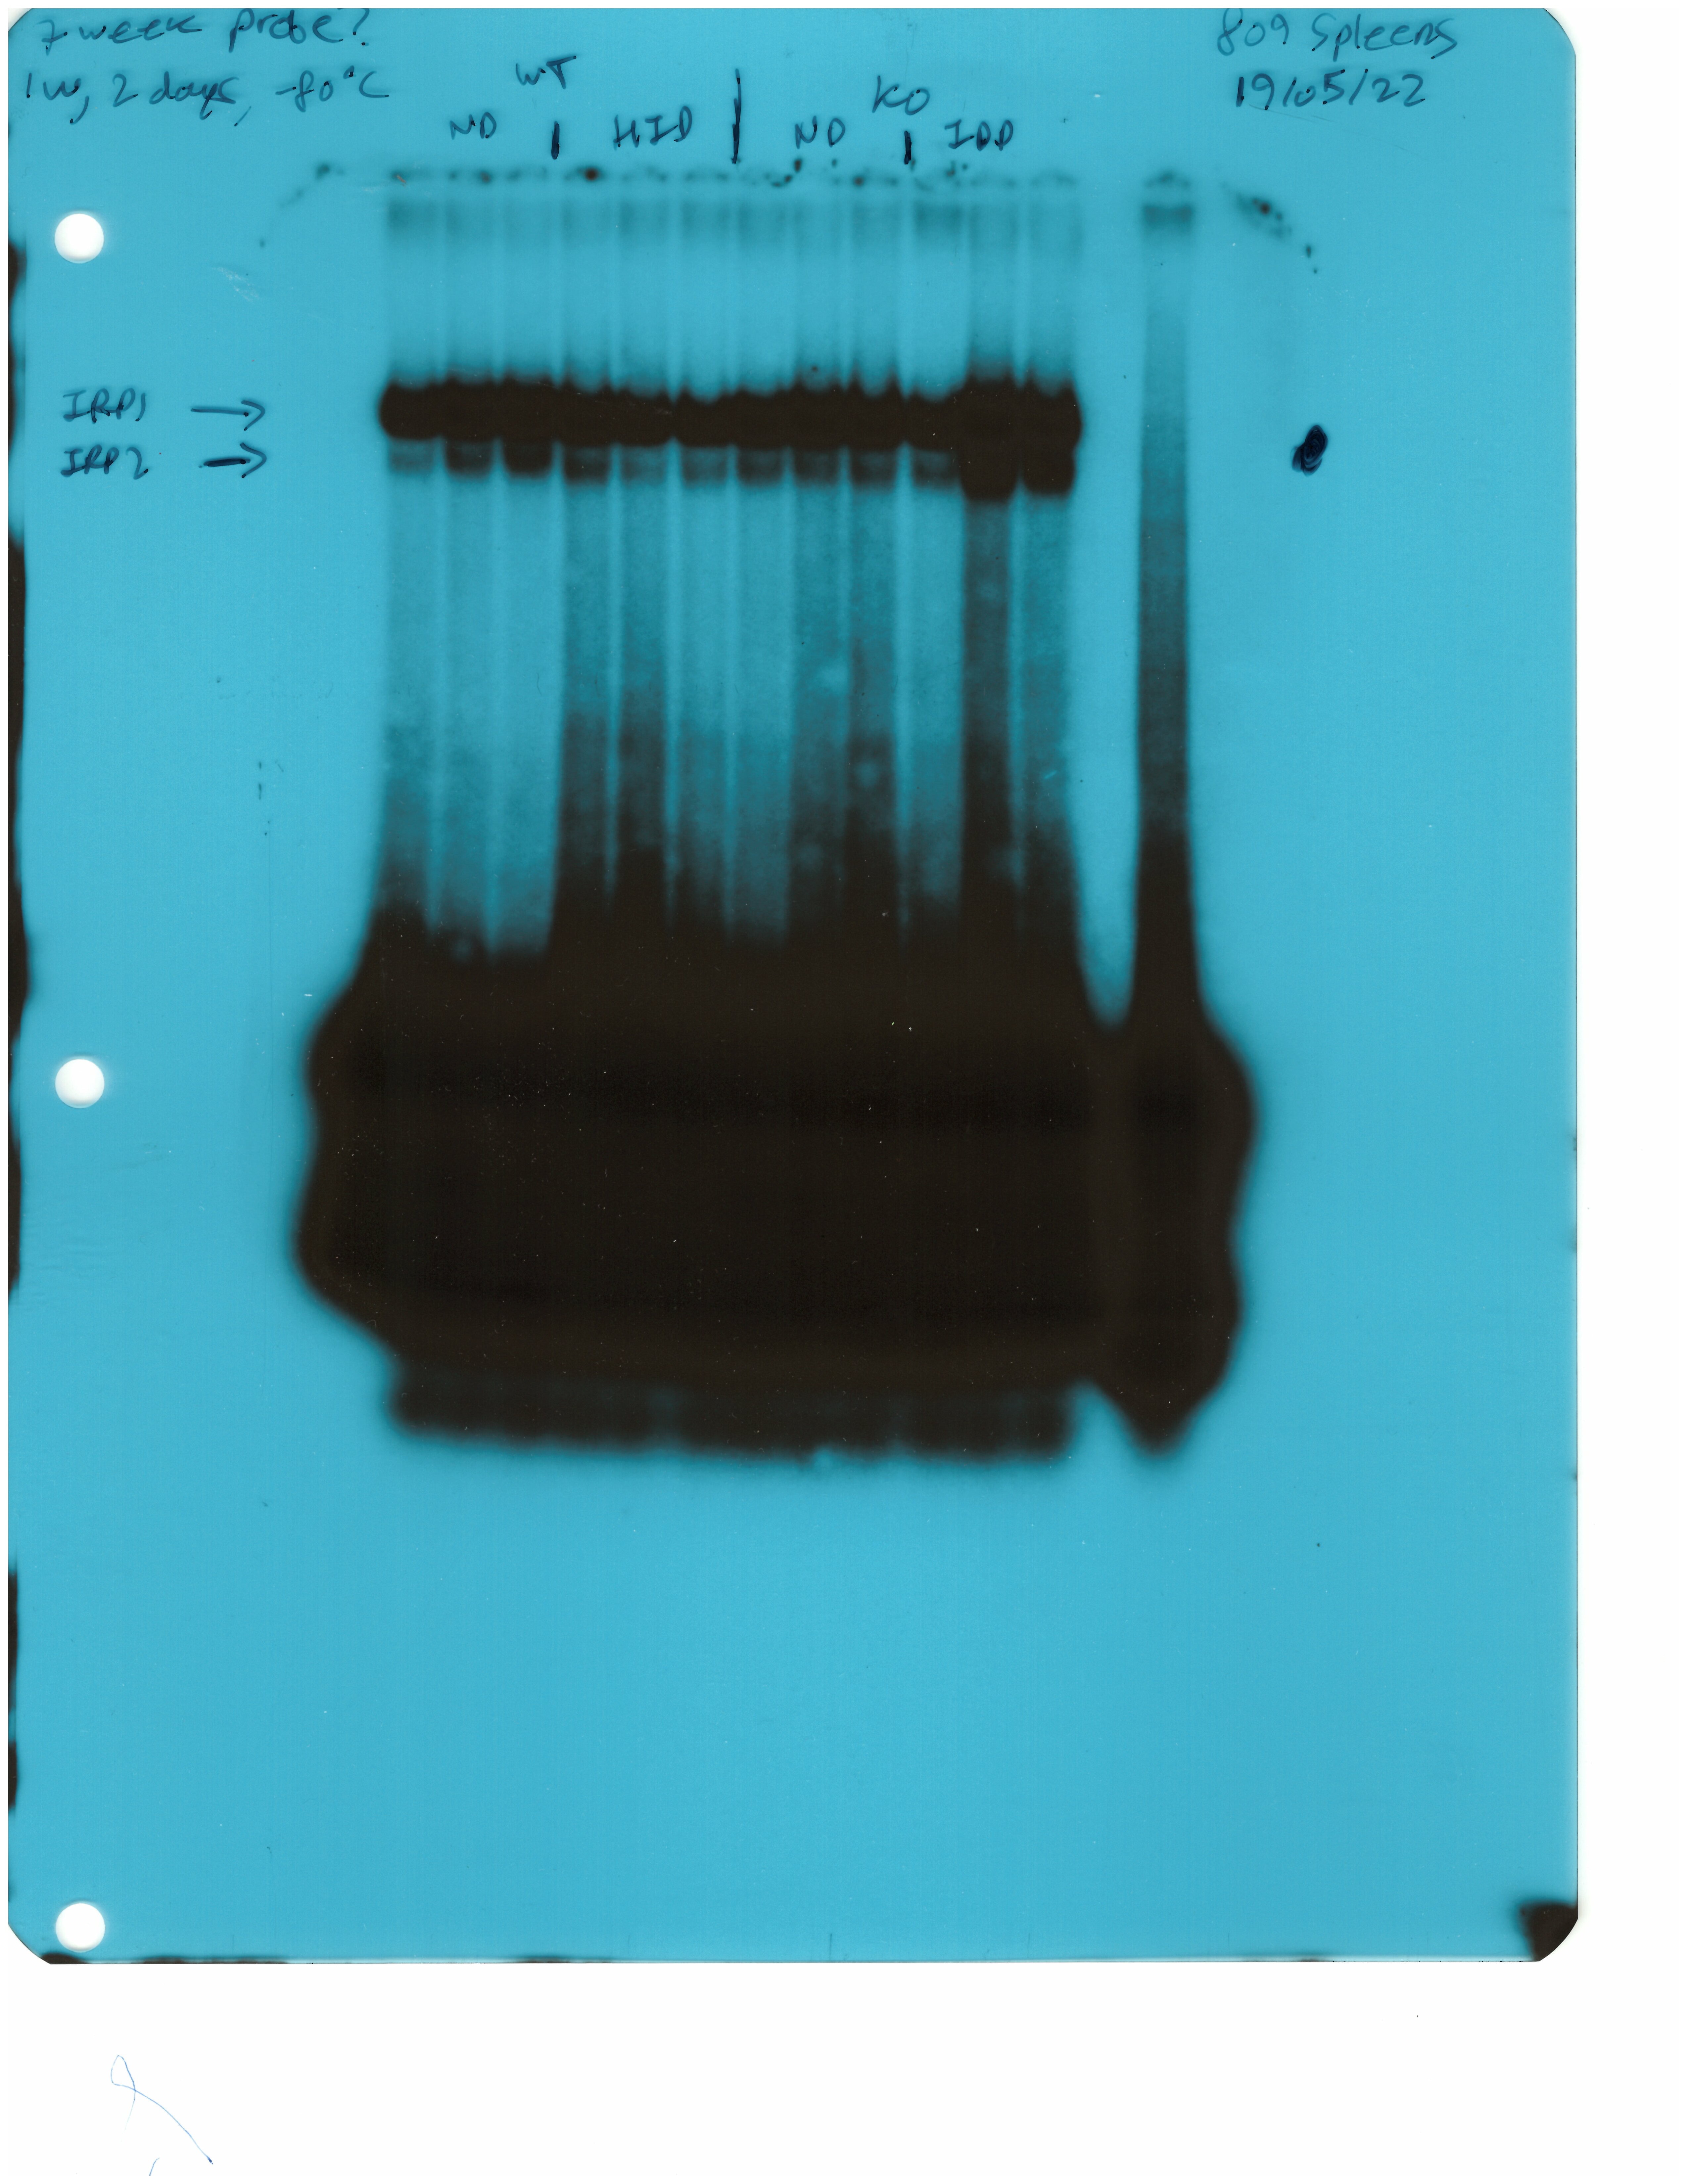
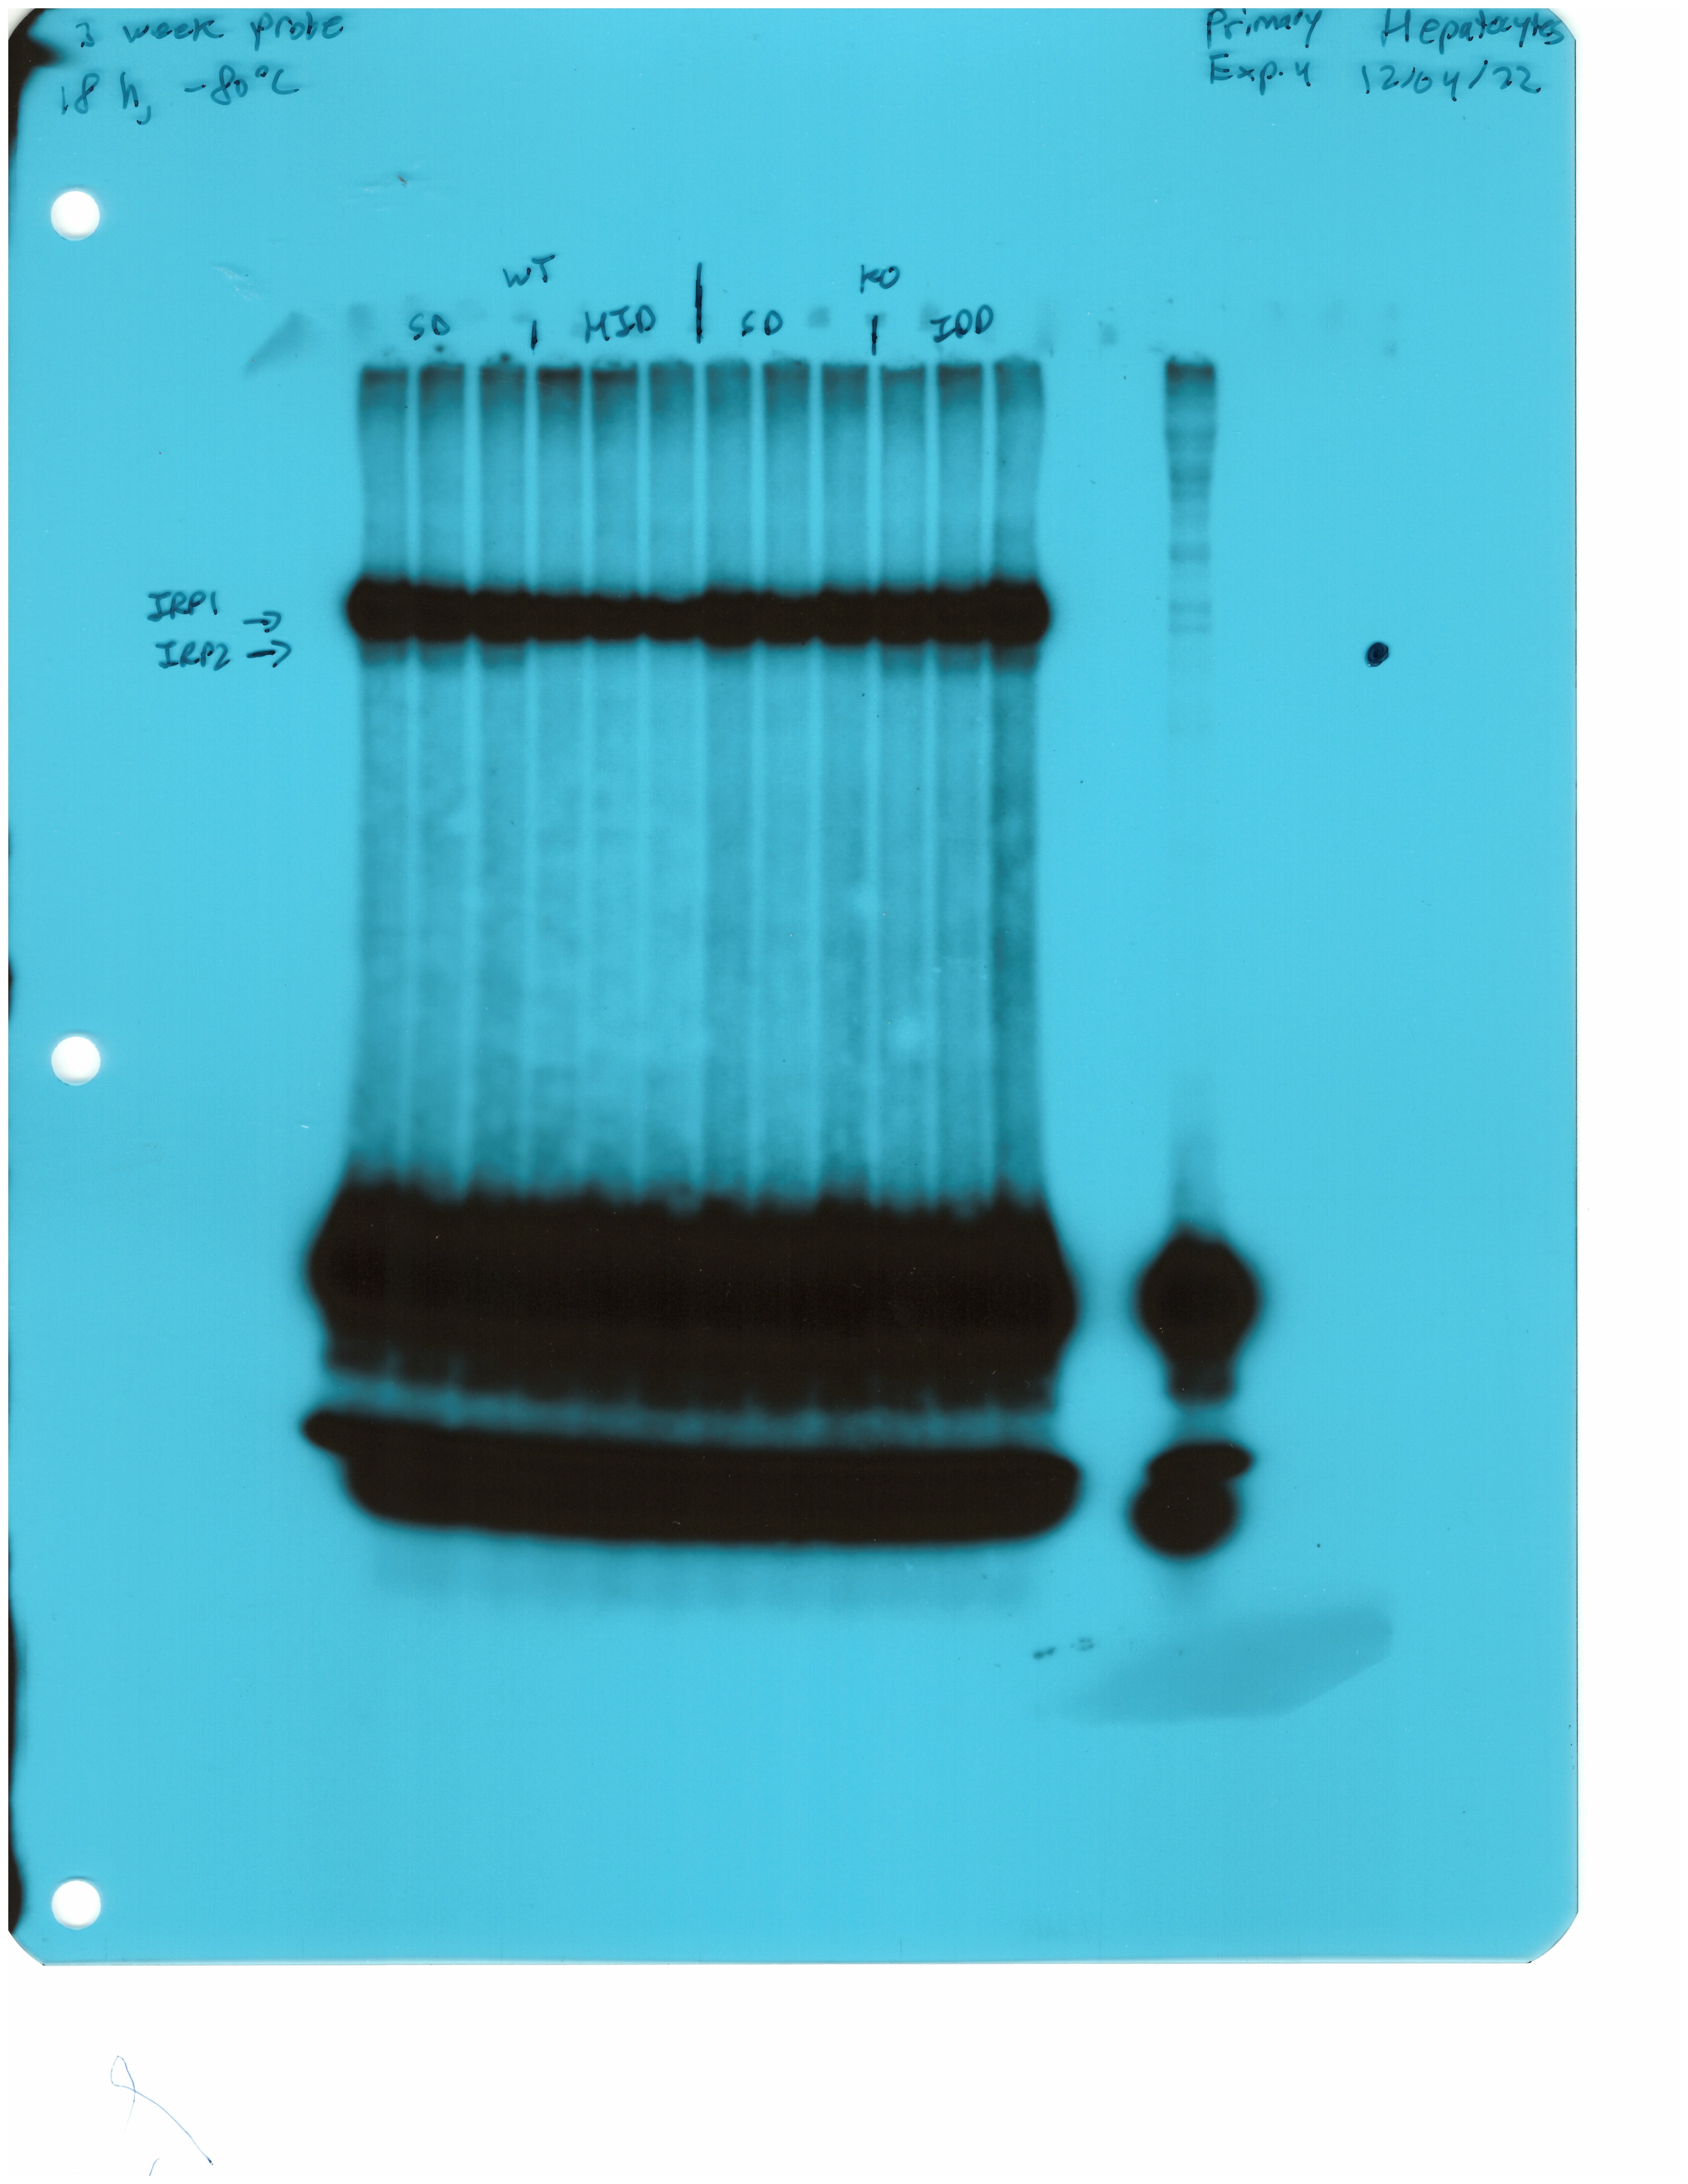
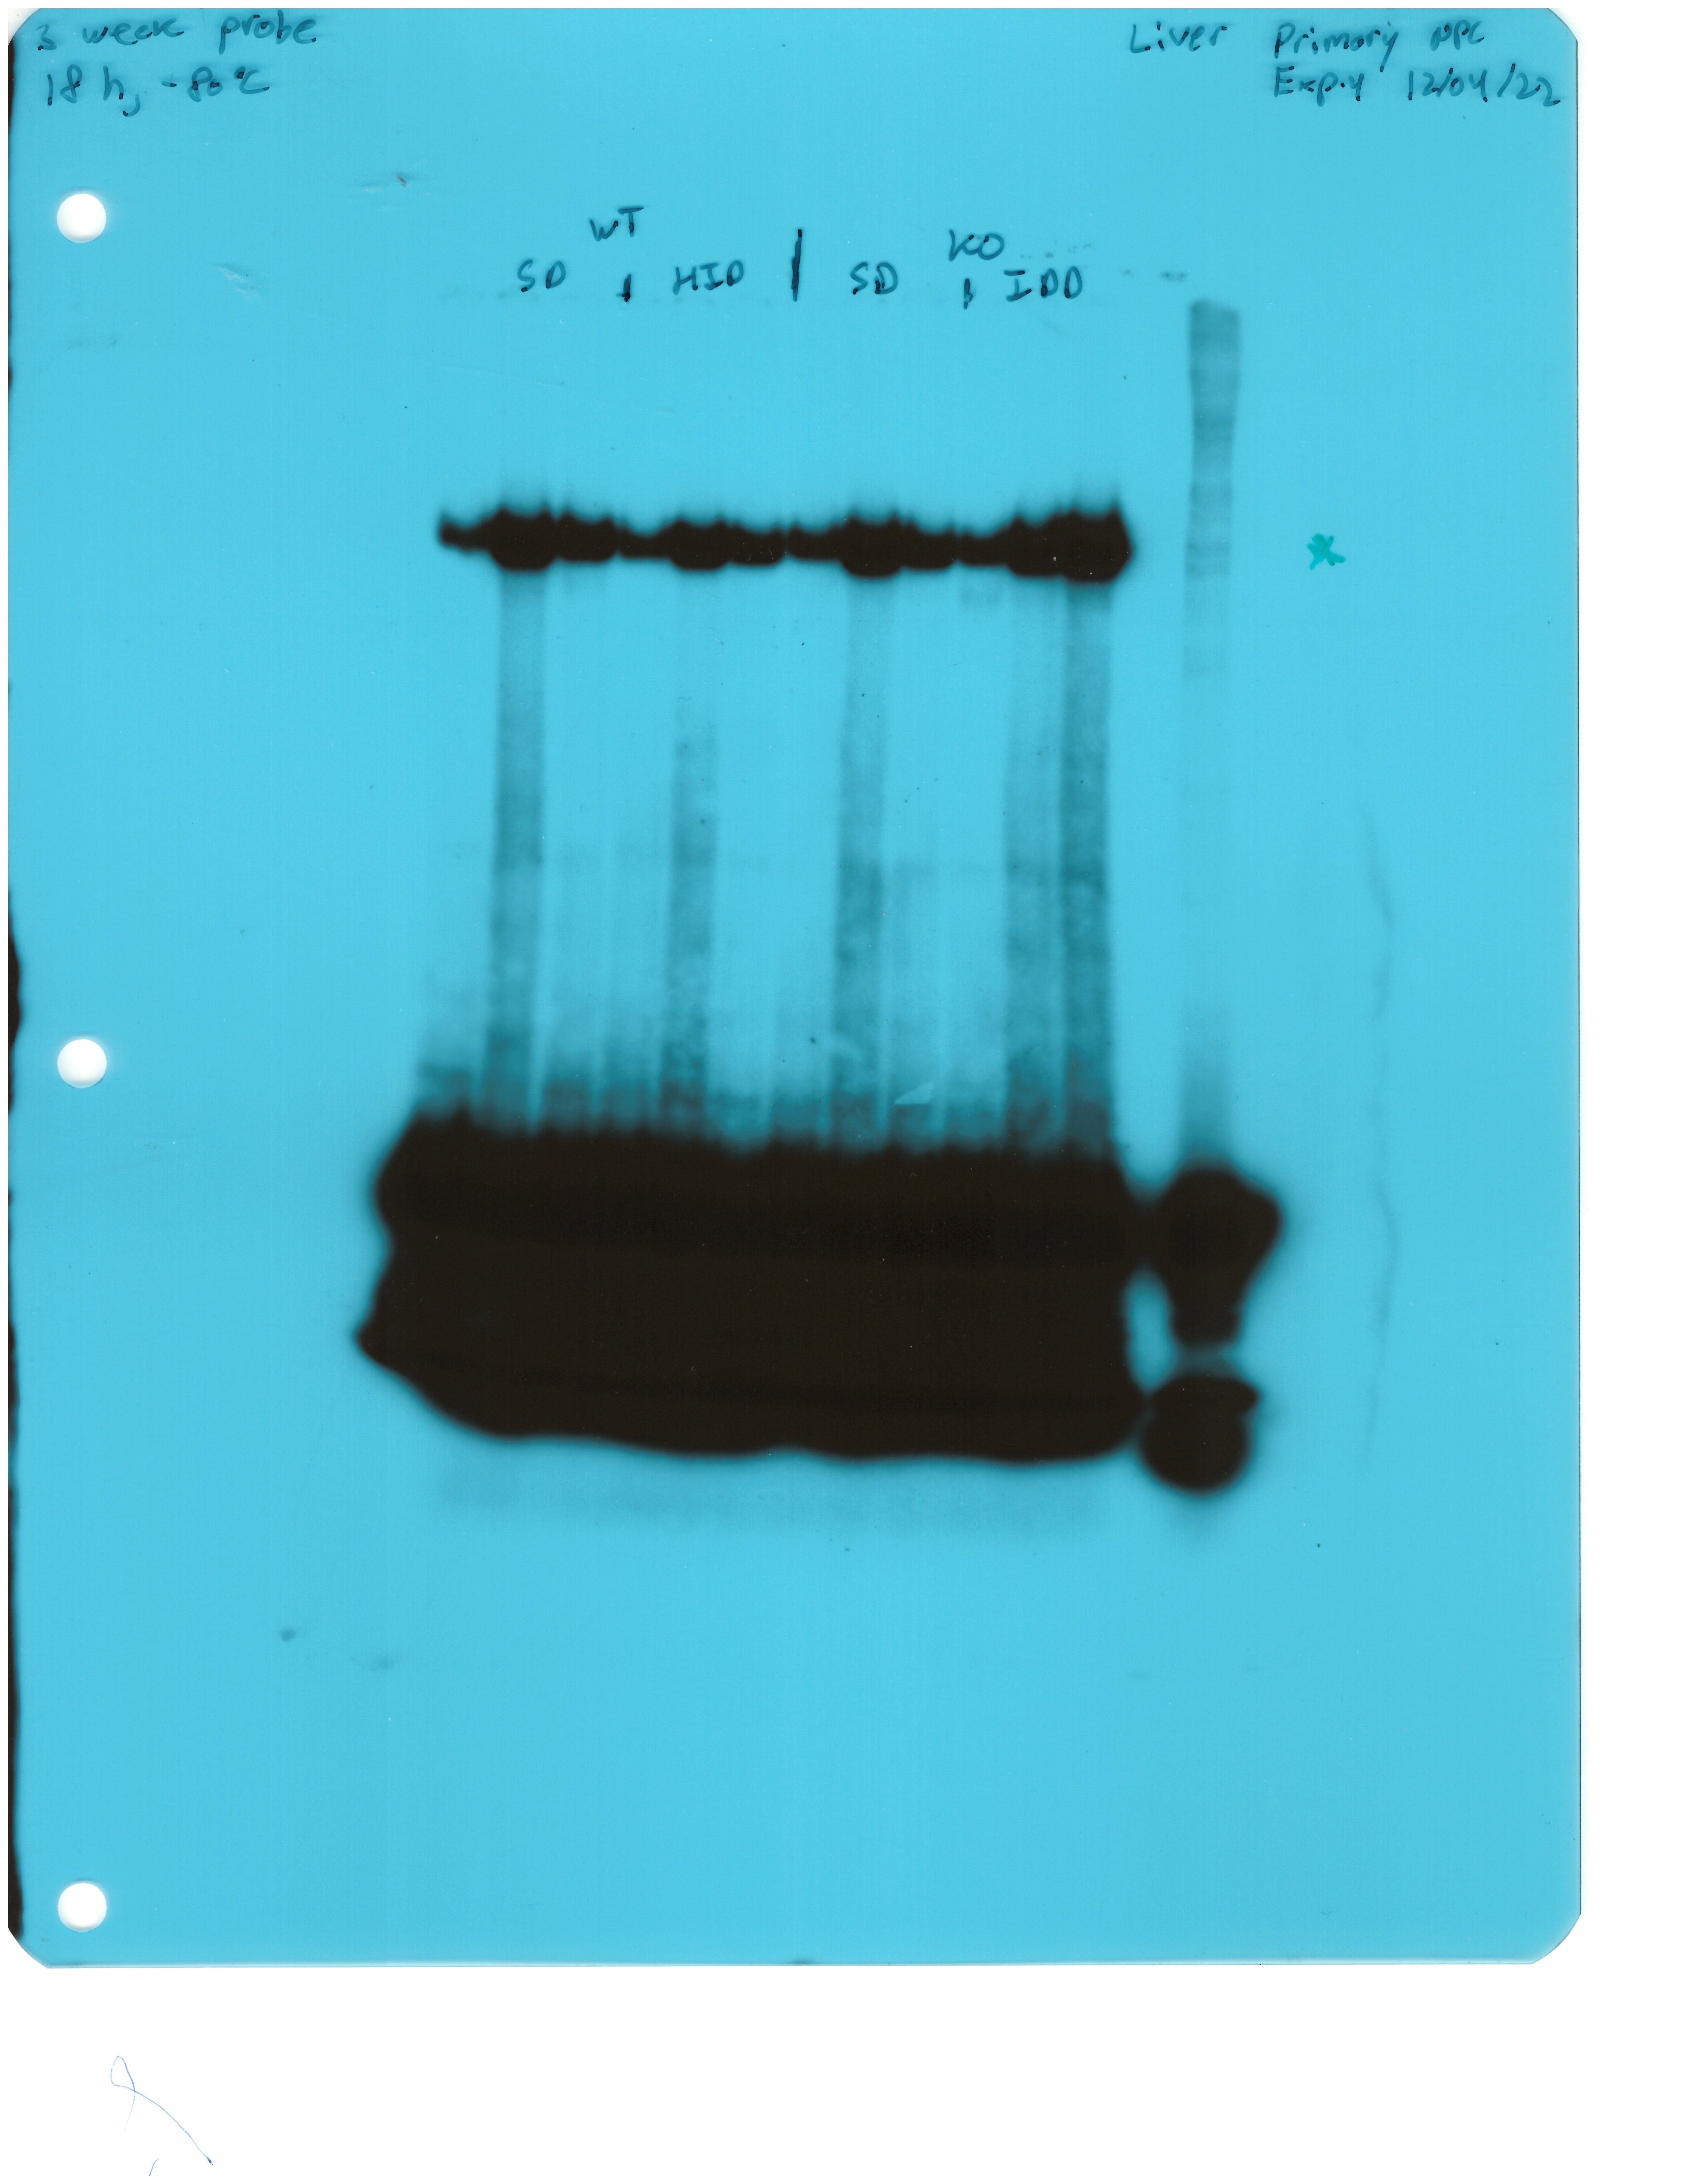
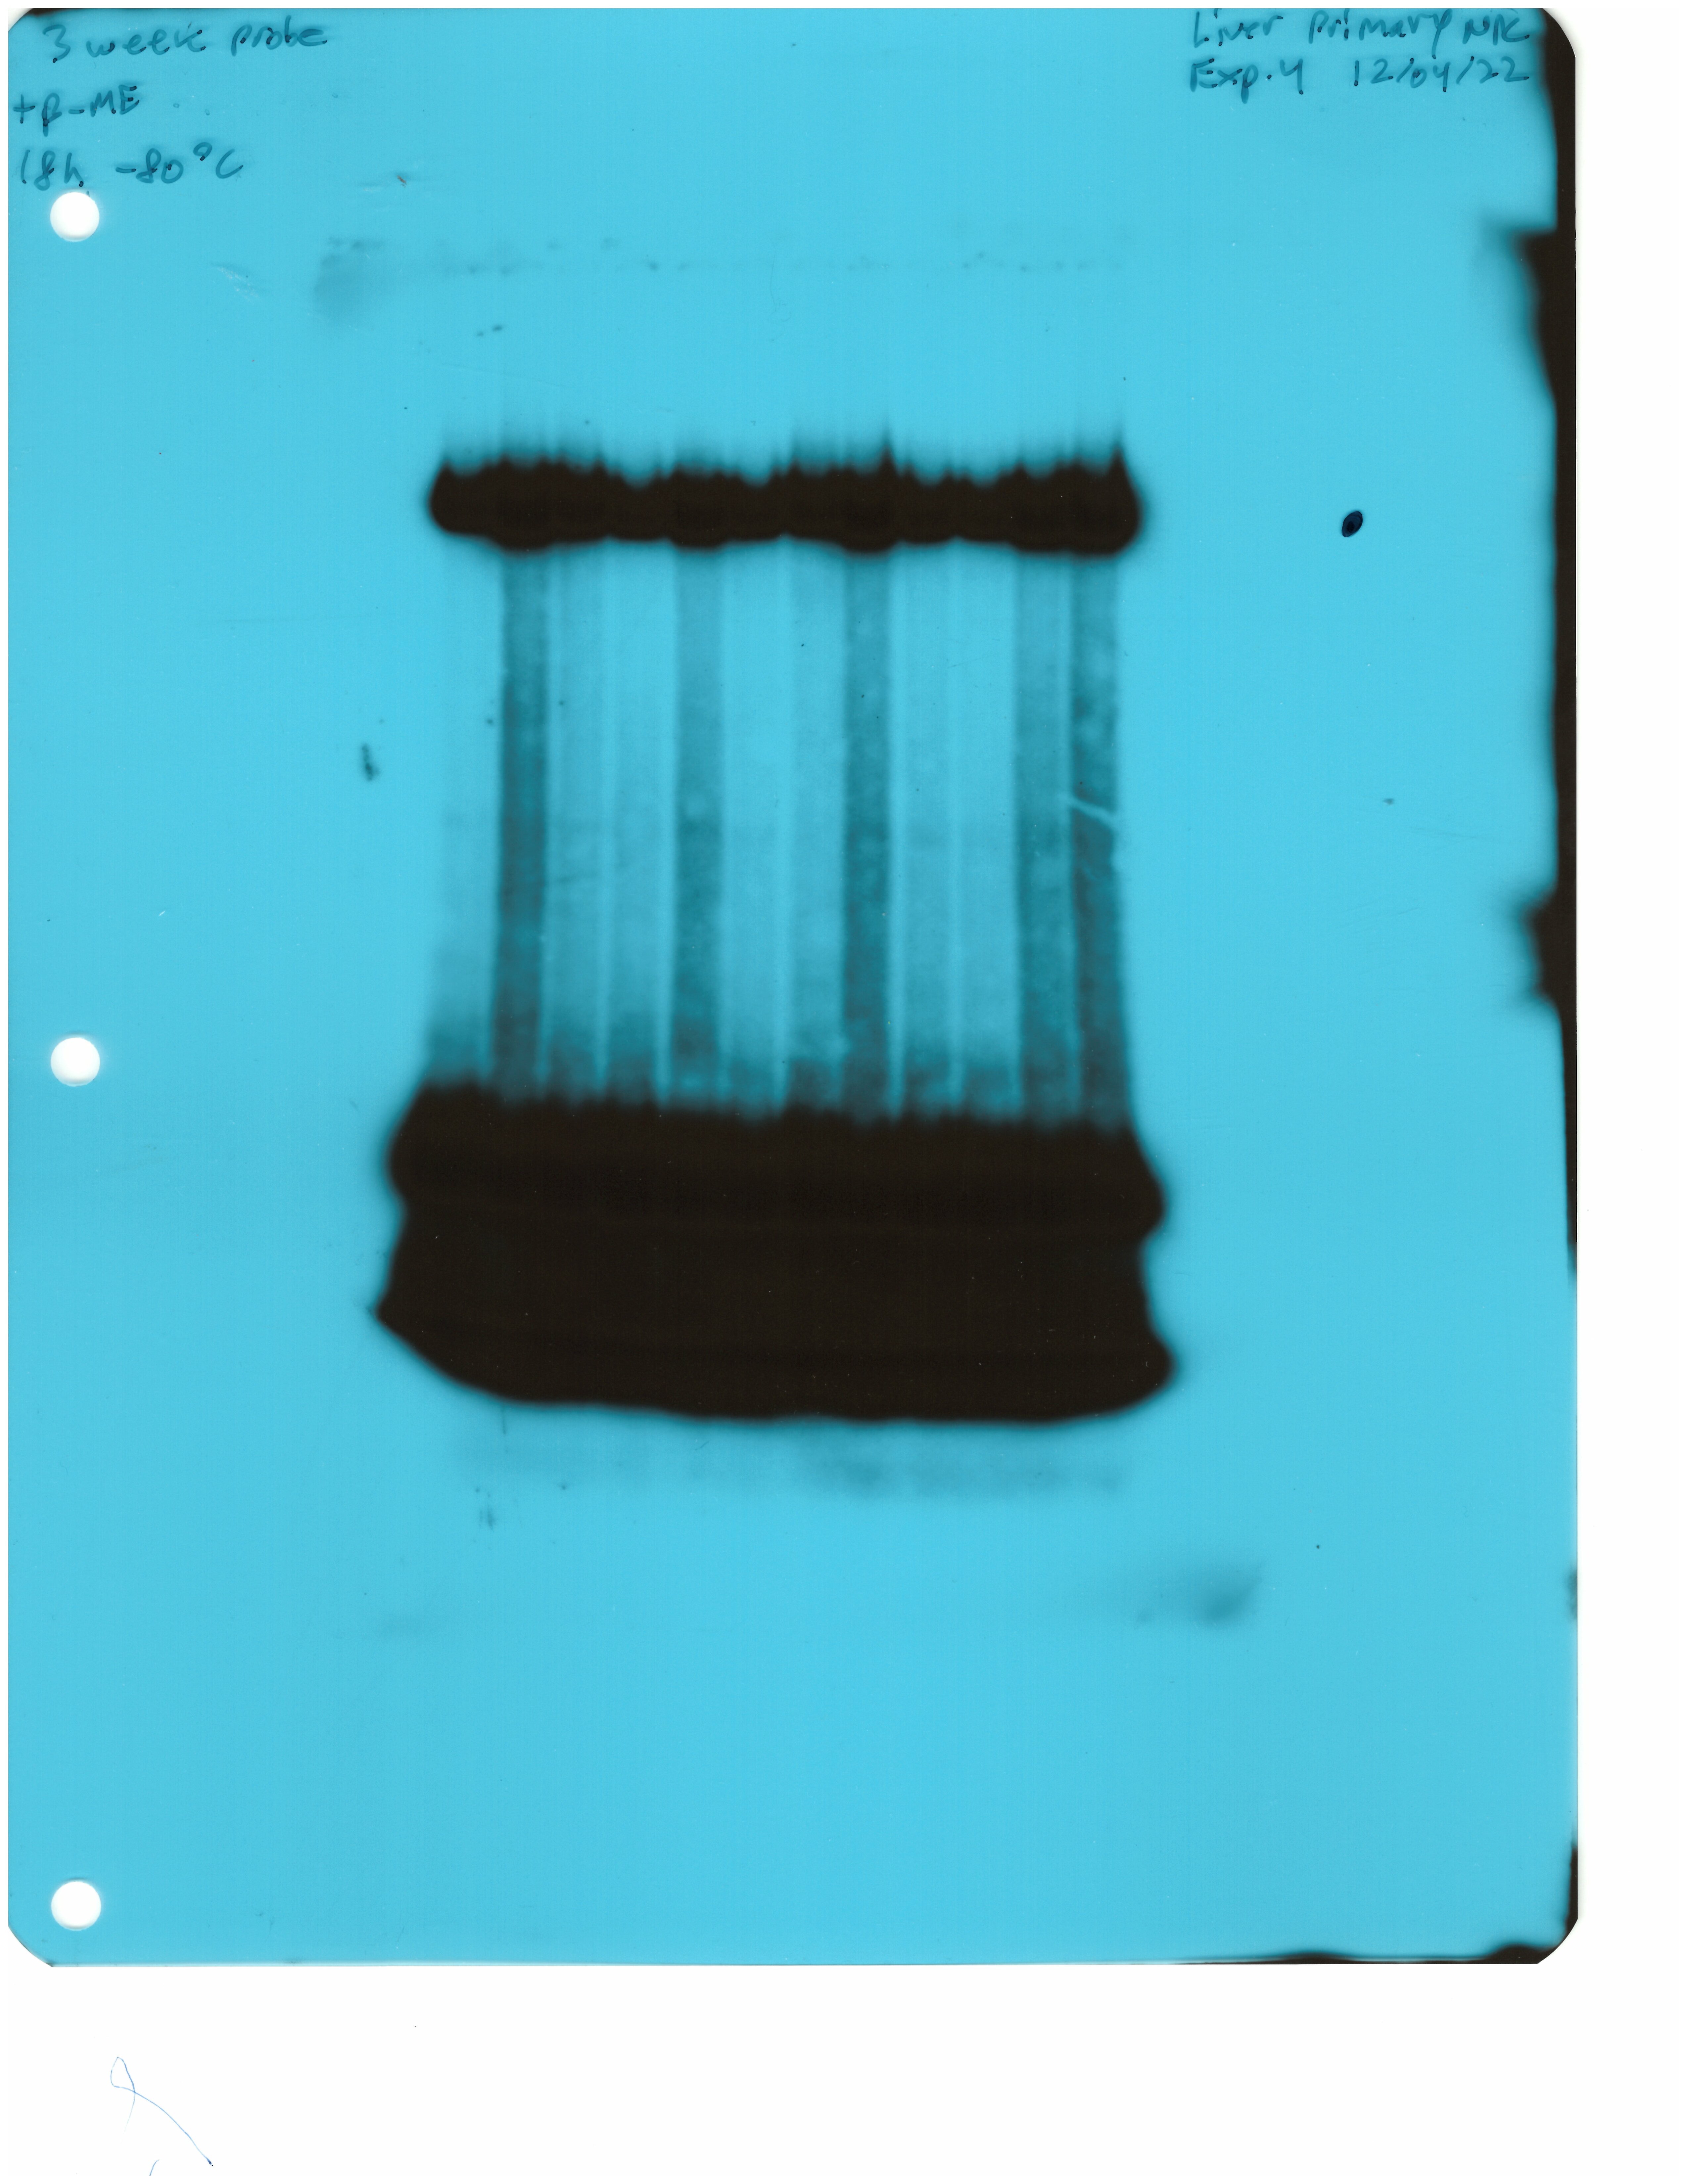
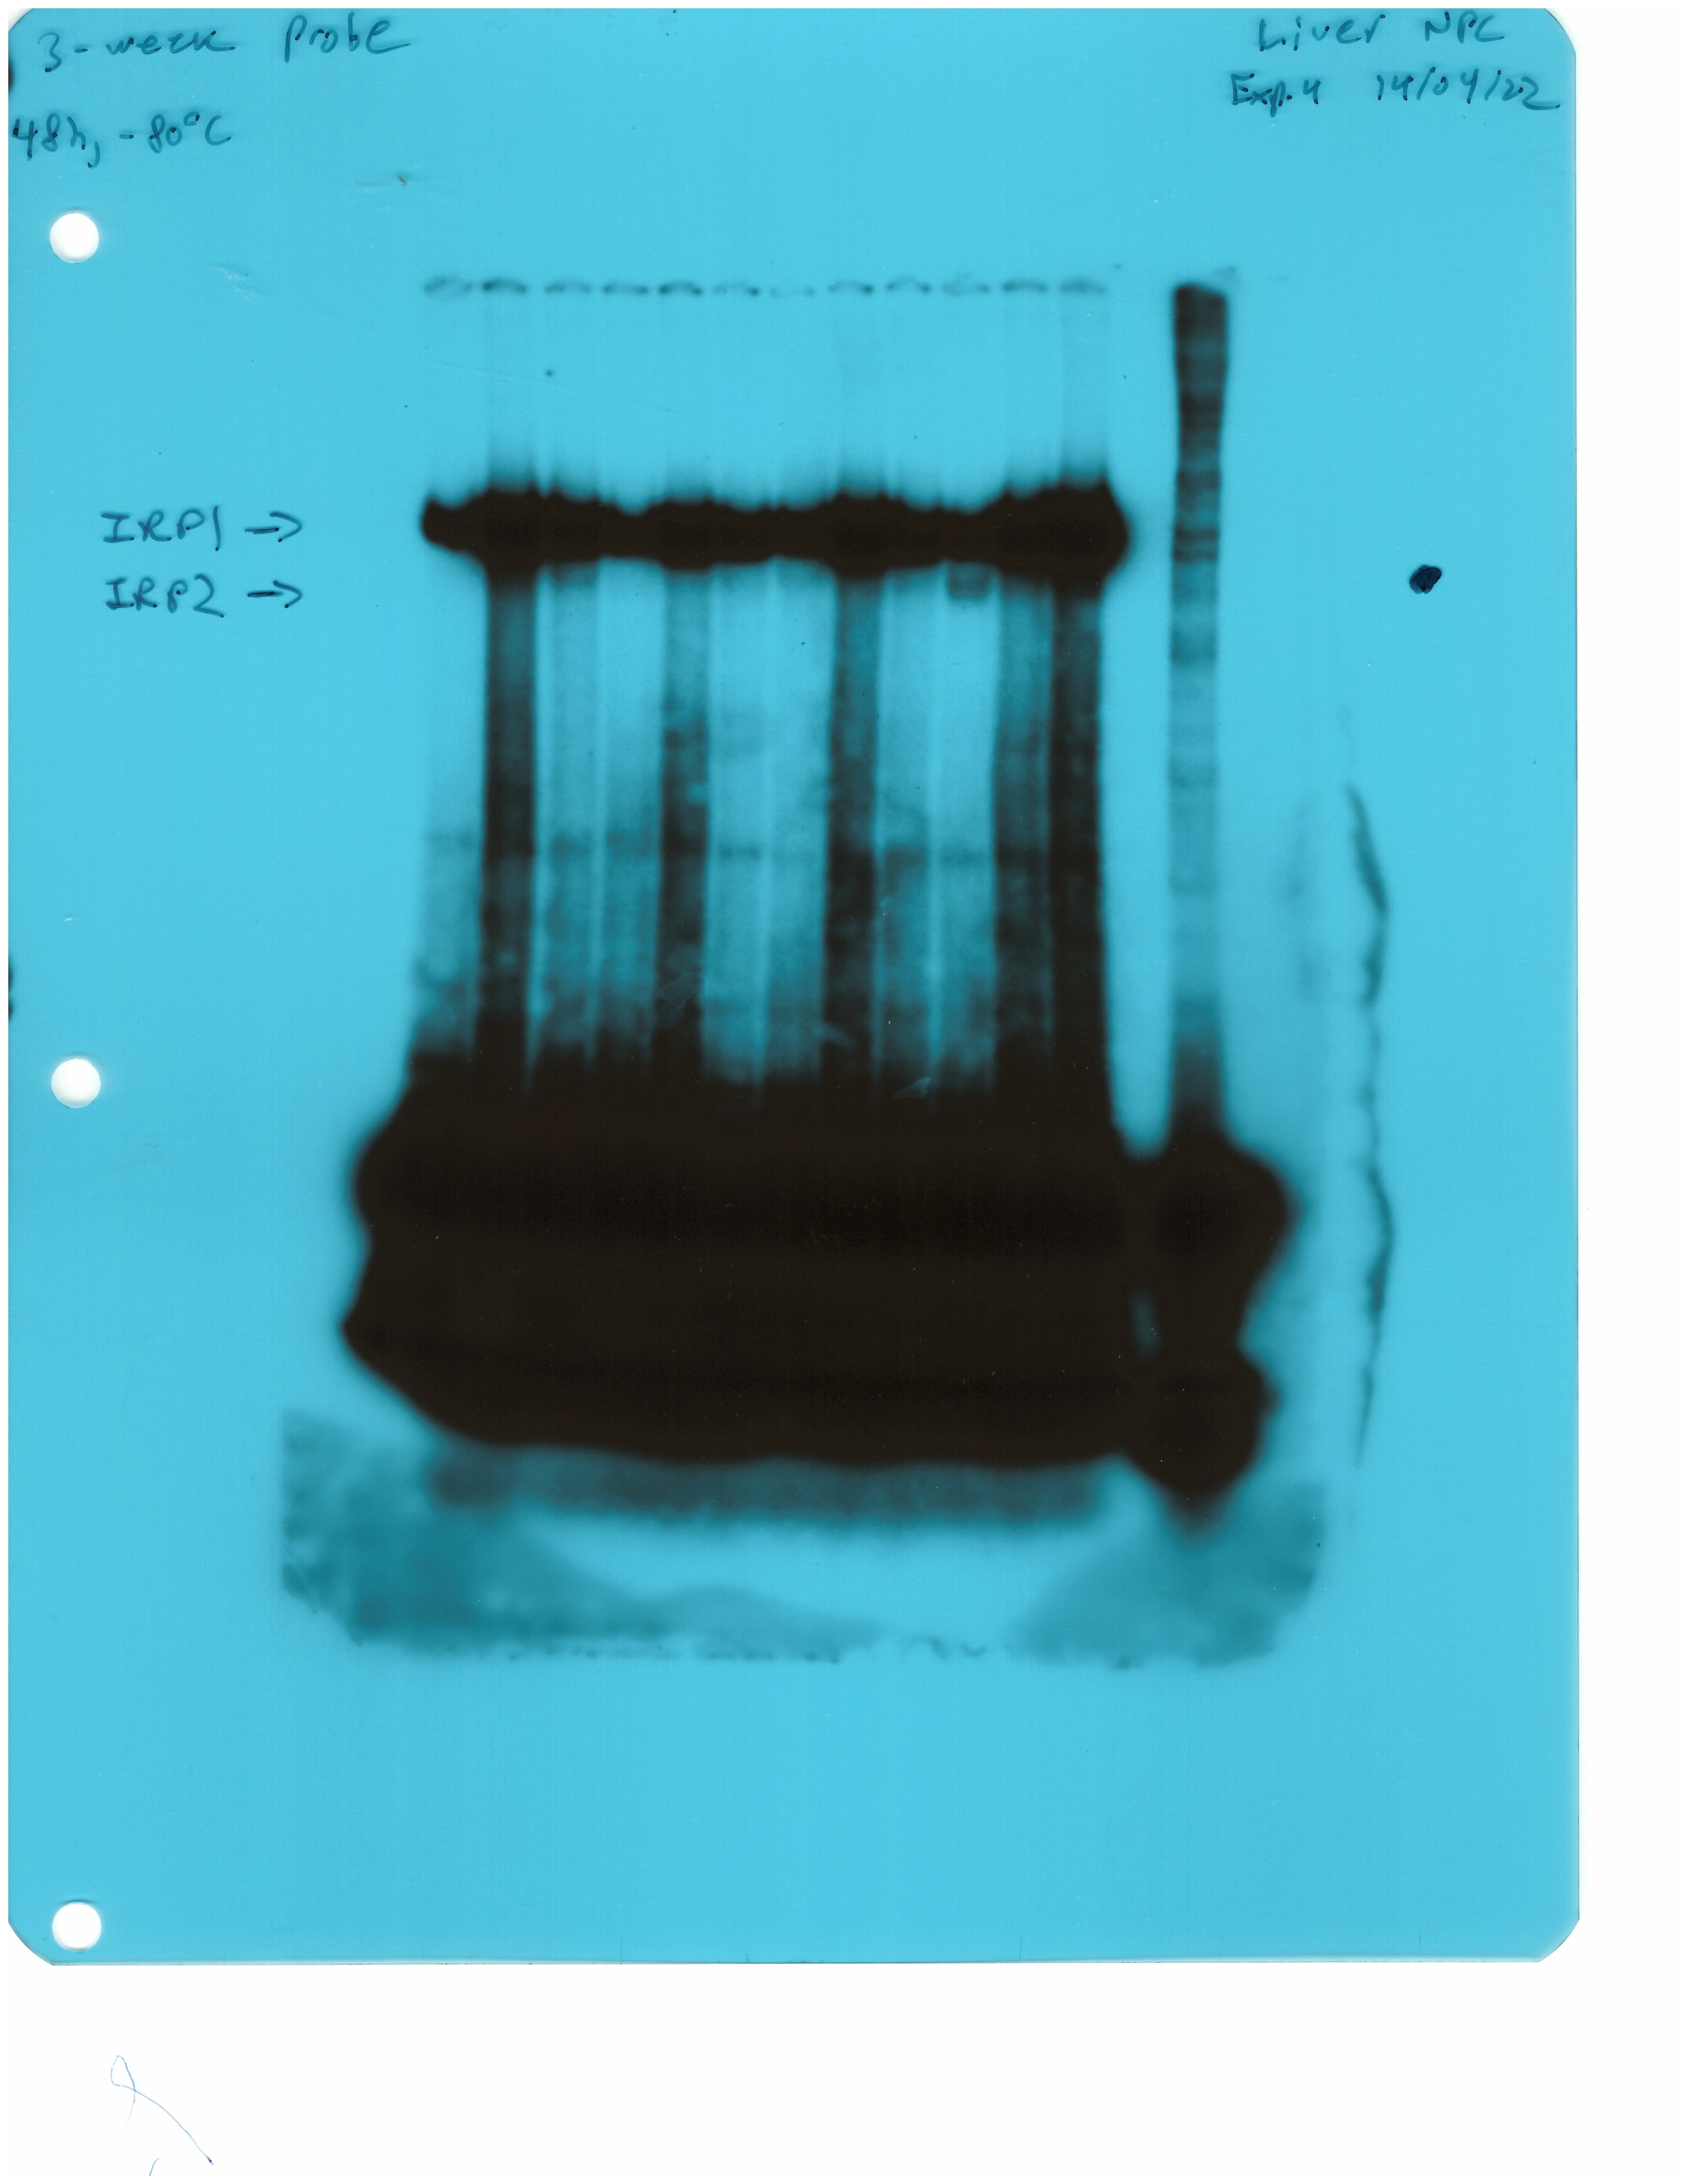
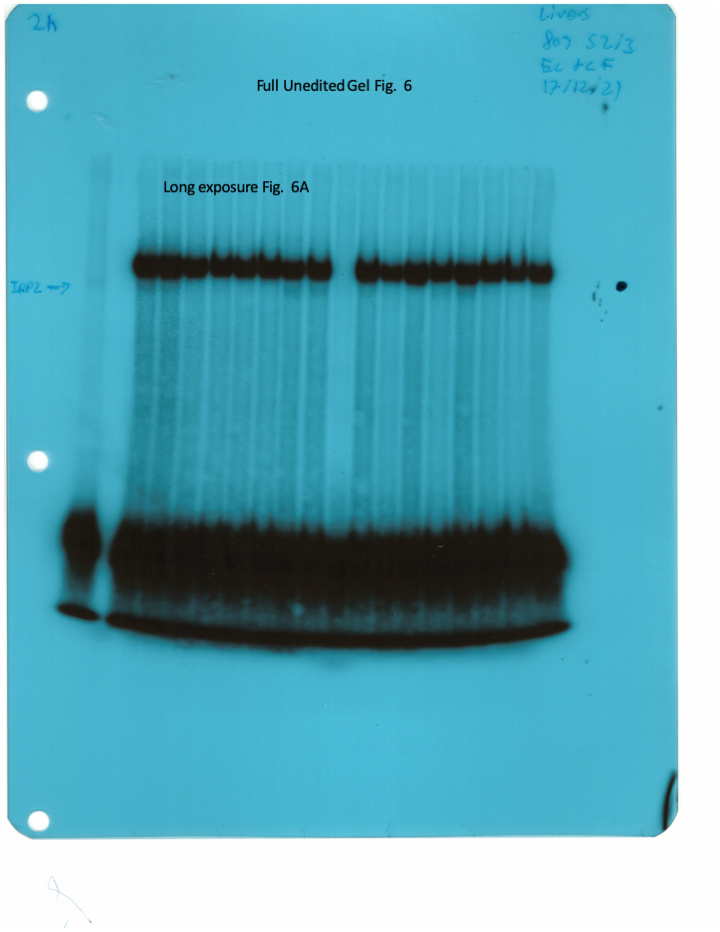
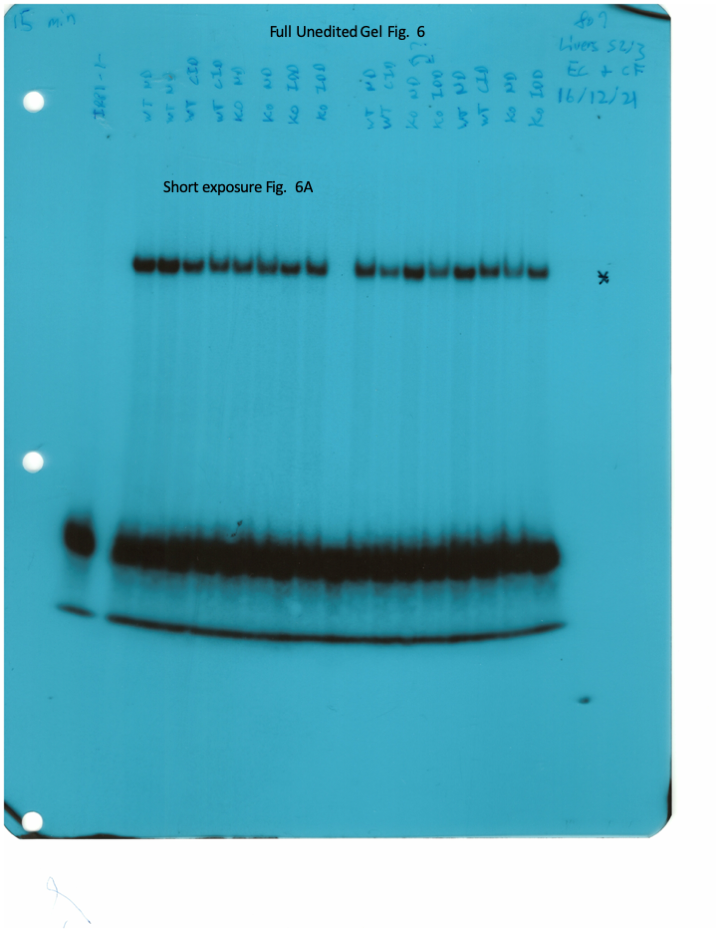
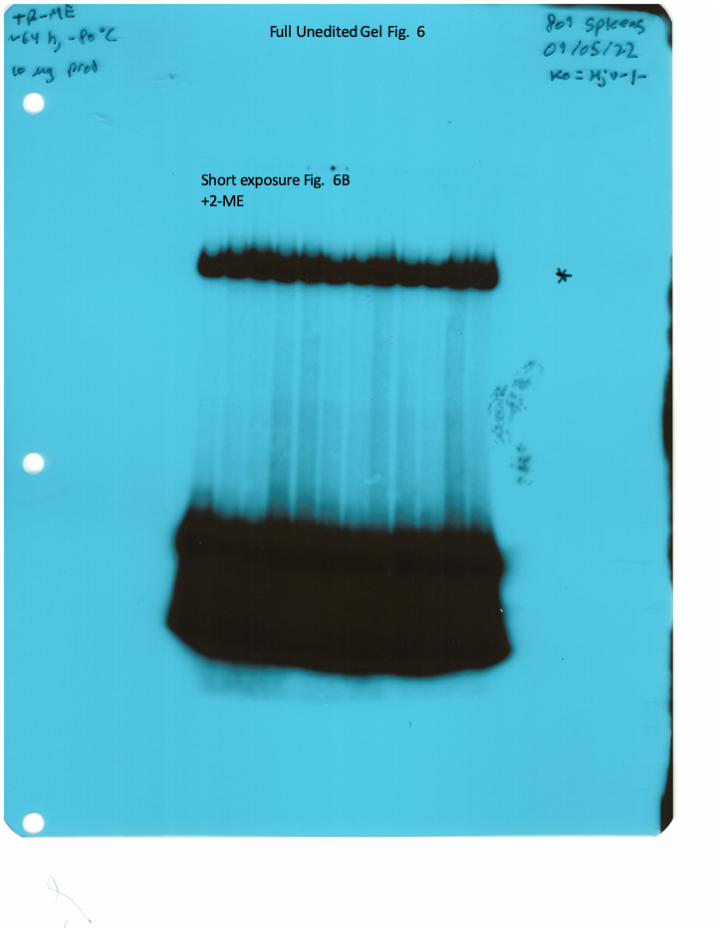
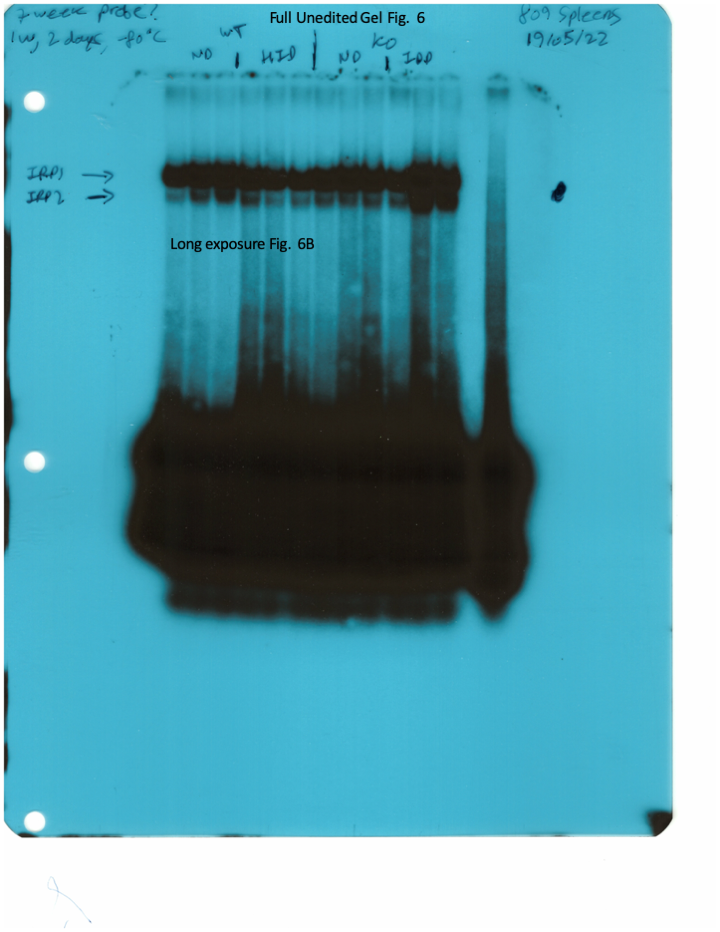
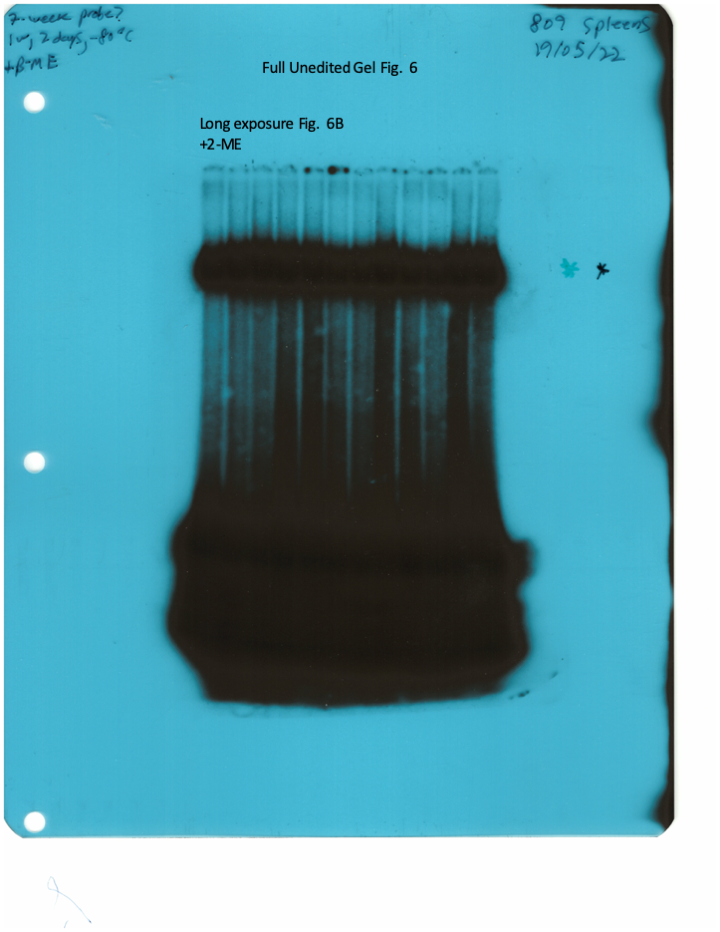
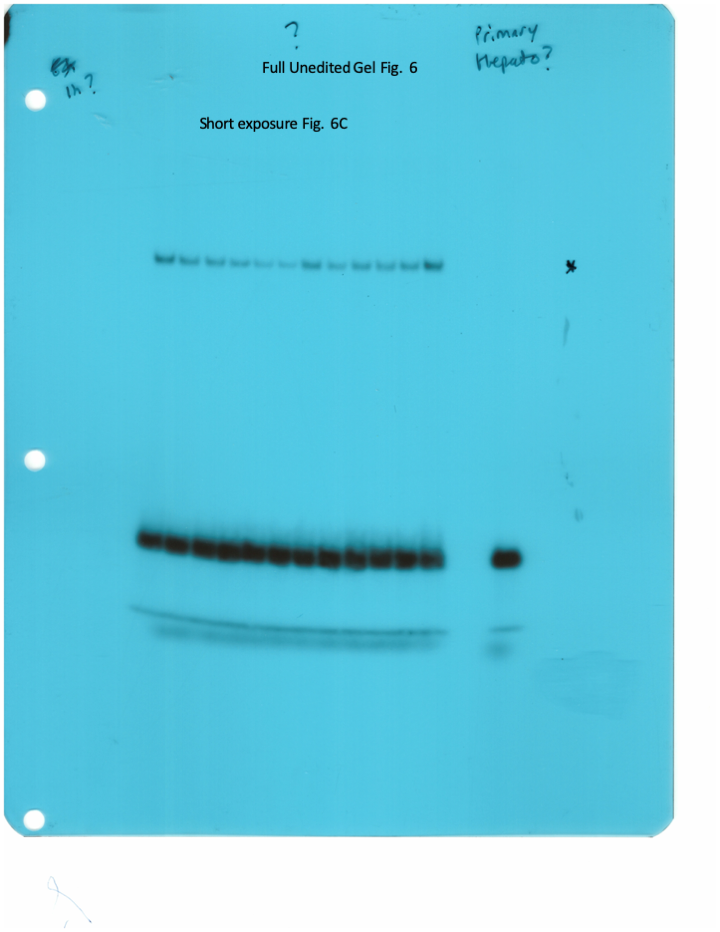
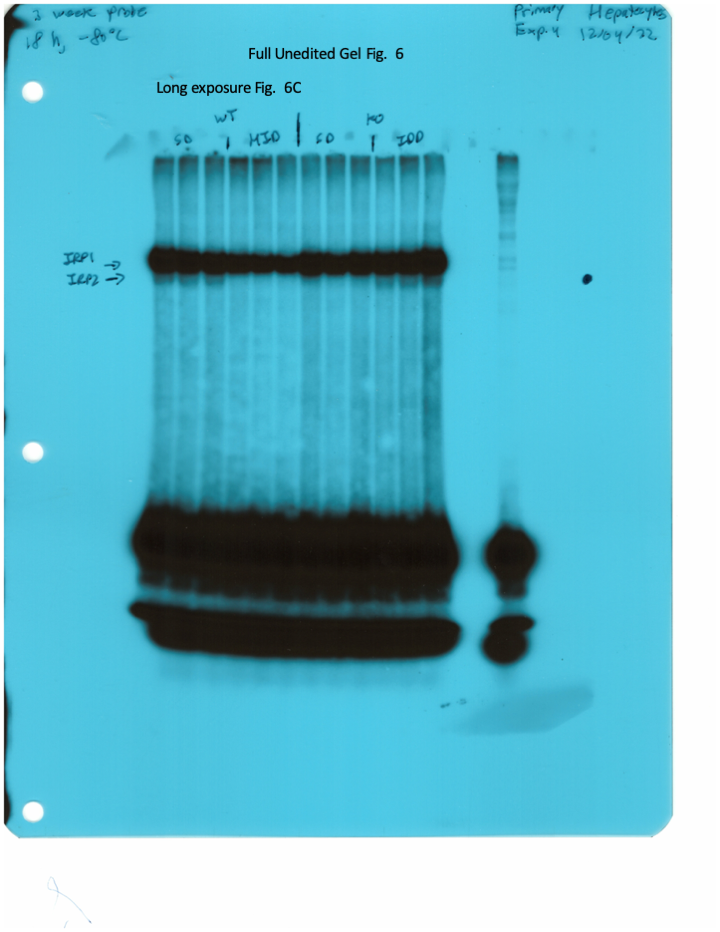
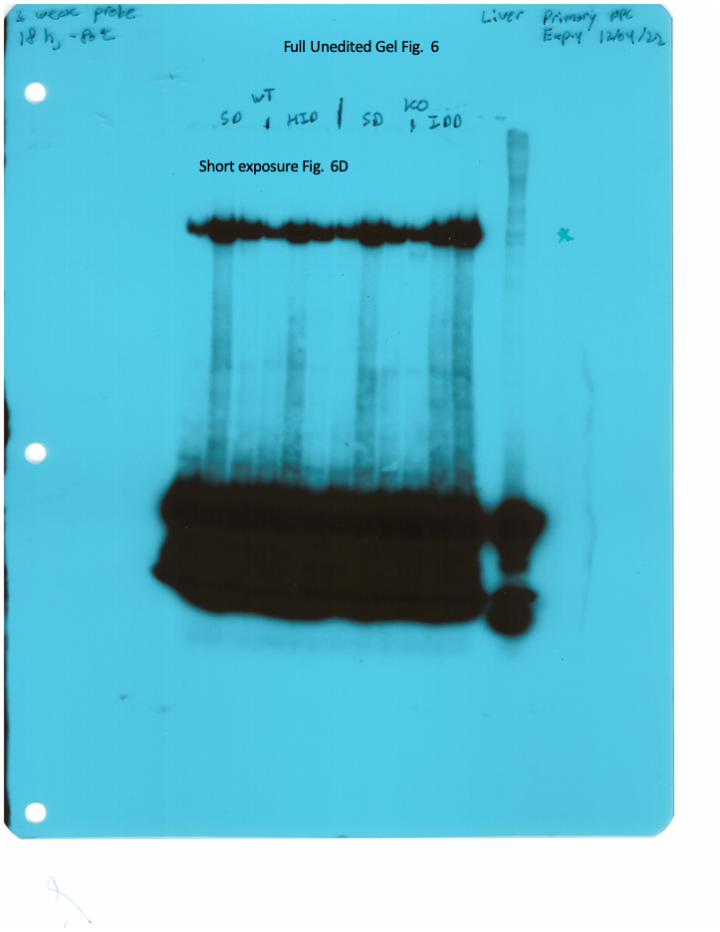
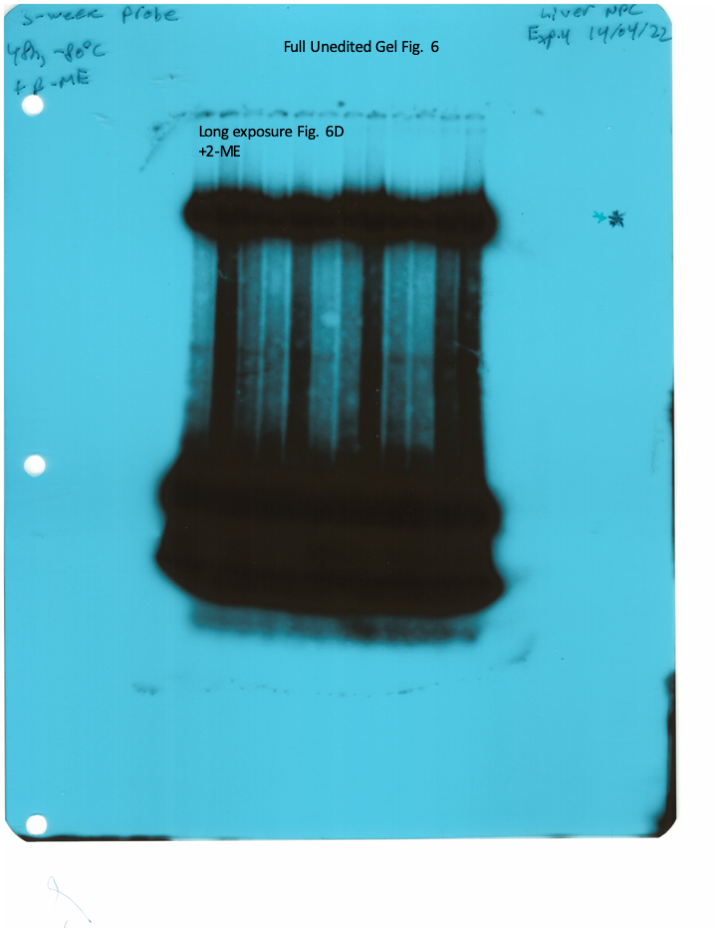
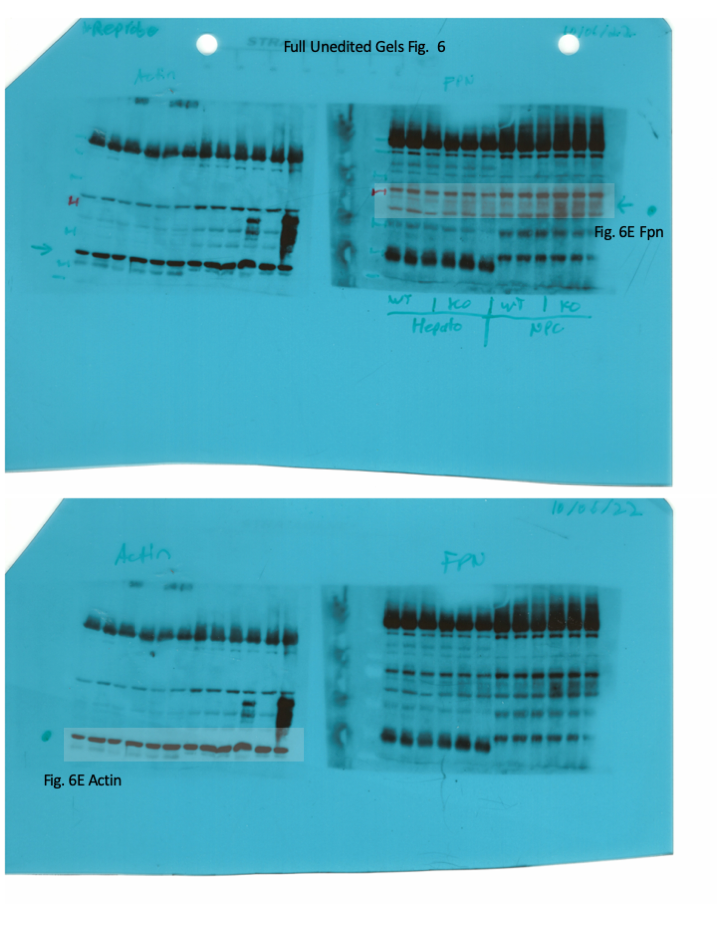
Dietary iron manipulations trigger IRP responses in the liver and spleen, as well as in primary hepatocytes and non-parenchymal liver cells of wild type and Hjv-/- mice.
Whole liver (A), whole spleen (B), isolated hepatocytes (C) or isolated non-parenchymal liver cells (D) from the mice described in Figure 4 were analyzed for IRE-binding activity by EMSA with a 32P-labelled IRE probe in the absence (top) or presence (bottom) of 2% mercaptoethanol (2-ME). Two or three representative samples from each condition are shown. The positions of IRE/IRP1 and IRE/IRP2 complexes are indicated by arrows. Shorter and longer exposures of the autoradiograms are shown in the left and middle panels, respectively. Relative band intensities were quantified by densitometry and shown on the right panels. (E) Isolated hepatocytes and isolated non-parenchymal liver cells were analyzed by Western blotting for expression of ferroportin and β-actin. Blots were quantified by densitometry and ferroportin/β-actin ratios are shown on the right. Densitometric data are presented as the mean ± SEM. Statistically significant differences (p<0.05) in values from wild type mice on control diet are indicated by a, from wild type mice on HID by b, and from Hjv-/- mice on control diet by c. HID: high-iron diet; IDD: iron-deficient diet; IRE: iron-responsive element; IRP: iron regulatory protein; EMSA: electrophoretic mobility shift assay.
-
Figure 6—source data 1
EMSA quantification.
- https://cdn.elifesciences.org/articles/81332/elife-81332-fig6-data1-v2.xlsx
-
Figure 6—source data 2
Western quantification.
- https://cdn.elifesciences.org/articles/81332/elife-81332-fig6-data2-v2.xlsx
-
Figure 6—source data 3
Raw unlabeled liver EMSA long exposure Figure 6A.
- https://cdn.elifesciences.org/articles/81332/elife-81332-fig6-data3-v2.jpg
-
Figure 6—source data 4
Raw unlabeled liver EMSA long exposure 2-ME Figure 6A.
- https://cdn.elifesciences.org/articles/81332/elife-81332-fig6-data4-v2.jpg
-
Figure 6—source data 5
Raw unlabeled liver EMSA short exposure Figure 6A.
- https://cdn.elifesciences.org/articles/81332/elife-81332-fig6-data5-v2.jpg
-
Figure 6—source data 6
Raw unlabeled liver EMSA short exposure 2-ME Figure 6A.
- https://cdn.elifesciences.org/articles/81332/elife-81332-fig6-data6-v2.jpg
-
Figure 6—source data 7
Raw unlabeled spleen EMSA long exposure Figure 6B.
- https://cdn.elifesciences.org/articles/81332/elife-81332-fig6-data7-v2.jpg
-
Figure 6—source data 8
Raw unlabeled spleen EMSA long exposure 2-ME Figure 6B.
- https://cdn.elifesciences.org/articles/81332/elife-81332-fig6-data8-v2.jpg
-
Figure 6—source data 9
Raw unlabeled spleen EMSA short exposure Figure 6B.
- https://cdn.elifesciences.org/articles/81332/elife-81332-fig6-data9-v2.jpg
-
Figure 6—source data 10
Raw unlabeled spleen EMSA short exposure BME Figure 6B.
- https://cdn.elifesciences.org/articles/81332/elife-81332-fig6-data10-v2.jpg
-
Figure 6—source data 11
Raw unlabeled Western blot β-actin Figure 6E.
- https://cdn.elifesciences.org/articles/81332/elife-81332-fig6-data11-v2.jpg
-
Figure 6—source data 12
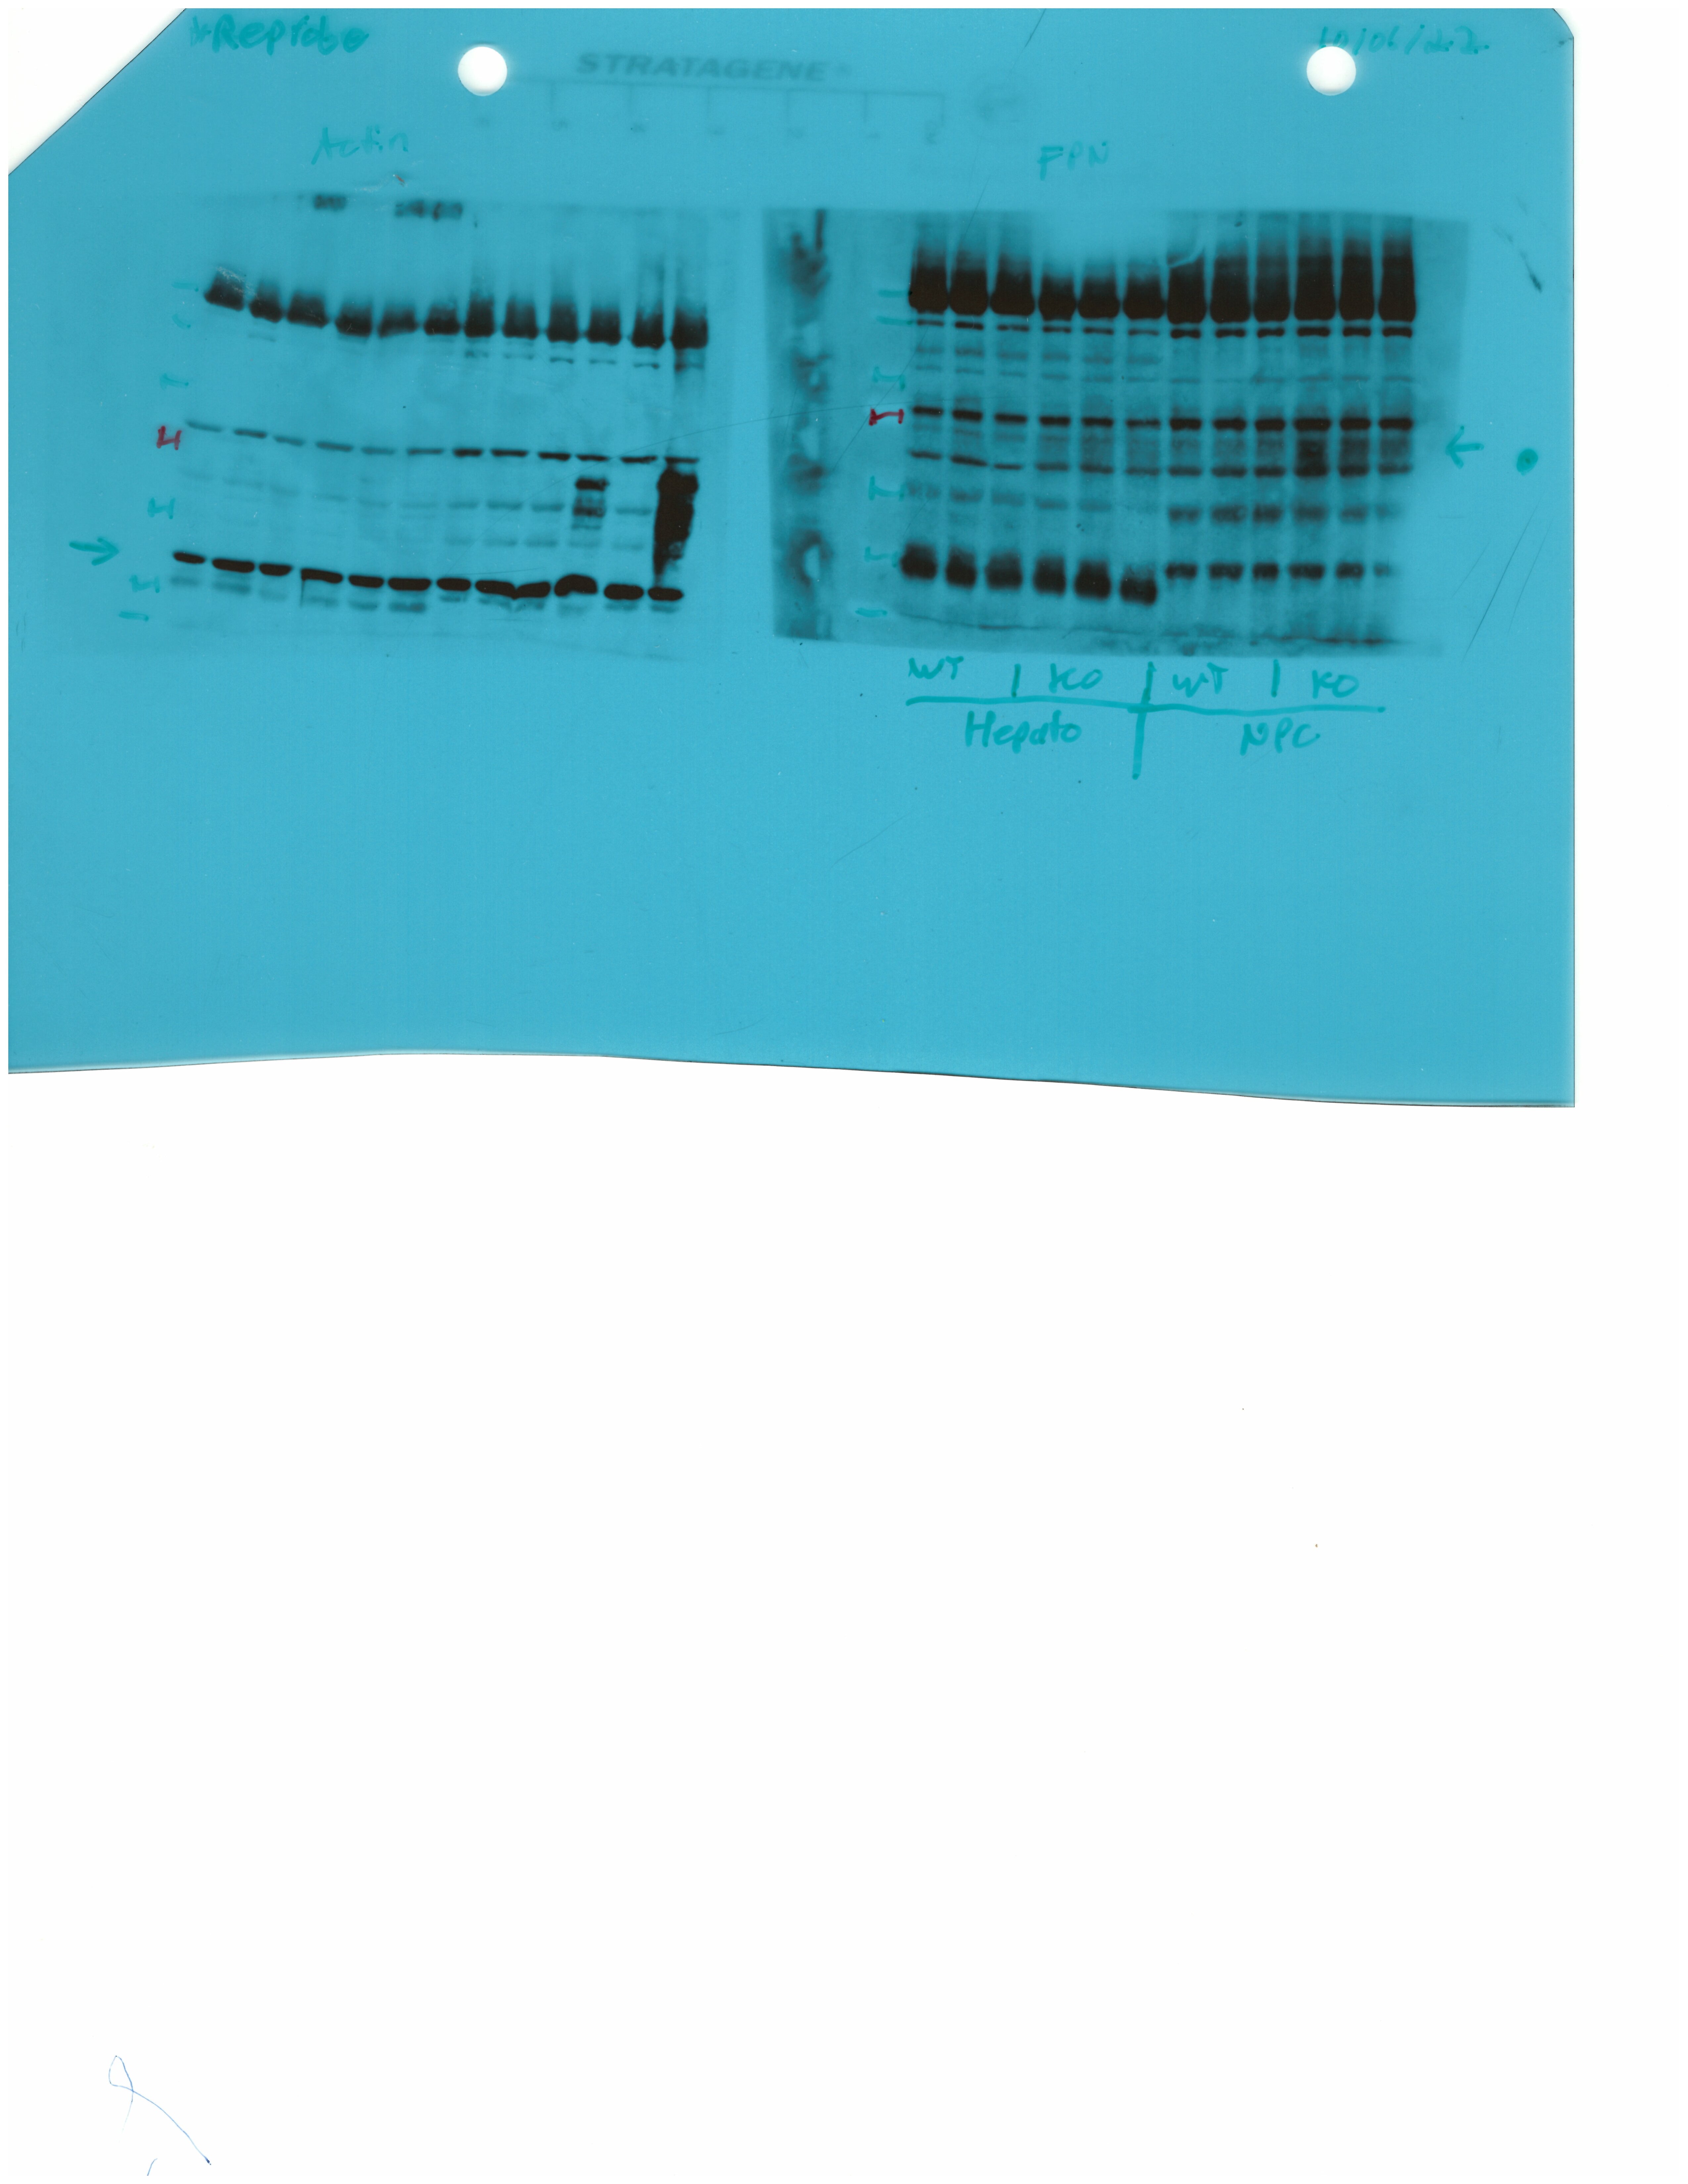
Raw unlabeled Western blot ferroportin Figure 6E.
- https://cdn.elifesciences.org/articles/81332/elife-81332-fig6-data12-v2.jpg
-
Figure 6—source data 13
Raw unlabeled hepatocytes EMSA short exposure Figure 6C.
- https://cdn.elifesciences.org/articles/81332/elife-81332-fig6-data13-v2.jpg
-
Figure 6—source data 14
Raw unlabeled hepatocytes EMSA short exposure 2-ME Figure 6C.
- https://cdn.elifesciences.org/articles/81332/elife-81332-fig6-data14-v2.jpg
-
Figure 6—source data 15
Raw unlabeled hepatocytes EMSA long exposure Figure 6C.
- https://cdn.elifesciences.org/articles/81332/elife-81332-fig6-data15-v2.jpg
-
Figure 6—source data 16
Raw unlabeled hepatocytes EMSA long exposure 2-ME Figure 6C.
- https://cdn.elifesciences.org/articles/81332/elife-81332-fig6-data16-v2.jpg
-
Figure 6—source data 17
Raw unlabeled non-parenchymal cells EMSA short exposure Figure 6D.
- https://cdn.elifesciences.org/articles/81332/elife-81332-fig6-data17-v2.jpg
-
Figure 6—source data 18
Raw unlabeled non-parenchymal cells EMSA short exposure 2-ME Figure 6D.
- https://cdn.elifesciences.org/articles/81332/elife-81332-fig6-data18-v2.jpg
-
Figure 6—source data 19
Raw unlabeled non-parenchymal cells EMSA long exposure Figure 6D.
- https://cdn.elifesciences.org/articles/81332/elife-81332-fig6-data19-v2.jpg
-
Figure 6—source data 20
Raw unlabeled non-parenchymal cells EMSA long exposure 2-ME Figure 6D.
- https://cdn.elifesciences.org/articles/81332/elife-81332-fig6-data20-v2.jpg
-
Figure 6—source data 21
Raw labeled liver EMSA long exposure Figure 6A.
- https://cdn.elifesciences.org/articles/81332/elife-81332-fig6-data21-v2.bmp
-
Figure 6—source data 22
Raw labeled liver EMSA long exposure 2-ME Figure 6A.
- https://cdn.elifesciences.org/articles/81332/elife-81332-fig6-data22-v2.bmp
-
Figure 6—source data 23
Raw labeled liver EMSA short exposure Figure 6A.
- https://cdn.elifesciences.org/articles/81332/elife-81332-fig6-data23-v2.bmp
-
Figure 6—source data 24
Raw labeled liver EMSA short exposure 2-ME Figure 6A.
- https://cdn.elifesciences.org/articles/81332/elife-81332-fig6-data24-v2.bmp
-
Figure 6—source data 25
Raw labeled spleen EMSA short exposure Figure 6B.
- https://cdn.elifesciences.org/articles/81332/elife-81332-fig6-data25-v2.bmp
-
Figure 6—source data 26
Raw labeled spleen EMSA short exposure 2-ME Figure 6B.
- https://cdn.elifesciences.org/articles/81332/elife-81332-fig6-data26-v2.bmp
-
Figure 6—source data 27
Raw labeled spleen EMSA long exposure Figure 6B.
- https://cdn.elifesciences.org/articles/81332/elife-81332-fig6-data27-v2.bmp
-
Figure 6—source data 28
Raw labeled spleen EMSA long exposure 2-ME Figure 6B.
- https://cdn.elifesciences.org/articles/81332/elife-81332-fig6-data28-v2.bmp
-
Figure 6—source data 29
Raw labeled hepatocytes EMSA short exposure Figure 6C.
- https://cdn.elifesciences.org/articles/81332/elife-81332-fig6-data29-v2.bmp
-
Figure 6—source data 30
Raw labeled hepatocytes EMSA short exposure 2-ME Figure 6C.
- https://cdn.elifesciences.org/articles/81332/elife-81332-fig6-data30-v2.bmp
-
Figure 6—source data 31
Raw labeled hepatocytes EMSA long exposure Figure 6C.
- https://cdn.elifesciences.org/articles/81332/elife-81332-fig6-data31-v2.bmp
-
Figure 6—source data 32
Raw labeled hepatocytes EMSA long exposure 2-ME Figure 6C.
- https://cdn.elifesciences.org/articles/81332/elife-81332-fig6-data32-v2.bmp
-
Figure 6—source data 33
Raw labeled non-parenchymal cells EMSA short exposure Figure 6D.
- https://cdn.elifesciences.org/articles/81332/elife-81332-fig6-data33-v2.bmp
-
Figure 6—source data 34
Raw labeled non-parenchymal cells EMSA short exposure 2-ME Figure 6D.
- https://cdn.elifesciences.org/articles/81332/elife-81332-fig6-data34-v2.bmp
-
Figure 6—source data 35
Raw labeled non-parenchymal cells EMSA long exposure Figure 6D.
- https://cdn.elifesciences.org/articles/81332/elife-81332-fig6-data35-v2.bmp
-
Figure 6—source data 36
Raw labeled non-parenchymal cells EMSA long exposure 2-ME Figure 6D.
- https://cdn.elifesciences.org/articles/81332/elife-81332-fig6-data36-v2.bmp
-
Figure 6—source data 37
Raw labeled Western blot ferroportin and β-actin Figure 6E.
- https://cdn.elifesciences.org/articles/81332/elife-81332-fig6-data37-v2.bmp
Figure 7
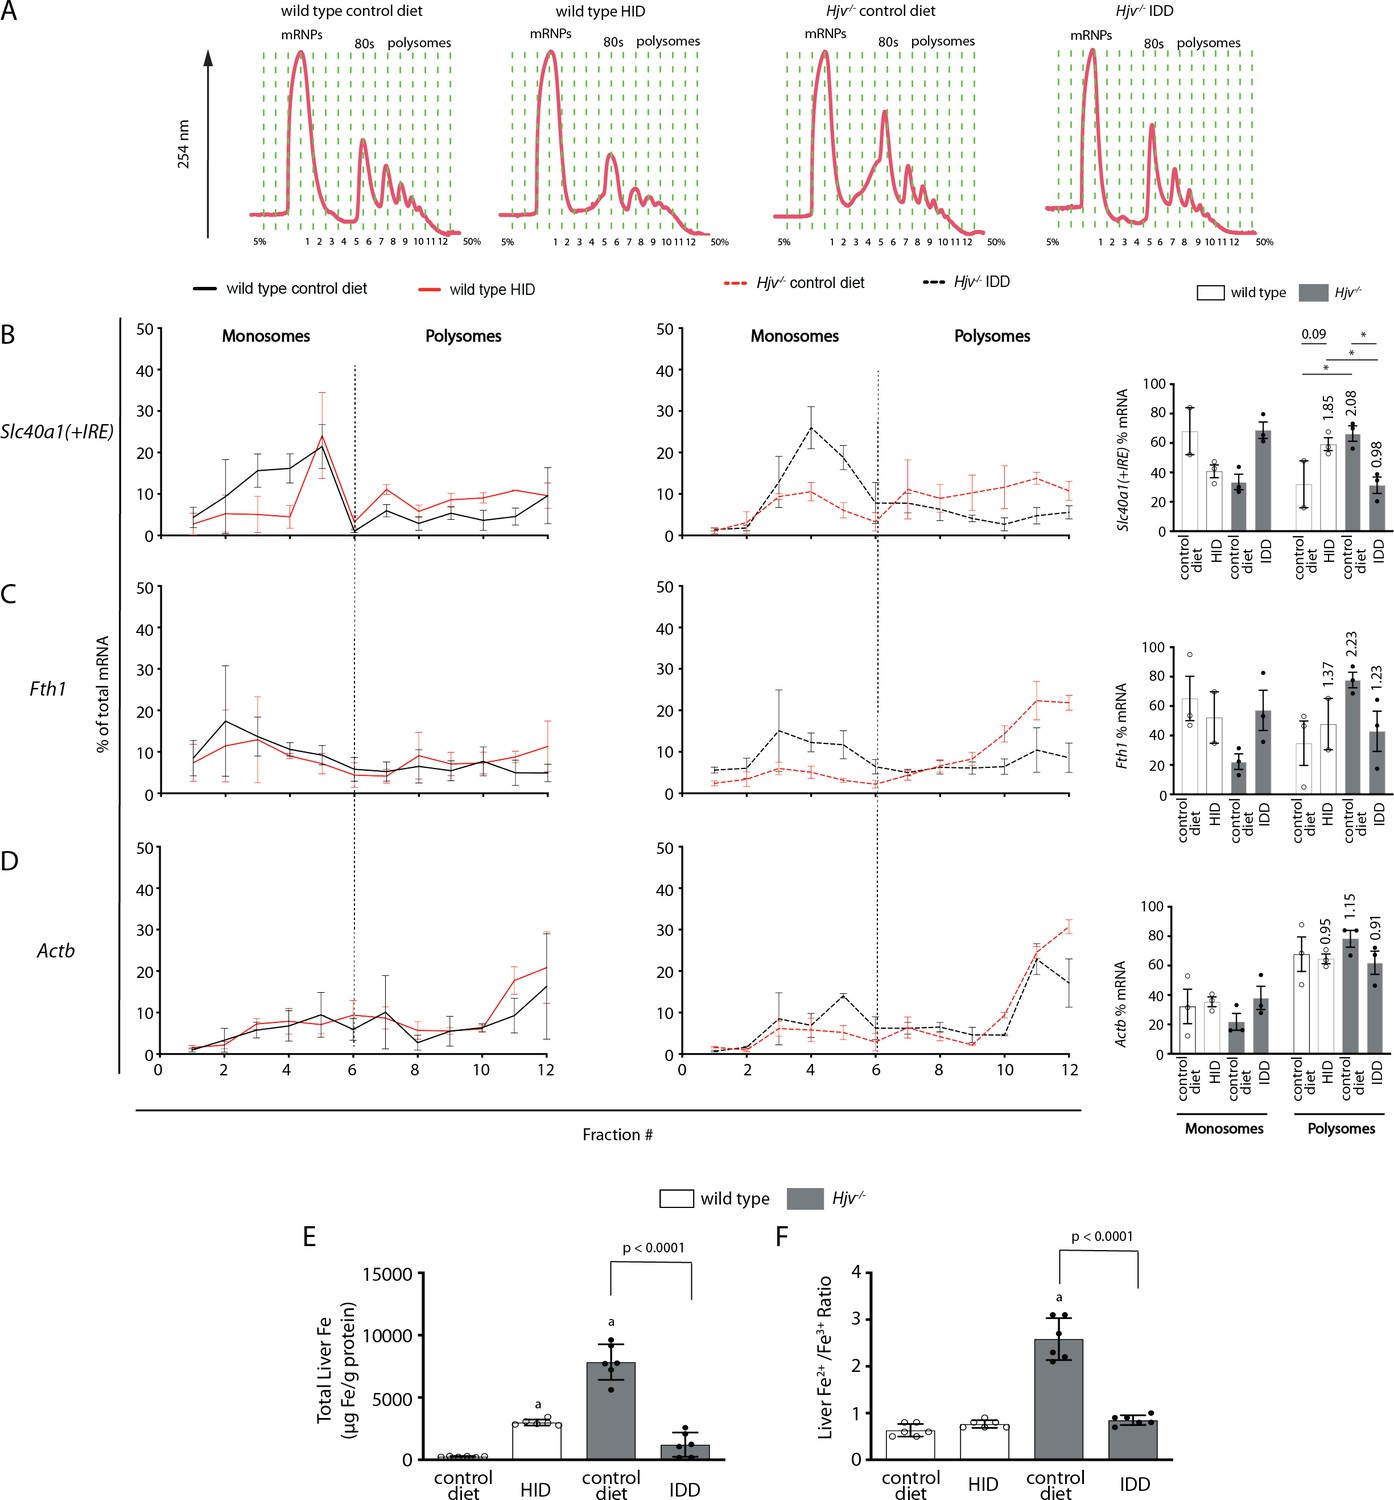
Iron regulation of Slc40a1(+IRE) mRNA translation in the mouse liver.
Four-week-old wild type male mice (n=10–14 per group) were placed on high-iron diet (HID) for 5 weeks. Conversely, age- and sex-matched isogenic Hjv-/- mice (n=10–14 per group) were placed on iron-deficient diet (IDD) for 5 weeks to prevent excessive iron overload. Other animals from both genotypes were kept on control diet. At the endpoint, the mice were sacrificed, and livers were used for polysome profile analysis and iron assays. (A) Recording of absorbance at 254 nm of representative samples. Fraction numbers and direction of the gradient are indicated. (B–D) Liver polysome profiles from n=3 mice in each experimental group. Distribution of (B) Slc40a1(+IRE), (C) Fth1 and (D) Actb mRNAs among light monosomal and heavy polysomal fractions (separated by dashed line) was analyzed by qPCR. Bar graph comparisons of pooled fractions are shown on the right. Numbers indicate the fold change compared towild type mice oncontrol diet. (E and F) Analysis of total iron (E), and redox iron speciation (F) in the liver by CE-ICP-MS. Data are presented as the mean ± SEM. Statistical analysis in (A) was performed by two-way ANOVA and in (B, C) by one-way ANOVA. Statistically significant differences (p<0.05) compared to values from wild type mice on control are indicated by a.
-
Figure 7—source data 1
Polysome raw data.
- https://cdn.elifesciences.org/articles/81332/elife-81332-fig7-data1-v2.xlsx
-
Figure 7—source data 2
Iron ratio calculations.
- https://cdn.elifesciences.org/articles/81332/elife-81332-fig7-data2-v2.xlsx
Figure 8
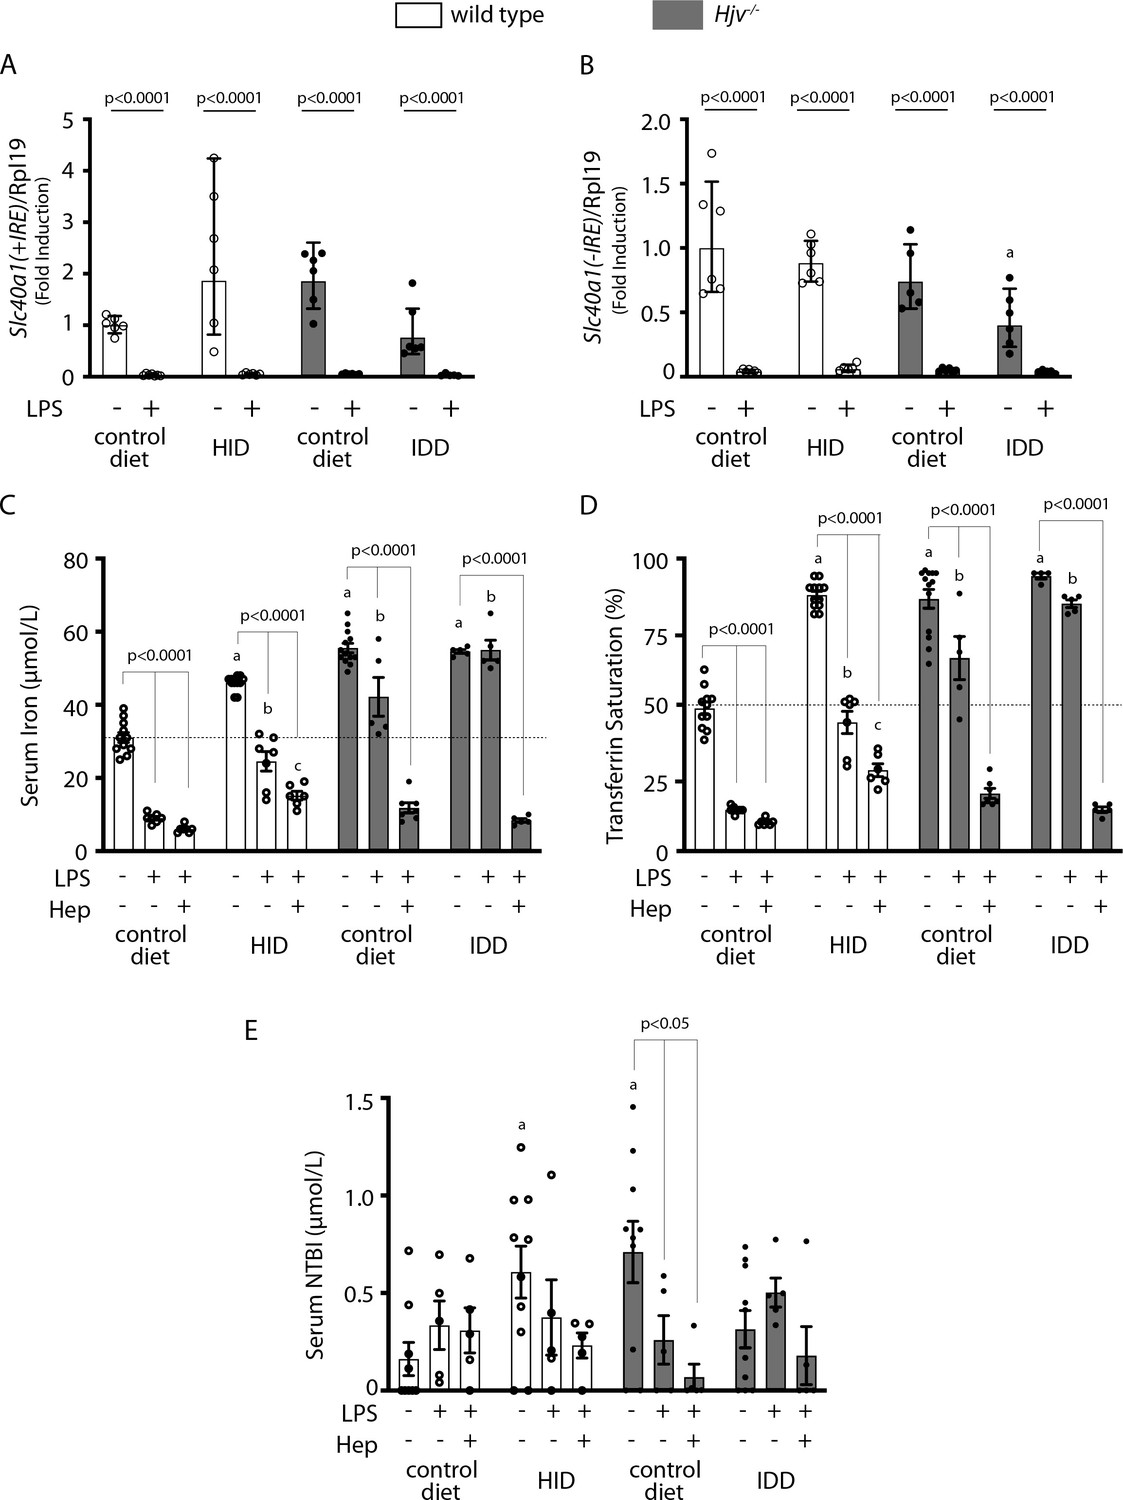
Elimination of ferroportin mRNA by prolonged LPS treatment potentiates hepcidin-induced hypoferremia in mouse models of iron overload.
Four-week-old wild type male mice (n=10–14 per group) were placed on high-iron diet (HID) for 5 weeks. Conversely, age- and sex-matched isogenic Hjv-/- mice (n=10–14 per group) were placed on iron-deficient diet (IDD) for 5 weeks to prevent excessive iron overload. Other animals from both genotypes were kept on control diet. (A and B) Half of the mice were injected with saline and the other half with 1 µg/g LPS and sacrificed after 8 hr. Livers were dissected and processed for qPCR analysis of Slc40a1(+IRE) (A) and Slc40a1(-IRE) (B) mRNAs. (C–E) All mice were injected with 1 µg/g LPS. Half of the animals were subsequently injected with saline, and the other half with 2.5 µg/g synthetic hepcidin every 2 hr for a total of 4 injections. At the endpoint the mice were sacrificed. Sera were collected by cardiac puncture and analyzed for: (C) iron, (D) transferrin saturation, and (E) non-transferrin bound iron (NTBI). The dotted line in (C) and (D) indicates baseline serum iron and transferrin saturation, respectively, of wild type mice on control diet. Data are presented as (A–B) geometric mean ± SD or (C–E) mean ± SEM. Statistically significant differences (p<0.05) compared to values from saline-, LPS- or hepcidin-treated wild type mice on control diet are indicated by a, b or c, respectively.
-
Figure 8—source data 1
qPCR data.
- https://cdn.elifesciences.org/articles/81332/elife-81332-fig8-data1-v2.xlsx
-
Figure 8—source data 2
Serum NTBI calculations.
- https://cdn.elifesciences.org/articles/81332/elife-81332-fig8-data2-v2.xlsx
-
Figure 8—source data 3
Serum iron and transferrin saturation values.
- https://cdn.elifesciences.org/articles/81332/elife-81332-fig8-data3-v2.xlsx
Additional files
-
MDAR checklist
- https://cdn.elifesciences.org/articles/81332/elife-81332-mdarchecklist1-v2.docx
-
Supplementary file 1
List of primers used for qPCR.
- https://cdn.elifesciences.org/articles/81332/elife-81332-supp1-v2.xlsx
Download links
A two-part list of links to download the article, or parts of the article, in various formats.
Downloads (link to download the article as PDF)
Open citations (links to open the citations from this article in various online reference manager services)
Cite this article (links to download the citations from this article in formats compatible with various reference manager tools)
A crosstalk between hepcidin and IRE/IRP pathways controls ferroportin expression and determines serum iron levels in mice
eLife 11:e81332.
https://doi.org/10.7554/eLife.81332


