Transcriptional drifts associated with environmental changes in endothelial cells
- Department of Obstetrics and Gynecology, University of California, Los Angeles, United States
- Molecular Biology Institute, University of California, Los Angeles, United States
- Department of Molecular, Cell, and Developmental Biology, University of California, Los Angeles, United States
- Department of Molecular, Cellular and Integrative Physiology, University of California, Los Angeles, United States
- Department of Cell and Developmental Biology, Northwestern University Feinberg School of Medicine, United States
- Departament of Cell and Developmental Biology, Institute of Biomedical Science, University of Sao Paulo, United States
- Department of Biological Chemistry, University of California, United States
- Human Molecular Genetics, de Duve Institute, University of Louvain, Belgium
- Department of Pathology and Laboratory Medicine, University of California, United States
- Department of Cellular and Molecular Medicine, University of Arizona, United States
- WELBIO department, WEL Research Institute, Belgium
Figures
Figure 1 with 2 supplements
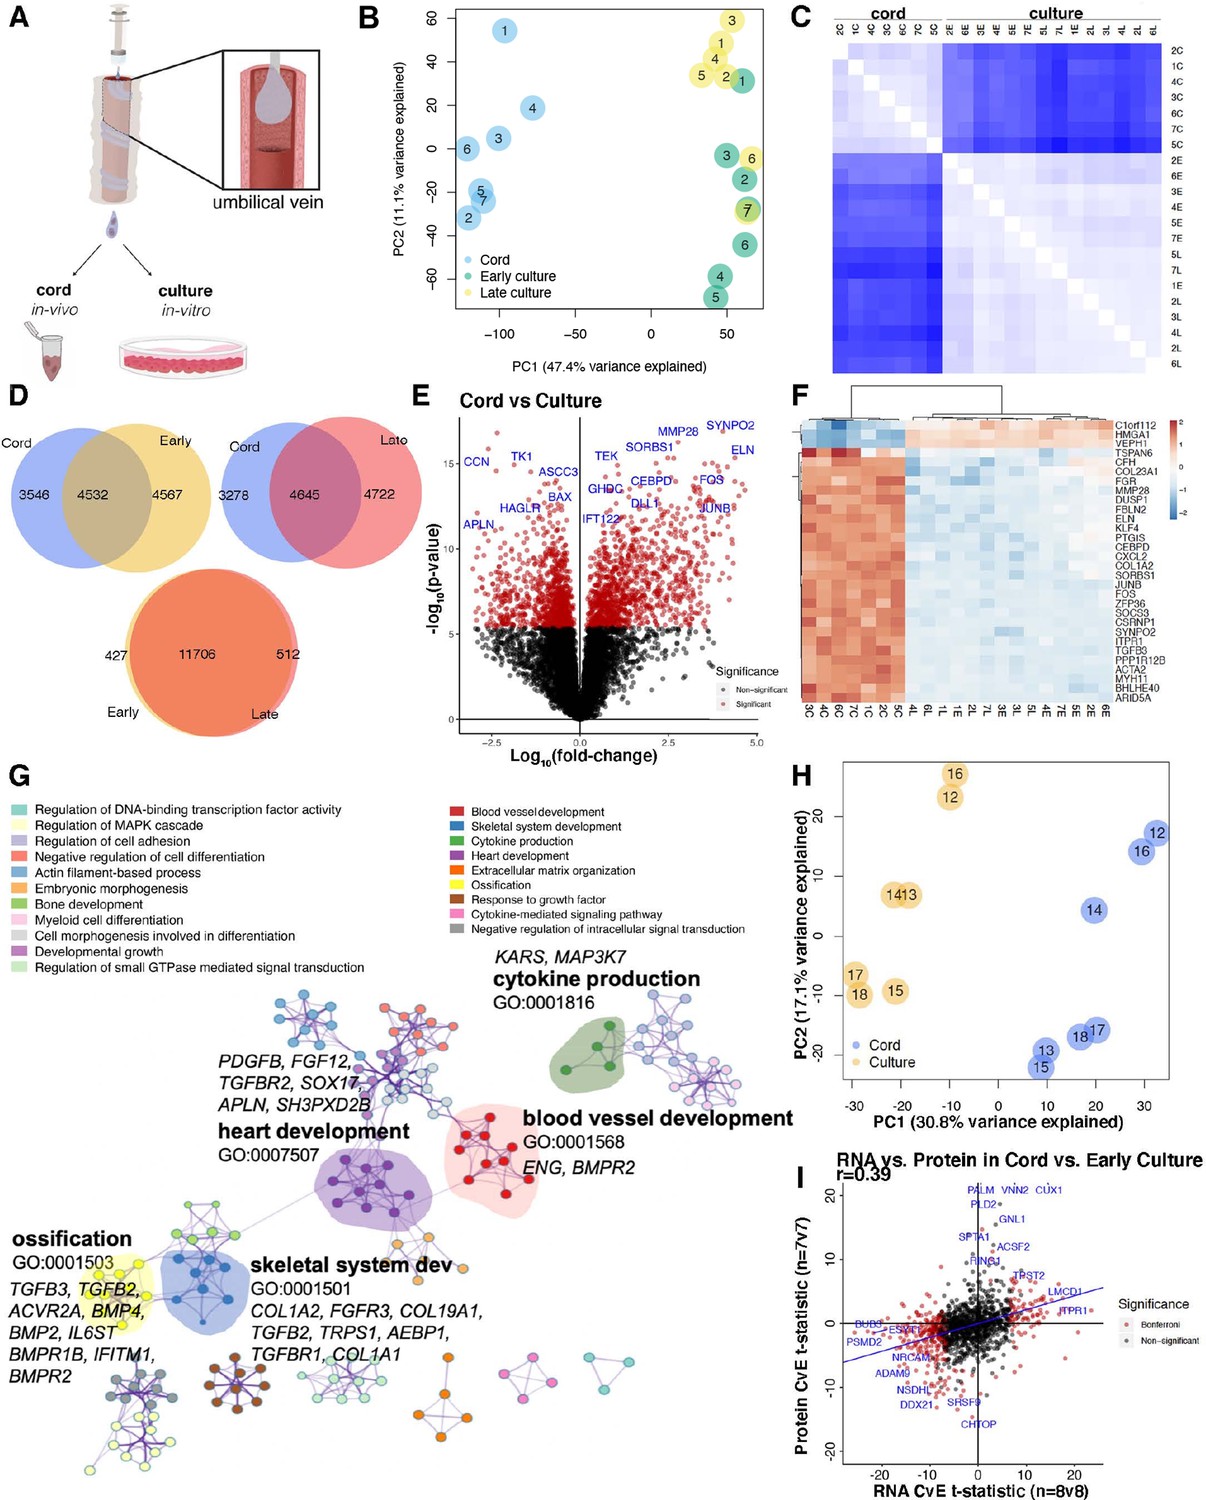
Human umbilical cord endothelial cell transcriptome.
(A) Model of endothelial cell collection for in vivo (cord) and in vitro (culture) experiments. Endothelial cells are isolated in a slurry and used immediately for downstream experiments or cultured for subsequent passages. (B) Principal component analysis (PCA) of transcriptome of the seven matched cord, early culture, and late culture samples with significant separation along PC1. (C) Spearman correlation demonstrating inter-condition (cord = C, early passage = E, late passage = L) and intra-sample variability with k-means clustering by cord. (D) 40–45% of the of the expressed genes overlapped in relative expression patterns between cord and culture regardless of early and late cultures. While early and late cultures overlap in 93% of the genes. (E) Volcano plot of genes most significantly expressed in cord (right) versus culture (left) by log10 fold change. (F) Heatmap of top 30 differentially expressed genes in 21 samples from 7 individuals expressed between cord and culture. (G) Network profile of subset of Gene Expression Omnibus (GEOs) significant in cord versus culture. GEO is represented by cluster identity and each term is represented as circle node visualized on Metascape. The highlighted GEOs are the most significant pathways by p value. (H) Mass spectrometry proteomic profile of seven matched cord and culture separated by cord and culture on PC1. (I) Scatter plot depicting RNA t-statistics (cord/culture) versus protein t-statistics (cord/culture) with a correlation coefficient of r = 0.4.
Figure 1—figure supplement 1
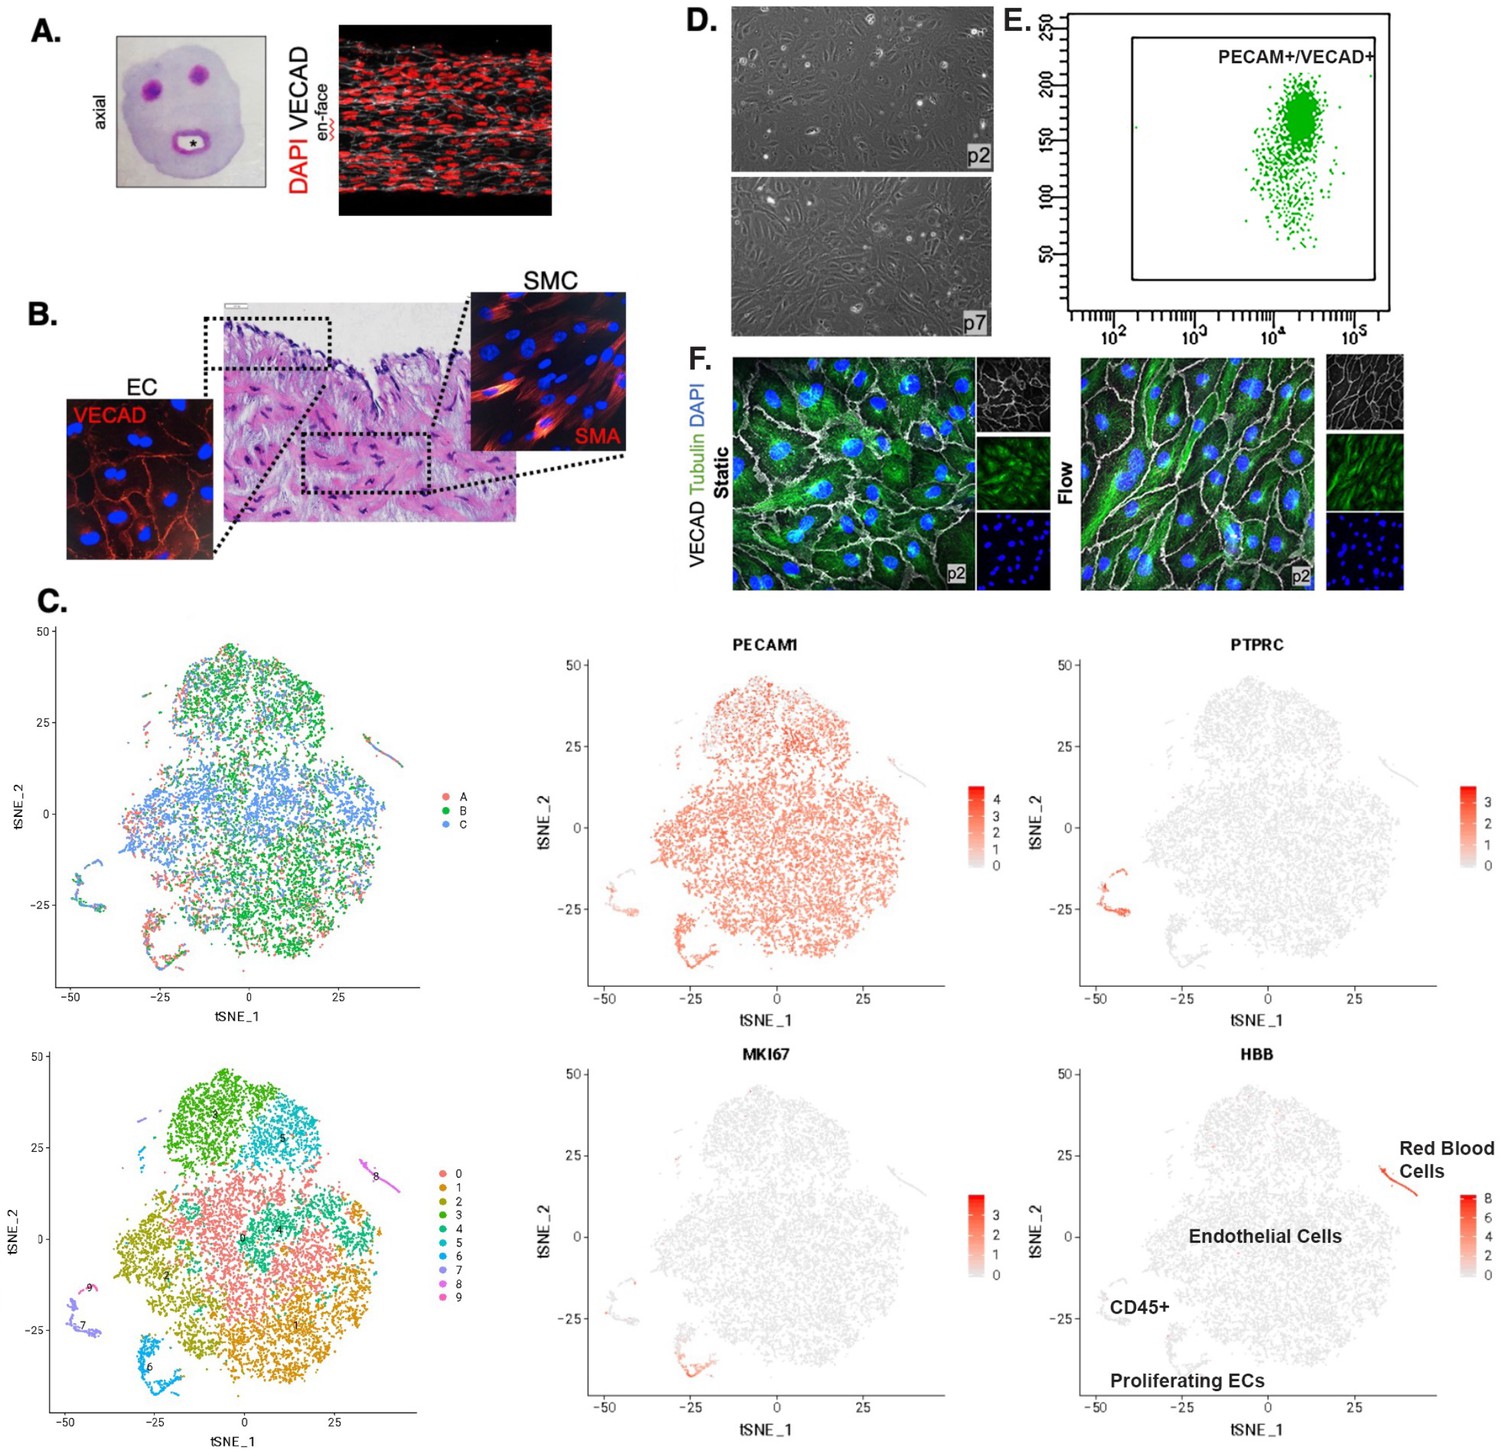
Endothelial cell isolation.
(A) Left. Hematoxylin and eosin (H&E) stain of an axial section of an umbilical cord depicting two umbilical arteries and a large umbilical vein (*). Right. En-face staining of endothelial cells of the umbilical vein with DAPI and CHD5. (B) Middle. H&E of umbilical cord with endothelial cells (EC) lining the inner surface and smooth muscle cells (SMCs) below. Staining for CDH5 in EC and smooth muscle actin (SMA) in SMCs both in red. (C) tSNE plot from three participants (A, B, C) demonstrating 10 clusters (0–9) nearly all PECAM1 positive, PTPRC/CD45 negative, with rare red blood cells (RBCs). (D) Phase-contrast images of cells at different passages (p) 2 and 7. (E) Flow cytometry demonstrates isolated cord cells are PECAM+. (F) Immunofluorescence staining at ×40 under static and flow conditions for the same participants stained for CDH5, Tubulin, and DAPI.
Figure 1—figure supplement 2
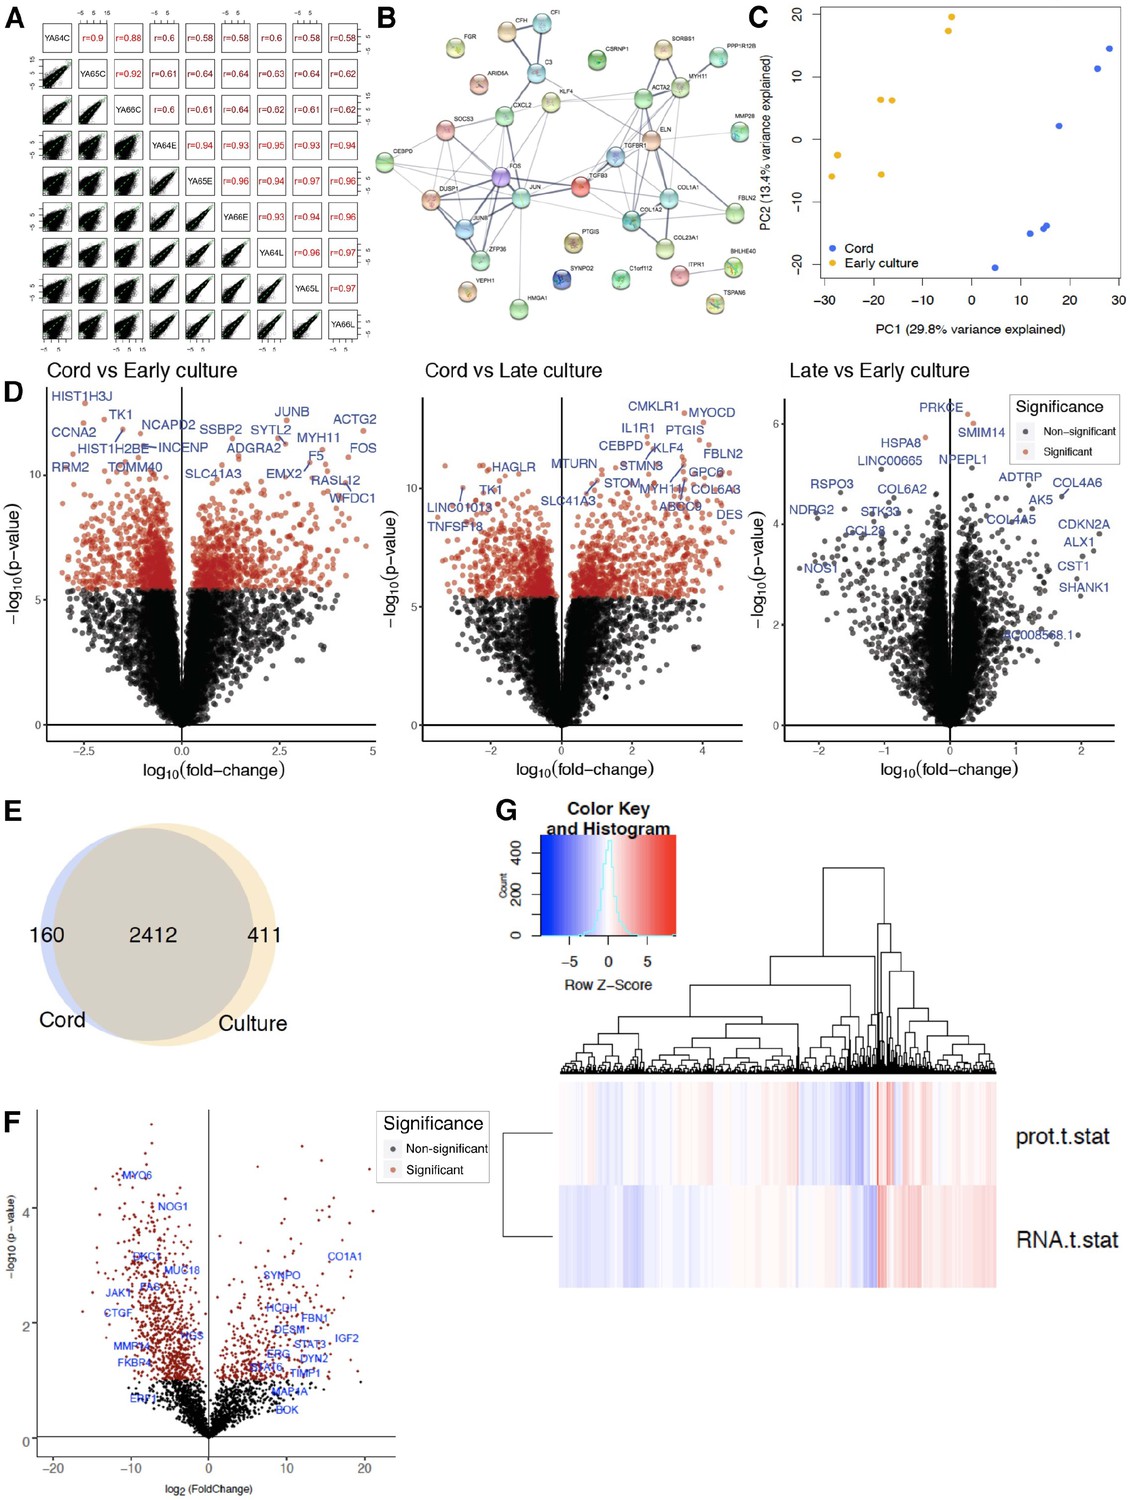
RNAseq cord versus culture.
(A) Assessment of inter- and intra-participant variability with transcriptomic correlation of coefficient between and within culture treatment. (B) Network analysis for cord versus culture depicted as protein connectivity. Each node network is assigned a unique color. Gene Ontology (GO) enrichment analysis was applied to each network to assign ‘meanings’ to the network component. (C) Principal component analysis (PCA) of cord versus early culture with 29.8% variance along PC1. (D) Volcano plot of statistical significance against fold change between cord and static culture (early and late) as well as early versus late culture demonstrating the most significantly differentially expressed genes. (E) Venn diagram of protein change seen by liquid chromatography–mass spectrometry (LC–MS) in cord versus culture and overlap. (F) Volcano plot of protein signature seen in cord versus cultured endothelial cells where significance is demonstrated in red with select proteins highlighted. (G) Heatmap correlating the t-statistics for protein versus RNA changes in cord versus culture in dataset. Red is upregulated protein or gene whereas blue is downregulated.
Figure 2 with 2 supplements
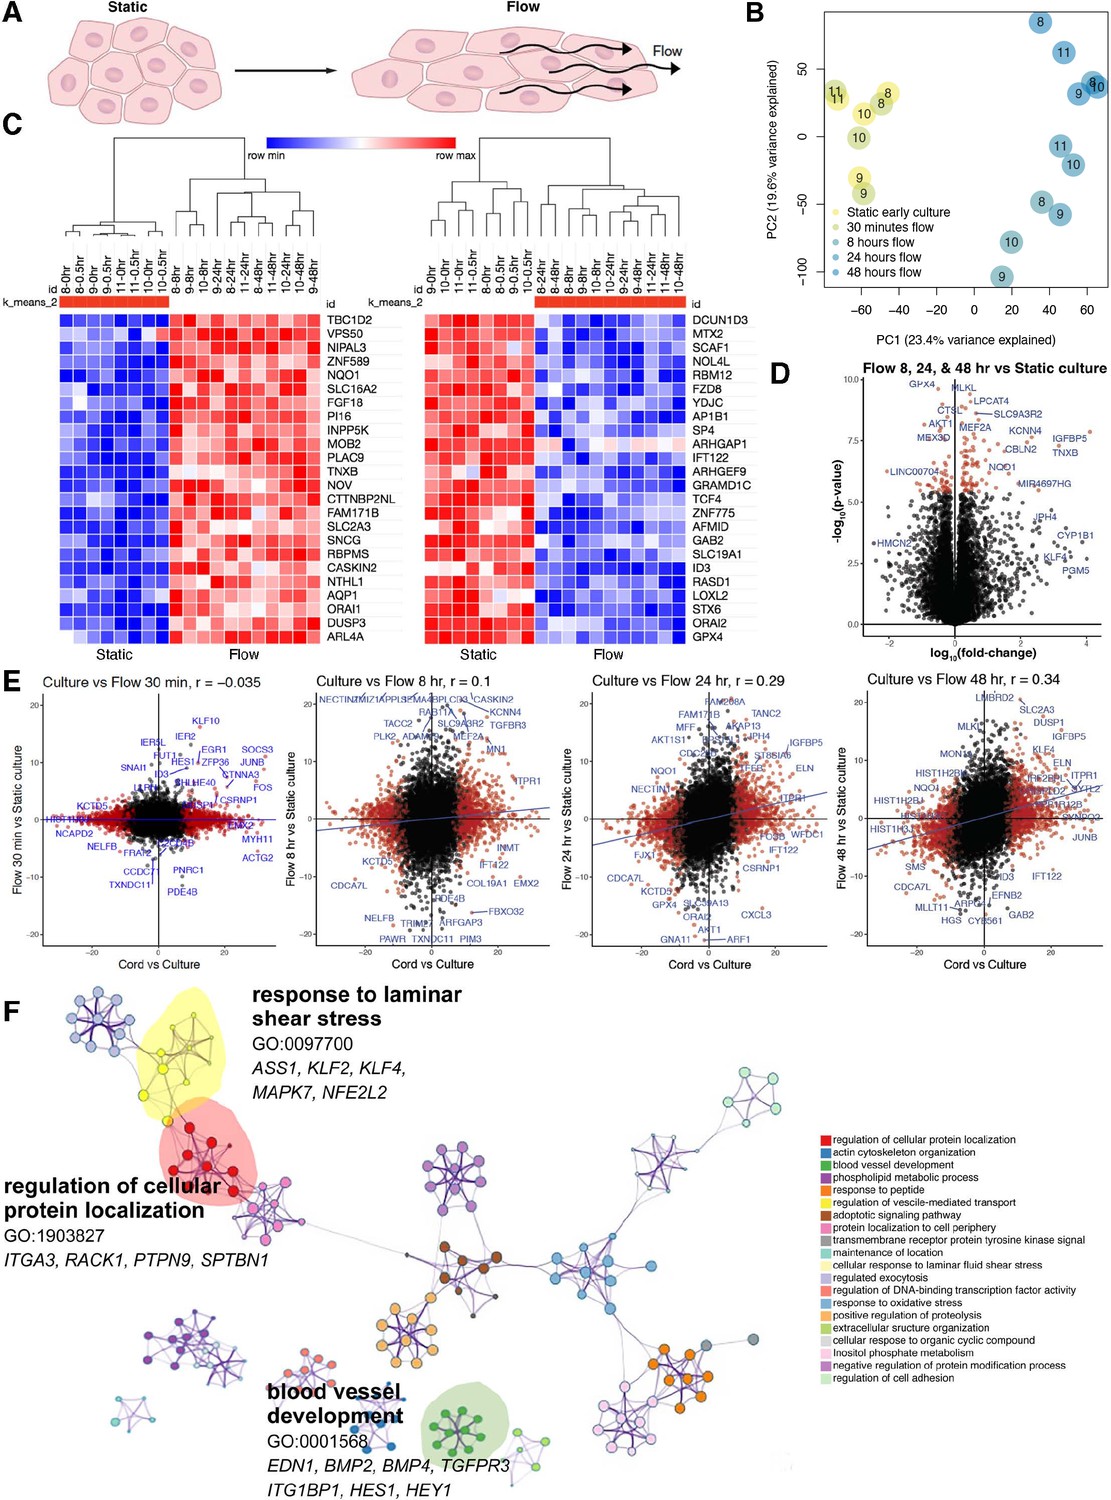
Shear stress induces a time-dependent transcriptomic flow signature.
(A) Phenotype of in vitro flow model induces endothelial cellular shape changes under flow. (B) Principal component analysis (PCA) of each sample under static (yellow) and flow-conditioned endothelial cells by bulk RNA sequencing (RNAseq; blue). (C) Heatmap of differentially expressed genes (DEGs) by bulk RNAseq in static and flow-conditioned cells. Row z-score reflects the gene expression change. (D) Volcano plot illustrating statistical significance versus fold change between flow and static cultures demonstrating the most significantly differentially expressed genes. (E) Time-dependent volcano plot and correlation coefficient highlighting the correlation of flow time to cord transcriptome where longer flow correlates more strongly to cord (in vivo) transcriptome. (F) Network profile of subset of GEOs significant in flow versus static culture. GEO is represented by cluster identity and each term is represented as circle node visualized with Metascape.
Figure 2—figure supplement 1
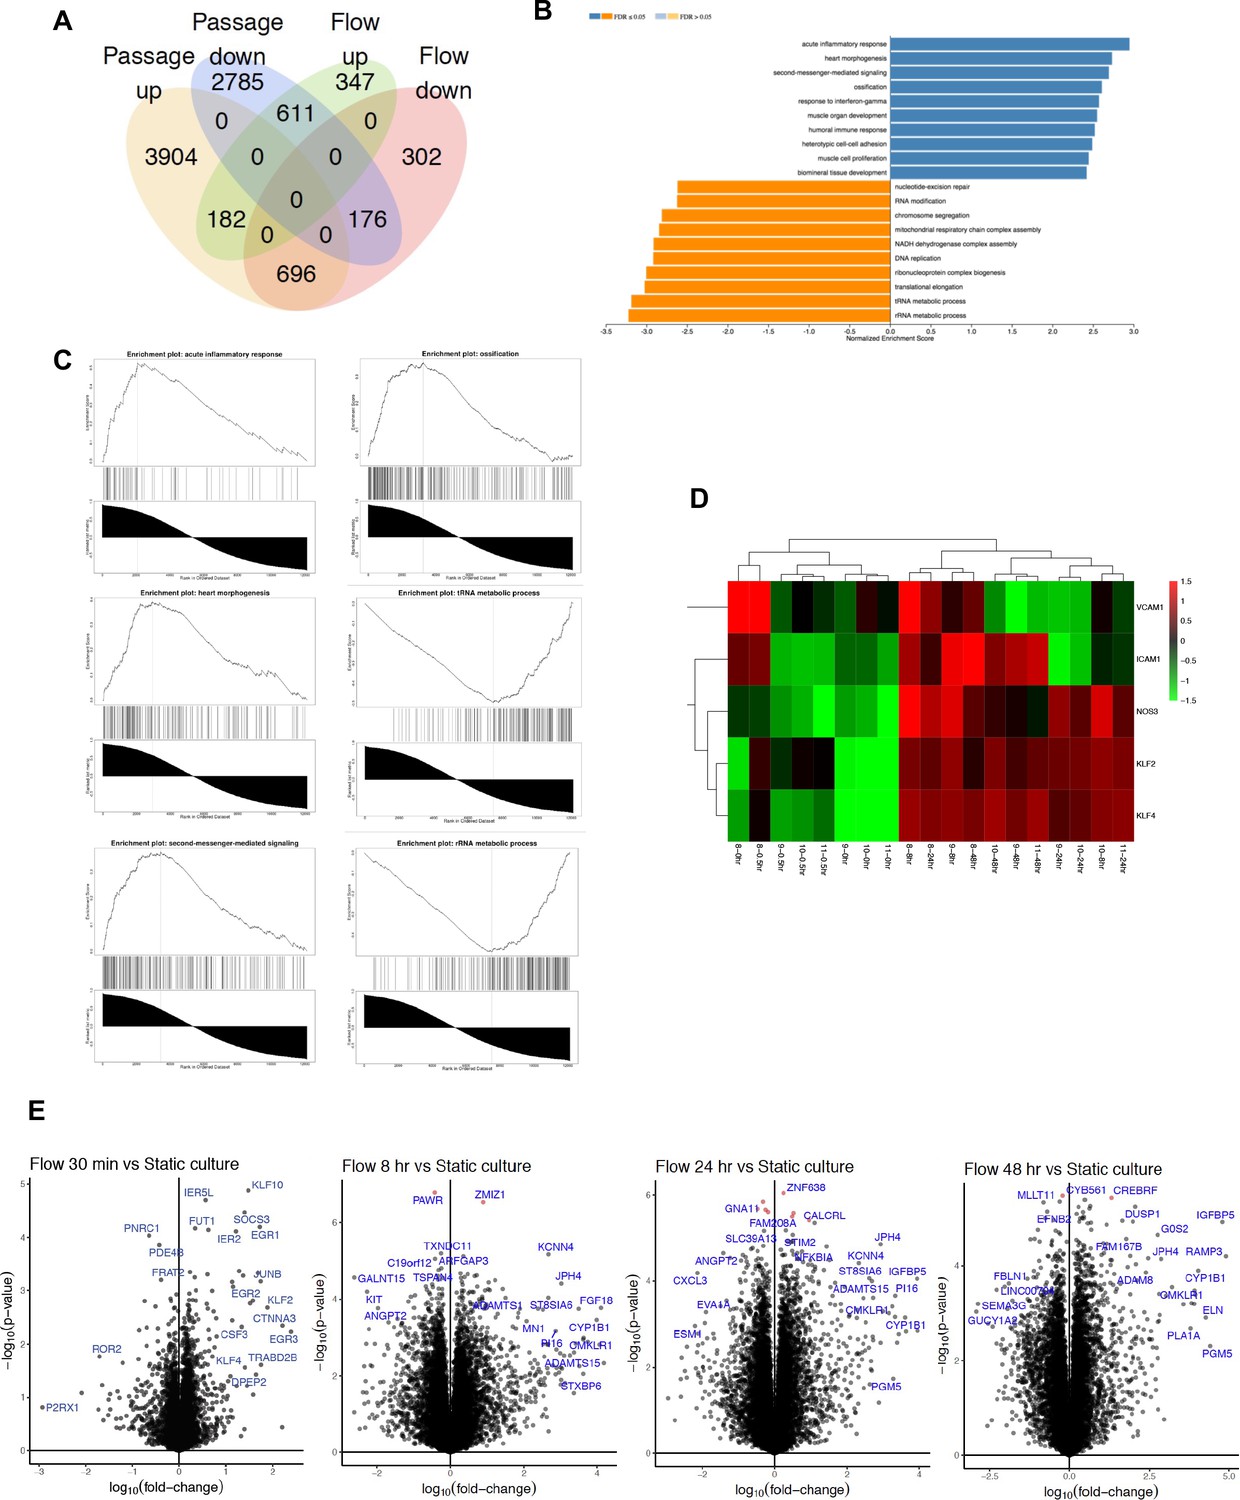
RNAseq flow versus no-flow.
(A) Venn diagram depicting differentially expressed gene number by condition and directionality of change. (B, C) Gene set enrichment analysis of differential genes in cultured endothelial cells under flow (versus static) revealed gene annotations related to an acute inflammatory response, heart morphogenesis, second messenger-mediated signaling, and ossifications. We also found tRNA and rRNA metabolic processes were attenuated under flow. (D) Heatmap compares well-known flow-responsive genes (NOS3, VCAM1, ICAM1, KLF2, KLF4) identified by this dataset. There is a clear increase in known flow-responsive genes, consistent with what has been shown in the literature. (E) Volcano plot of flow response genes over time (0.5, 8, 24, and 48 hr) between static culture and flow demonstrating the most significantly differentially expressed genes.
Figure 2—figure supplement 2
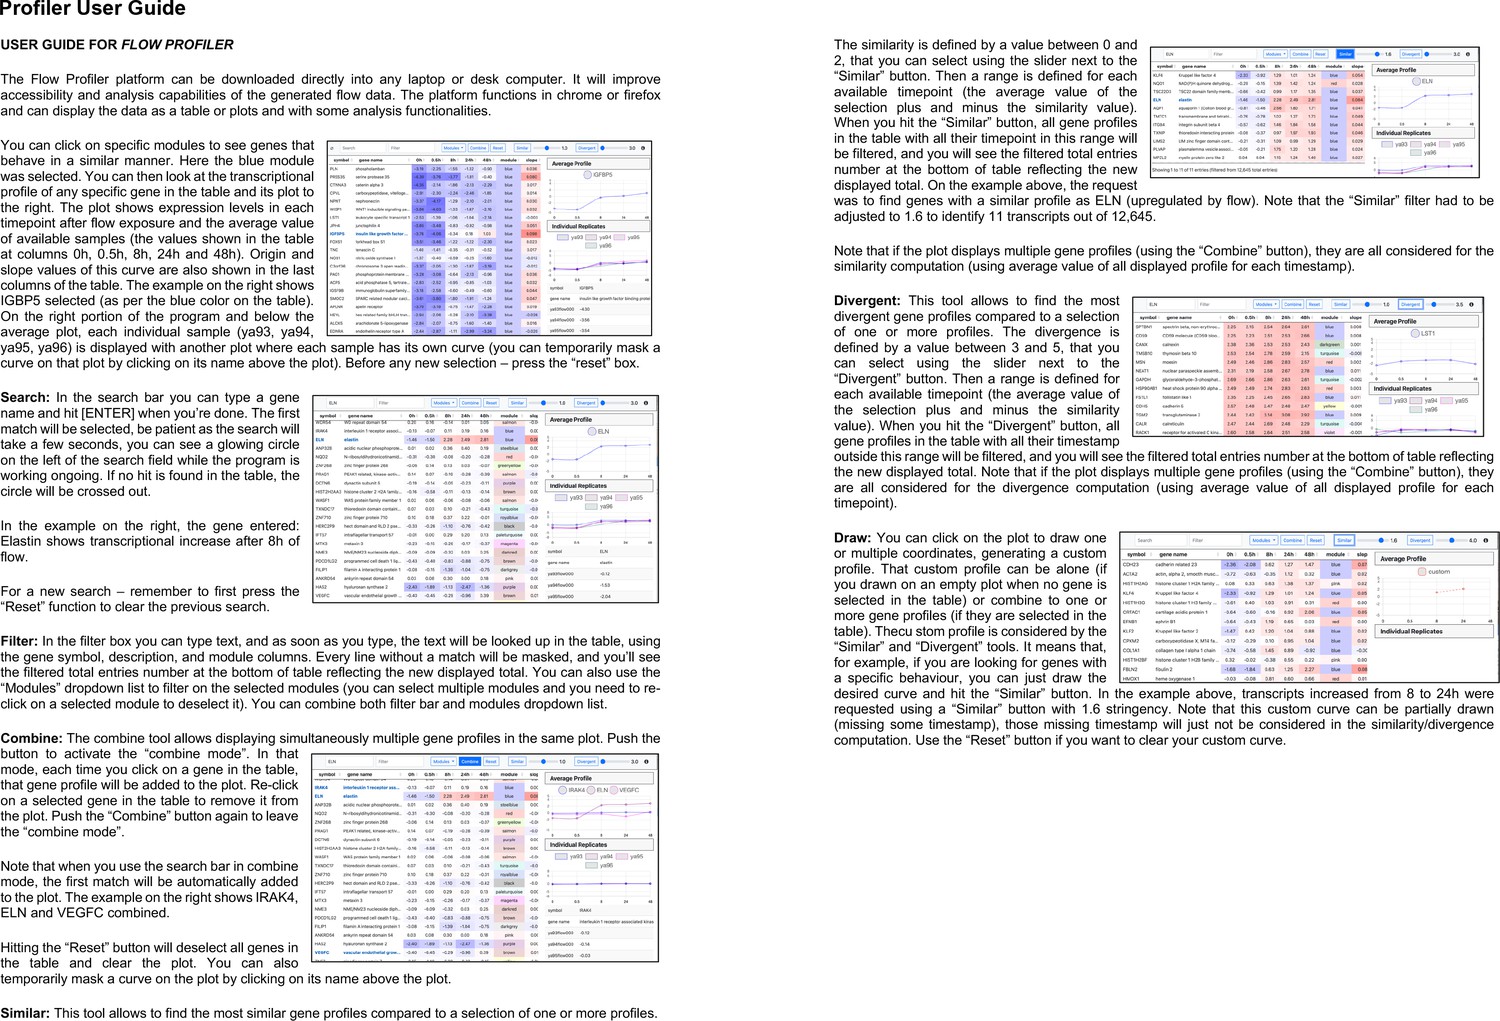
Operation manual and explanatory information for the Flow Profiler.
-
Figure 2—figure supplement 2—source data 1
Flow profiler application.
- https://cdn.elifesciences.org/articles/81370/elife-81370-fig2-figsupp2-data1-v3.zip
Figure 3 with 1 supplement
Flow rescues a degree of the cord transcriptome.
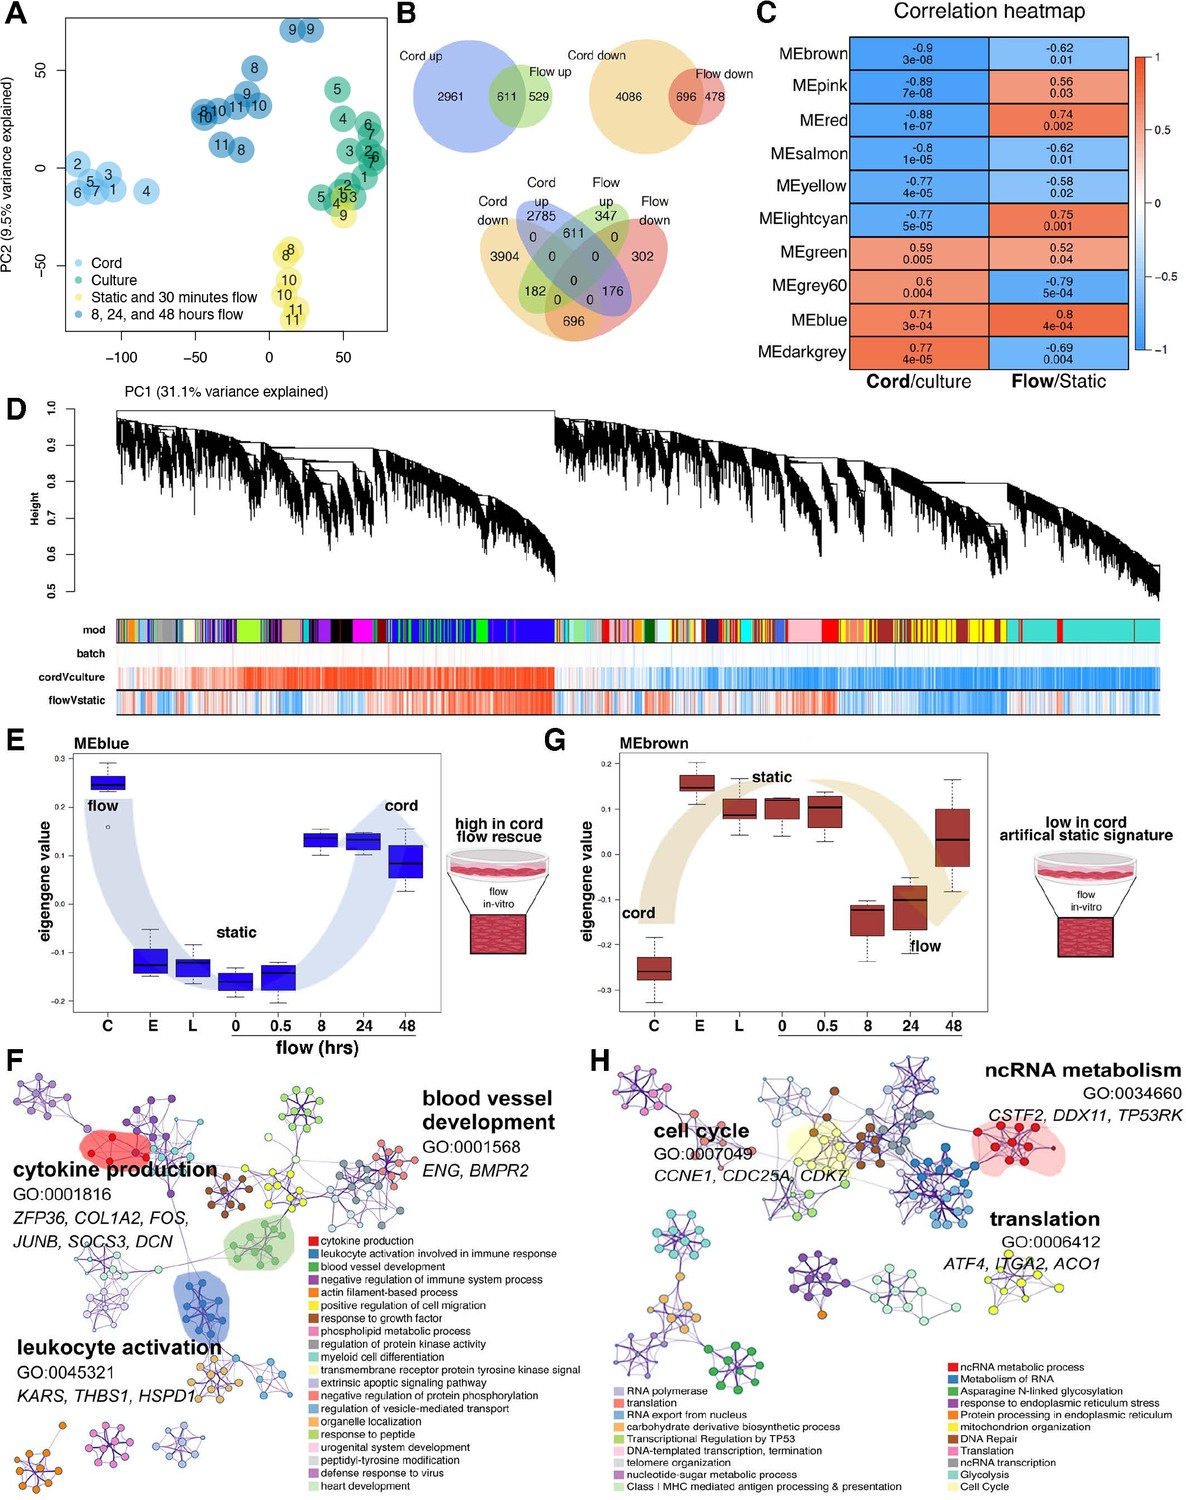
(A) Principal component analysis (PCA) demonstrates stark differences in cord (in vivo) versus culture (in vitro) along PC1. Flow rescues the transcript from the culture toward the cord along PC1. Based on the transcriptional similarity of the different flow time points (Figure 2B) we consolidated the ‘under flow’ label for (A) for clarity. Based on the sample distribution on PC1 (from left to right: cord > extended flow > early culture + short-term flow > culture) and its magnitude (31% of the covariance in the dataset). PC1 primarily represents the differences between cord and culture samples (we interpret the PC2 to represent differences between short-term and extended flow). The middle position between cord and late culture is a partial rescue of the differences imparted by culture. (B) Venn diagram demonstrating the significant number of differentially expressed genes by condition and its concordant or discordant correlation to each another. (C) Correlation heatmap of top 10 module eigengenes (ME) by experimental condition, cord versus culture or flow versus static. The columns are labeled by experimental condition. The rows are labeled by the ME color. The biweight midcorrelation coefficients are shown numerically for each cell, with the significance of the correlation shown immediately below (false discovery rate, FDR). Cells are colored based on the strength and sign of the correlation. (D) Cluster dendrogram and module assignment for RNA modules from weighted gene co-expression network analysis (WGCNA). Identification of gene co-expression modules using average hierarchical linkage clustering. The vertical axis denotes the co-expression distance, and the horizontal axis corresponds to genes. Dynamic tree cutting was applied to identify modules by dividing the dendrogram at significant branch points. Modules are displayed with different colors in the horizontal bar immediately below the dendrogram, with gray representing unassigned genes. Correlation coefficients with experimental conditions are also represented based on strength and direction (negative correlations to positive correlations ranging from blue to red). (E, F) Eigengene value of flow-dependent rescue of the blue module; C = cord, E = early, L = late and enriched blue-module GEO. (G, H) Eigengene value of flow-dependent rescue of the brown module and enriched GEO.
Figure 3—figure supplement 1
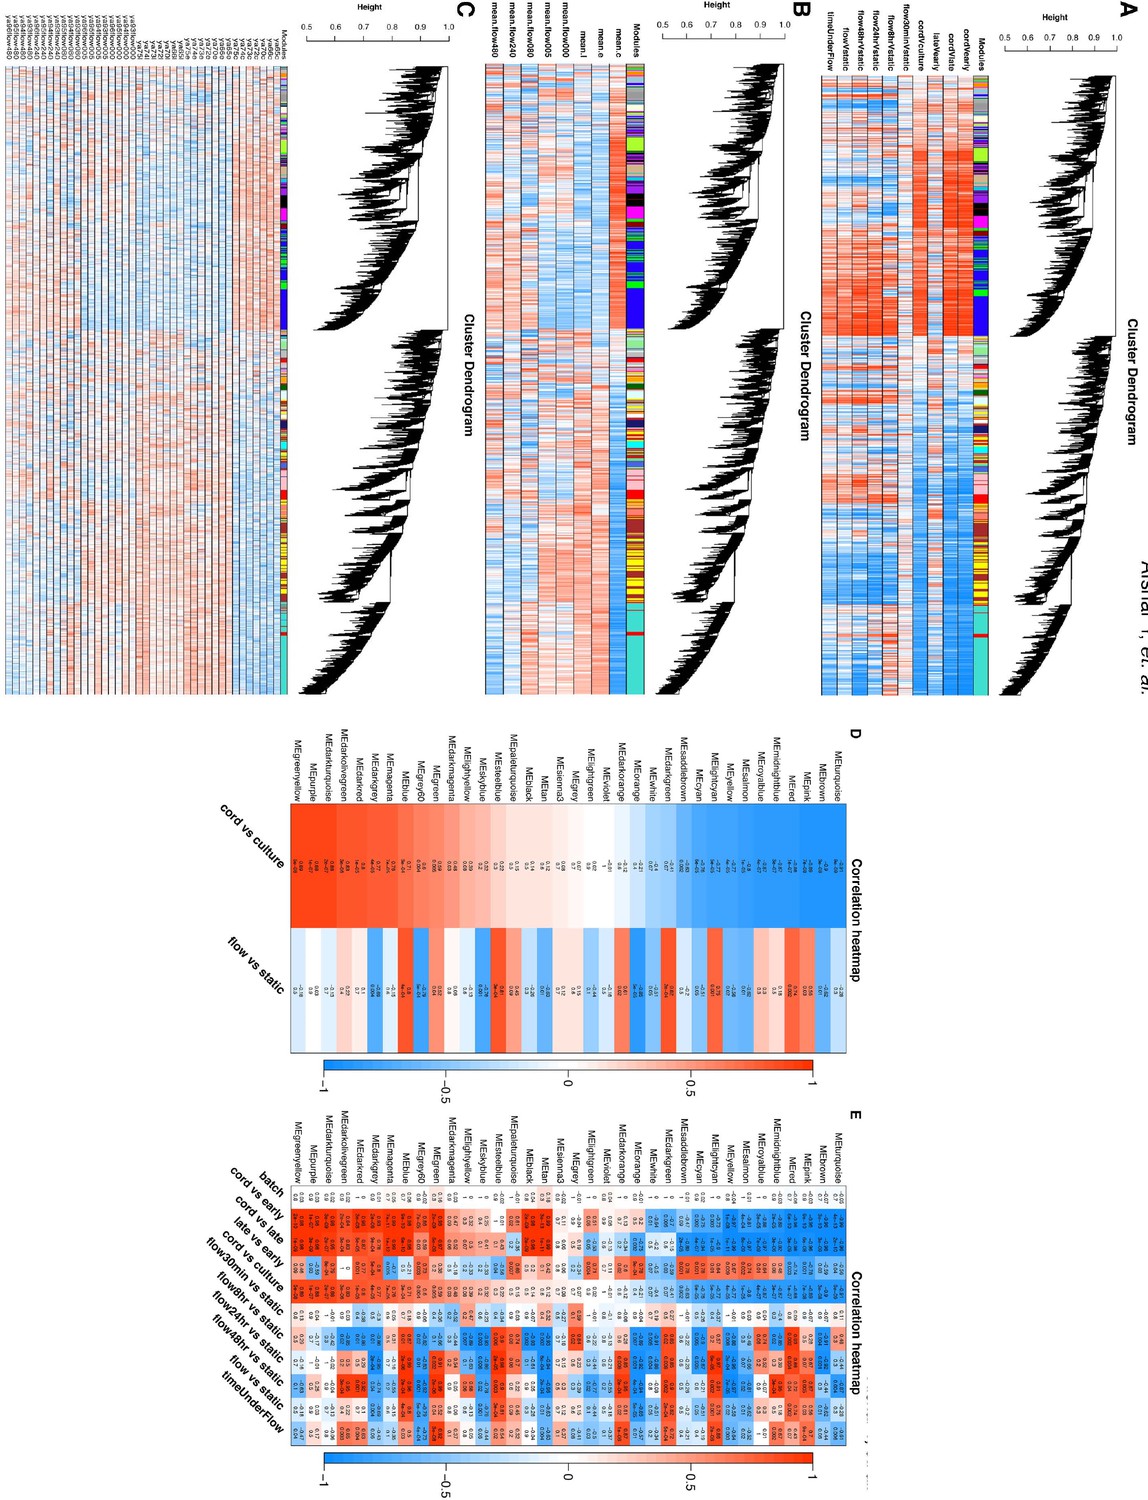
Detailed Weighted Correlation Network Analysis (WGCNA) analysis by condition and sample.
(A–C) Cluster dendrogram and module assignment for RNA modules from weighted gene co-expression network analysis (WGCNA). Identification of gene co-expression modules using average hierarchical linkage clustering. The vertical axis denotes the co-expression distance, and the horizontal axis corresponds to genes. Dynamic tree cutting is applied to identify modules by dividing the dendrogram at significant branch points. Modules are displayed with different colors in the horizontal bar immediately below the dendrogram, with gray representing unassigned genes. Correlation coefficients with experimental conditions are also represented based on strength and direction (negative correlations to positive correlations ranging from blue to red). (A) is specific for cord, culture, and flow, (B) by time under flow, and (C) is by participant level. (D) Eigengene value of flow-dependent rescue of the blue module; C = cord, E = early, L = late and enriched blue-module GEO. (E) Eigengene value of condition and flow-dependent rescue of the blue module.
Figure 4
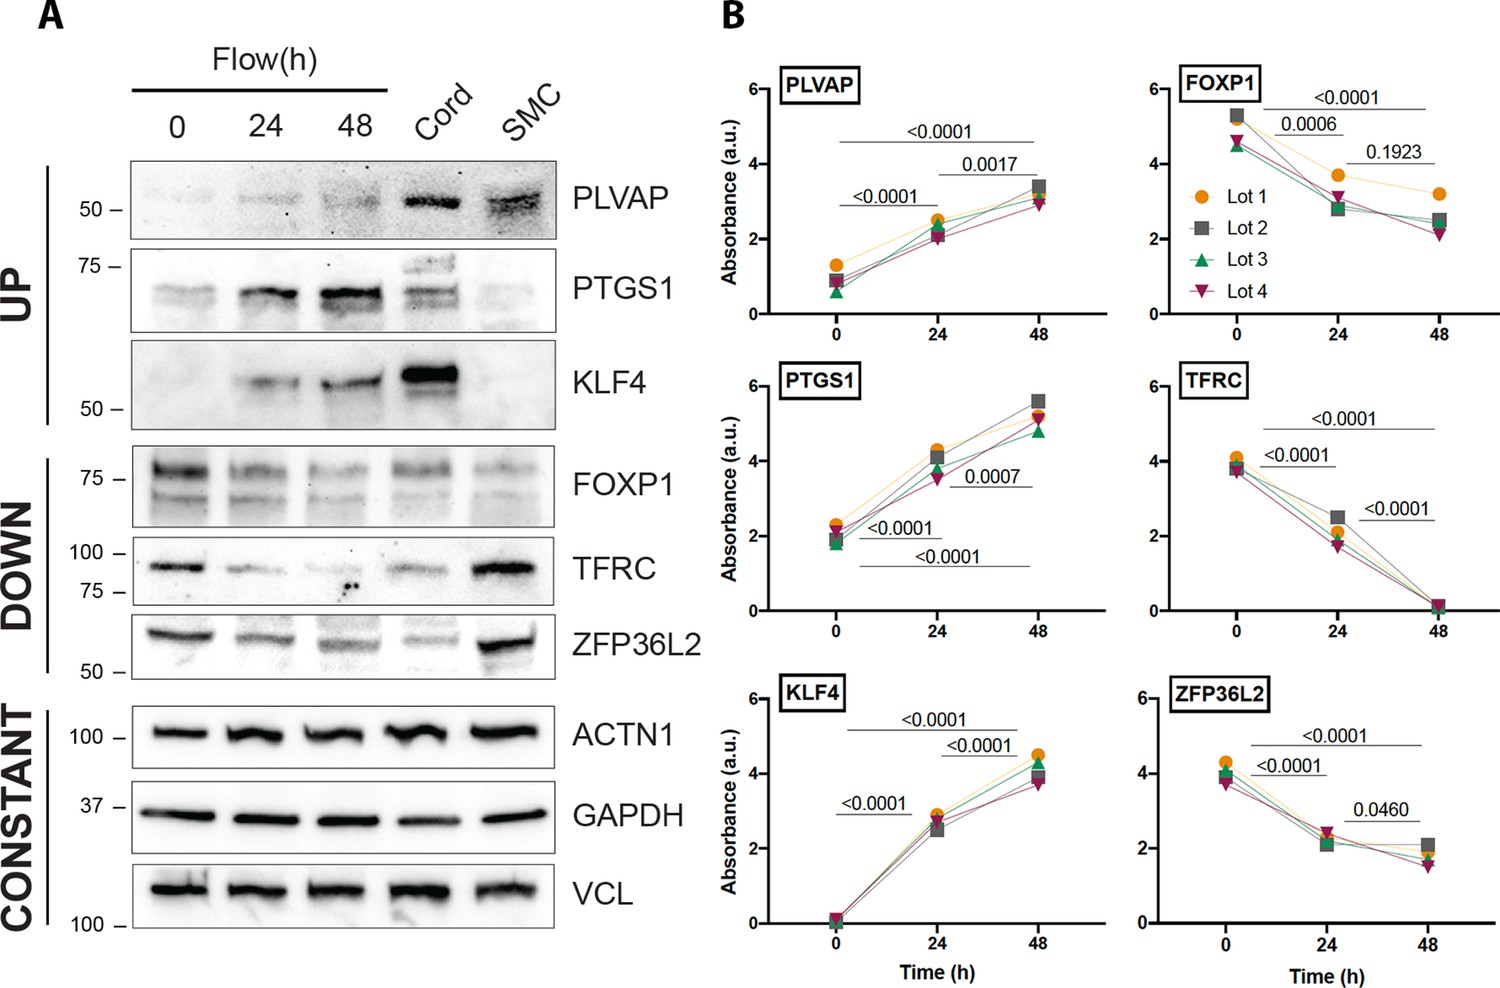
Protein validation of transcripts affected by flow.
(A) Western blot analysis of three examples of transcripts that are regulated by flow in a concordant manner (upregulated, downregulated, and unchanged) in relation to cord isolated lysates. Uncropped data are shown in Figure 4—source data 1. (B) Quantification of the same genes using three independent biological replicates. Each color represents an independent experiment. Numbers show p value of analysis of variance (ANOVA) between the time points.
-
Figure 4—source data 1
Source file depicting uncropped western blot analysis from Figure 4 (novel genes affected by flow).
On the left are six blots with the protein of interest and molecular weight of anticipated protein on the Y-axis with both colorimetric overlay and chemiluminescence image. The protein of interest is squared in red. If the blot had an additional second or third antibody probe it is depicted serially in a column with the protein of interest and molecular weight as marked.
- https://cdn.elifesciences.org/articles/81370/elife-81370-fig4-data1-v3.zip
Figure 5 with 1 supplement
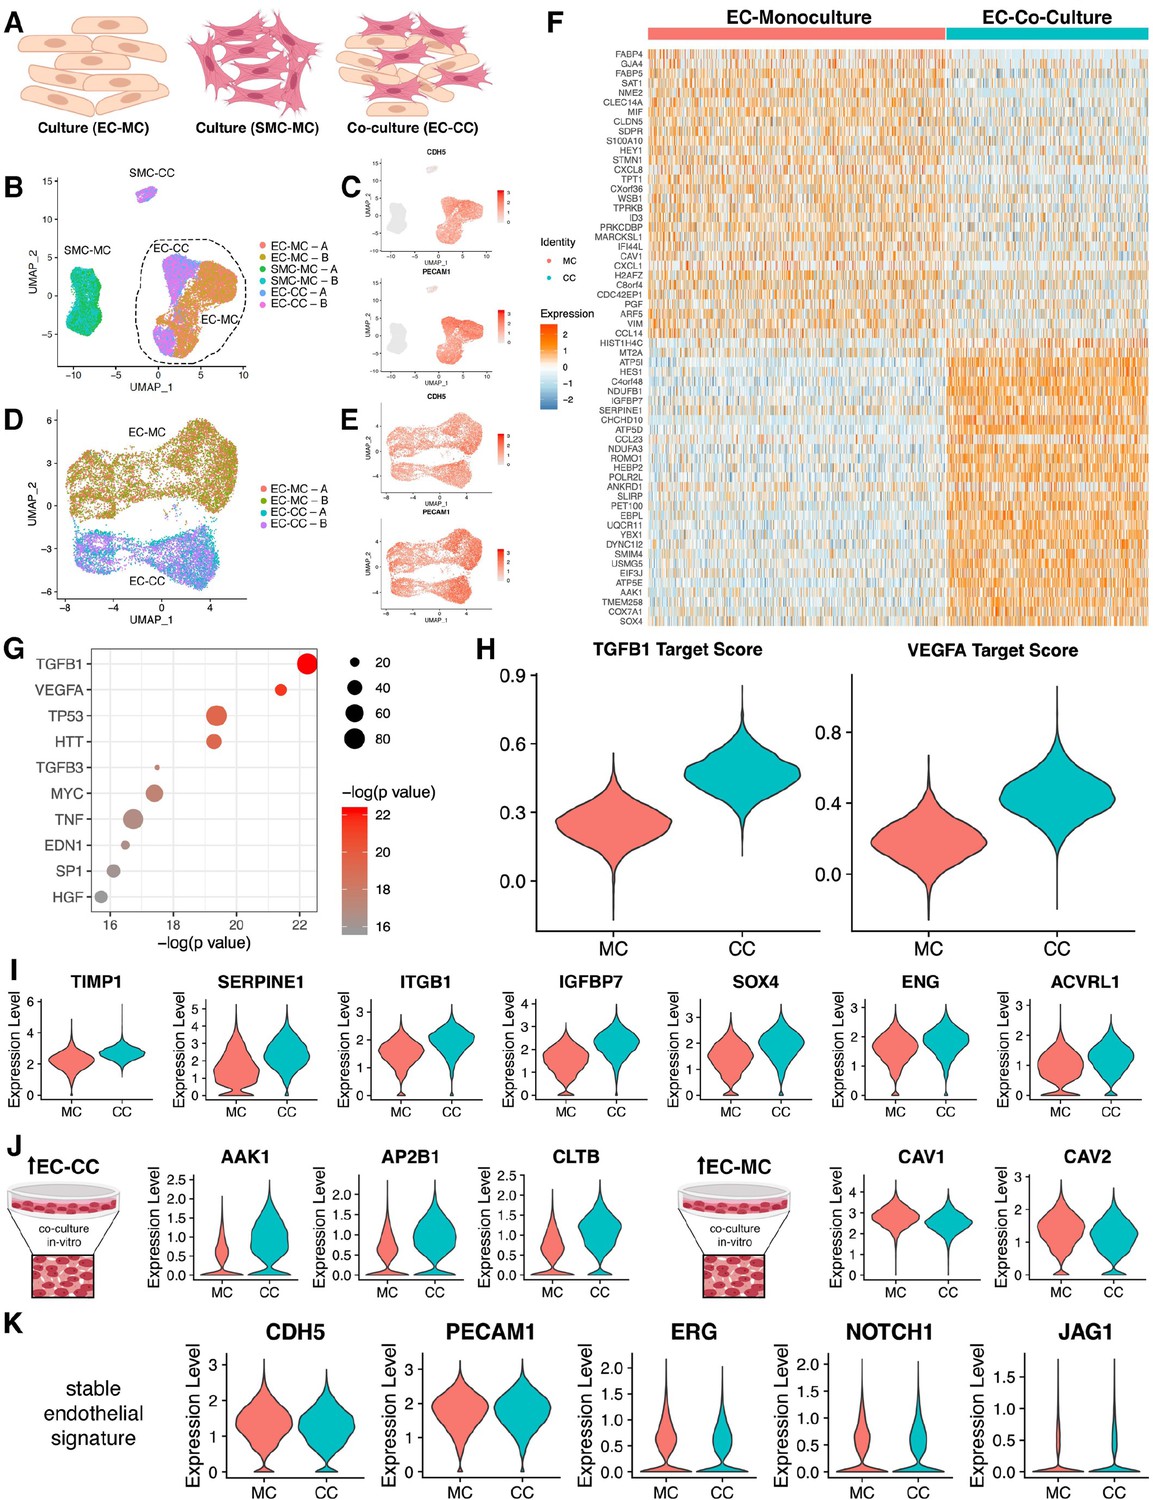
Endothelial cell–smooth muscle cell interactions.
(A) Schematic overview of single-cell RNA sequencing (RNAseq) experiments. (B) Uniform manifold approximation and projection (UMAP) of scRNAseq data with four distinct clusters with two technical replicates (labeled A/B) as indicated in the legend. (C) Identity of endothelial cells was confirmed by expression of CDH5 and PECAM transcripts. (D) UMAP of scRNAseq for endothelial cell mono-culture (EC-MC) and endothelial cell co-culture (EC-CC) with biological replicates as indicated. (E) Identity of endothelial cells was confirmed by expression of CDH5 and PECAM transcripts. (F) Heatmap identifying the top differentially expressed genes with log fold >2 for each condition relative to the other cell types. (G) Ingenuity analysis demonstrates most significantly upregulated module score based on growth factors, cytokines, and transcription factors. (G) TGFB1 and VEGF show the highest module score in co-culture relative to endothelial cell monoculture. (I) TGFB1 activated genes are upregulated in co-culture. (J) Clathrin family members are upregulated in co-culture; whereas caveolin family members are decreased in co-culture. (K) Endothelial cell makers are unchanged and stable in mono- and co-culture endothelial cells.
Figure 5—figure supplement 1
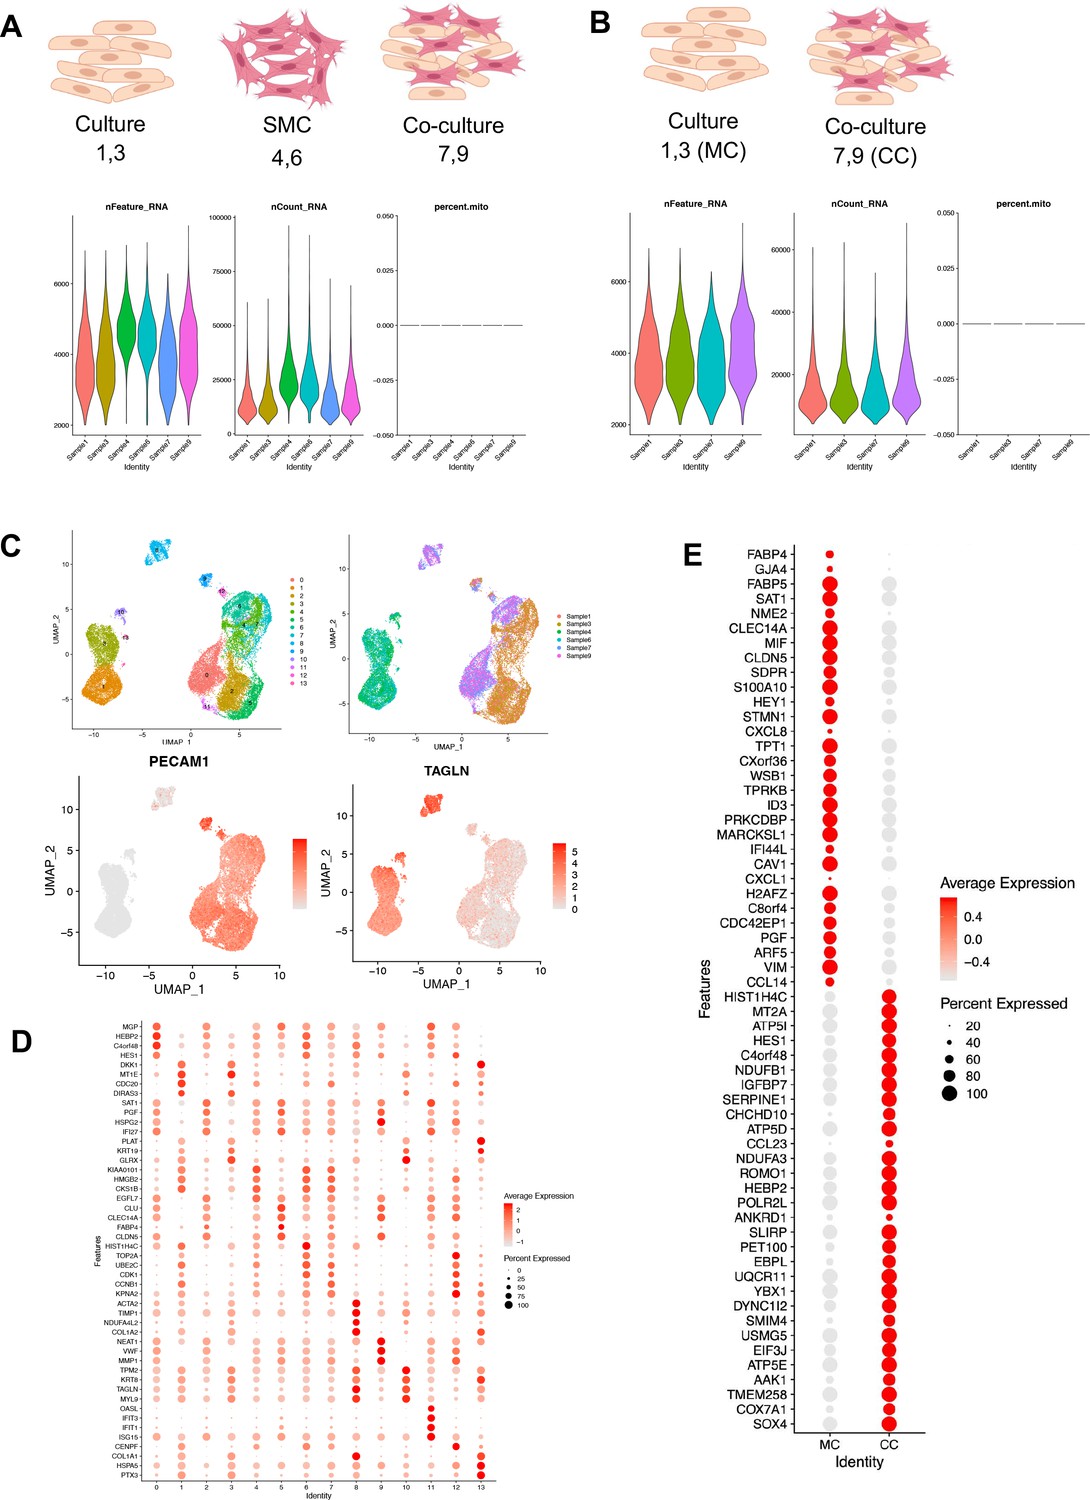
Single-cell RNAseq: endothelial cell–smooth muscle cell interactions.
(A, B) Graphical description of experimental design of single-cell RNA sequencing (scRNAseq) co-culture experiment and violin plot of quality metrics of RNA, counts, and mitochondrial genes. Two participants combined to define ‘culture’ of endothelial cell monolayer. Two different participant smooth muscle cells (SMCs) and a co-culture. For co-culture experiments primary umbilical SMCs were seeded sub-confluent onto the culture plate 24 hr prior to seeding human umbilical vein endothelial cells (HUVECs) at confluent density. After an additional 24 hr co-cultured cells were trypsinized. Dot plot demonstrates the top markers of in cord, monoculture (MC), and co-culture (CC). (C) Uniform manifold approximation and projection (UMAP) by cluster and sample demonstrating EC (PECAM1) and SMC (TAGL1) population. (D) Dot plot demonstrating purity of experimental design by UMAP cluster. (E) Endothelial cell monolayer (MC) and co-culture (CC) scRNAseq analysis demonstrates differentially expressed gene expression. Dot size corresponds to the proportion of cells within the group expressing each transcript and dot color intensity corresponds to the expression level.
Figure 6
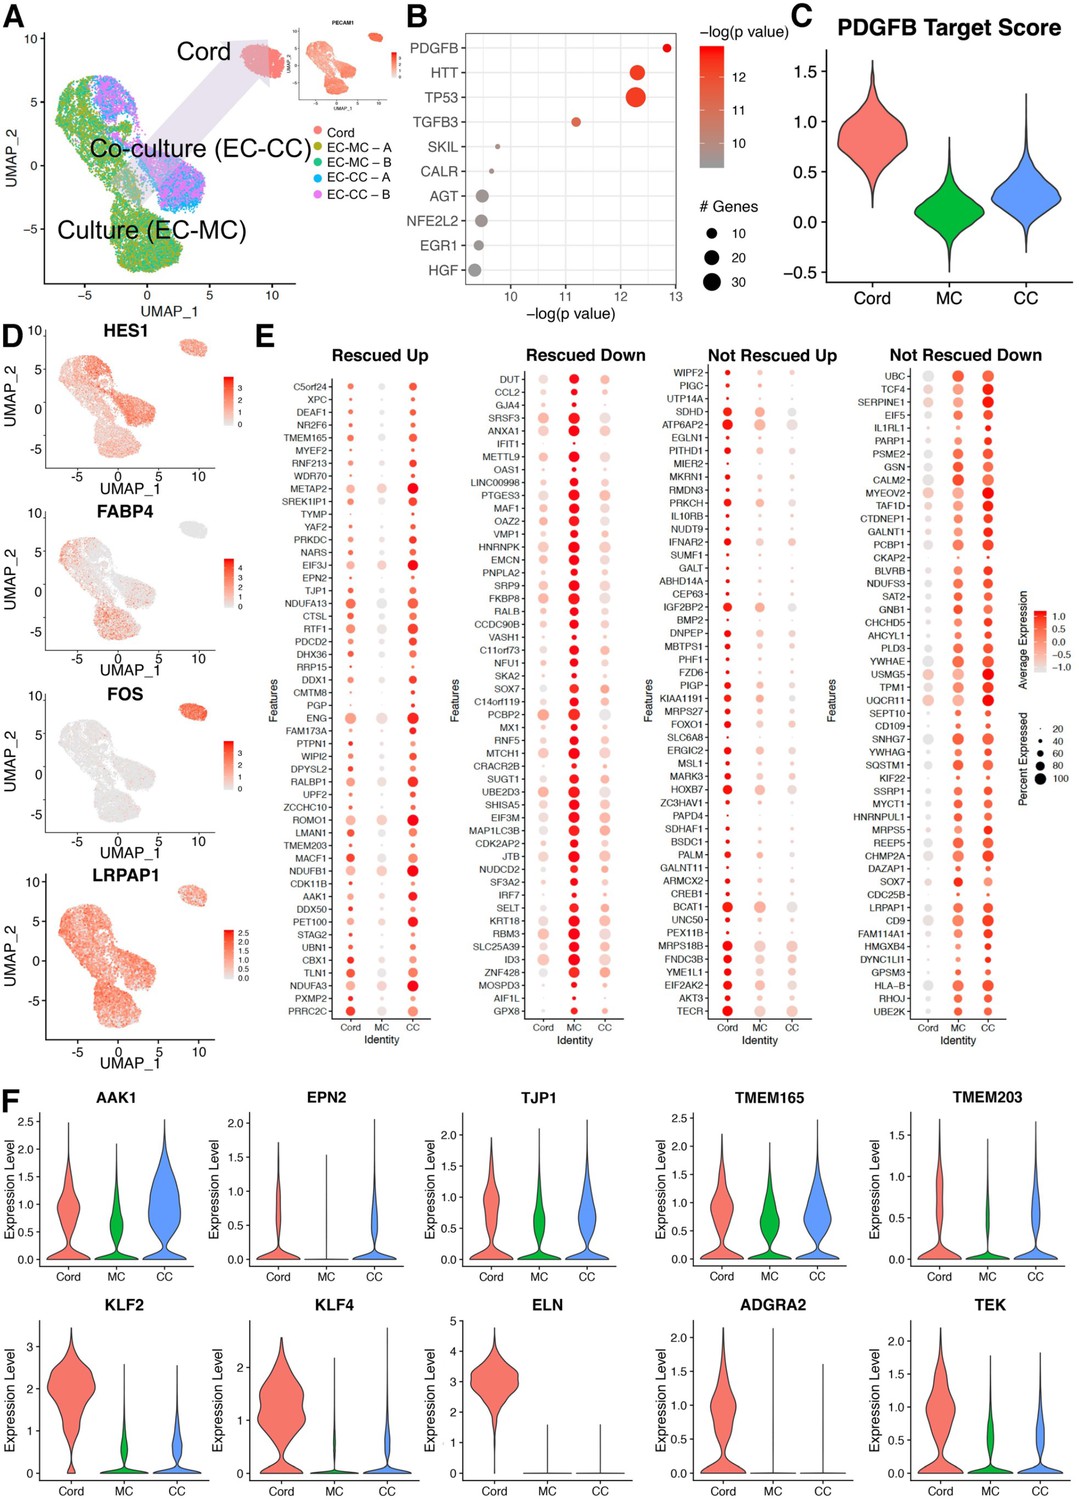
Co-cultured endothelial cells with smooth muscle cells rescue a cohort of genes when compared to the cord transcriptome.
(A) Uniform manifold approximation and projection (UMAP) of endothelial cell co-culture (EC-CC) with smooth muscle cells versus endothelial cell monoculture (EC-MC) in relation to endothelial cells isolated directly from umbilical cord. Insert: confirmed endothelial cell identity by PECAM. (B) Ingenuity analysis demonstrates most significantly upregulated module score based on growth factors, cytokines, and transcription factors. (C) PDGFB, the most significantly upregulated growth factor, is rescued by co-culture. (D) Environment-dependent transcriptional enrichment demonstrated by UMAP. (E) Dotplot illustrates the top markers of in cord, monoculture (MC), and co-culture (CC). Dot size corresponds to the proportion of cells within the group expressing each transcript and dot color intensity corresponds to the expression level. (F) Violin plot of environment-dependent (heterotypic co-culture) gene expression illustrating examples of genes rescued (AKK1, EPN2, TJP1, TMEM16S, TMEM203) and non-rescued genes (KLF2, KLF4, ELN, ADGRA2, TEK).
Figure 7

Summary figure.
Schematic representing experimental design, culture conditions, and corresponding validated genes changes.
Tables
Table 1
Patient demographics.
| Sample code | Gestational age | Fetal sex | Race | |
|---|---|---|---|---|
| RNAseq | ||||
| Cord, early culture p2–3, and late culture p7–8 experiments | 1 | 40w1d | M | Asian, Vietnamese |
| 2 | 39w4d | F | Asian, Chinese | |
| 3 | 39w4d | M | Asian | |
| 4 | 39w1d | M | Asian | |
| 5 | 39w0d | F | White | |
| 6 | 37w5d | M | White | |
| 7 | 38w4d | F | White | |
| Flow, RNAseq | ||||
| Culture static versus culture flow experiments | 8 | 39w6d | F | White |
| 9 | 40w5d | F | Black | |
| 10 | 40w4d | F | Asian, Chinese | |
| 11 | 39w5d | M | White | |
| Proteomics | ||||
| Cord versus culture experiments | 12 | 40w2d | M | Asian, Indian |
| 13 | 39w3d | F | Latino | |
| 14 | 37w2d | M | Latino | |
| 15 | 39w3d | M | Asian, Chinese | |
| 16 | 38w5d | F | Latino | |
| 17 | 37w0d | M | Asian, Other | |
| 18 | 40w0d | F | White | |
| scRNAseq | ||||
| Culture (monoculture) versus co-culture experiments | SMC | 37w3d | F | Latino (Other) |
| EC | 36w4d | M | Other |
Table 2
Most differentially up- and downregulated genes in cord (in vivo) and under flow (in vitro).
| Cord UP | Cord DOWN | Flow UP | Flow DOWN | ||||||||
|---|---|---|---|---|---|---|---|---|---|---|---|
| Gene | t-stat | FDR | Gene | t-stat | FDR | Gene | t-stat | FDR | Gene | t-stat | FDR |
| SYNPO2 | 31.1 | 9E−14 | HIST1H3J | −30.7 | 9E−14 | MLKL | 19.8 | 2E−06 | GPX4 | −17.2 | 2E−06 |
| MMP28 | 28.5 | 2E−13 | RRM2 | −26.9 | 4E−13 | LPCAT4 | 16.3 | 3E−06 | ID3 | −15.6 | 3E−06 |
| ELN | 25.2 | 9E−13 | TK1 | −29.3 | 1E−12 | ZBTB11 | 15.2 | 3E−06 | AKT1 | −14.2 | 5E−06 |
| SORBS1 | 25.8 | 9E−13 | CCNA2 | −29.8 | 2E−12 | CTSL | 15.1 | 3E−06 | PDE4B | −13.2 | 8E−06 |
| SYTL2 | 31.6 | 9E−13 | HIST1H2BE | −22.9 | 2E−12 | SLC9A3R2 | 18.6 | 4E−06 | ORAI2 | −12.9 | 1E−05 |
| MYOCD | 24.5 | 1E−12 | NSD2 | −23.9 | 5E−12 | MEF2A | 13.7 | 6E−06 | MEX3D | −12.9 | 1E−05 |
| ID2 | 24.2 | 1E−12 | BUB3 | −21.3 | 6E−12 | VANGL1 | 14.2 | 8E−06 | GJA1 | −12.9 | 2E−05 |
| CRISPLD2 | 24.8 | 1E−12 | INCENP | −21.2 | 7E−12 | IGFBP5 | 14.1 | 1E−05 | COLEC12 | −11.8 | 2E−05 |
| TEK | 24.4 | 1E−12 | NCAPD2 | −27.2 | 7E−12 | PALM | 12.5 | 1E−05 | CCDC71 | −12.6 | 2E−05 |
| LMOD1 | 25.3 | 1E−12 | ASCC3 | −20.8 | 1E−11 | KCNN4 | 13.7 | 2E−05 | COPA | −10.3 | 5E−05 |
| WFDC1 | 28.7 | 1E−12 | BAX | −23.3 | 1E−11 | ORAI1 | 11.9 | 2E−05 | AMOTL2 | −9.7 | 7E−05 |
| NTRK3 | 23.4 | 2E−12 | HAGLR | −19.3 | 3E−11 | PPM1D | 12.3 | 2E−05 | PYCR3 | −10.4 | 7E−05 |
| CEBPD | 24.5 | 2E−12 | TOMM40 | −18.4 | 4E−11 | CAMK1 | 13.5 | 2E−05 | RBM12 | −9.7 | 7E−05 |
| MTURN | 24.4 | 3E−12 | RNPEP | −18.2 | 4E−11 | AL365205.1 | 14.3 | 2E−05 | MAP1S | −9.2 | 1E−04 |
| GHDC | 22.2 | 4E−12 | FJX1 | −20.9 | 5E−11 | CBLN2 | 11.7 | 2E−05 | FGFRL1 | −9.6 | 1E−04 |
| JUNB | 32.0 | 4E−12 | UBE2S | −20.7 | 5E−11 | NTHL1 | 11.4 | 2E−05 | LINC00704 | −10.9 | 1E−04 |
| ST6GALNAC5 | 22.3 | 4E−12 | SLC25A5 | −18.2 | 5E−11 | SLC2A3 | 11.5 | 2E−05 | PIM3 | −10.8 | 1E−04 |
| ID4 | 21.7 | 4E−12 | NCAPG2 | −17.8 | 5E−11 | TNXB | 11.2 | 2E−05 | PAWR | −10.0 | 1E−04 |
| CXCL2 | 21.5 | 5E−12 | LSS | −18.1 | 6E−11 | WNK1 | 11.6 | 3E−05 | ELAVL1 | −8.8 | 2E−04 |
| INMT | 21.3 | 5E−12 | KPNB1 | −18.1 | 7E−11 | CALCRL | 14.6 | 3E−05 | AAR2 | −8.7 | 2E−04 |
| FBLN2 | 21.1 | 6E−12 | PCCB | −18.7 | 8E−11 | RBPMS | 10.8 | 3E−05 | CENPJ | −9.2 | 2E−04 |
| ACTG2 | 30.0 | 7E−12 | RFWD3 | −17.1 | 8E−11 | SENCR | 13.5 | 3E−05 | GAB2 | −10.8 | 2E−04 |
| KLF4 | 20.6 | 8E−12 | CSE1L | −17.2 | 1E−10 | PSEN1 | 11.0 | 3E−05 | KRT10 | −9.3 | 2E−04 |
| LMCD1 | 21.0 | 8E−12 | APLN | −16.8 | 1E−10 | EPS15L1 | 12.3 | 3E−05 | YKT6 | −8.7 | 2E−04 |
| CTNNA3 | 20.8 | 9E−12 | MAP4K4 | −16.9 | 1E−10 | CFP | 11.8 | 3E−05 | MBD2 | −8.5 | 2E−04 |
| EMX2 | 26.7 | 9E−12 | FANCI | −17.4 | 2E−10 | CHN1 | 10.6 | 3E−05 | FAM168B | −12.0 | 2E−04 |
| ADGRA2 | 25.3 | 1E−11 | CENPN | −21.2 | 2E−10 | SH3BP2 | 10.3 | 5E−05 | NELFB | −9.6 | 2E−04 |
| SPEG | 20.0 | 1E−11 | PCNA | −18.4 | 2E−10 | SP1 | 10.3 | 5E−05 | TGFBRAP1 | −10.0 | 3E−04 |
| MMRN2 | 21.5 | 1E−11 | MDM2 | −18.8 | 2E−10 | EPHB4 | 11.5 | 5E−05 | APBA2 | −8.8 | 3E−04 |
| ACKR2 | 19.9 | 1E−11 | SSU72 | −17.9 | 2E−10 | CASKIN2 | 11.6 | 6E−05 | CHST7 | −10.0 | 3E−04 |
Table 3
Concordant and discordant gene regulation in cord and flow conditions.
| Cord UP and Flow UP | Cord DOWN and Flow DOWN | Cord UP and Flow DOWN | Cord DOWN and Flow UP | ||||||||||||||||
|---|---|---|---|---|---|---|---|---|---|---|---|---|---|---|---|---|---|---|---|
| Cord | Flow | Cord | Flow | Cord | Flow | Cord | Flow | ||||||||||||
| Gene | t-stat | FDR | t-stat | FDR | Gene | t-stat | FDR | t-stat | FDR | Gene | t-stat | FDR | t-stat | FDR | Gene | t-stat | FDR | t-stat | FDR |
| ELN | 25.2 | 9E−13 | 8.3 | 2E−02 | TOMM40 | −18.4 | 4E−11 | −3.5 | 4E−02 | BMP6 | 22.0 | 8E−11 | −3.2 | 5E−02 | NECTIN1 | −15.5 | 3E−09 | 5.8 | 2E−03 |
| CRISPLD2 | 24.8 | 1E−12 | 5.7 | 2E−03 | FJX1 | −20.9 | 5E−11 | −5.9 | 2E−02 | IFT122 | 20.6 | 1E−10 | −9.8 | 8E−04 | BIN1 | −12.3 | 2E−08 | 8.3 | 3E−04 |
| TEK | 24.4 | 1E−12 | 9.1 | 7E−03 | MAP4K4 | −16.9 | 1E−10 | −4.2 | 3E−02 | CXCL3 | 16.1 | 2E−10 | −4.9 | 5E−03 | CAPRIN1 | −12.1 | 2E−08 | 4.1 | 2E−02 |
| FBLN2 | 21.1 | 6E−12 | 6.0 | 9E−03 | CENPN | −21.2 | 2E−10 | −4.4 | 1E−02 | ARHGEF9 | 16.0 | 4E−10 | −5.4 | 4E−02 | FBXO22 | −13.0 | 2E−08 | 3.7 | 4E−02 |
| KLF4 | 20.6 | 8E−12 | 10.9 | 1E−02 | KCTD5 | −18.1 | 3E−10 | −9.3 | 1E−03 | FBXO32 | 12.1 | 1E−08 | −5.1 | 4E−03 | EFNB1 | −13.1 | 2E−08 | 4.9 | 6E−03 |
| CTNNA3 | 20.8 | 9E−12 | 4.0 | 2E−02 | DKK1 | −19.5 | 5E−10 | −3.5 | 4E−02 | SIRPB2 | 13.6 | 1E−08 | −4.3 | 1E−02 | AKR1B1 | −14.0 | 3E−08 | 4.1 | 2E−02 |
| MMRN2 | 21.5 | 1E−11 | 8.9 | 4E−03 | FEN1 | −21.4 | 1E−09 | −4.4 | 2E−02 | CYP27A1 | 13.7 | 2E−08 | −4.6 | 5E−02 | GPSM2 | −12.2 | 3E−07 | 3.6 | 5E−02 |
| CMKLR1 | 21.4 | 1E−11 | 10.2 | 1E−02 | DTYMK | −20.9 | 1E−09 | −3.8 | 3E−02 | GUCY1A2 | 11.7 | 2E−08 | −4.2 | 2E−02 | INTS13 | −12.8 | 8E−07 | 3.7 | 3E−02 |
| DLL1 | 20.2 | 2E−11 | 5.9 | 3E−02 | SEC61B | −15.3 | 2E−09 | −5.7 | 2E−03 | MLLT6 | 11.0 | 3E−08 | −5.3 | 5E−03 | EYA3 | −10.8 | 9E−07 | 5.6 | 5E−03 |
| IGFBP5 | 23.1 | 2E−11 | 14.1 | 1E−05 | RANGAP1 | −15.7 | 3E−09 | −4.3 | 1E−02 | ZNF365 | 10.4 | 7E−08 | −4.6 | 1E−02 | HMGCR | −9.0 | 2E−06 | 3.7 | 3E−02 |
| SRL | 19.4 | 3E−11 | 6.1 | 3E−02 | DDX52 | −14.5 | 4E−09 | −4.0 | 2E−02 | HMCN2 | 15.9 | 1E−07 | −4.7 | 8E−03 | ARFGEF2 | −9.5 | 3E−06 | 4.1 | 2E−02 |
| FGF18 | 22.1 | 3E−11 | 8.9 | 3E−03 | LINC01013 | −24.7 | 5E−09 | −3.9 | 3E−02 | DACT3 | 11.0 | 1E−07 | −4.6 | 4E−02 | DHX9 | −9.1 | 4E−06 | 3.3 | 4E−02 |
| AQP1 | 20.9 | 4E−11 | 6.0 | 2E−02 | RAB1B | −13.1 | 8E−09 | −4.4 | 2E−02 | PAM | 9.6 | 3E−07 | −3.7 | 5E−02 | LYAR | −9.8 | 4E−06 | 3.8 | 3E−02 |
| STOM | 18.0 | 4E−11 | 9.0 | 6E−04 | ATAD2 | −12.2 | 8E−09 | −3.2 | 5E−02 | LIMCH1 | 10.0 | 3E−07 | −4.9 | 8E−03 | TRIM7 | −7.6 | 4E−06 | 6.7 | 9E−03 |
| TNXB | 18.4 | 5E−11 | 11.2 | 2E−05 | CDCA4 | −14.5 | 9E−09 | −4.6 | 1E−02 | ADSSL1 | 9.8 | 9E−07 | −3.5 | 4E−02 | NDUFB10 | −10.5 | 5E−06 | 4.2 | 1E−02 |
| SMOC2 | 21.6 | 5E−11 | 4.1 | 3E−02 | CENPO | −23.0 | 9E−09 | −5.6 | 4E−03 | SYNGR2 | 8.4 | 1E−06 | −3.2 | 4E−02 | HIST2H2BF | −9.7 | 8E−06 | 3.8 | 3E−02 |
| JPH4 | 16.8 | 1E−10 | 15.2 | 1E−03 | AP1B1 | −14.8 | 1E−08 | −8.3 | 9E−04 | CCL2 | 8.7 | 1E−06 | −4.1 | 1E−02 | ZNF185 | –10.3 | 8E−06 | 4.1 | 2E−02 |
| NTN1 | 18.3 | 1E−10 | 6.1 | 2E−03 | PGF | −12.5 | 1E−08 | −5.0 | 3E−02 | PDE1C | 8.5 | 1E−06 | −8.8 | 9E−03 | NQO1 | −15.2 | 9E−06 | 10.6 | 1E−04 |
| ANGPTL1 | 18.2 | 1E−10 | 6.5 | 1E−03 | ADAM9 | −14.1 | 1E−08 | −5.3 | 5E−03 | SELENOP | 8.6 | 1E−06 | −3.7 | 3E−02 | PLCB3 | −10.6 | 9E−06 | 3.4 | 3E−02 |
| PTPN13 | 16.7 | 2E−10 | 4.0 | 2E−02 | CHAF1A | −17.8 | 1E−08 | −3.7 | 2E−02 | RHOB | 10.8 | 2E−06 | −5.0 | 1E−02 | ELMOD1 | −6.9 | 1E−05 | 3.6 | 3E−02 |
| PLPP3 | 16.5 | 2E−10 | 10.0 | 4E−03 | DLAT | −13.3 | 2E−08 | −3.6 | 3E−02 | SORBS2 | 8.0 | 2E−06 | −4.0 | 4E−02 | SAAL1 | −10.7 | 1E−05 | 4.6 | 8E−03 |
| ST8SIA6 | 17.0 | 2E−10 | 12.7 | 4E−03 | C19orf48 | −19.9 | 2E−08 | −4.1 | 3E−02 | FAM198B | 9.1 | 4E−06 | −4.5 | 2E−02 | SLC25A19 | −8.7 | 2E−05 | 3.9 | 2E−02 |
| MMP24 | 17.4 | 2E−10 | 4.4 | 1E−02 | TUBB | −11.5 | 2E−08 | −3.3 | 4E−02 | CD83 | 8.5 | 4E−06 | −3.6 | 3E−02 | CDC25B | −8.5 | 2E−05 | 10.2 | 4E−03 |
| PLCB4 | 17.4 | 2E−10 | 5.6 | 3E−02 | H2AFZ | −15.6 | 2E−08 | −3.2 | 4E−02 | TMEM184A | 9.4 | 4E−06 | −3.8 | 2E−02 | ZC3H14 | −7.0 | 2E−05 | 4.5 | 3E−02 |
| PARM1 | 15.5 | 3E−10 | 6.2 | 3E−03 | MEX3A | −12.1 | 2E−08 | −5.1 | 7E−03 | ARHGEF37 | 8.7 | 5E−06 | −4.6 | 9E−03 | SCD | −7.9 | 2E−05 | 4.0 | 4E−02 |
| RAMP3 | 15.2 | 5E−10 | 3.1 | 5E−02 | SPDL1 | −16.1 | 2E−08 | −4.1 | 2E−02 | EGR1 | 12.1 | 6E−06 | −5.5 | 3E−03 | MIR100HG | −7.2 | 2E−05 | 6.8 | 8E−04 |
| HIPK3 | 20.9 | 5E−10 | 4.7 | 1E−02 | NME4 | −19.3 | 3E−08 | −4.6 | 2E−02 | ARSG | 11.1 | 6E−06 | −4.9 | 9E−03 | SCARB1 | −11.9 | 2E−05 | 4.2 | 3E−02 |
| NOV | 15.1 | 5E−10 | 8.9 | 7E−04 | USP31 | −11.8 | 3E−08 | −4.0 | 5E−02 | MEFV | 9.7 | 7E−06 | −3.4 | 5E−02 | MIR34AHG | −9.5 | 2E−05 | 4.8 | 6E−03 |
| GLIS3 | 16.8 | 6E−10 | 4.4 | 2E−02 | DNAH11 | −15.5 | 3E−08 | −3.8 | 3E−02 | NUAK1 | 11.4 | 8E−06 | −3.8 | 4E−02 | CNRIP1 | −9.0 | 3E−05 | 3.9 | 2E−02 |
| ITPR1 | 27.3 | 7E−10 | 5.9 | 3E−02 | UBE2N | −11.1 | 3E−08 | −5.6 | 3E−03 | CSRNP1 | 17.7 | 9E−06 | −4.7 | 2E−02 | CCDC51 | −8.7 | 3E−05 | 3.9 | 3E−02 |
Appendix 1—key resources table
| Reagent type (species) or resource | Designation | Source or reference | Identifiers | Additional information |
|---|---|---|---|---|
| Biological sample (human) | Human umbilical vein endothelial cells | University of California, Los Angeles | N/A | Iruela-Arispe Lab and/or Afshar Lab |
| Biological sample (human) | Human umbilical vein tissue samples | University of California, Los Angeles | N/A | Iruela-Arispe Lab and/or Afshar Lab |
| Biological sample (human) | Human umbilical smooth muscle cells | University of California, Los Angeles | N/A | Iruela-Arispe Lab and/or Afshar Lab |
| Chemical compound, drug | MCDB-131 Complete Medium | VEC Technologies Inc | Cat# MCDB-131 WOFBS | |
| Chemical compound, drug | Dextran | Sigma-Aldrich | Cat# 31392-50G | |
| Chemical compound, drug | Fetal bovine serum | Omega Scientific, inc | Cat# FB-01; Lot# 871023 | |
| Chemical compound, drug | HBSS | Fisher Scientific | Cat# MT 21-023-CV | |
| Peptide, recombinant protein | Collagenase, Type 2 | Worthington Biochemical | Cat# LS004176 | |
| Chemical compound, drug | Trypsin | Fisher Scientific | Cat# MT-25-054CI | |
| Chemical compound, drug | eBioscience 1× RBC Lysis buffer | Thermo Fischer Scientific | Cat# 00433357 | |
| Peptide, recombinant protein | Pierce Bovine Serum Albumin | Thermo Fischer Scientific | Cat# 23209 | |
| Chemical compound, drug | Sodium deoxycholate | Sigma-Aldrich | Cat# D6750-25G | |
| Chemical compound, drug | 5% Mini-PROTEAN TBE Gel | Bio-Rad | Cat# 4565013 | |
| Peptide, recombinant protein | RNase-free DNase | QIAGEN | Cat# 79254 | |
| Chemical compound, drug | SuperSignal West Pico PLUS Chemiluminescent Substrate | Fisher Scientific | Cat# PI34580 | |
| Chemical compound, drug | SuperSignal West Femto Chemiluminescent Substrate | Fisher Scientific | Cat# PI34096 | |
| Chemical compound, drug | Restore Western Blot Stripping Buffer | Fisher Scientific | Cat# 21059 | |
| Chemical compound, drug | Ponceau S Solution, Bioreagent | Sigma | Cat# P7170 | |
| Chemical compound, drug | 4–20% Mini-PROTEAN TGX Precast Protein Gels, 12-well, 20 µl | Bio-Rad | Cat# 4561095 | |
| Chemical compound, drug | Precision Plus Protein Dual Color Standards | Bio-Rad | Cat# 1610374 | |
| Chemical compound, drug | Tween 20 | Fisher Scientific | Cat# BP337500 CAS 9005-64-5 | |
| Chemical compound, drug | Sodium Orthovanadate, >99% | Thermo Fisher Scientific | Cat# AC205330500 | |
| Chemical compound, drug | Complete, EDTA-Free Protease Inhibitor Cocktail | Sigma | Cat# 11873580001 | |
| Chemical compound, drug | Triton X-100 | Fisher | Cat# BP151 | |
| Chemical compound, drug | Sodium chloride | Fisher | Cat# S271 | |
| Chemical compound, drug | Tris–HCl | Fisher | Cat# BP153 | |
| Chemical compound, drug | Tris-Base | Fisher | Cat# BP152 | |
| Chemical compound, drug | Sodium dodecyl sulfate | Fisher | Cat# BP166 | |
| Chemical compound, drug | Glycine | Dot Scientific | Cat# DSG36050 | |
| Chemical compound, drug | Bromophenol Blue | Fisher | Cat# B392 | |
| Chemical compound, drug | 2 Mercaptoethanol, 99%, extra pure | Acros Organics | Cat# 125472500 | |
| Chemical compound, drug | Dulbecco's Modified Eagle Medium (DMEM) with L-Glutamine and 4.5 g/L Glucose; Without Sodium Pyruvate | Corning | Cat# 10017CV | |
| Chemical compound, drug | Glycerol | Invitrogen | Cat# 15514 | |
| Commercial assay, kit | RNeasy Plus Micro Kit | QIAGEN | Cat# 74034 | |
| Commercial assay, kit | Ribo-Zero rRNA removal kit | Ilumina | Cat# MRZH11124 | |
| Commercial assay, kit | Nextera Index kit | Ilumina | Cat# FC-121-1011 | |
| Commercial assay, kit | MinElute PCR Purification Kit | QIAGEN | Cat# 28004 | |
| Commercial assay, kit | QIAquick PCR Purification Kit | QIAGEN | Cat# 28104 | |
| Commercial assay, kit | Nextera DNA Sample Preparation Kit | Ilumina | Cat# FC-121-1030 | |
| Chemical compound, drug | NEBNext High-Fidelty 2× PCR Master Mix | New England Biolab | Cat# MO541S | |
| Chemical compound, drug | SYBR Green I Nucleic Acid Gel Stain | Fisher Scientific | Cat# S7563 | |
| Commercial assay, kit | ChIP DNA Clean & Concentrator | Zymo | Cat# D5205 | |
| Commercial assay, kit | 10× reagents for library | 10xGenomics | Cat# 1000075 | |
| Commercial assay, kit | CD31 MicroBead Kit, human | Miltenyi Biotec | Cat# 130-091-935 | |
| Commercial assay, kit | Trans-Blot Turbo RTA Midi Nitrocellulose Transfer Kit | Bio-Rad | Cat# 1704271 | |
| Commercial assay, kit | Thermo Scientific Pierce Detergent Compatible Bradford Assay | Fisher Scientific | Cat# PI23246 | |
| Commercial assay, kit | QuadroMACS Starting Kit (LS) | Miltenyi Biotec | Cat# 130-091-051 | |
| Other (deposited data) | Raw data files for bulk RNAseq | NCBI GEO | GSE158081 | https://www.ncbi.nlm.nih.gov/gds |
| Other (deposited data) | Raw data files for scRNAseq | NCBI GEO | GSE156939 | https://www.ncbi.nlm.nih.gov/gds |
| Other (deposited data) | Raw data files for LC/MS | Proteome Xchange Consortium PRIDE | PXD020958 | https://www.proteomexchange.org/ |
| Software, algorithms | STAR (2.5.4a) | Dobin et al., 2013 | https://github.com/alexdobin/STAR | |
| Software, algorithms | FeatureCounts | Liao et al., 2014 | http://subread.sourceforge.net/ | |
| Software, algorithms | Bioconductor package DESeq2 | Love et al., 2014 | https://bioconductor.org/packages/release/bioc/html/DESeq2.html | |
| Software, algorithms | Heatmap.2 In R package | Online | https://www.rdocumentation.org/packages/gplots/versions/3.0.4/topics/heatmap.2 | |
| Software, algorithms | 10× Chromium Single Cell Software Loupe Browser (visualization tools), version 4.1 | Online | https://support.10xgenomics.com/single-cell-gene-expression/software/overview/welcome | |
| Software, algorithms | Image Lab, Version 6.0.0.0 build 25 | Bio-Rad Laboratories |
Additional files
-
Supplementary file 1
RNAseq gene expression matrix by participant and environmental level conditions (cord, early culture, and late culture).
- https://cdn.elifesciences.org/articles/81370/elife-81370-supp1-v3.xlsx
-
Supplementary file 2
Liquid chromatography–mass spectrometry (LC–MS) protein expression by participant and environmental level conditions (cord and culture).
- https://cdn.elifesciences.org/articles/81370/elife-81370-supp2-v3.xlsx
-
Supplementary file 3
RNAseq gene comparison matrix by environmental condition (multi-tabulated excel): Tabs included (n = 10) are Cord versus Early, Cord versus Late, Cord versus Early/Late, Early versus Late, Culture versus 0.5 hr flow, Culture versus 8 hr flow, Culture versus 24 hr flow, Culture versus 48 hr flow, Flow (>8 hr) versus No Flow, Early flow versus No flow.
- https://cdn.elifesciences.org/articles/81370/elife-81370-supp3-v3.xlsx
-
Supplementary file 4
Biweight midcorrelation (bicor) between gene expression levels by condition and participant with module correlation (multi-tabulated excel): Tabs included (n = 2): all genes, non-coding genes.
- https://cdn.elifesciences.org/articles/81370/elife-81370-supp4-v3.xlsx
-
Supplementary file 5
Environmental driven gene expression and rescue with concordance and discordance (multi-tabulated excel): Table included (n = 6): cord, flow, up in both, down in both, up in cord, down in flow, down in cord, up in flow.
- https://cdn.elifesciences.org/articles/81370/elife-81370-supp5-v3.xlsx
-
Supplementary file 6
Single-cell RNA sequencing (scRNAseq) gene matrix of endothelial cell monolayer versus co-culture (MC vs. CC).
- https://cdn.elifesciences.org/articles/81370/elife-81370-supp6-v3.csv
-
Supplementary file 7
Single-cell RNA sequencing (scRNAseq) gene matrix of endothelial cell monolayer (MC) versus cord.
- https://cdn.elifesciences.org/articles/81370/elife-81370-supp7-v3.csv
-
Supplementary file 8
Single-cell RNA sequencing (scRNAseq) gene matrix of endothelial cell – smooth muscle cell co-culture (CC) versus cord.
- https://cdn.elifesciences.org/articles/81370/elife-81370-supp8-v3.csv
-
Supplementary file 9
Concordance of differentially expressed RNA and protein in cord versus culture.
- https://cdn.elifesciences.org/articles/81370/elife-81370-supp9-v3.xlsx
-
MDAR checklist
- https://cdn.elifesciences.org/articles/81370/elife-81370-mdarchecklist1-v3.docx
Download links
A two-part list of links to download the article, or parts of the article, in various formats.
Downloads (link to download the article as PDF)
Open citations (links to open the citations from this article in various online reference manager services)
Cite this article (links to download the citations from this article in formats compatible with various reference manager tools)
Transcriptional drifts associated with environmental changes in endothelial cells
eLife 12:e81370.
https://doi.org/10.7554/eLife.81370


