Constitutive activation and oncogenicity are mediated by loss of helical structure at the cytosolic boundary of thrombopoietin receptor mutant dimers
- Ludwig Institute for Cancer Research, Belgium
- de Duve Institute, Université catholique de Louvain, Belgium
- Department of Biochemistry and Cell Biology, Stony Brook University, Stony Brook, NY, United States
- WEL Research Institute, WELBIO Department, Belgium
- Ludwig Institute for Cancer Research, Nuffield Department of Medicine, Oxford University, United Kingdom
Figures
Figure 1
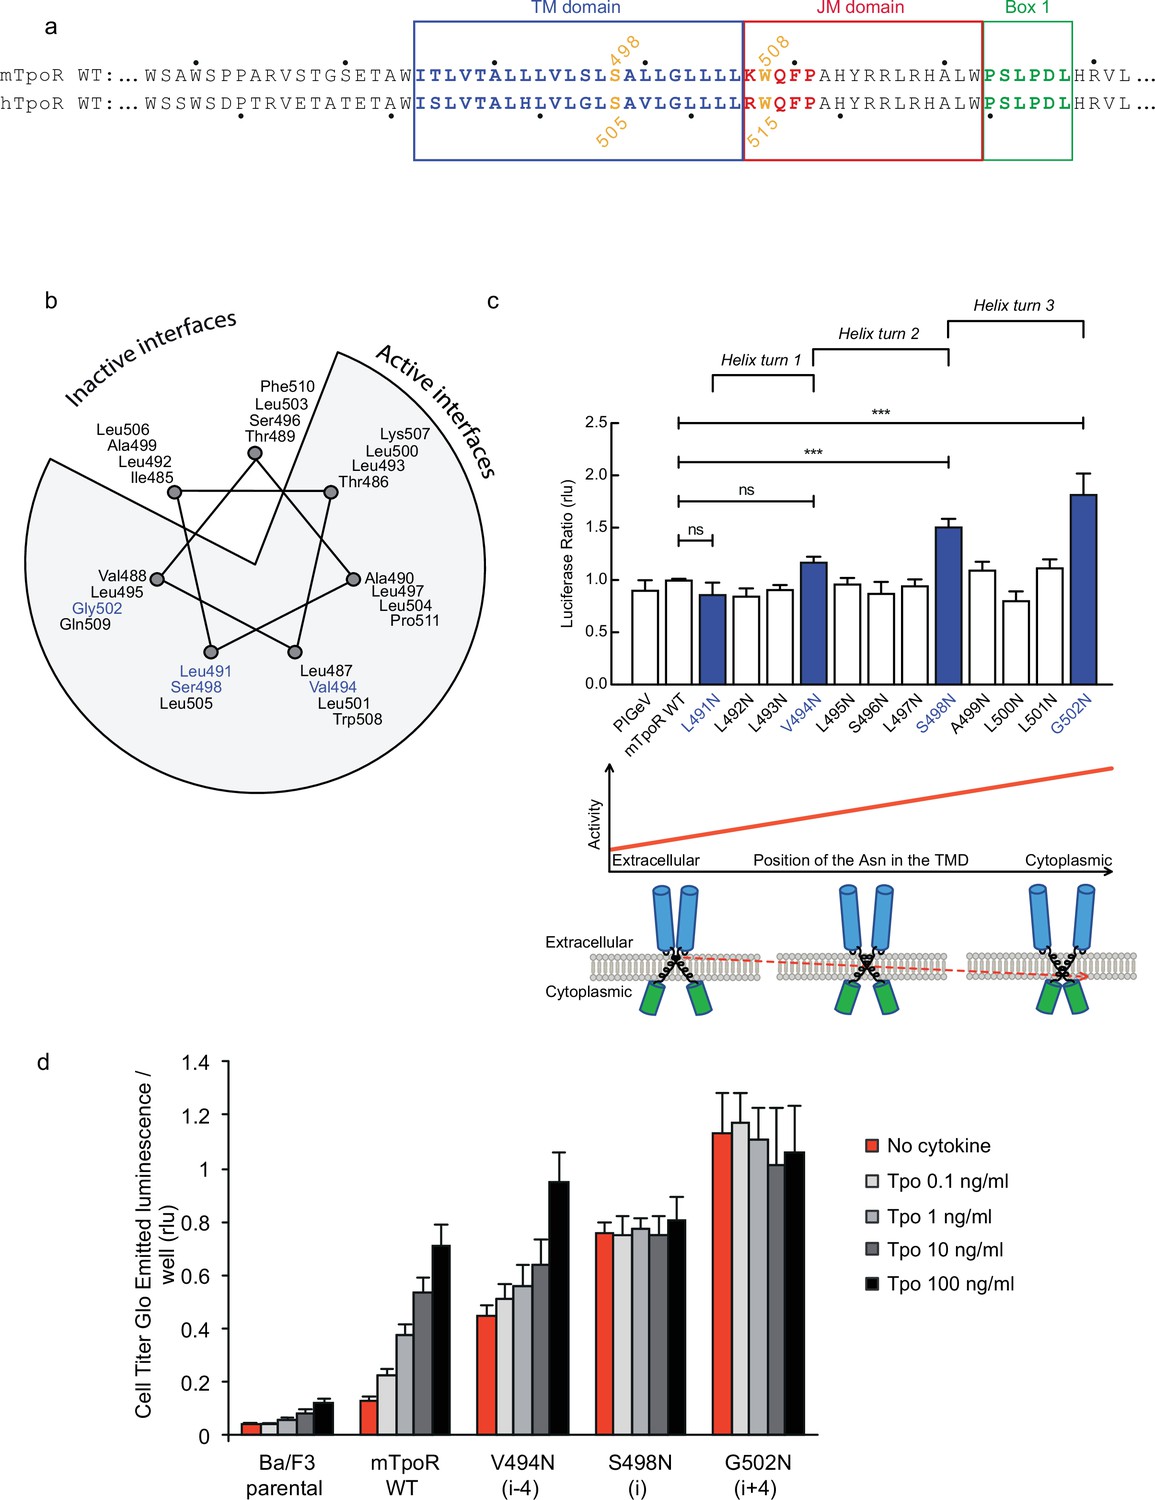
Activity and relative position of asparagine (Asn) mutants in murine thrombopoietin receptor (TpoR).
The murine TpoR (mTpoR) wild type (WT) transmembrane domain sequence and numbering. The residues that make the KWQFP motif are highlighted in red (a). A helical wheel diagram shows the positions of L491, V494, S498, and G502 (blue) on the active interface (b). The relative tranlscriptional activity of mTpoR WT or mutants was assessed with STAT5 reporter Spi-Luc in HEK-293T cells. Shown are averages of separate experiments ± SEM (n = 3–4), each experiment being performed with three biological repeats for each condition (triplicates). Kruskal–Wallis non-parametric test with multiple-comparisons using Steel’s test with mTpoR WT as control (jmp pro12). ***p<0.0001; n.s., nonsignificant (c, upper panel). Cartoon illustrating how asparagine residues are predicted to promote crossing of transmembrane helices (c, lower panels). Short-term cell growth was measured using the Cell-Titer-Glo luminescent cell viability assay (Cell Titer Glo, Promega) with stable Ba/F3 cell lines expressing mTpoR WT or mutants with no ligand or increasing concentrations of Tpo ligand (0.1, 1, 10, and 100 ng/ml). Shown are the averages of three independent experiments ± SD (each experiment performed once) (d).
-
Figure 1—source data 1
Raw data, scatter plot, and statistics (Prism 9.1.2, jmp pro12) for Figure 1c (upper panel).
STAT5 transcriptional activity of the murine thrombopoietin receptor (mTpoR) wild type (WT) or mutant assessed in HEK-293T cells by luciferase assay with STAT5 reporter Spi-Luc.
- https://cdn.elifesciences.org/articles/81521/elife-81521-fig1-data1-v2.xlsx
-
Figure 1—source data 2
Raw data for Figure 1d.
Short-term cell growth measured using the Cell-Titer-Glo luminescent cell viability assay with stable Ba/F3 cell lines expressing the murine thrombopoietin receptor (mTpoR) WT or mutant with no ligand or increasing concentrations of Tpo ligand (0.1–100 ng/ml).
- https://cdn.elifesciences.org/articles/81521/elife-81521-fig1-data2-v2.xlsx
Figure 2 with 1 supplement
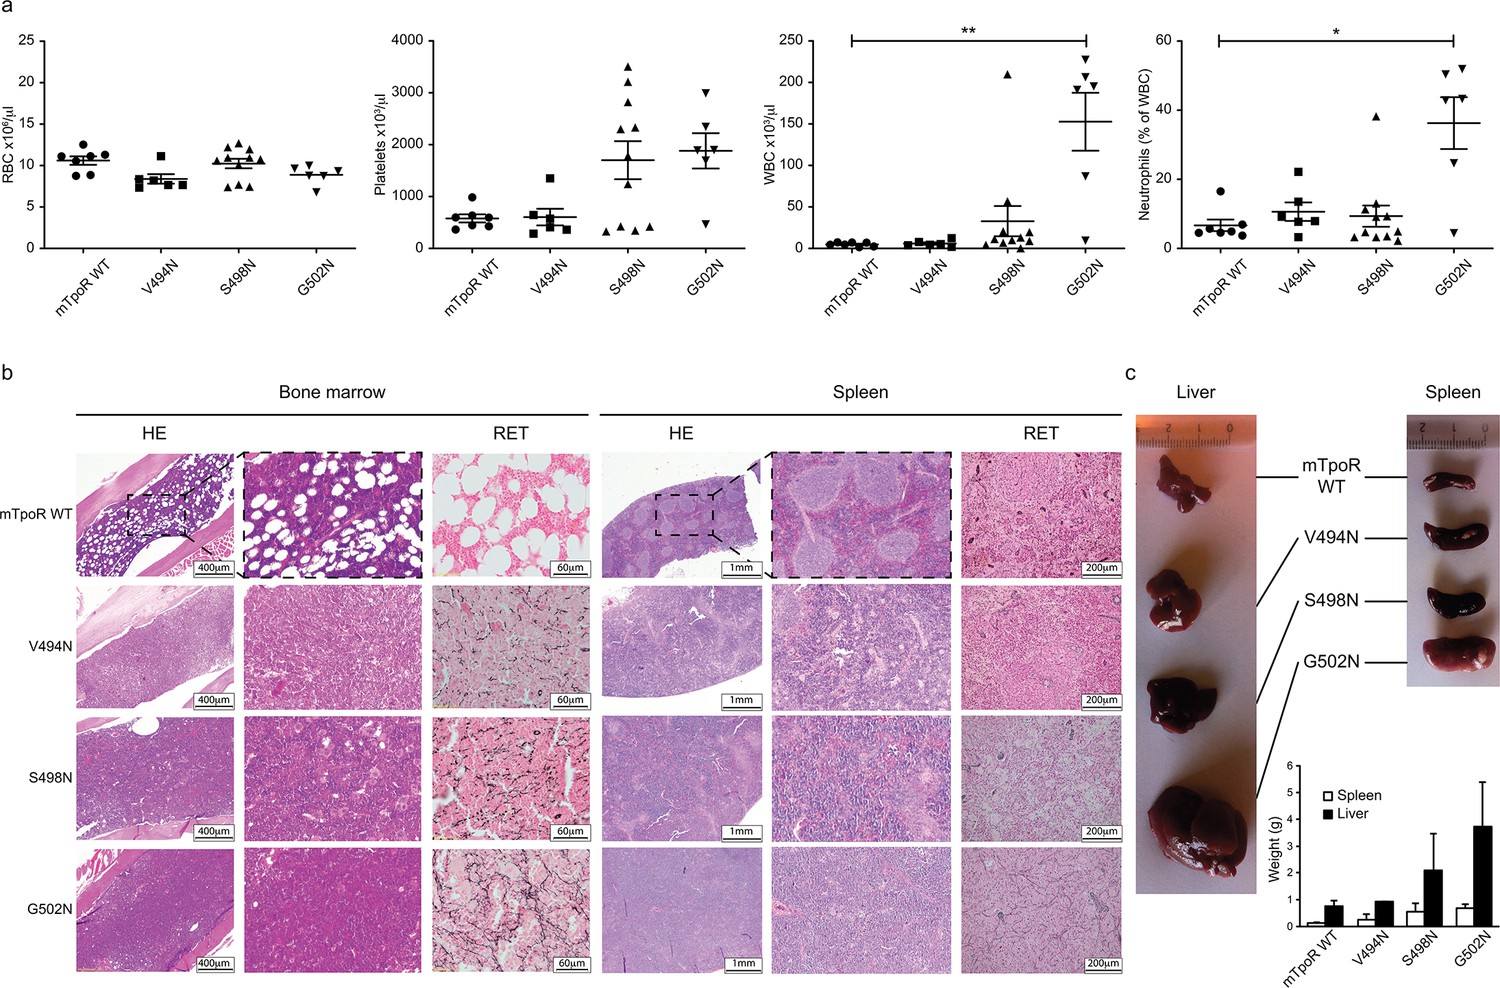
In vivo data comparing asparagine (Asn) murine thrombopoietin receptor (TpoR) mutants.
Red blood cell (RBC), platelets, white blood cells (WBC), and neutrophils were measured using a MS9 blood cell counter at day 40 post-transplantation. Values shown represent the average of at least six biological replicates ± SEM., Kruskal–Wallis nonparametric test with Dunn’s multiple-comparisons test (Prism 9.1.2); *p<0.05, **p<0.01 (a). Bone marrow/spleen cellularity and fibrosis have been evaluated by hematoxylin-eosin (HE) and reticulin (RET) staining, respectively. 3× zoom was performed on the .jpg file with Adobe Illustrator. (b). Liver and spleen were photographed and weighted (c). Values shown represent the average of two biological replicates ± SEM.
-
Figure 2—source data 1
Raw data and statistics (Prism 9.1.2) for Figure 2a.
Red blood cell, platelets, white blood cells, and neutrophils measured, using an MS9 blood cell counter, at day 40 after transplantation of C57BL/6 female mice with retrovirus-infected C57BL/6 male bone marrow for expression murine thrombopoietin receptor (mTpoR) wild type (WT) or mutant.
- https://cdn.elifesciences.org/articles/81521/elife-81521-fig2-data1-v2.xlsx
-
Figure 2—source data 2
Raw data for Figure 2c.
Liver and spleen weights (in grams) at day 40 after transplantation of C57BL/6 female mice with retrovirus-infected C57BL/6 male bone marrow for expression murine thrombopoietin receptor (mTpoR) wild type (WT) or mutant.
- https://cdn.elifesciences.org/articles/81521/elife-81521-fig2-data2-v2.xlsx
Figure 2—figure supplement 1
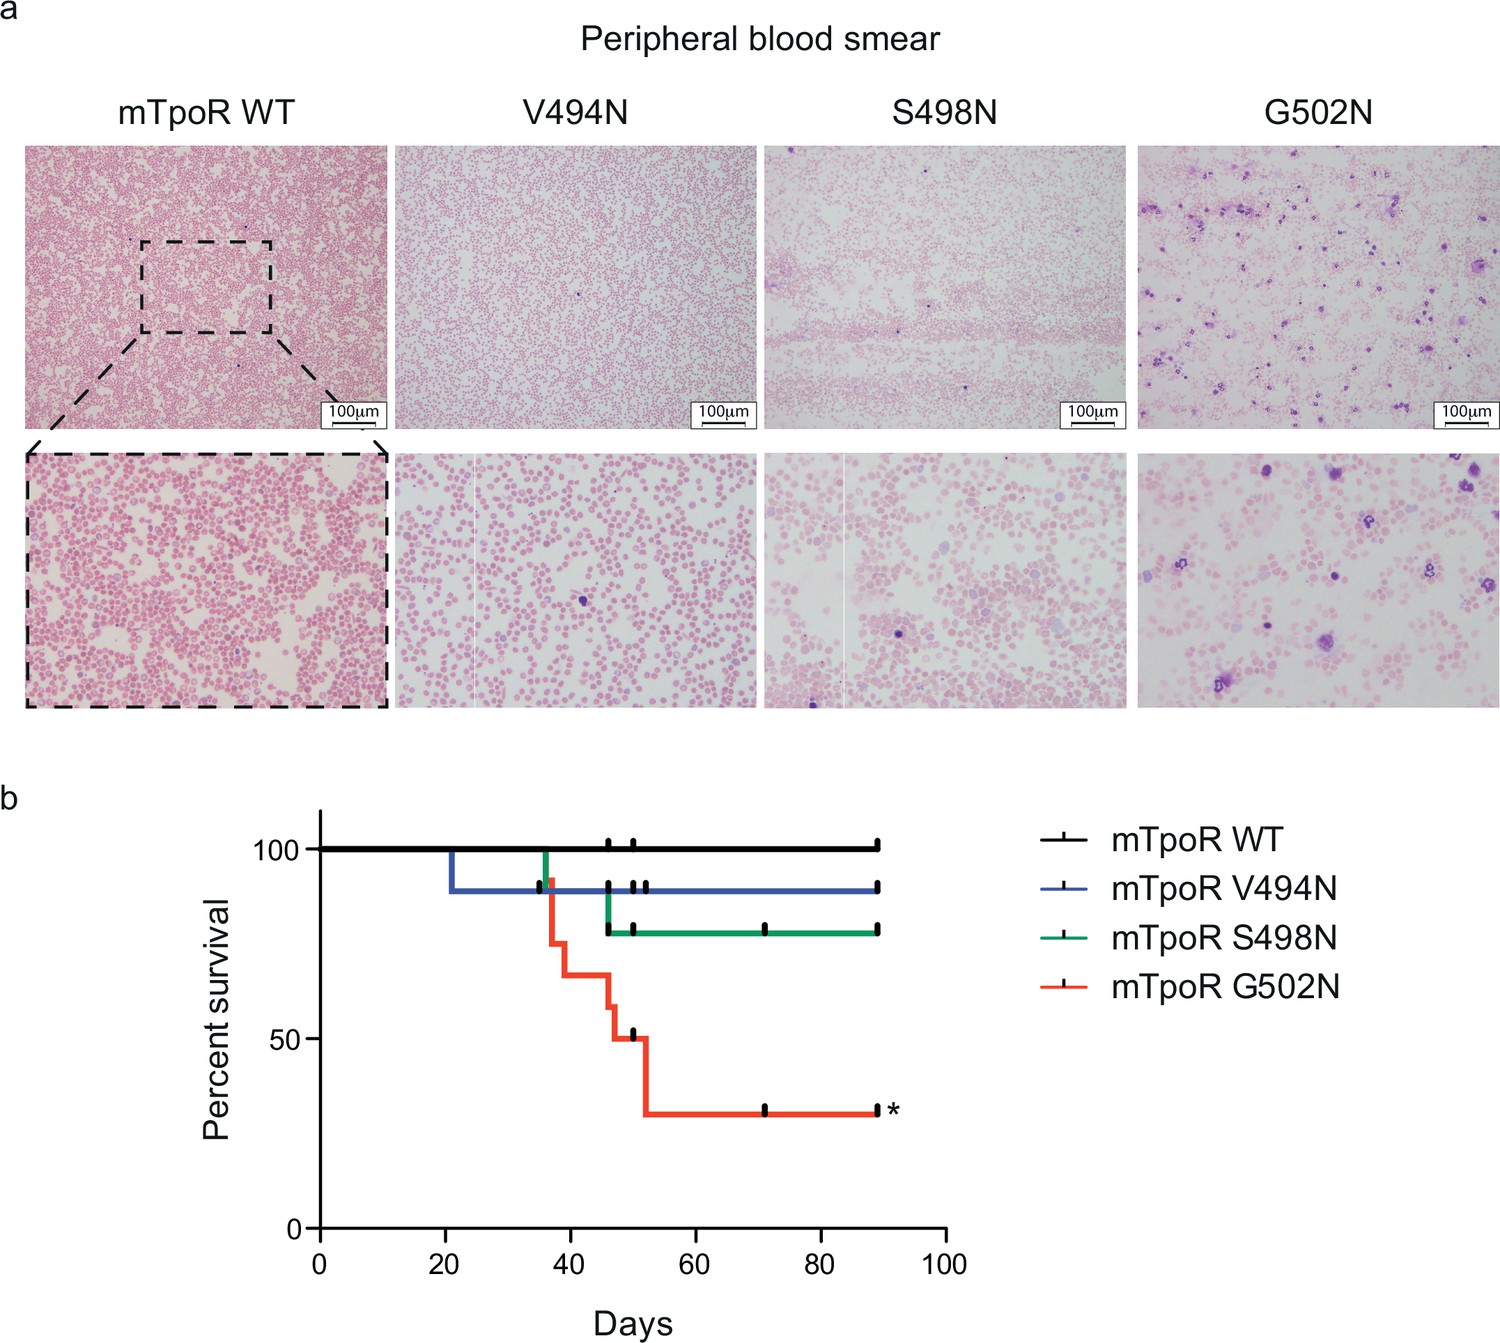
Mouse models expressing V494N, S498N, and G502N mutants of thrombopoietin receptor (TpoR) show weak, mild, and strong signs of myeloproliferation with a significant reduction of survival in the case of G502N mutants.
Peripheral blood smears from mouse models expressing the indicated constructs were stained with May–Grunwald Giemsa (×10). 3× zoom was performed on the .jpg file with Adobe Illustrator. (a) Kaplan–Meier survival analysis was performed on the indicated mice. The G502N model shows significant decrease of survival with a median survival of 49.5 d in the G502N mice. Statistical analysis was performed using the Mantel–Cox Test. *p<0.05 (b).
-
Figure 2—figure supplement 1—source data 1
Raw data and statistics (Prism 9.1.2) for Figure 2—figure supplement 1b.
Survival after transplantation of C57BL/6 female mice with retrovirus-infected C57BL/6 male bone marrow for expression of murine thrombopoietin receptor (mTpoR) wild type (WT) or mutant.
- https://cdn.elifesciences.org/articles/81521/elife-81521-fig2-figsupp1-data1-v2.xlsx
Figure 3 with 3 supplements
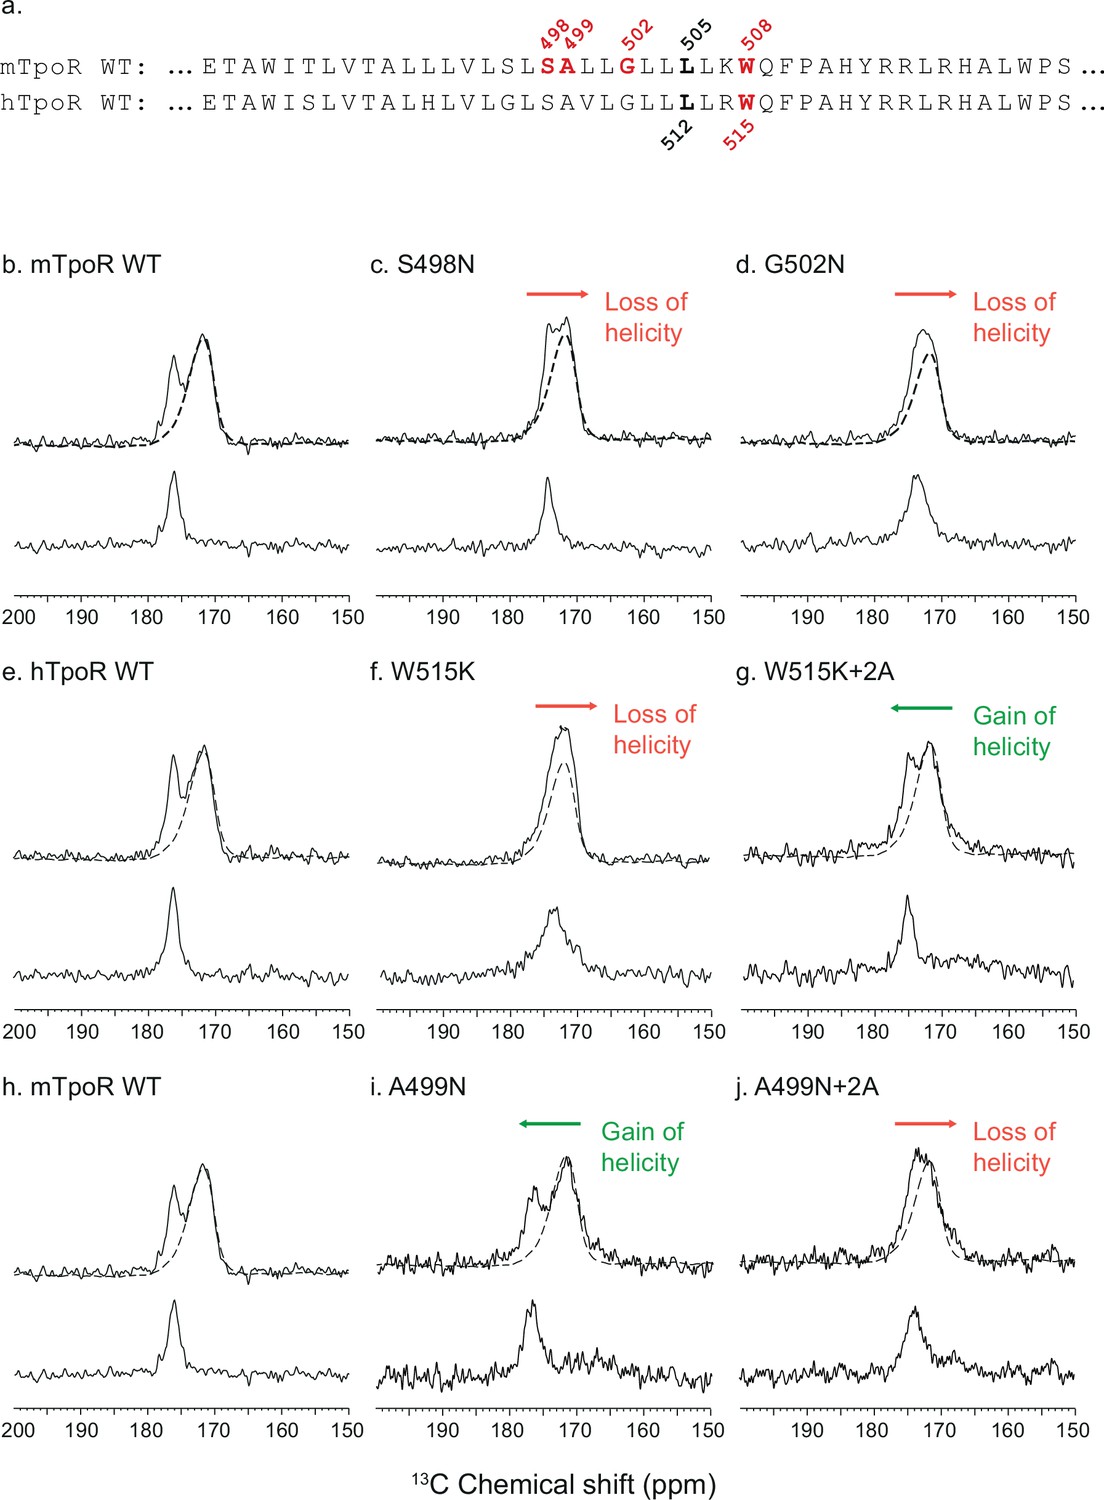
Secondary structure changes in the RWQFP insert upon activation.
For solid-state NMR studies, peptides corresponding to the transmembrane and juxtamembrane (TM-JM) regions of thrombopoietin receptor (TpoR) were reconstituted into model membrane bilayers (a). 1D 13C MAS NMR spectra in the region of the 13C=O carbonyl resonances are shown of murine TpoR (mTpoR) wild type (WT) (b), mTpoR S498N (c), mTpoR G502N (d), human TpoR (hTpoR) WT (e), hTpoR W515K (f), hTpoR W515K+2 alanines (+2A) (g), mTpoR WT (h), mTpoR A499N (i), and mTpoR A499N+2A (j). The mTpoR peptides labeled with 1-13C L505 (murine) or 1-13C L512 (human) were reconstituted into DMPC:PG bilayers. A single MAS NMR spectrum of unlabeled mTpoR or hTpoR (dashed line) was obtained with a high signal:noise ratio for subtraction from the spectra of the reconstituted labeled peptides to obtain the resonance of the L505 (murine) or L512 (human) 13C=O in the lower panels. For the reconstituted 13C-labeled peptides, two independent technical replicates (reconstitutions and NMR data sets) were obtained for each experiment.
Figure 3—figure supplement 1
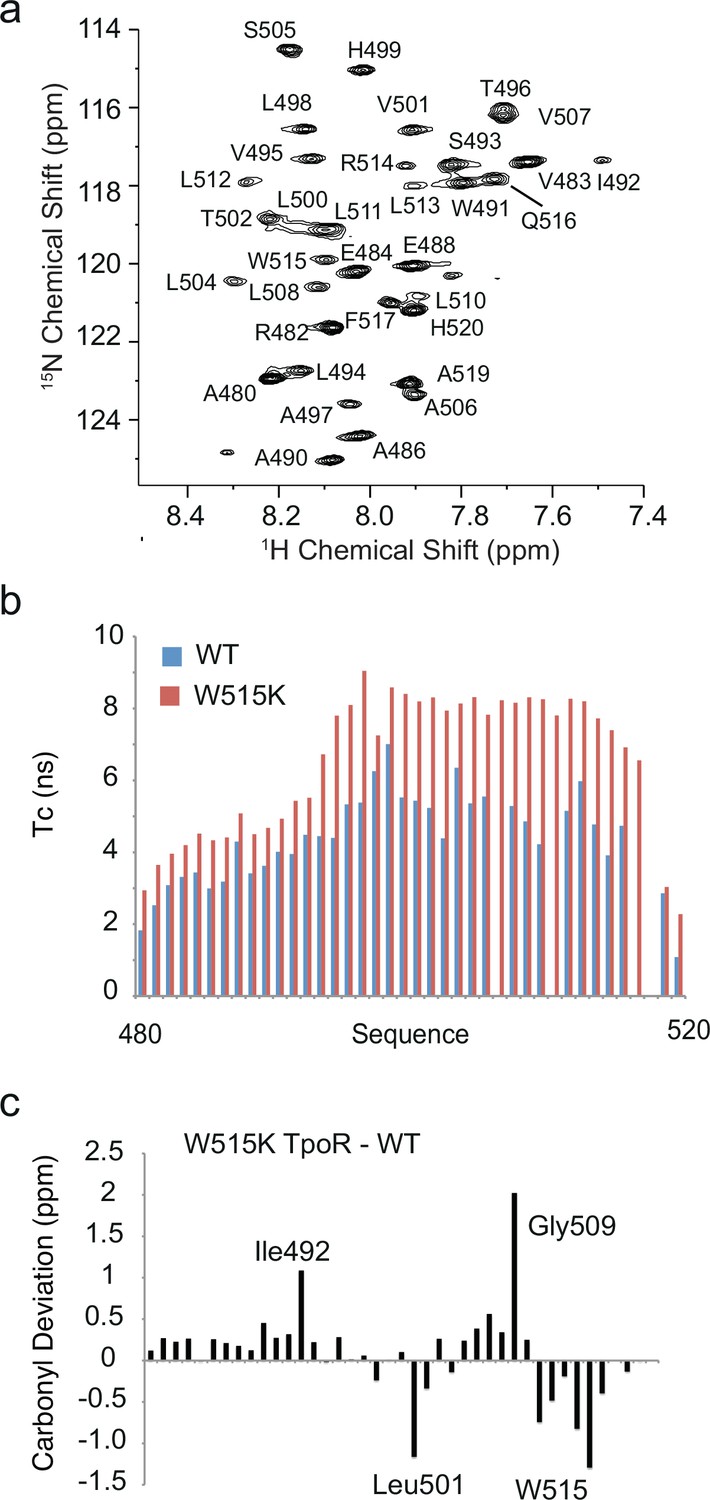
Solution NMR comparison of wild-type and W515K thrombopoietin receptor (TpoR) transmembrane peptides.
Solution NMR spectroscopy provides an alternative method to investigate structural changes in the TM-JM boundary of the TpoR upon mutation. We have probed the structural changes occurring between the wild-type hTpoR and the W515K mutant using 13C, 15N labeled TM-JM peptides expressed in E. coli and solubilized in detergent micelles (Brett, 2012). The construct sequence chosen (residues 481–520) stretches from the end of the β-sheet rich D2 domain on the extracellular side of the TM region of the receptor to two residues after Pro518 of the cytoplasmic RWQFP motif. (a) 1H-15N HSQC spectrum of wild-type human TpoR (residues 481–520) reconstituted into sodium dodecylsulfate (SDS) detergent micelles. Threonine and glycine resonances below 114 ppm are not shown in order to highlight the dispersion of the 1H-15N resonances. The concentration of the TpoR peptide was 1 mM in 10 mM sodium phosphate, pH 4.7, 85× CMC d25-SDS, and 10% D2O (v:v). Spectra were collected at 320 K, 32 scans each. (b) Calculated values of τc values for the WT and W515K human TpoR (481–520) in SDS micelles. The correlation time of each NH in the WT and the W515K samples was determined from the T1/T2 relaxation values according to Kay et al., 1989. The T1 relaxation times for the wild-type and W515K mutant were roughly the same, while the largest changes were in T2 values. The differences in T2 and calculated τc values reflect dimerization of the peptide in the W515K mutant. Blue = WT, red = W515K. The ability of the W515K peptide to dimerize in SDS micelles compared to the wild-type sequence mimics the observation of dimerization in membrane bilayers (Defour et al., 2013; Leroy et al., 2016). (c) Carbonyl chemical shift differences between W515K human TpoR (481–520) and wild-type human TpoR (481–520). The negative chemical shift differences indicate a lower frequency for the W515K mutant compared to wild-type. The upfield chemical shifts in the W515K mutant from Leu511 to the C-terminus are consistent with the carbonyl chemical shifts observed in the solid-state NMR resonances at Leu512 and are interpreted as unraveling of the C-terminus upon dimerization. The chemical shift difference at position 512 of –0.5 ppm in the solution NMR measurements is smaller than the difference in the solid-state NMR measurements of approximately –3 ppm. Similar results were obtained for the S505N mutant of TpoR (481–520) (45). The 13C=O assignments were made based on several 3D NMR experiments. HNCO, HNCACB, CBCACONH, HBHACONH, and 1H-15N-NOESY-HSQC spectra were collected on a 700 MHz Bruker DRX spectrometer equipped with a TXI-triple resonance probe at 320 K (Brett, 2012).
Figure 3—figure supplement 2
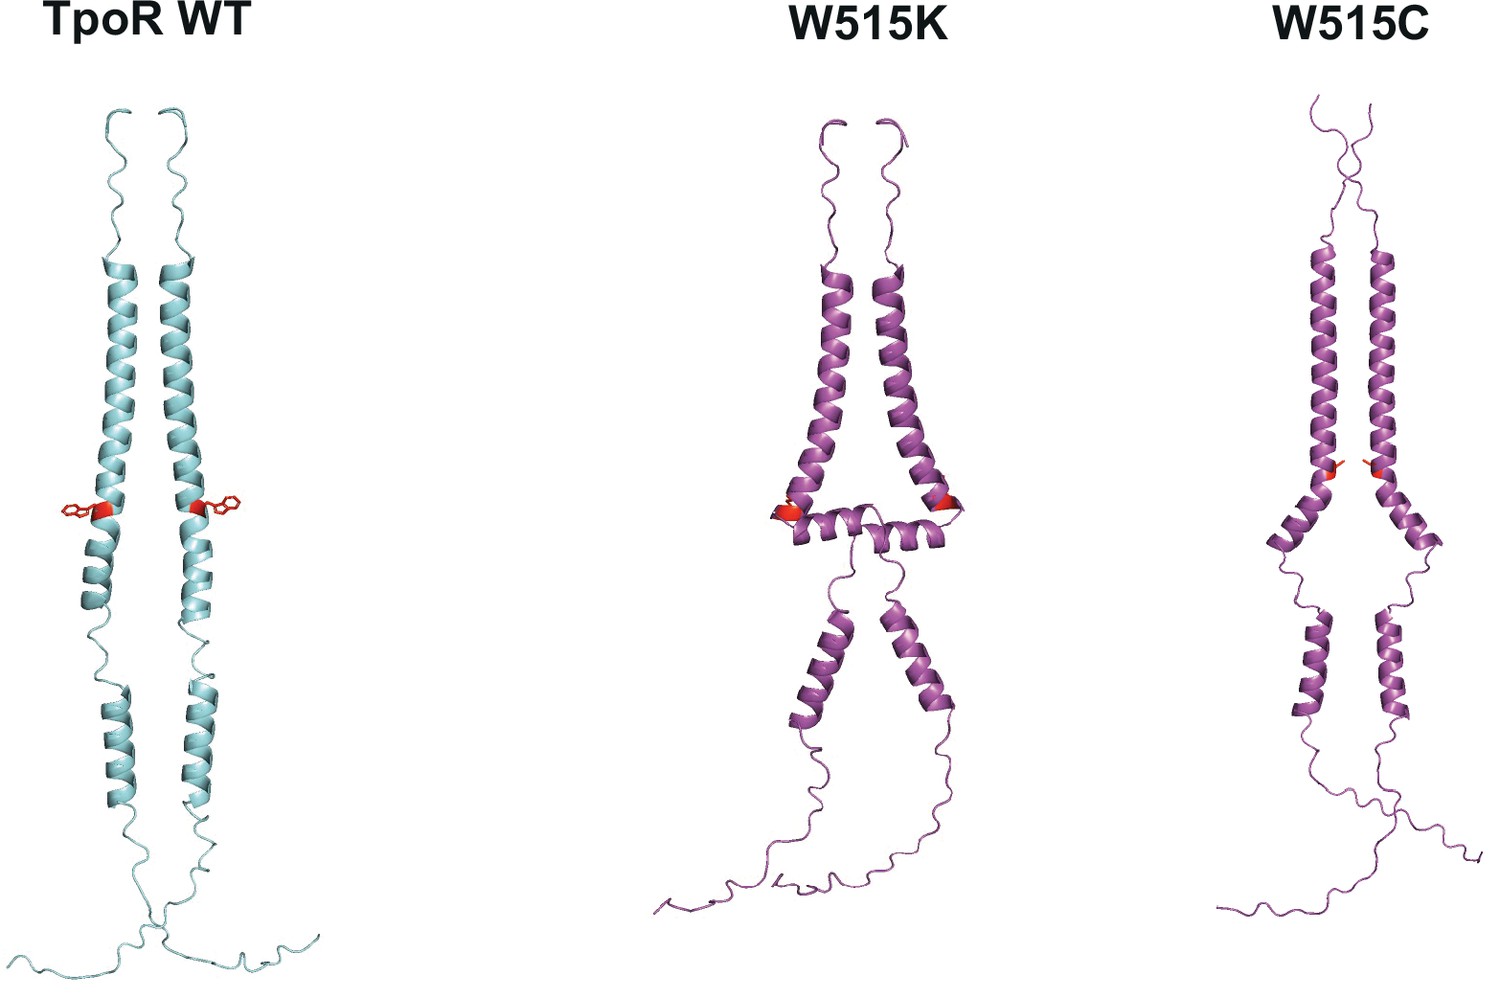
AlphaFold predictions of thrombopoietin receptor (TpoR) W515X mutants.
Predicted structures of key human TpoR mutants (purple) and wild type (blue). Residue 515 is shown in red. Predictions were performed with AlphaFold 2.0 (Jumper et al., 2021) running with mmSEQ2 for multiple sequence alignment (MSA).
Figure 3—figure supplement 3
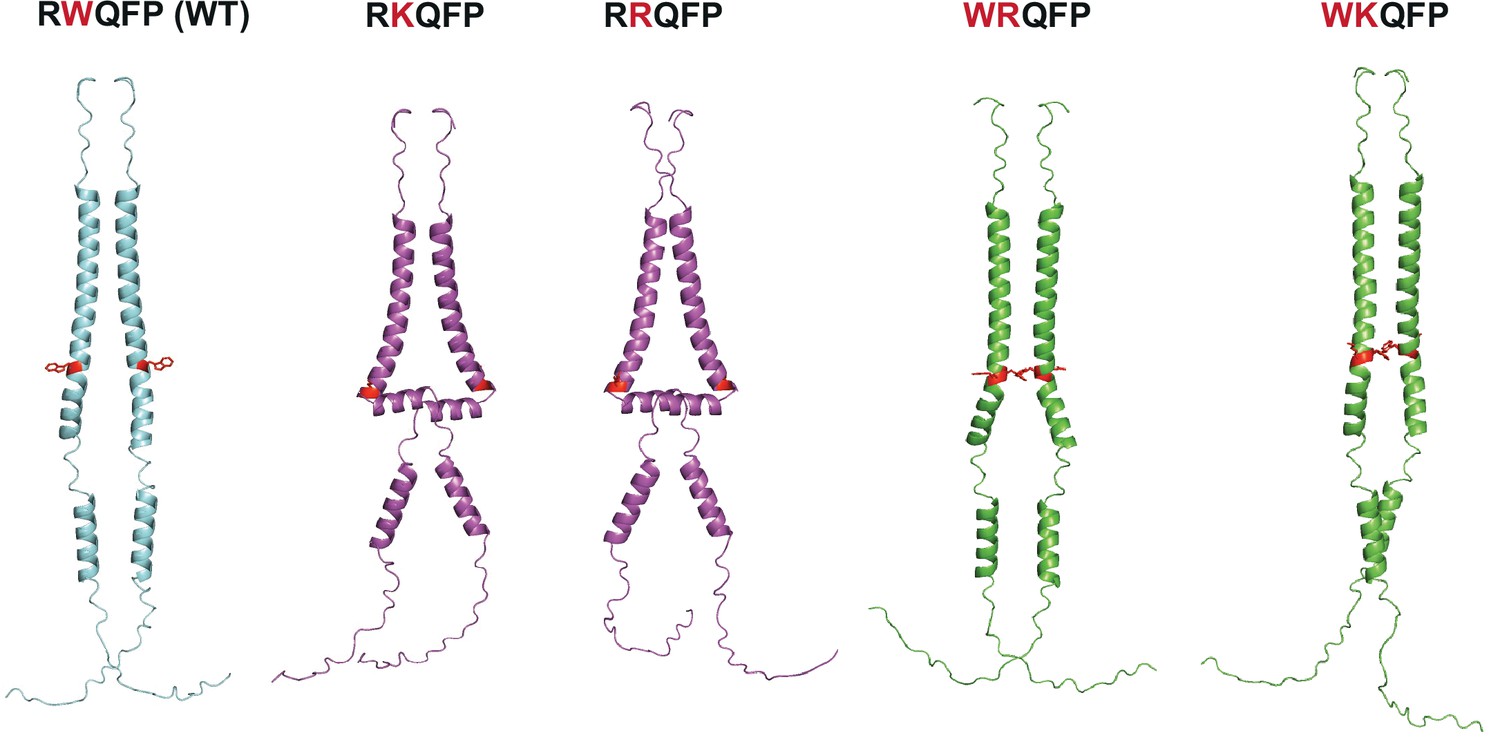
AlphaFold predictions of RRQFP, RKQFP, WRQFP, and WKQFP mutants.
AlphaFold 2.0 (Jumper et al., 2021) predictions of human thrombopoietin receptor (TpoR) (residues 474–573) wild-type (blue), active mutants (purple), and inactive mutants (green). The residue W515 and residues that differ from the wild-type sequence (W515K/R and R514W) are shown in red.
Figure 4 with 1 supplement
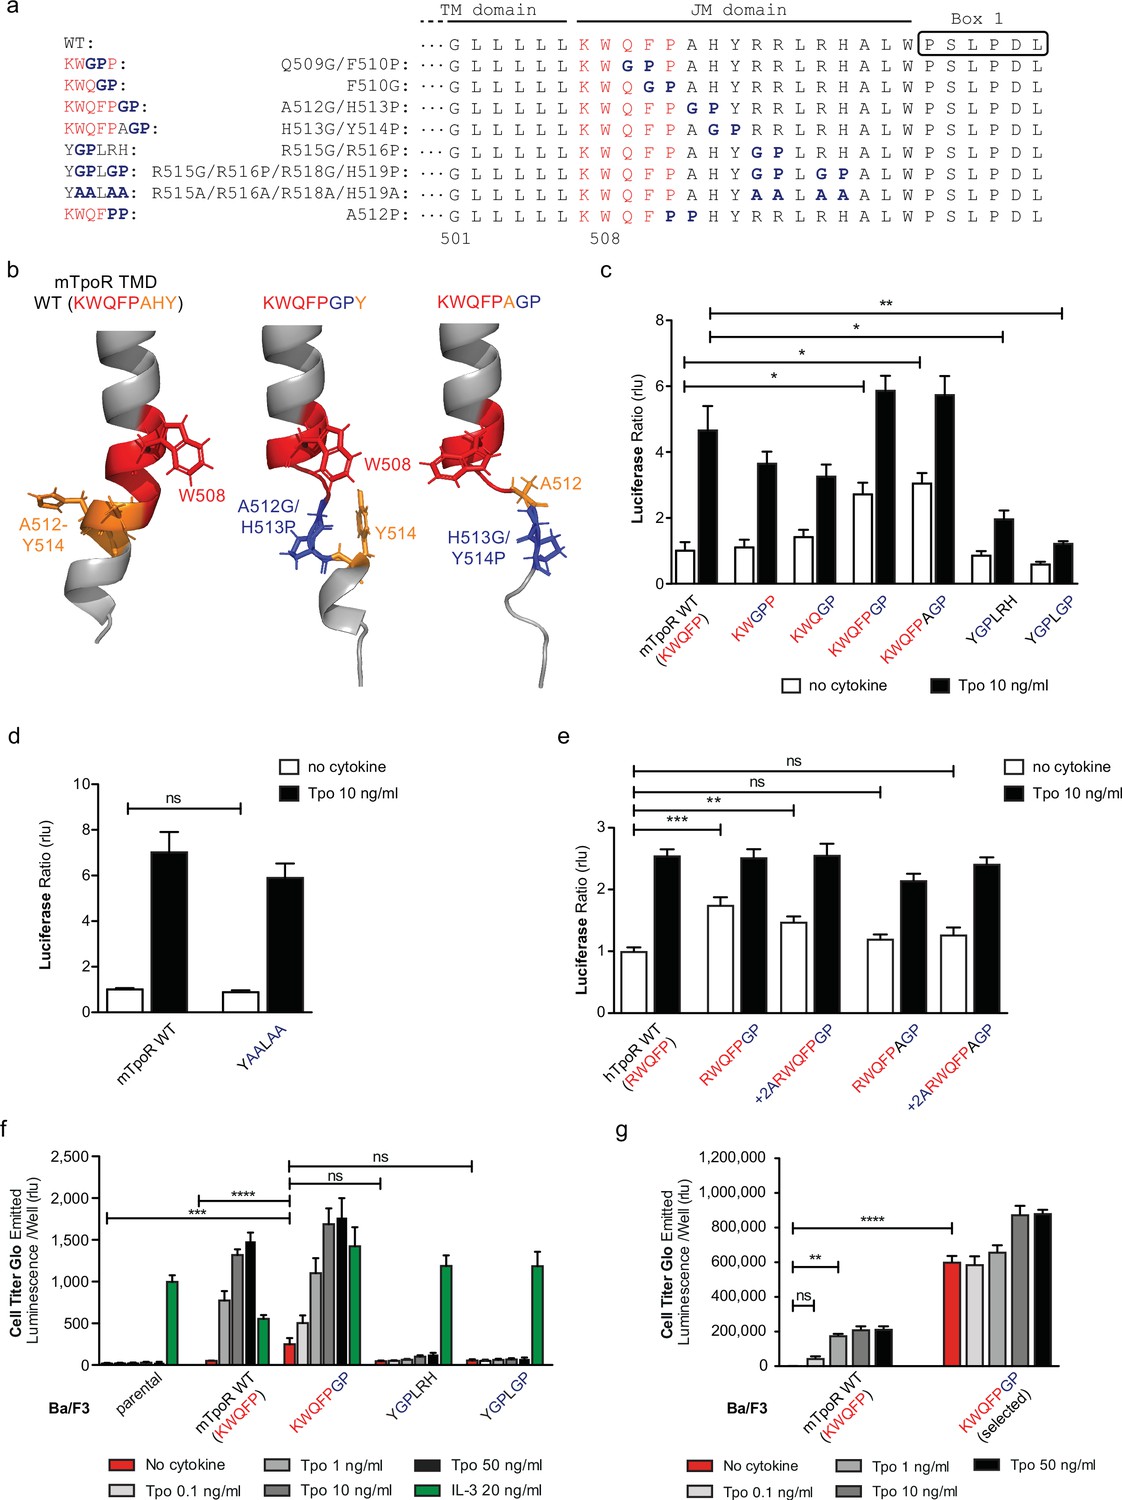
Localized substitution-induced loss of α-helicity of cytosolic juxtamembrane helix activates thrombopoietin receptor (TpoR) signaling in the absence of Tpo.
Sequences of transmembrane (TM) and juxtamembrane (JM) sequences of murine TpoR (mTpoR) and position of substitutions to Gly-Pro, which interrupt secondary helical structure, and Ala substitutions, which are predicted to maintain secondary structure (a). The human TpoR (hTpoR) numbering adds +7 in the TM domain. For example, W515 in hTpoR is W508 in mTpoR. Models generated with AlphaFold2 (Jumper et al., 2021; Varadi et al., 2022) of the murine TM-JM domain for the wild-type receptor and with introduction of the GP mutation at position 512–513 and 513–514 with local disruption of the helix (b). STAT5 transcriptional activity in the absence or presence of thrombopoietin (Tpo) of the indicated mTpoR (c, d) or hTpoR mutants (e) in γ–2A cells. Shown are averages of three independent experiments each done with 2–3 biological replicates ± SEM, Kruskal–Wallis nonparametric test with multiple-comparisons Steel’s test with control (jmp pro12); *p<0.05, **p<0.01. Short-term proliferation assay (Cell Titer Glo, Promega) was performed on stable Ba/F3 cell lines expressing the indicated mTpoR mutants stimulated or not with Tpo (0.1, 1, 10, and 50 ng/ml) or IL-3 (20 ng/ml) (f, g). Values shown represent the average of three, respectively two, independent experiments each done with three biological replicates ± SEM., Kruskal–Wallis nonparametric test with Dunn’s multiple-comparisons test (Prism 9.1.2); **p<0.01, ***p<0.001, ****p<0.0001, ns: nonsignificant.
-
Figure 4—source data 1
Raw data, scatter plot, and statistics (Prism 9.1.2, jmp pro12) for Figure 4c.
STAT5 transcriptional activity of the murine thrombopoietin receptor (mTpoR) wild type (WT) or mutant assessed in HEK-293T cells by luciferase assay with STAT5 reporter Spi-Luc.
- https://cdn.elifesciences.org/articles/81521/elife-81521-fig4-data1-v2.xlsx
-
Figure 4—source data 2
Raw data, scatter plot, and statistics (Prism 9.1.2, jmp pro12) for Figure 4d.
STAT5 transcriptional activity of the murine thrombopoietin receptor (mTpoR) wild type (WT) or mutant assessed in HEK-293T cells by luciferase assay with STAT5 reporter Spi-Luc.
- https://cdn.elifesciences.org/articles/81521/elife-81521-fig4-data2-v2.xlsx
-
Figure 4—source data 3
Raw data, scatter plot, and statistics (Prism 9.1.2, jmp pro12) for Figure 4e.
STAT5 transcriptional activity of the human thrombopoietin receptor (hTpoR) wild type (WT) or mutant assessed in HEK-293T cells by luciferase assay with STAT5 reporter Spi-Luc.
- https://cdn.elifesciences.org/articles/81521/elife-81521-fig4-data3-v2.xlsx
-
Figure 4—source data 4
Raw data, scatter plot, and statistics (Prism 9.1.2) for Figure 4f.
Short-term cell growth measured using the Cell-Titer-Glo luminescent cell viability assay with stable Ba/F3 cell lines expressing the murine thrombopoietin receptor (mTpoR) wild type (WT) or mutant with no ligand or increasing concentrations of Tpo ligand (0.1–50 ng/ml) or murine IL-3.
- https://cdn.elifesciences.org/articles/81521/elife-81521-fig4-data4-v2.xlsx
-
Figure 4—source data 5
Raw data, scatter plot, and statistics (Prism 9.1.2) for Figure 4g.
Short-term cell growth measured using the Cell-Titer-Glo luminescent cell viability assay with stable Ba/F3 cell lines expressing the murine thrombopoietin receptor (mTpoR) wild type (WT) or mutant with no ligand or increasing concentrations of Tpo ligand (0.1–50 ng/ml).
- https://cdn.elifesciences.org/articles/81521/elife-81521-fig4-data5-v2.xlsx
Figure 4—figure supplement 1
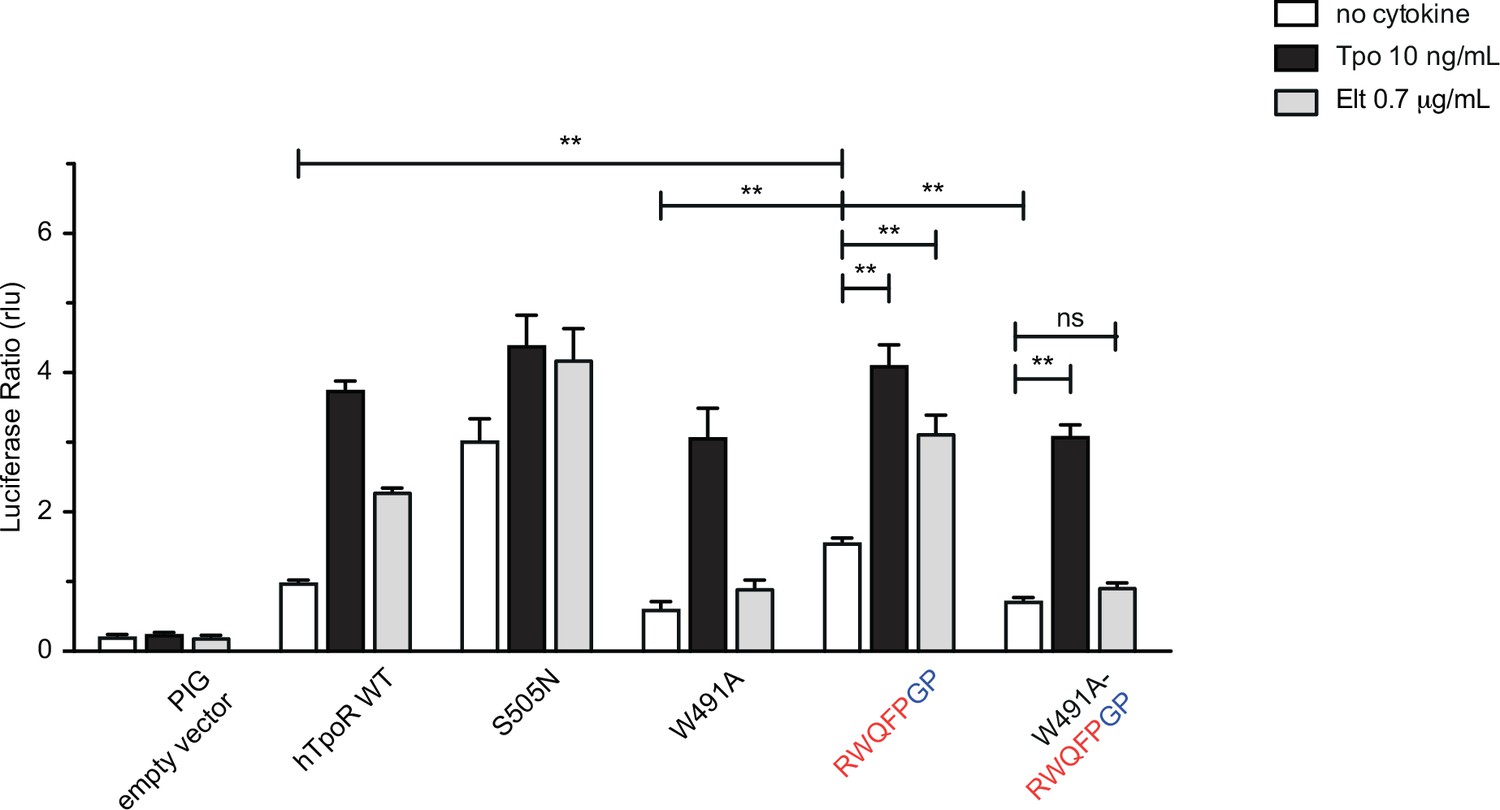
W491A mutation inhibits activation by Gly-Pro substitutions after the RWQFP motif.
STAT5 transcriptional activity reported by Spi-Luc in the absence or presence of thrombopoietin (Tpo) or eltrombopag (Elt) of human TpoR (hTpoR) wild type (WT) or mutants in HEK-239T cells. Shown are averages of three independent experiments each done with three biological replicates ± SEM, Kruskal–Wallis nonparametric test with multiple-comparisons Steel’s test with control (jmp pro12); *p<0.05, **p<0.01, ns, nonsignificant.
-
Figure 4—figure supplement 1—source data 1
Raw data, scatter plot, and statistics (Prism 9.1.2, jmp pro12) for Figure 4—figure supplement 1.
STAT5 transcriptional activity of the human thrombopoietin receptor (hTpoR) wild type (WT) or mutant assessed in HEK-293T cells by luciferase assay with STAT5 reporter Spi-Luc.
- https://cdn.elifesciences.org/articles/81521/elife-81521-fig4-figsupp1-data1-v2.xlsx
Figure 5
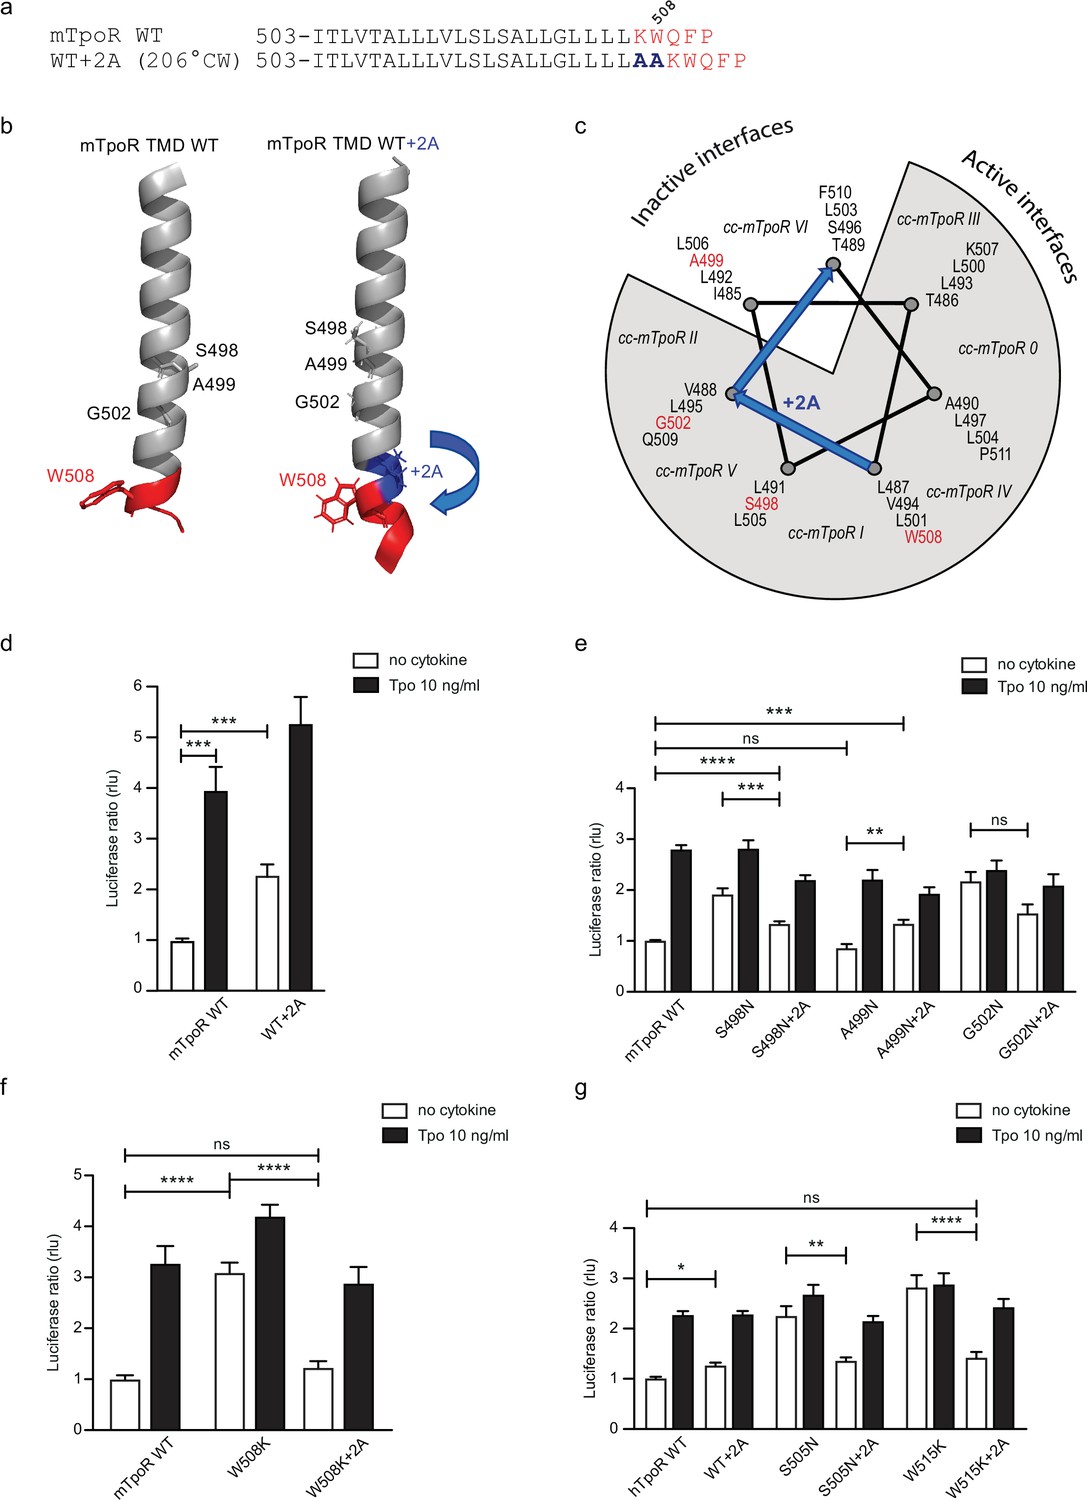
Effects of +2 alanine insertions on asparagine (Asn) and W508K mutants.
Alanine (Ala) insertion mutagenesis in the murine thrombopoietin receptor (mTpoR) at the indicated position is predicted to extend the helix and rotate clockwise by 206° (a). Model generated with AlphaFold2 (Jumper et al., 2021; Varadi et al., 2022) of wild type (WT) mTpoR transmembrane domain (TMD) (right panel) and with insertion of 2 Ala (right panel) (b). Helical wheel diagram showing the positions of residues I485 to F511 relative to active and inactive interfaces of mTpoR. In italic are indicated the positions of coiled coil (cc) fusion TpoR constructs (cc-mTpoR) each adopting a particular transmembrane dimeric interface as described in Staerk et al., 2011 (c). Spi-Luc STAT5 transcriptional activity in the absence or presence of thrombopoietin (Tpo) for the indicated mTpoR (d–f) or human TpoR (hTpoR) (g) WT or mutant constructs. Shown are averages of 3–10 independent experiments, each done with three biological replicates ± SEM in HEK293T cells and JAK2-deficient γ–2A cells; Kruskal–Wallis nonparametric test with multiple-comparisons Steel’s test with control (jmp pro12); *p<0.05, ***p<0.001, ns, nonsignificant.
-
Figure 5—source data 1
Raw data, scatter plot, and statistics (Prism 9.1.2, jmp pro12) for Figure 5d.
STAT5 transcriptional activity of the murine thrombopoietin receptor (mTpoR) wild type (WT) or mutant assessed in HEK-293T cells by luciferase assay with STAT5 reporter Spi-Luc.
- https://cdn.elifesciences.org/articles/81521/elife-81521-fig5-data1-v2.xlsx
-
Figure 5—source data 2
Raw data, scatter plot, and statistics (Prism 9.1.2, jmp pro12) for Figure 5e.
STAT5 transcriptional activity of the murine thrombopoietin receptor (mTpoR) wild type (WT) or mutant assessed in HEK-293T cells by luciferase assay with STAT5 reporter Spi-Luc.
- https://cdn.elifesciences.org/articles/81521/elife-81521-fig5-data2-v2.xlsx
-
Figure 5—source data 3
Raw data, scatter plot, and statistics (Prism 9.1.2, jmp pro12) for Figure 5f.
STAT5 transcriptional activity of the murine thrombopoietin receptor (mTpoR) wild type (WT) or mutant assessed in HEK-293T cells by luciferase assay with STAT5 reporter Spi-Luc.
- https://cdn.elifesciences.org/articles/81521/elife-81521-fig5-data3-v2.xlsx
-
Figure 5—source data 4
Raw data, scatter plot, and statistics (Prism 9.1.2, jmp pro12) for Figure 5g.
STAT5 transcriptional activity of the human thrombopoietin receptor (hTpoR) wild type (WT) or mutant assessed in HEK-293T cells by luciferase assay with STAT5 reporter Spi-Luc.
- https://cdn.elifesciences.org/articles/81521/elife-81521-fig5-data4-v2.xlsx
Figure 6 with 1 supplement
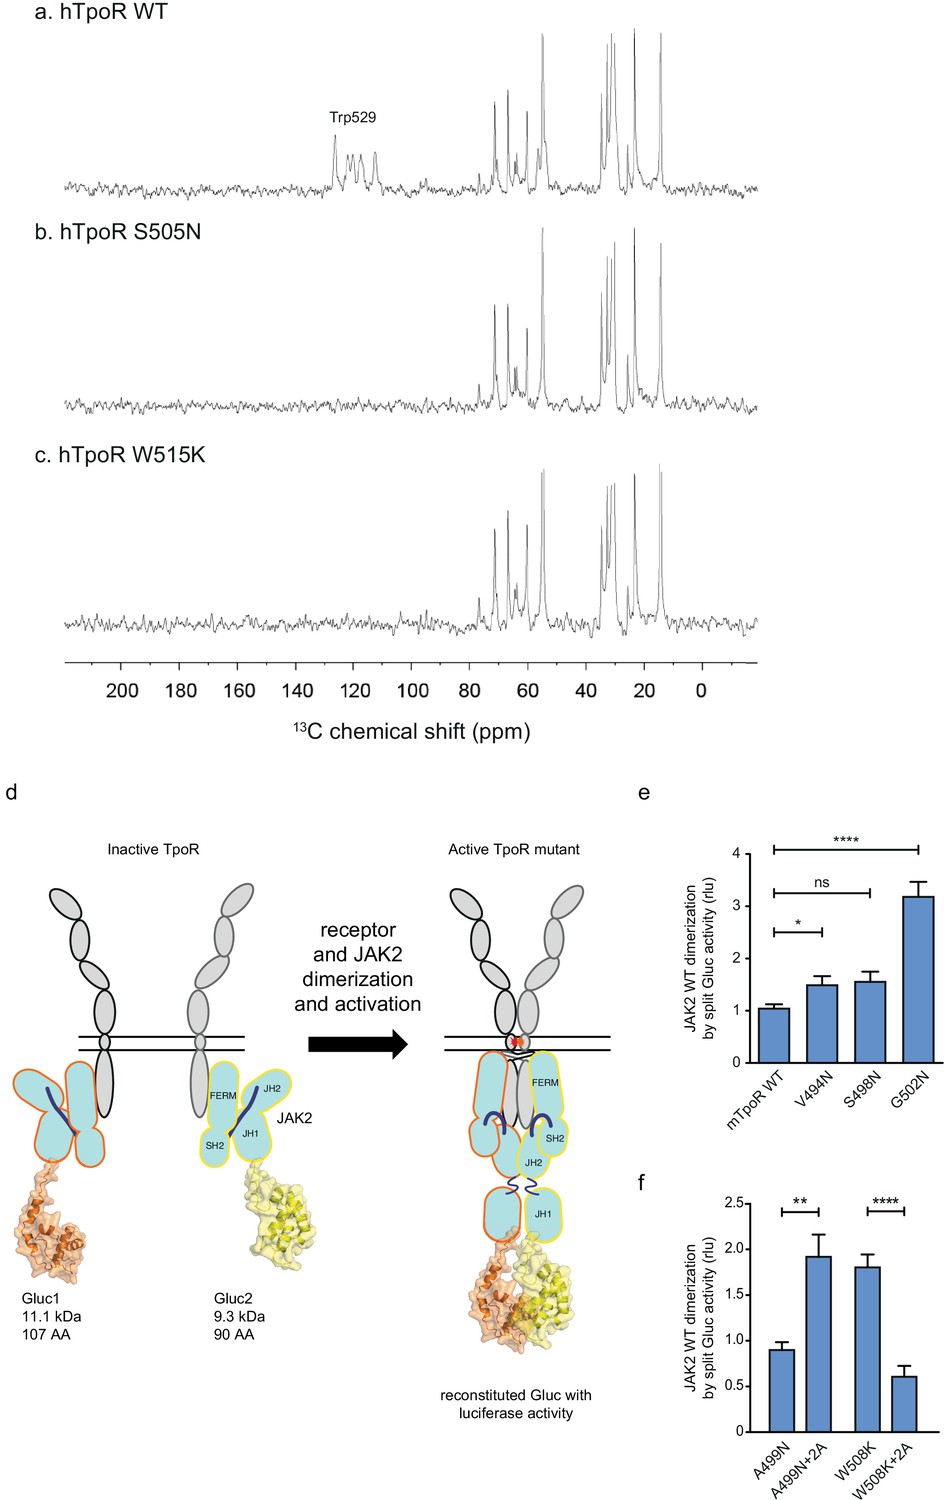
Thrombopoietin receptor (TpoR) transmembrane domain dimerization induces membrane binding of the C-terminal switch region and influence the proximity between JAK2 domains.
Solid-state 13C NMR experiments using magic angle spinning and the INEPT pulse sequence were used to address membrane binding in the juxtamembrane (JM) region of the transmembrane and juxtamembrane (TM-JM) peptides of human TpoR (hTpoR). INEPT spectra were obtained at 37°C using hTpoR reconstituted into DMPC:PG bilayers. TpoR peptides were U-13C labeled at W529 at the C-terminus of the switch region. Two independent technical replicates (reconstitutions and NMR data sets) were obtained for each experiment (a–c). Dimerization of JAK2 bound to the indicated murine TpoRs (mTpoR) was assessed by Gaussia luciferase in HEK-293T cells (d–f). Shown are averages of separate experiments ± SEM (n = 8); each experiment being performed with three biological repeats for each condition (triplicates). Kruskal–Wallis nonparametric test with multiple-comparisons Steel’s test with controls (jmp pro12); **p<0.01, ****p<0.0001.
-
Figure 6—source data 1
Raw data, scatter plot, and statistics (Prism 9.1.2, jmp pro12) for Figure 6e.
JAK2 wild type (WT) dimerization induced by the murine thrombopoietin receptor (mTpoR) WT or mutant assessed in HEK-293T cells by split Gaussia-luciferase.
- https://cdn.elifesciences.org/articles/81521/elife-81521-fig6-data1-v2.xlsx
-
Figure 6—source data 2
Raw data, scatter plot, and statistics (Prism 9.1.2, jmp pro12) for Figure 6f.
JAK2 wild type (WT) dimerization induced by the murine thrombopoietin receptor (mTpoR) WT or mutant assessed in HEK-293T cells by split Gaussia-luciferase.
- https://cdn.elifesciences.org/articles/81521/elife-81521-fig6-data2-v2.xlsx
-
Figure 6—source data 3
Raw data, scatter plot, and statistics (Prism 9.1.2, jmp pro12) for Figure 6f.
Kinase dead JAK2 K882D dimerization induced by the murine thrombopoietin receptor (mTpoR) wild type (WT) or mutant assessed in HEK-293T cells by split Gaussia-luciferase.
- https://cdn.elifesciences.org/articles/81521/elife-81521-fig6-data3-v2.xlsx
Figure 6—figure supplement 1

Dimerization of JAK2 is influenced by murine thrombopoietin receptor (TpoR) transmembrane mutations irrespectively of JAK2 activity.
Dimerization of kinase-dead JAK2 K882D bound to the indicated receptors was assessed by split Gaussia luciferase in HEK-293T cells. Shown are averages of separate experiments ± SEM (n = 5); each experiment being performed with three biological repeats for each condition (triplicates). Kruskal–Wallis nonparametric test with multiple-comparisons Steel’s test with controls (jmp pro12); *p<0.05, ***p<0.001, ns, nonsignificant.
Figure 7
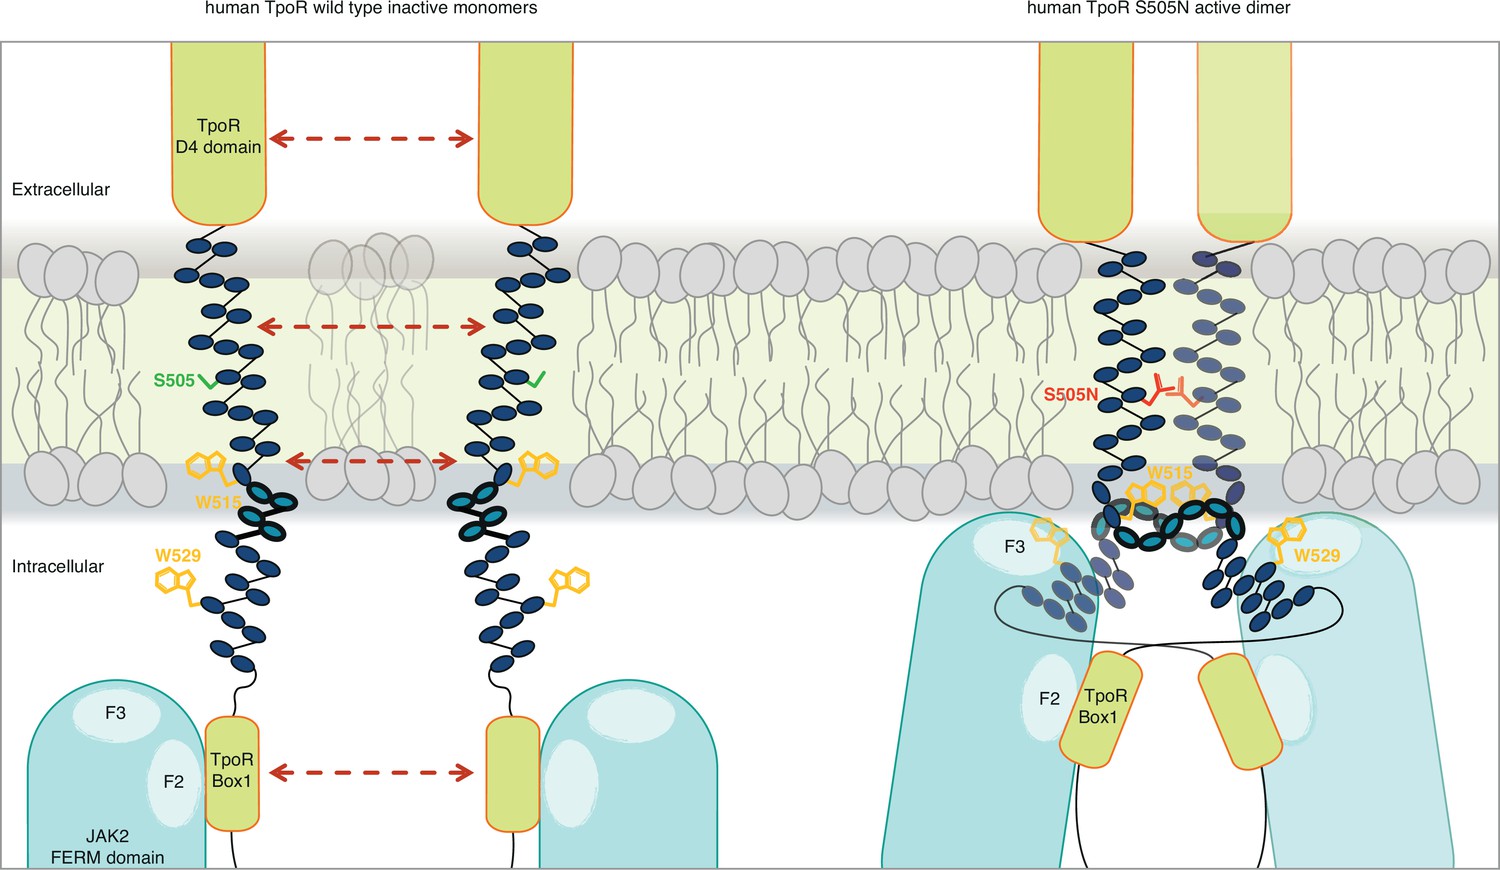
Canonical mutations S505N and W515K of the human thrombopoietin receptor (TpoR) found in myeloproliferative neoplasms activate the receptor in absence of its ligand by inducing a localized loss of helicity in the intracellular juxtamembrane domain.
This provides greater flexibility to allow the switch residues of TpoR to contact the F3 subdomain of the JAK2 appended to the other receptor chain in the dimer and eventually reorient the bound JAK2 molecules. Cartoon depicting human TpoR wild type inactive monomers and canonical S505N mutant in an active dimer conformation, with the appended JAK2 molecules.
Tables
Table 1
AlphaFold prediction of human thrombopoietin receptor (TpoR) W515X mutants.
Summary of the AlphaFold 2.0 (Jumper et al., 2021) predictions of human TpoR W515X. The simulations were performed on human TpoR residues 474–573 containing the transmembrane and juxta-membrane domains until Box 2. The absence or presence of unfolding around in the RWQFP motif is indicated, together with the position where loss of helicity occurs.
| TpoR mutation | Unfolding? | Start unfolding residue | Remarks |
|---|---|---|---|
| WT | No | NA | NA |
| W515A | Yes | Q516 | NA |
| W515C | No | NA | Kink increased at Q516 |
| W515D | Yes | Q516 | NA |
| W515E | No | NA | Kink increased at Q516 |
| W515F | Yes | Q516 | NA |
| W515G | Yes | G515 | Incomplete/partial unfolding |
| W515H | Yes | Q516 | NA |
| W515I | Yes | Q516 | NA |
| W515K | Yes | Q516 | NA |
| W515L | Yes | Q516 | NA |
| W515N | No | NA | Kink increased at Q516 |
| W515M | Yes | Q516 | NA |
| W515P | No | NA | New/higher kink at P515 |
| W515Q | No | NA | Kink increased at Q516 |
| W515R | Yes | Q516 | NA |
| W515S | Yes | Q516 | NA |
| W515T | Yes | ||
| W515V | Yes | Q516 | NA |
| W515Y | Yes | Q515 | NA |
Table 2
Characteristics of mutants of the RWQFP motif.
Summary of the characteristics of mutants of the RWQFP motif displayed in Figure 3—figure supplement 3.
| TM-JM motif | Unfolding? | Constitutive activity? |
|---|---|---|
| RWQFP (WT) | No | No |
| RKQFP | Yes | Yes |
| RRQFP | Yes | Yes |
| WRQFP | No | No |
| WKQFP | No | No |
Additional files
-
Supplementary file 1
Plasmids and primers.
List of plasmids used throughout the experiments and primers used for various mutagenesis.
- https://cdn.elifesciences.org/articles/81521/elife-81521-supp1-v2.xlsx
-
Supplementary file 2
Cells.
List and origin of cells used throughout the in vitro experiments.
- https://cdn.elifesciences.org/articles/81521/elife-81521-supp2-v2.xlsx
-
Supplementary file 3
Mouse experiments.
Details and ethics of mice used throughout the in vivo experiments.
- https://cdn.elifesciences.org/articles/81521/elife-81521-supp3-v2.xlsx
-
MDAR checklist
- https://cdn.elifesciences.org/articles/81521/elife-81521-mdarchecklist1-v2.pdf
Download links
A two-part list of links to download the article, or parts of the article, in various formats.
Downloads (link to download the article as PDF)
Open citations (links to open the citations from this article in various online reference manager services)
Cite this article (links to download the citations from this article in formats compatible with various reference manager tools)
Constitutive activation and oncogenicity are mediated by loss of helical structure at the cytosolic boundary of thrombopoietin receptor mutant dimers
eLife 12:e81521.
https://doi.org/10.7554/eLife.81521


