A specific role for importin-5 and NASP in the import and nuclear hand-off of monomeric H3
- Division of Biomedical Sciences, Warwick Medical School, University of Warwick, United Kingdom
Figures
Figure 1 with 1 supplement

H3 and H4 dimerisation mutants translocate to the nucleus but do not incorporate into chromatin.
(A) Positions of fold-disruptor (FD) substitutions (asterisks) and helix-breaker (HB) insertions (brackets). (B) Positions of the FD mutations superimposed on the H3-H4 heterodimer (PDB: 2HUE). Residues targeted are shown in yellow for H3 and in orange for H4. (C) Non-folding mutants were expressed as eGFP C-terminal fusions and transiently transfected in HEK293-F cells. Mutants localise to the nucleus similar to wild-type, but do not incorporate into chromatin as visualised by cytoplasmic fluorescence during mitosis. Scale bar indicates 10 μm. (D) Fluorescence recovery after photo-bleaching (FRAP) analysis of wild-type and mutant histones. Bleached regions of the nuclei at t = 0 min are indicated. Immediate recovery of fluorescence after bleaching shows that the histone mutants are not chromatin-bound as are their wild-type counterparts. Note that histone mutants have a tendency to accumulate in nucleoli. (E) Wild-type and mutant eGFP fusions were affinity-purified using an anti-GFP nanobody, separated by SD-PAGE and stained with Coomassie. Positions of tagged and endogenous histones are indicated. Asterisk indicates free GFP and partial degradation products. (F) Western blot analysis of immunoprecipitated wild-type and histone mutants as shown in (E) probed for known histone interactors.
Figure 1—figure supplement 1
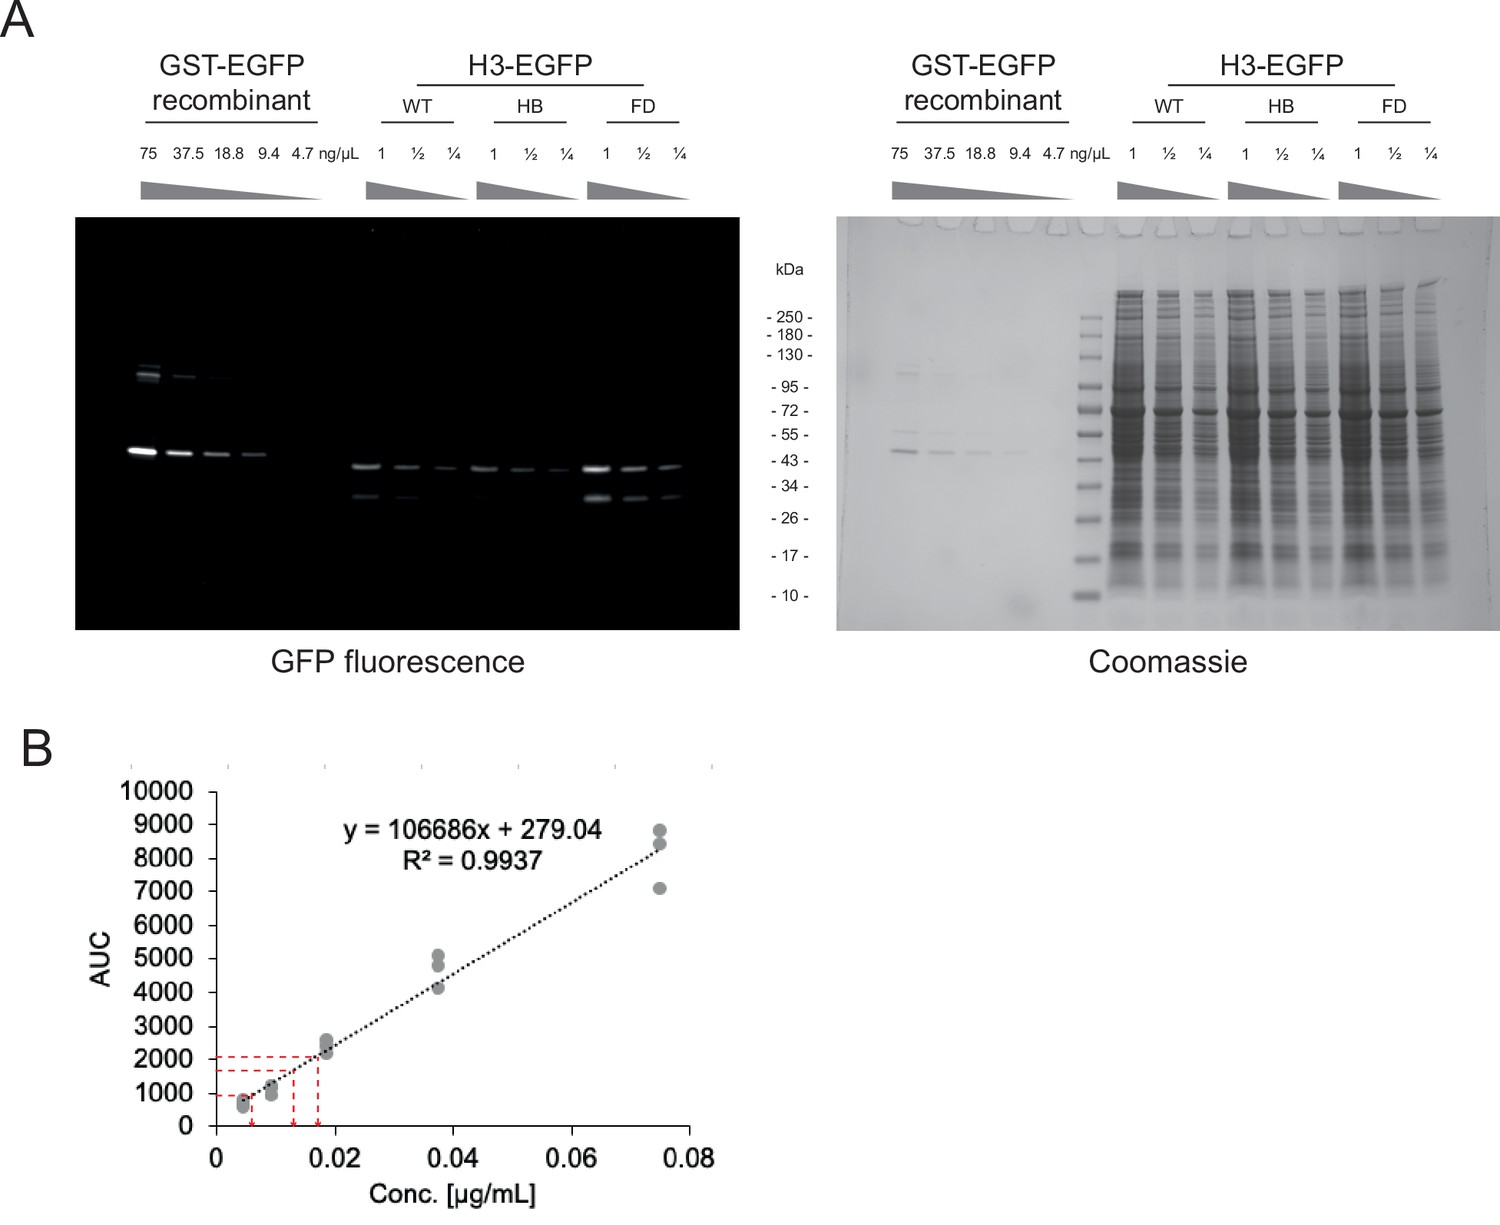
Calibration for precise input quantification.
(A) Residual fluorescence activity of GFP constructs on a semi-denaturing gel before staining (left) and after Coomassie staining (right). (B) Area under the curve (AUC) analysis of residual GFP fluorescent bands, for GST-GFP calibration curve and sample dilutions (red line).
Figure 2
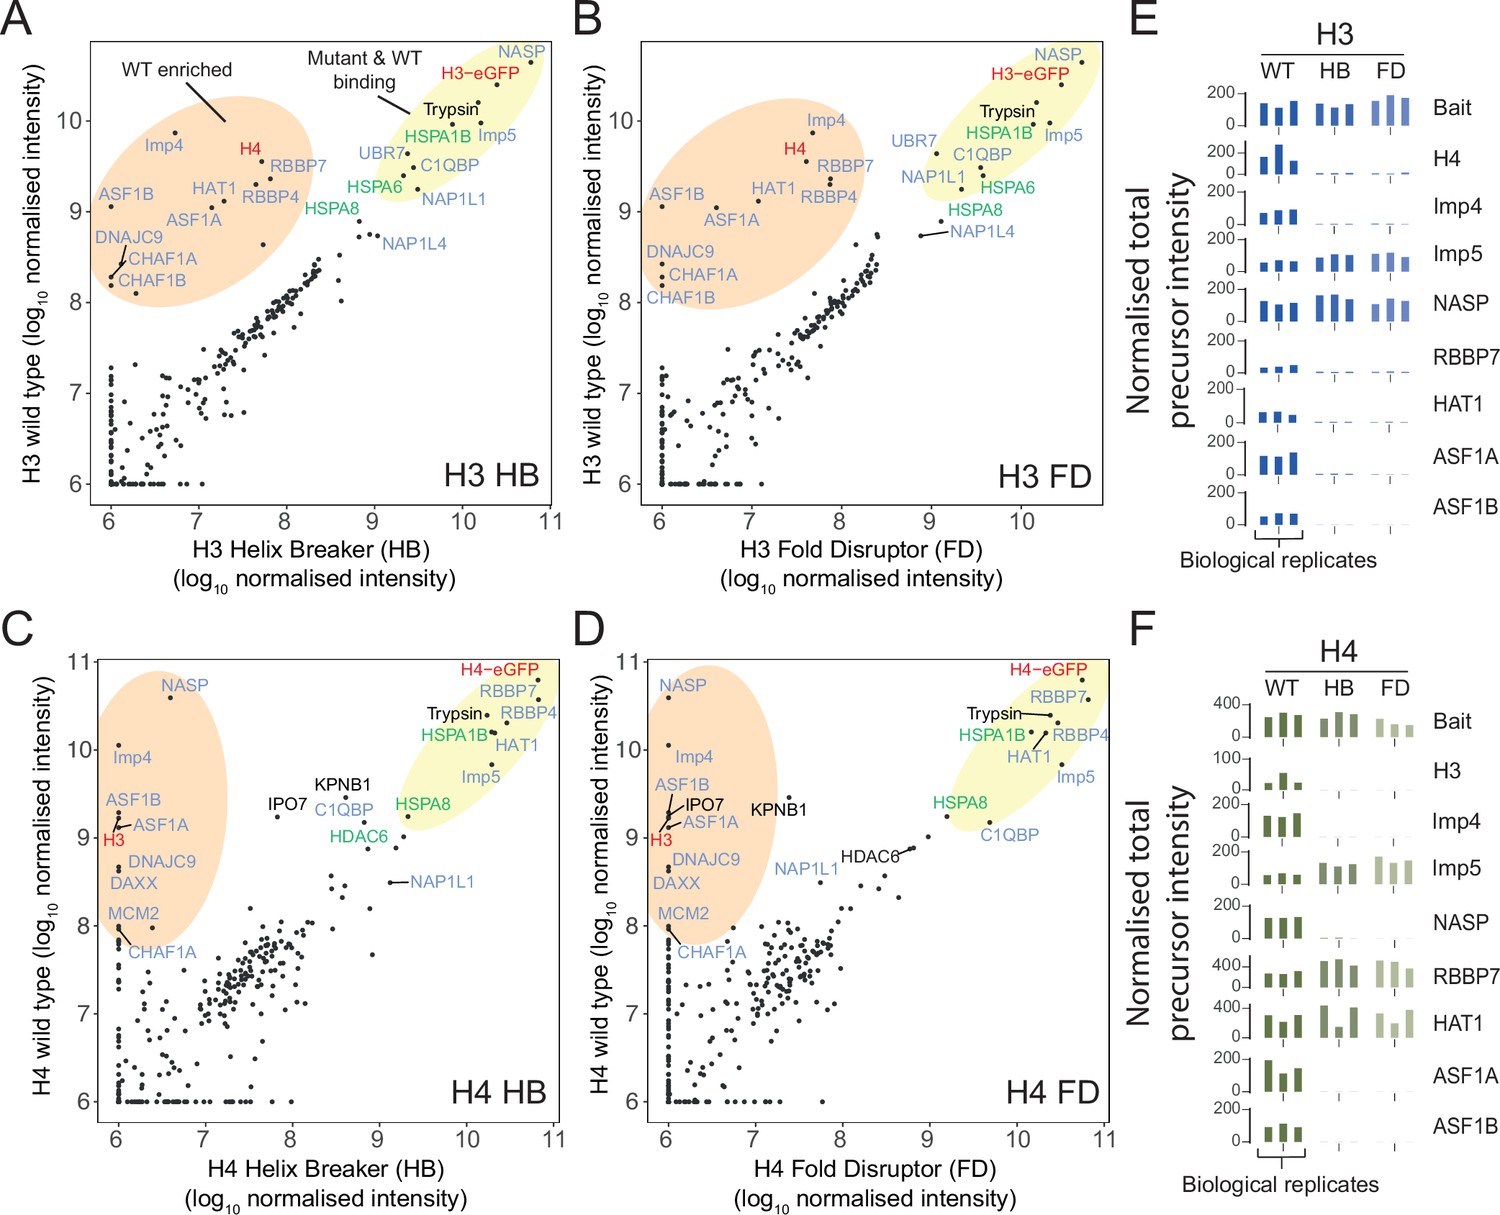
Proteomic analysis of wild-type (WT) and monomeric histone mutants.
(A–D) Mutant versus WT scatter plots of normalised total precursor intensity from H3 vs. HB (A), H3 vs. FD (B), H4 vs. HB (C), and H4 vs. FD (D). Average of three experiments. By plotting mutants versus WT, factors that interact at similar levels will lie on the diagonal, with those that have preference for the dimer or monomer to fall above or below the diagonal, respectively. Circled regions show factors that are enriched for the WT (orange) or that are equally enriched on the WT and mutant (yellow). Previously reported histone-binding proteins are coloured in blue, with HSC70 family members coloured in green. Histones are coloured in red. (E, F) Alternative representation of proteomics data showing quantitative values (normalised total precursor intensity) on a linear scale (1 × 10⁶) for each biological replicate of key factors identified in (A–D). HB, helix-breaker mutation; FD, fold-disruptor mutation.
-
Figure 2—source data 1
Processed mass spectrometry data for CoIP of H3-eGFP WT and mutants ‘helix breaker’ (H3 HB) and ‘fold-disruptor’ (H3 FD).
Limma linear model coefficients of normalised total precursor intensity used in Figure 2A, B and E.
- https://cdn.elifesciences.org/articles/81755/elife-81755-fig2-data1-v2.xlsx
-
Figure 2—source data 2
Processed mass spectrometry data for CoIP of H4-eGFP WT and mutants ‘helix breaker’ (H4 HB) and ‘fold-disruptor’ (H4 FD).
Limma linear model coefficients of normalised total precursor intensity used in Figure 2C, D and F.
- https://cdn.elifesciences.org/articles/81755/elife-81755-fig2-data2-v2.xlsx
Figure 3 with 3 supplements

NASP associates with an H3 monomer and H3-H4 dimers in discrete, multi-chaperone complexes.
(A) CRISPR knock-in tagging scheme. Endogenous NASP was tagged on exon 1 with eGFP-TEVcs and ASF1B with SpotTag-mCherry-3Ccs. (B) Histone chaperone immunoprecipitations separated by 15% SDS-PAGE and stained with Coomassie, for eGFP-sNASP and eGFP-ASF1B as stable HeLa cell lines, HEK293-F transient expression and CRISPR knock-in (as described in A). Asterisks mark previously published data (Apta-Smith et al., 2018). (C) Ratios of H3 compared to H4 associated with NASP and ASF1 from extracts stably expressed in a HeLa cell line, transiently expressed in HEK293-F cells or endogenously expressed in a CRISPR knock-in HeLa cell line. Background-corrected densitometry profiles for H3 and H4 were compared with purified recombinant H3-H4 dimers (n = 3, error bars = SD). (D) Fractionation by ultra-centrifugation on a glycerol gradient (4–20%) of immunoprecipitated eGFP-sNASP from transiently transfected HEK293-F cells (as in B) followed by SDS-PAGE, silver staining (top), and Western blot (bottom). Lane numbers correspond to glycerol fractions. Note that a species containing H3 but not H4 is clearly discernible (red arrows). (E) Native gel separation of immunoprecipitated eGFP-sNASP transiently expressed in HEK293-F cells (as in B) followed by SDS-PAGE, Coomassie staining (top) and Western blot (bottom). Blots were probed for known NASP-interacting factors. Note that a species containing H3 but not H4 is clearly discernible (red arrows). Band numbers correspond to gel sections that were analysed by mass spectrometry (as shown in G). (F) 2D native/SDS-PAGE as shown in (E), but using eGFP-NASP pulldowns from a HEK293-F knock-in cell population created identically to that shown in (A). Note that the tNASP isoform is more prevalent, but only the sNASP isoform co-migrates with monomeric H3. (G) Mass spectrometry identification of sNASP-interacting factors from gel slices shown in (E) (total precursor intensity). tNASP-specific peptides are shown separately to pan-NASP peptide. (H) Diagrammatic representation of NASP-containing complexes.
-
Figure 3—source data 1
Processed mass spectrometry data for eGFP-sNASP CoIP native gel bands.
Total precursor intensity used in Figure 3G.
- https://cdn.elifesciences.org/articles/81755/elife-81755-fig3-data1-v2.xlsx
Figure 3—figure supplement 1
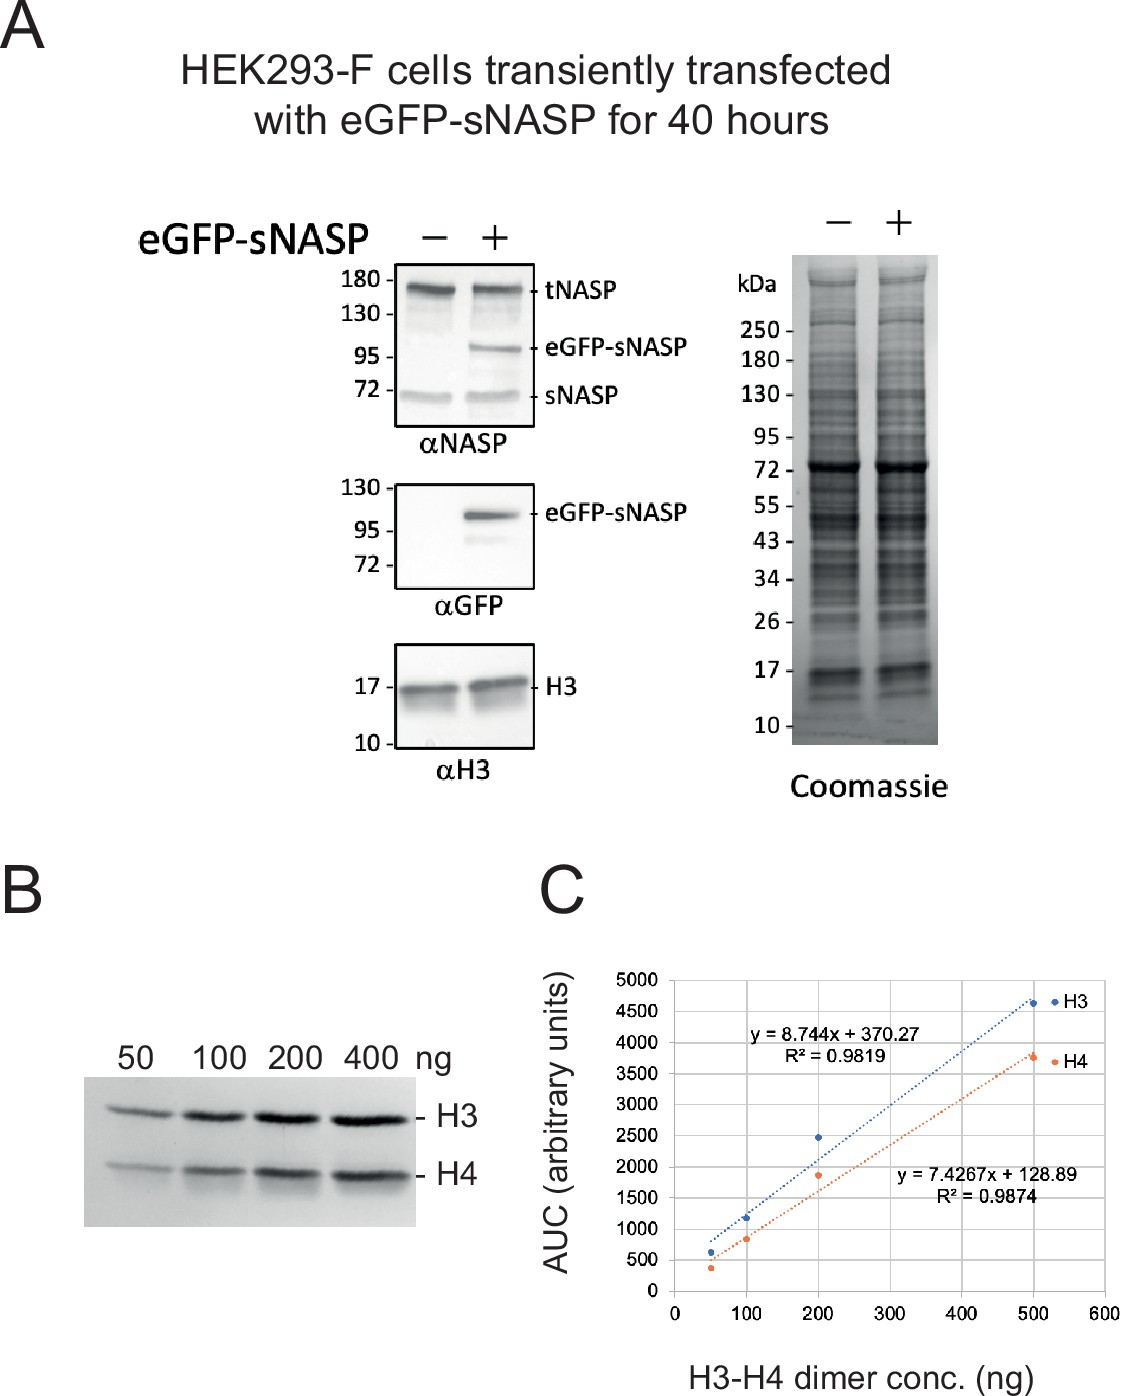
Comparision of wild type NASP with transiently expressed eGFP-sNASP and quantification of H3-H4 staining.
(A) Representative Western blot of HEK293-F cells transiently transfected as used for GFP-trap eGFP-sNASP Co-IPs (including glycerol gradient and 2D sub-complexes separations). (B) Serial dilutions for H3-H4 quantification (C). 50–400 ng of H3-H4 dimer was separated by SDS-PAGE and stained with Coomassie and quantified by densitometry as previously described (Apta-Smith et al., 2018).
Figure 3—figure supplement 2
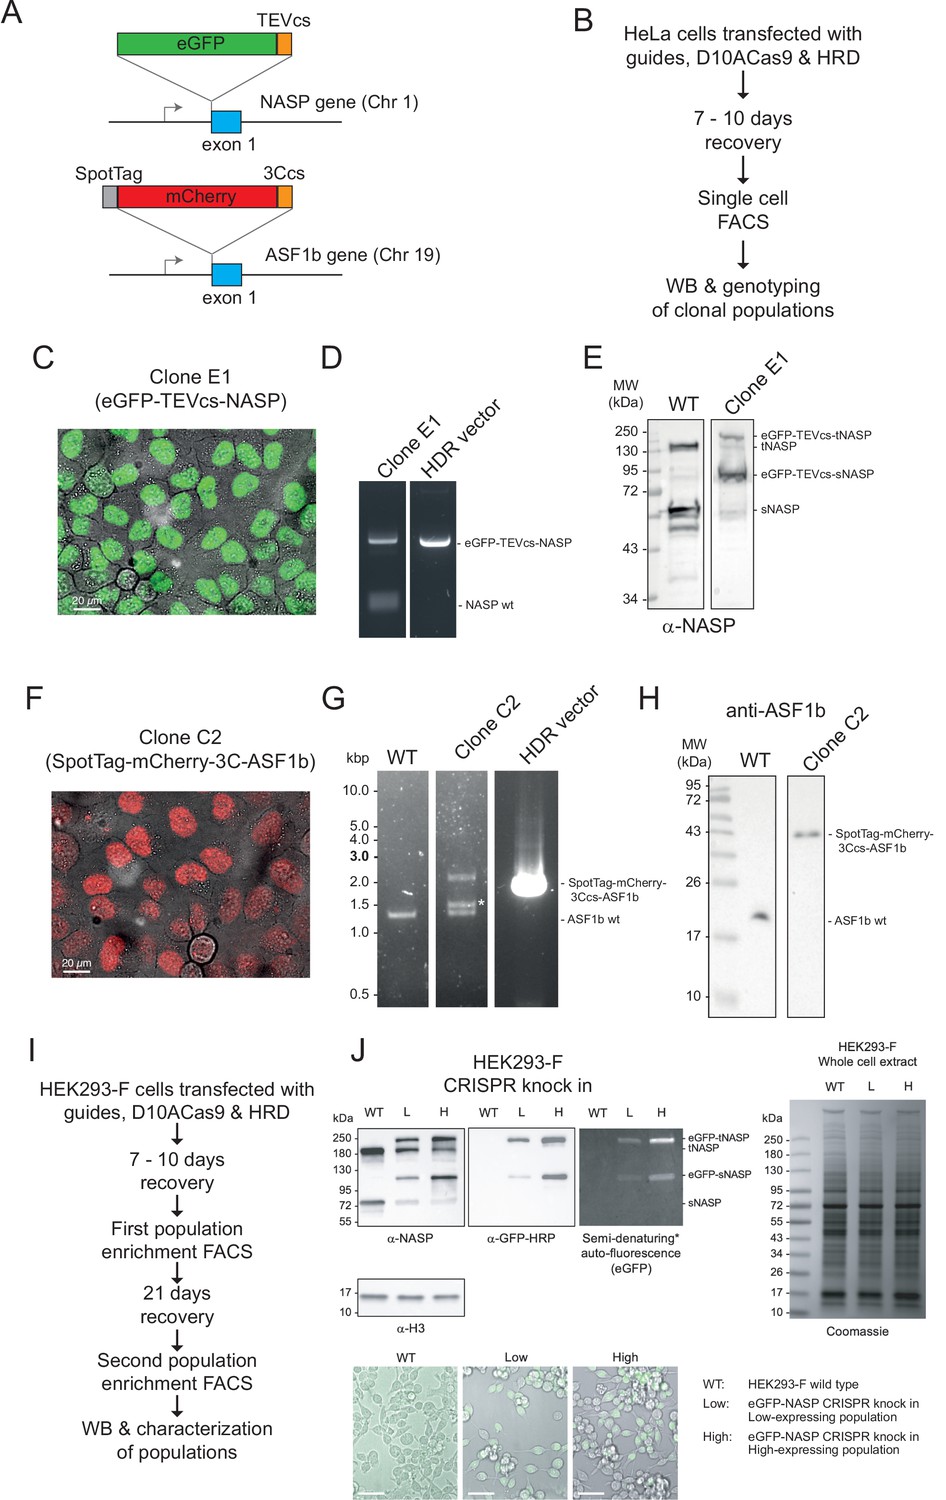
Validation of eGFP-TEVcs-NASP and mCherry-3C-ASF1b knock-in cell lines.
(A) CRISPR knock-in tagging scheme. Endogenous NASP was tagged on exon 1 with eGFP-TEVcs and ASF1B with SpotTag-mCherry-3Ccs. (B) Experimental design for HeLa CRISPR Knock-in clonal cell line selection. (C) Confocal microscopy, (D) genomic PCR, and (E) Western blot validation of the eGFP-NASP clonal line E1. (F) Microscopy, (G) PCR, and (H) Western blot for selected CRISPR knock-in mCherry- ASF1B clonal line C2. Observe that confocal microscopy demonstrates nuclear localisation, even expression, and complete penetration. (I) Experimental design for HEK293-F CRISPR knock-in cell population enrichment. (J) Western blot and confocal microscopy characterisation of the populations obtained by two rounds of fluorescence-activated cell sorting (FACS), corresponding to a heterozygous-enriched population (low, L) and a homozygous-enriched population (high, H). Bar = 50 µm.
Figure 3—figure supplement 3
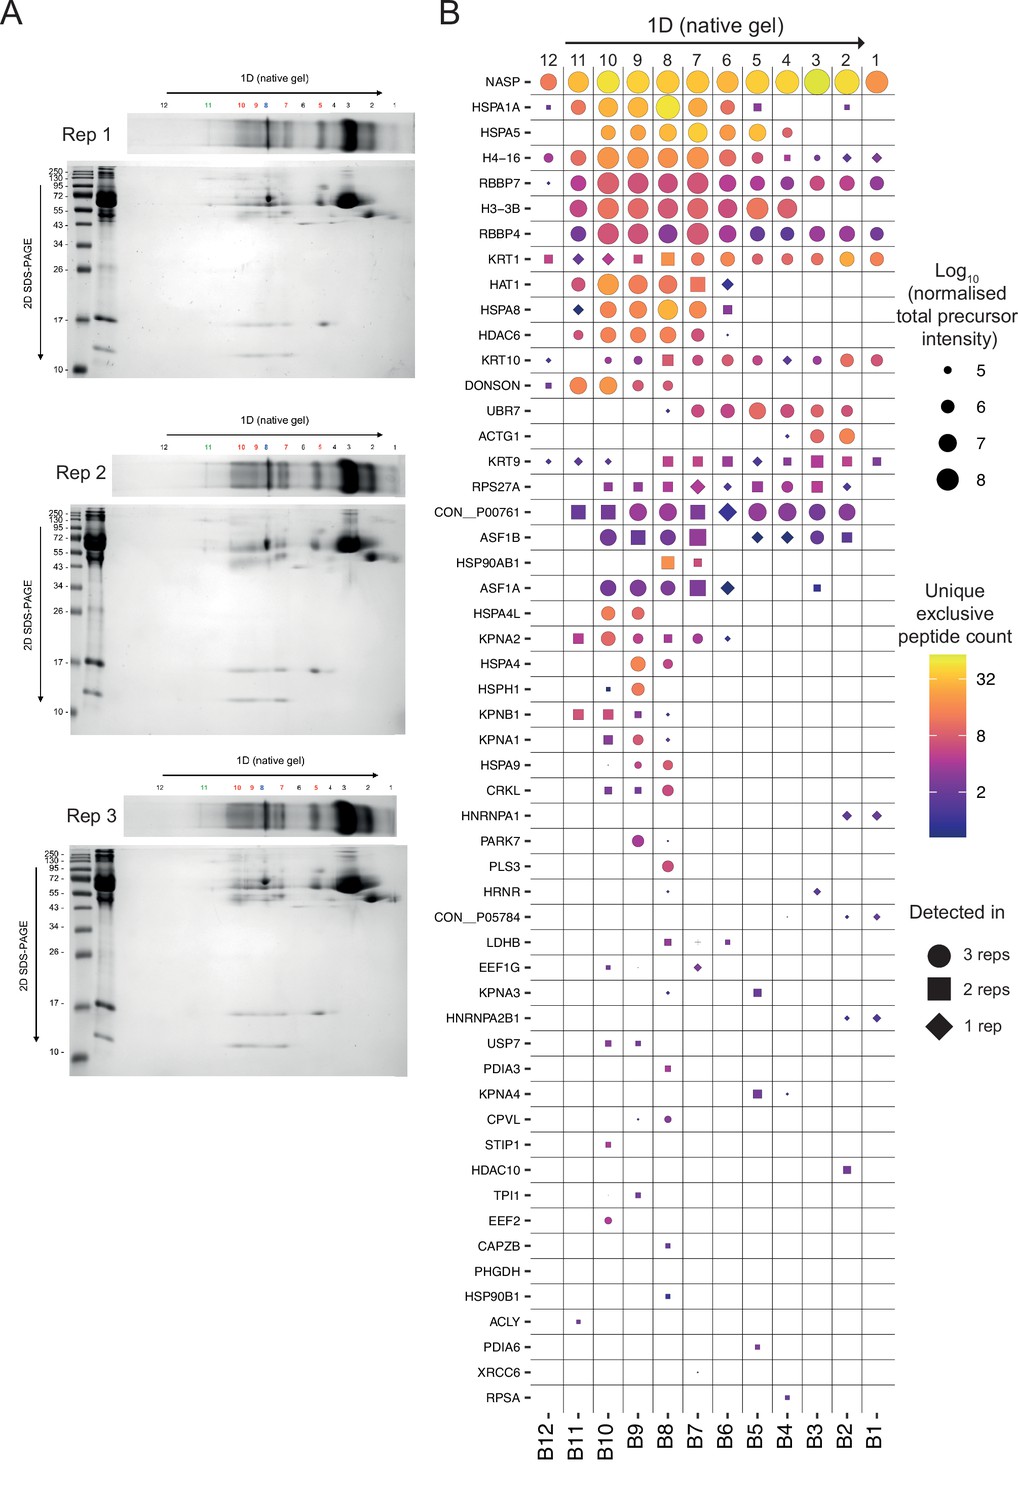
Related to Figure 3E and G.
(A) Native gel (1D) and SDS-PAGE (2D) for three independent experiments (performed with different batches of cell transfected on different days, processed subsequently 36 hr after transfection). (B) Mass-spectrometry identification of NASP-interacting factors from native gel bands (cut as labelled in A).
Figure 4 with 1 supplement
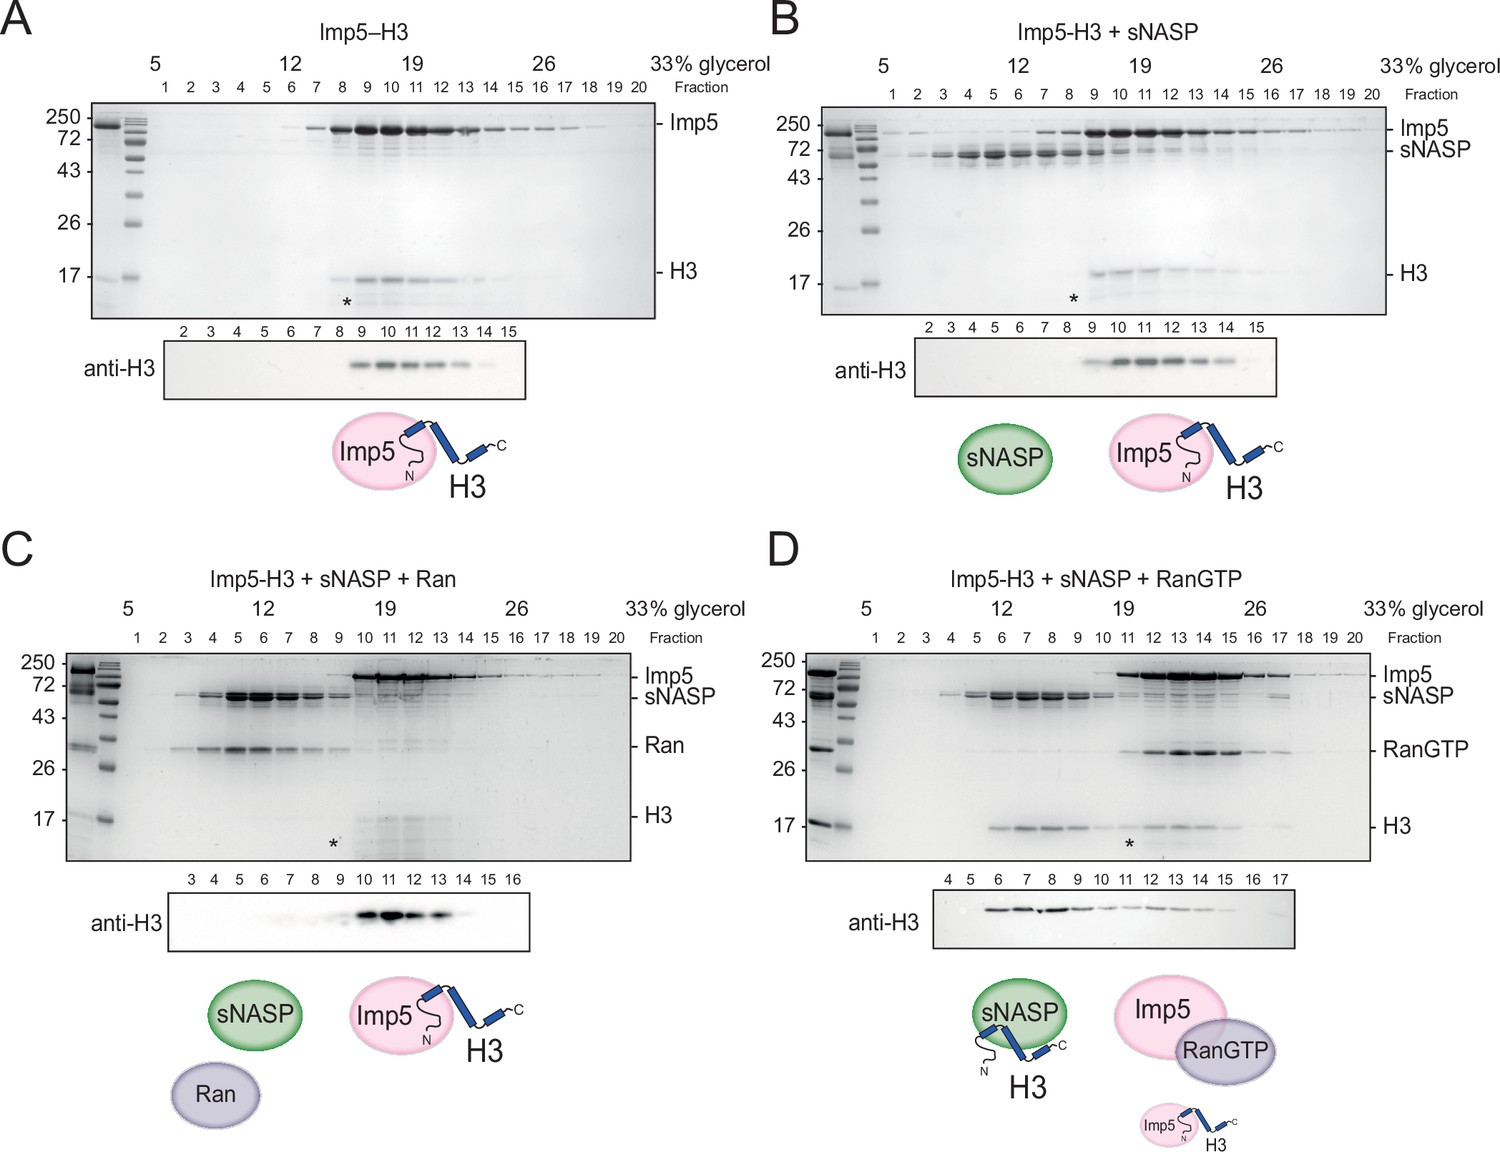
H3 binding by Imp5 and sNASP is mutually exclusive and relies on RanGTP for histone transfer.
(A) Imp5-H3 reconstituted complex was purified by size-exclusion chromatography (SEC) and incubated on ice (control) for 3 hr before separating through ultracentrifugation on a 5–40% glycerol gradient. (B) As in (A), reconstituted complex was incubated on ice with equimolar concentration of sNASP (competition assay) for 3 hr before ultracentrifugation. H3 elutes with Imp5, whereas sNASP elutes in its separate fraction. (C) As in (B), but adding Ran in equimolar concentrations to sNASP and Imp-H3. Ran in its purified state is unable to bind to Imp5 and compete with H3. (D) As in (B), but adding RanGTP in equimolar concentrations to sNASP and Imp5-H3 complex. In this instance, RanGTP associates with Imp5 and displaces H3, which co-elutes with its chaperone sNASP. Asterisks indicate an Imp5 degradation product.
Figure 4—figure supplement 1
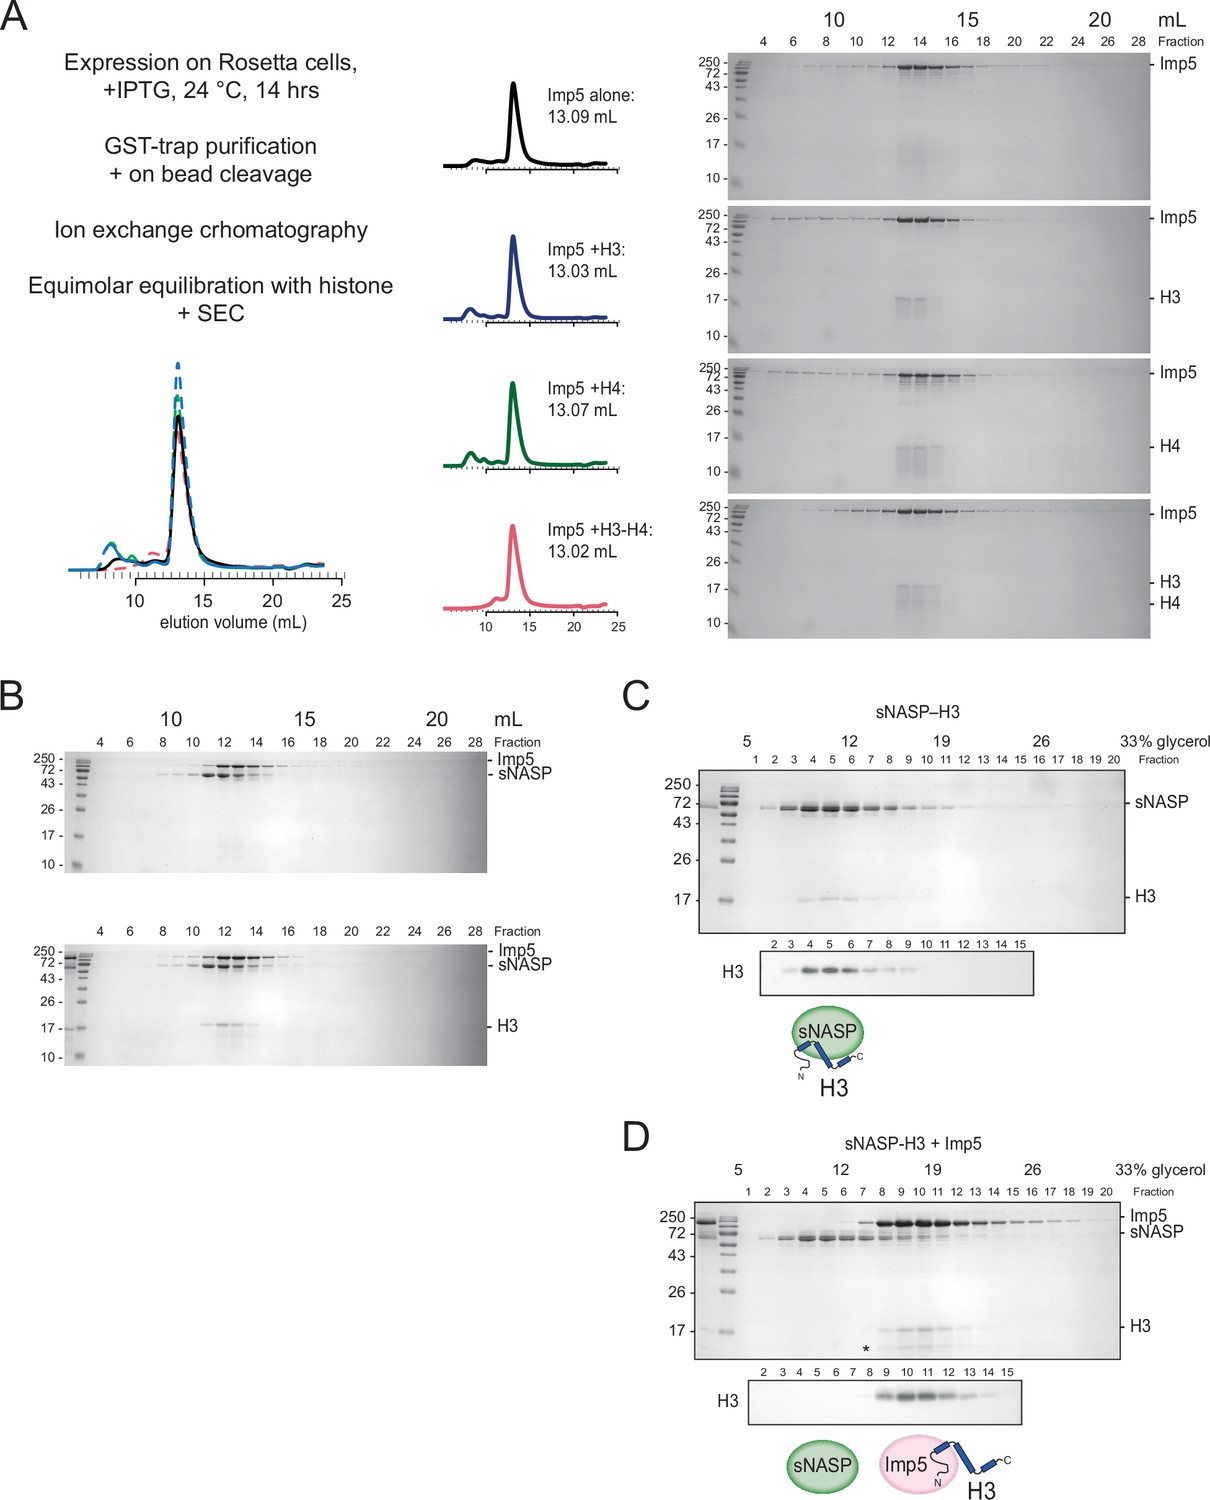
Related to Figure 4.
(A) Experimental design for Imp5 purification and complex reconstitution (H3, H4, and H3–H4). SEC280 trace (on Superdex Increase 200), peak volumes (mL), and Coomassie-stained gels. (B) Size-exclusion chromatography (SEC) for sNASP + Imp5 does not resolve these proteins (i.e. elution peaks at 12.6 and 13 mL respectively). (C) 5–40% glycerol gradient ultracentrifugation (240,000 × g, 4°C, 12 hr) sNASP-H3. (D) Imp5 outcompetes pre-formed sNASP-H3 and displaces H3. (equimolar mix).
Figure 5 with 1 supplement
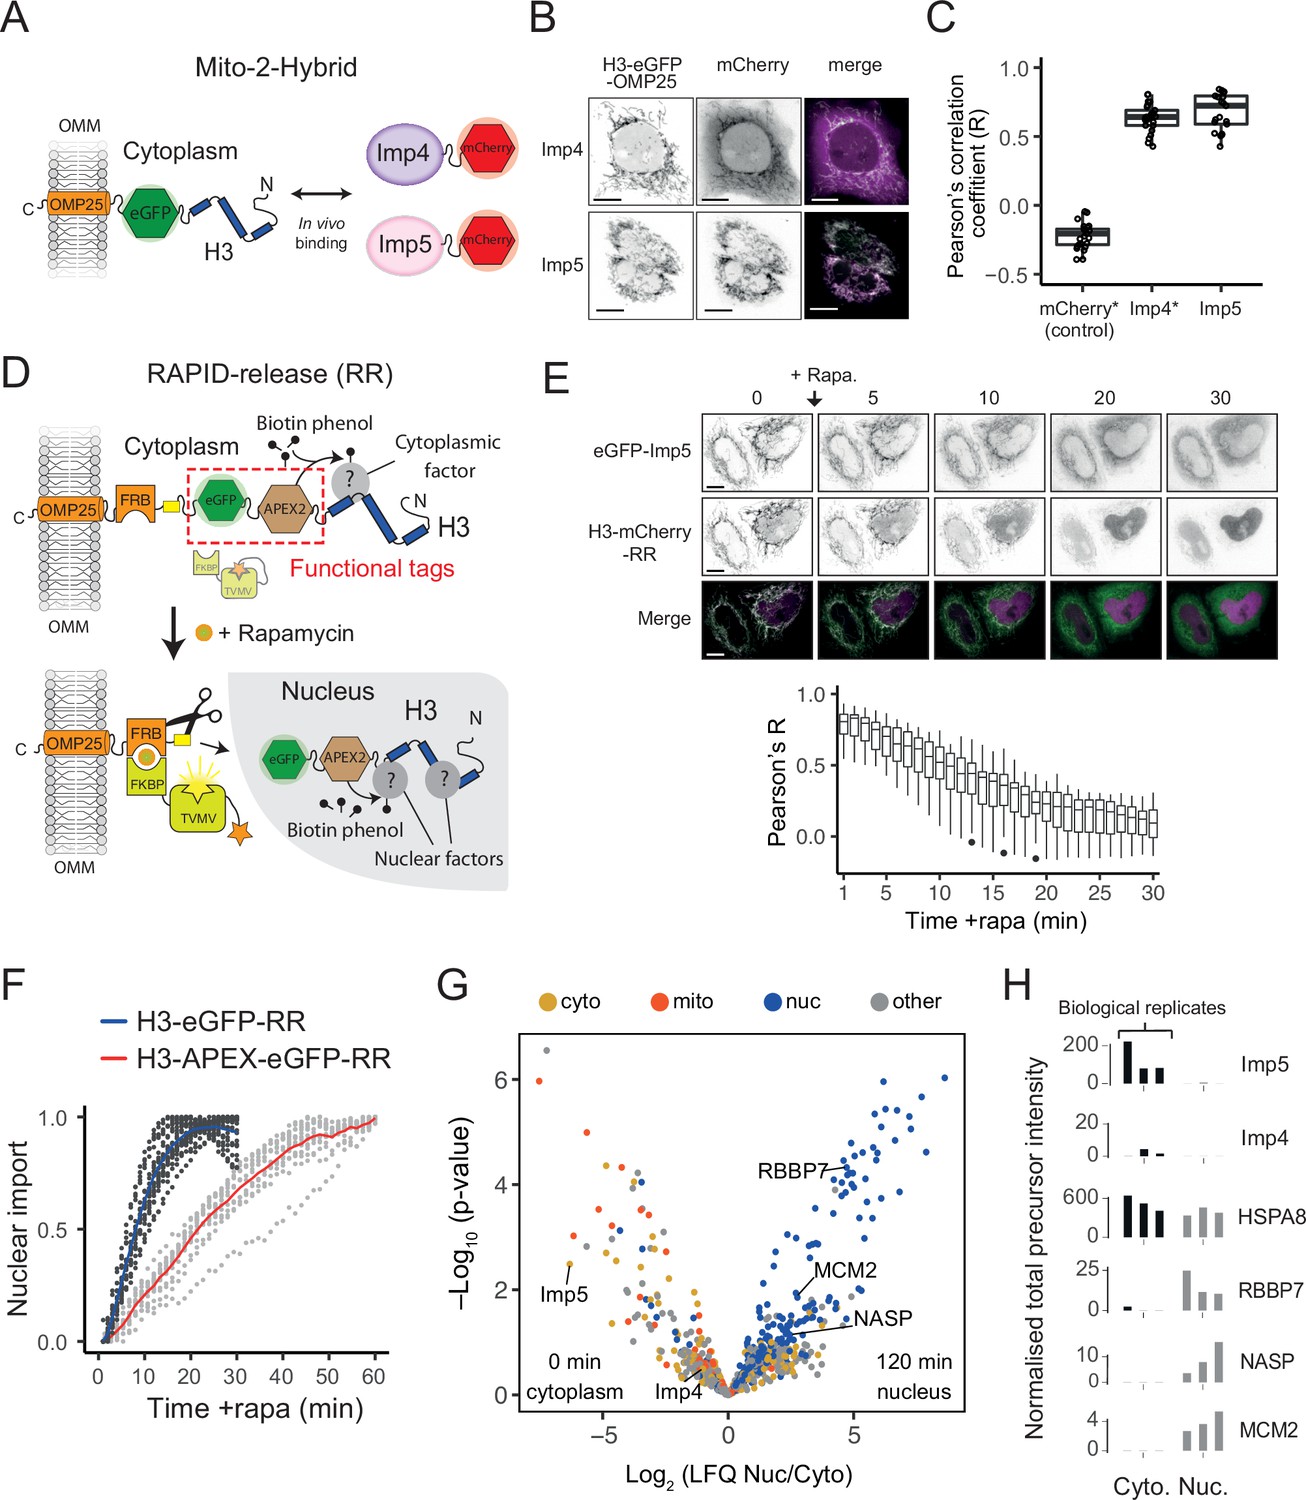
Imp5 is the predominant importin bound to nascent H3 in the cytoplasm, with histone chaperones binding only after nuclear import.
(A) In the Mito-2-Hybrid assay, cytoplasmic interactions are detected by tethering of a bait protein (H3) to the outer mitochondrial membrane (OMM) via an OMP25 tail-anchoring peptide. Recruitment of a co-expressed soluble protein reports an interaction with the bait. Scale bar = 10 µm. (B) Representative images of Imp4 and Imp5 interaction with tethered H3. (C) Quantification of interactions shown in (B) using the Pearson’s correlation coefficient as a measure of colocalisation. Asterisks indicate plotting of previously published values (Apta-Smith et al., 2018). (D) Experimental design for incorporating RAPID-Release (RR) into the cytoplasmically tethered H3 construct. Functionalisation is introduced by adding required tags to the tether (top, examples in this case being eGFP and APEX2), which can be released along with the cargo (H3) to study interaction dynamics after the addition of rapamycin (bottom). (E) Imp5 dissociates from H3 as it is released from its tether and enters the nucleus, suggesting a rapid hand-over mechanism. (F) Nuclear import rate of H3.1‐eGFP and H3.1‐APEX-eGFP. Single cells are represented as grey dots. Averages are highlighted in blue (H3.1-eGFP) and red (H3.1-APEX-eGFP). Note that H3.1-eGFP nuclear import plateaus within 20 min, whereas H3.1-APEX-eGFP requires up to 60 min. (G) Volcano plot representing label-free mass spectrometry quantification analysis (LFQ) after streptavidin pulldown of proximity labelled proteins at 0 min (cytoplasm) or 120 min (nucleus) after the addition of rapamycin. Interacting factors are colour-coded according to their main subcellular location: cytoplasm (cyto) yellow, mitochondria (mito) orange, nucleus (nuc) blue, and other in grey (The Human Protein Atlas version 21.1). (H) Alternative representation of proteomics data showing quantitative values (normalised total precursor intensity) on a linear scale (1 × 10⁶) for each biological replicate of key factors identified in (F).
-
Figure 5—source data 1
mCherry (control), mCherry-Imp4, and mCherry-Imp5 versus H3-eGFP-OMP25 Pearson’s correlation coefficients used in Figure 5C.
- https://cdn.elifesciences.org/articles/81755/elife-81755-fig5-data1-v2.csv
-
Figure 5—source data 2
eGFP-Imp5 and H3-mCherry-RAPID-release Pearson’s correlation coefficients used in Figure 5E.
- https://cdn.elifesciences.org/articles/81755/elife-81755-fig5-data2-v2.csv
-
Figure 5—source data 3
H3.1-eGFP-RAPID-release and H3.1-APEX2-eGFP-RAPID-release nuclear localisation used in Figure 5F.
- https://cdn.elifesciences.org/articles/81755/elife-81755-fig5-data3-v2.csv
-
Figure 5—source data 4
Processed mass spectrometry data for APEX2-OMP25 control.
- https://cdn.elifesciences.org/articles/81755/elife-81755-fig5-data4-v2.xlsx
-
Figure 5—source data 5
Processed mass spectrometry data for H3.1-APEX2 at 0 and 120 min after addition of rapamycin.
Total precursor intensity and p-value used in Figure 5G and H.
- https://cdn.elifesciences.org/articles/81755/elife-81755-fig5-data5-v2.xlsx
Figure 5—figure supplement 1
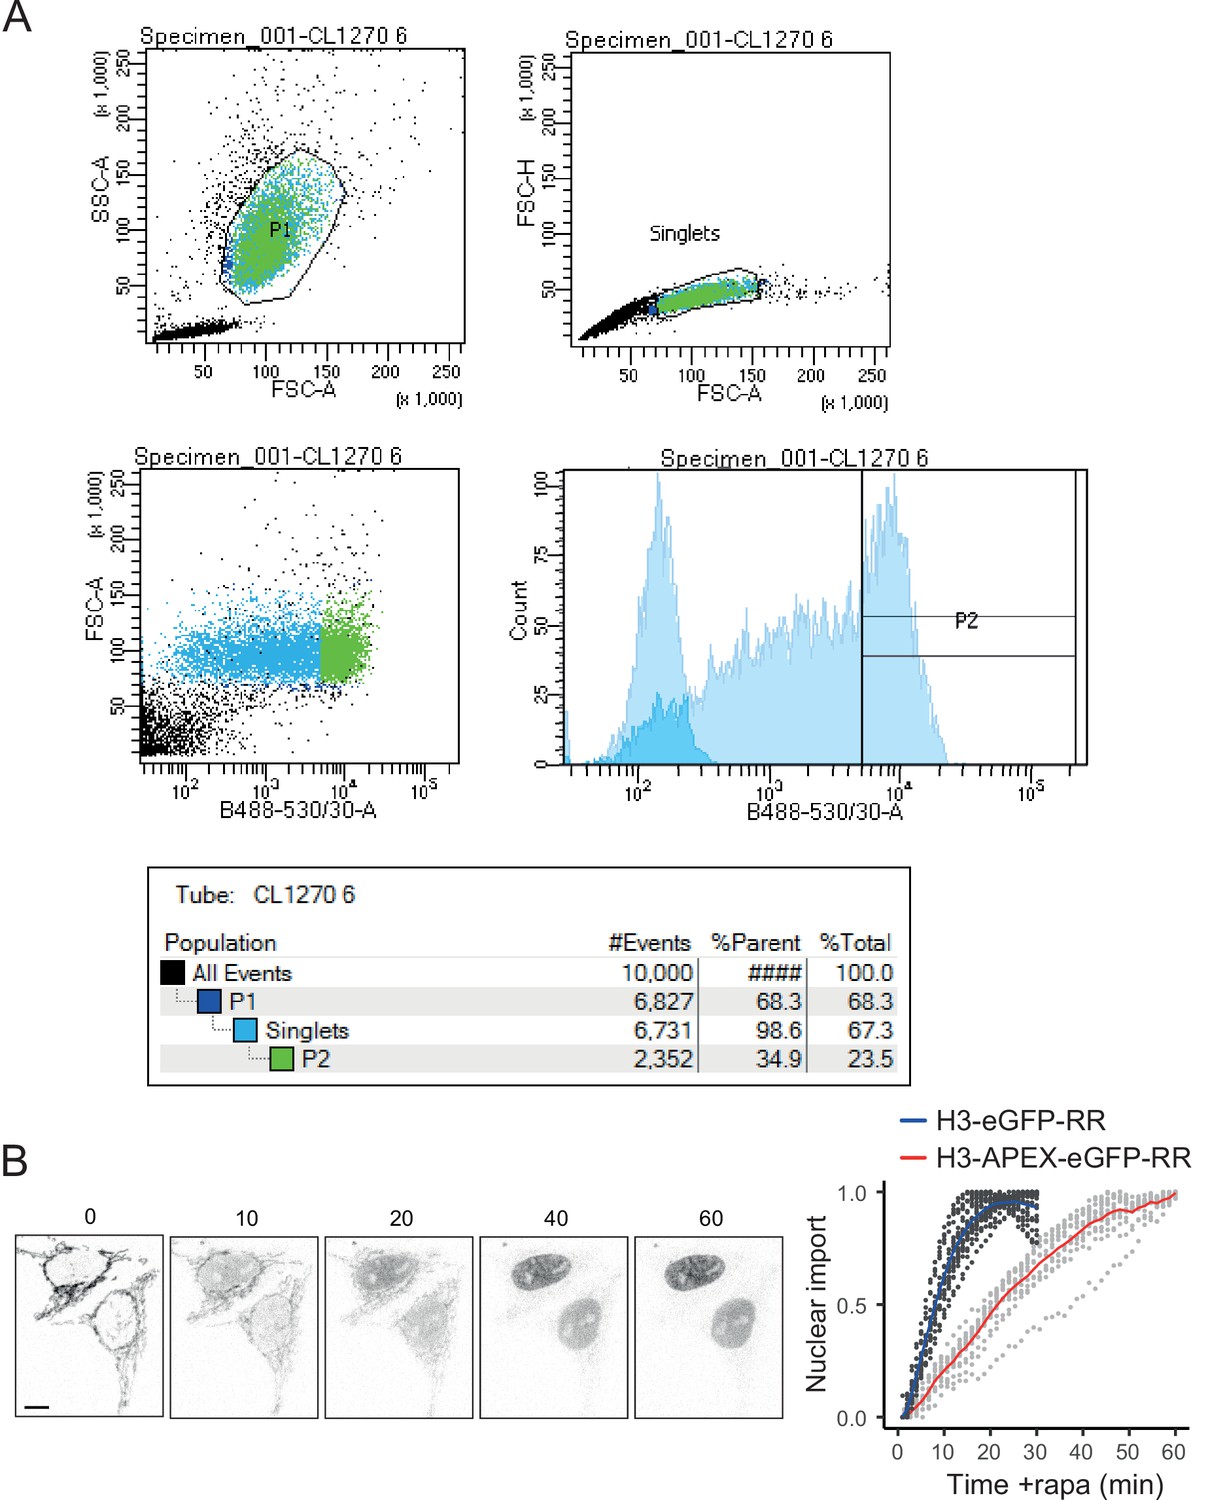
Validation of the FRT-H3-APEX2-eGFP-RR cell line.
(A) Fluorescence-activated cell sorting (FACS) data for FRT-H3-APEX2-EGFP-RR cells induced with doxycycline for 12 hr compared to non-induced cells (faded) in blue laser histogram (bottom-right graph). (B) Confocal microscopy time course of doxycycline-induced FRT-H3-APEX2-EGFP-RR and nuclear enrichment analysis (red) compared to H3-eGFP-RAPID release (RR) in blue (as shown in Figure 5F, added here for comparison). Note that the addition of the APEX2 tag delays the cleavage kinetics and nuclear localisation.
Figure 6 with 1 supplement
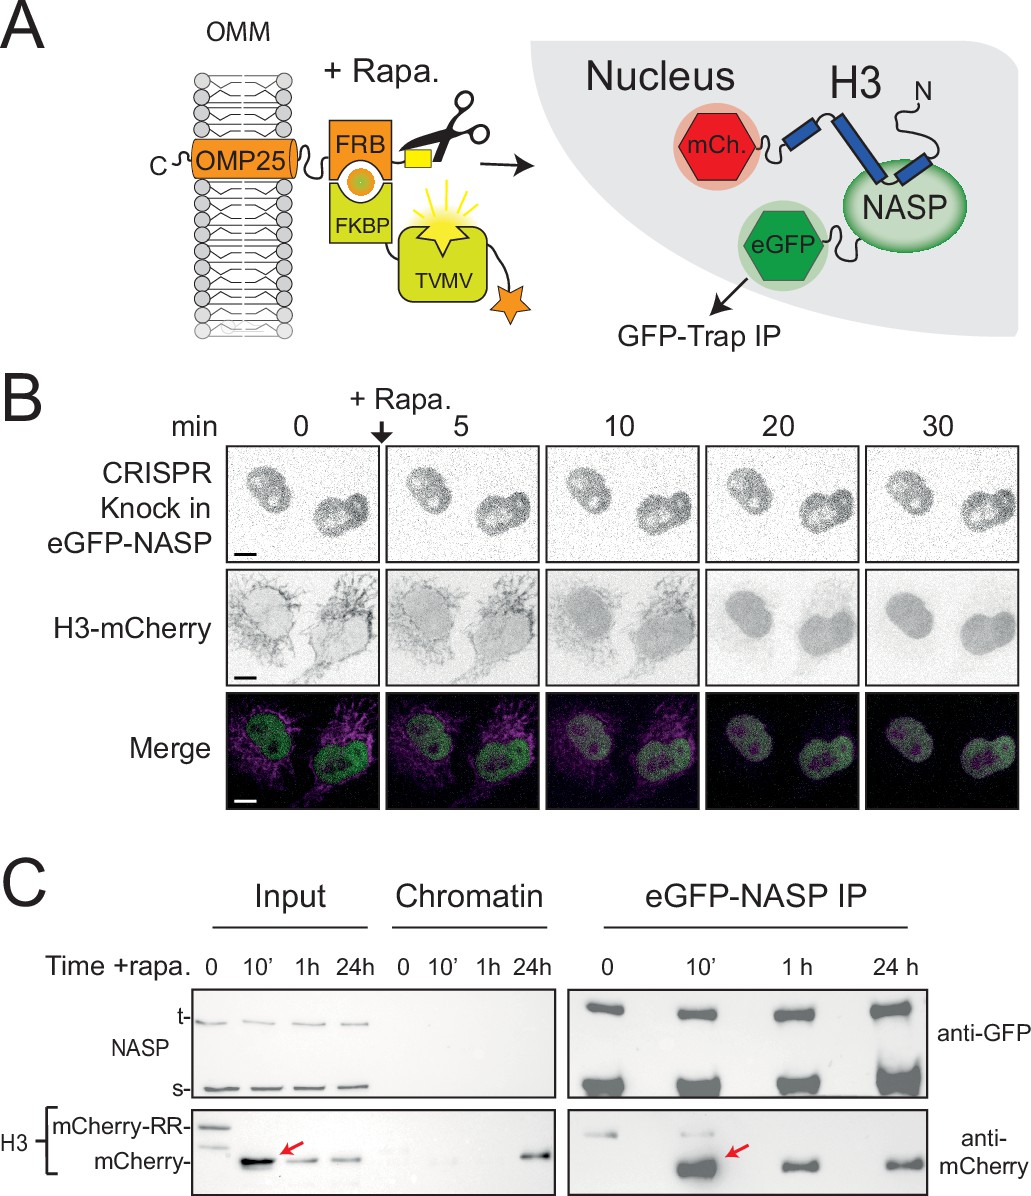
NASP binds rapidly to newly imported H3.
(A) Experimental design combining a histone pulse with co-immunoprecipitation. Addition of rapamycin recruits an otherwise autoinhibited TVMV protease which cleaves the tethered histone fusion, allowing it to enter the histone deposition pathway. (B) Time course of H3-mCherry release in the CRISPR eGFP-NASP knock-in cell line. Note that endogenously tagged NASP does not associate with H3 tethered in the cytoplasm. (C) Western blot analysis of co-immunoprecipitated H3-mCherry from the cell line shown in (B) at 0, 10 min, 1 hr, and 24 hr time points after the addition of rapamycin.
Figure 6—figure supplement 1
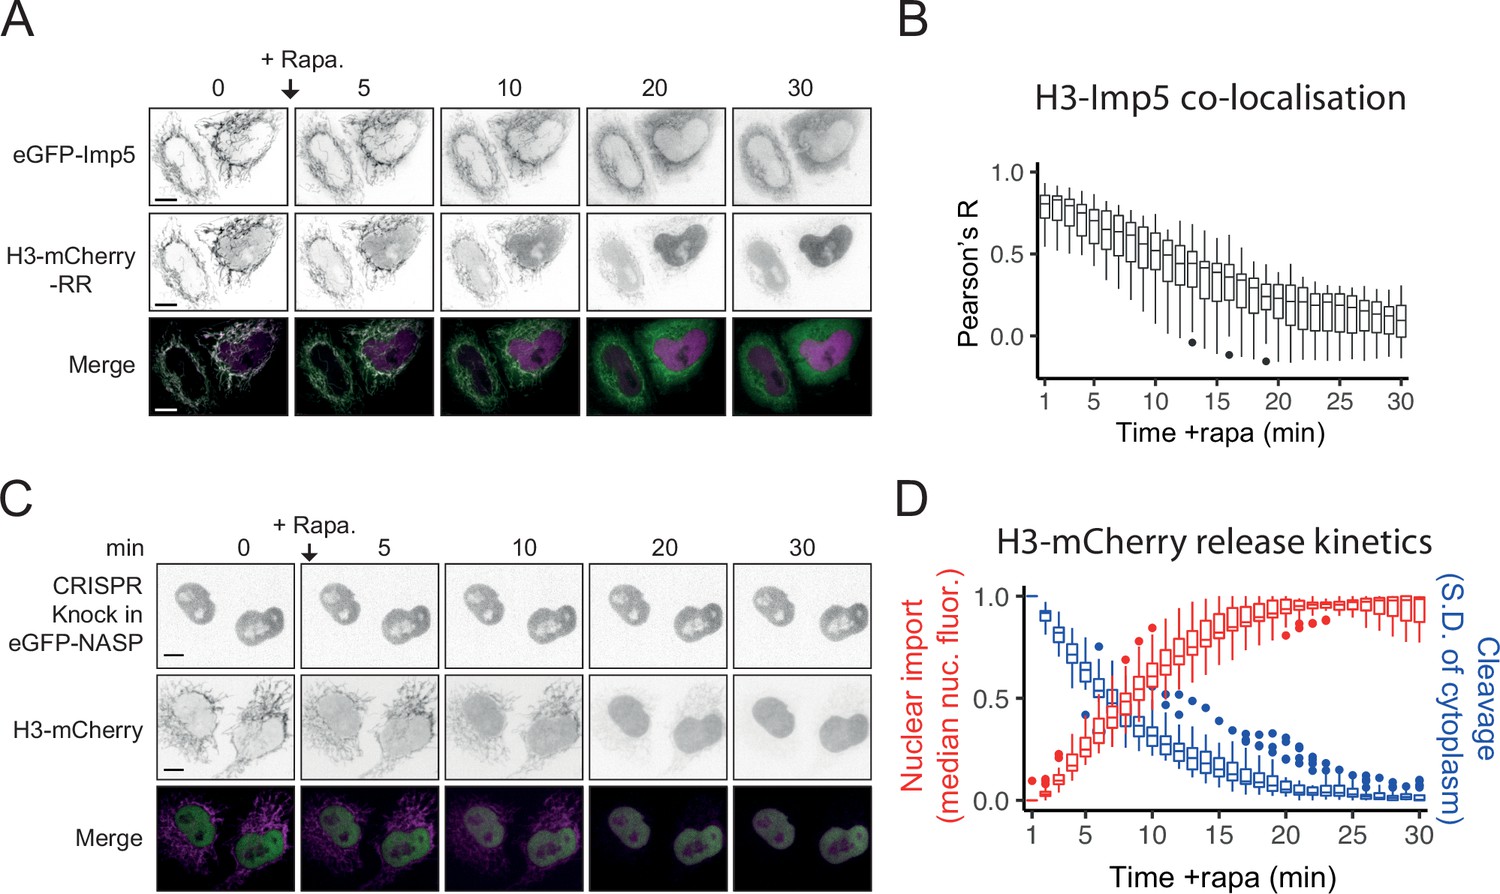
Kinetics of H3 RAPID-release and co-localistation analysis with Imp5.
(A) Confocal microscopy time course after the addition of rapamycin (RAPID release H3-mCherry-RR) in cells transiently expressing eGFP-Imp5. Scale bar = 10 μm. (B) Pearson’s correlation coefficient (R) analysis (as in A, n = 20 cells). (C) Confocal microscopy time course after the addition of rapamycin (RAPID release H3-eGFP-RR) in HeLa cells with eGFP-NASP endogenously labelled (CRISPR knock-in). Scale bar = 10 μm. (D) Nuclear enrichment analysis compared to cleavage rate (inferred from SD of cytoplasm). Panels (A) and (B) are shown in Figure 5E and panel (C) is shown in Figure 6B. They were added here together for timescale comparison.
Figure 7
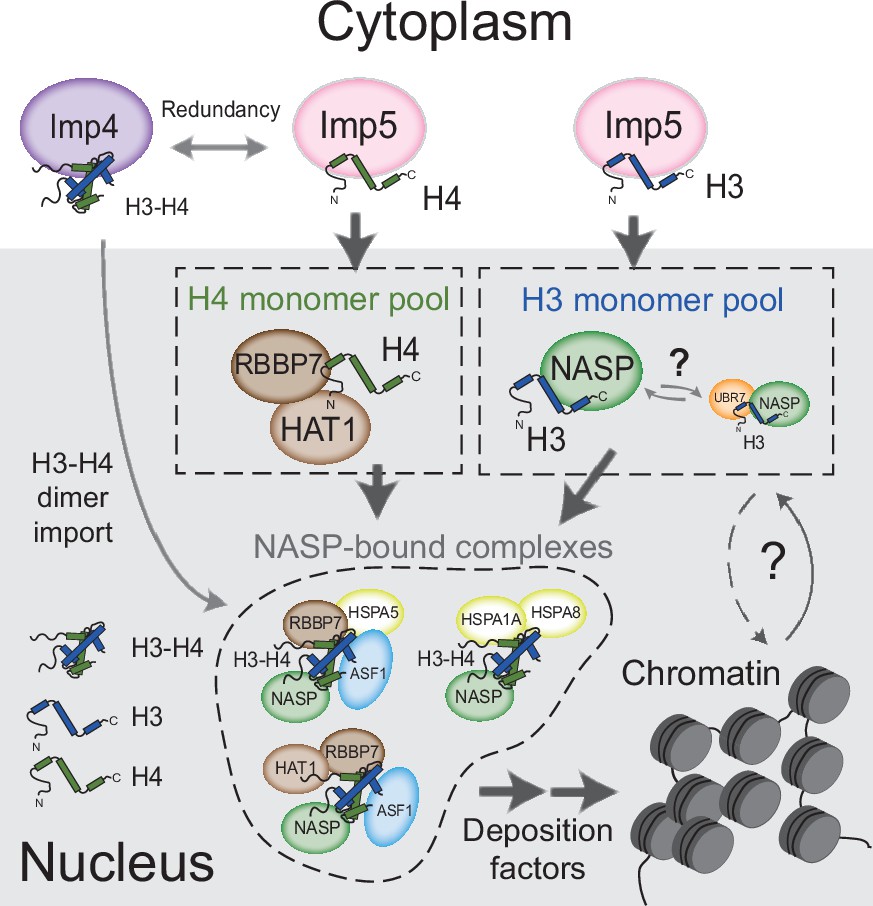
Model for nuclear translocation of histones H3 and H4 as monomers and processing in the nucleus Imp5 imports histone H3 and H4 as monomers whilst Imp4 has a preference for dimers, albeit with some redundancy.
Upon nuclear translocation, RanGTP induces cargo dissociation with H3 being transferred to sNASP and H4 to the HAT1 complex. These chaperones may have a holdase function that buffers imbalances in individual histone supply. H3 and H4 fold and enter the deposition pathway via a number of distinct NASP-bound complexes.
Tables
Key resources table
| Reagent type (species) or resource | Designation | Source or reference | Identifiers | Additional information |
|---|---|---|---|---|
| Bacterial cells DH5-alpha (Escherichia coli) | DH5-alpha | Thermo | EC0112 | Chemically competent cells |
| Bacterial cells BL21 (DE3) (Escherichia coli) | BL21(DE3) | Thermo | EC0114 | Chemically competent cells |
| HeLa Kyoto cell line (Homo-sapiens) | Cancer cell line | Originally sourced from CRUK Cell Services | RRID:CVCL_1922 | |
| HeLa FRT cell line (Homo-sapiens) | T-REx-HeLa Cell Line | Invitrogen | R71407 RRID: CVCL_D587 | |
| HEK293-F cells | FreeStyle 293 F Cells | Invitrogen | R79007 RRID: CVCL_D603 | |
| Plasmid for transfected construct (human) | H3.1-EGFP | Backbone plasmid: pEGFP-N1 | Apta-Smith et al., 2018 | transfected construct (human) |
| Plasmid for transfected construct (human) | H3.1 (A95_ GGG)-EGFP | Backbone plasmid: pEGFP-N1 | This study | transfected construct (human) |
| Plasmid for transfected construct (human) | H3.1 (FLY >AAA)-EGFP | Backbone plasmid: pEGFP-N1 | This study | transfected construct (human) |
| Plasmid for transfected construct (human) | H4-EGFP | Backbone plasmid: pEGFP-N1 | Apta-Smith et al., 2018 | transfected construct (human) |
| Plasmid for transfected construct (human) | H4 (V65GGG)-EGFP | Backbone plasmid: pEGFP-N1 | This study | transfected construct (human) |
| Plasmid for transfected construct (human) | H4 (FLI >AAA)-EGFP | Backbone plasmid: pEGFP-N1 | This study | transfected construct (human) |
| Plasmid for transfected construct (human) | H3.2-mCherry- 2xTVMVcs-FRB- OMP5–IRES– FKBP-TVMV-AI | pEGFP-C1 | This study | transfected construct (human) |
| Plasmid for transfected construct (human) | EGFP-Imp5 | pEGFP-C1 | This study | transfected construct (human) |
| Plasmid for transfected construct (human) | EGFP-TEV-sNASP | pIRESpuro2 | This study | transfected construct (human) |
| Plasmid for transfected construct (human) | H3.1-Flag-APEX2-EGFP-2xTVMVcs-FRB-OMP25-IRES-FKBP-TVMV-AI | pcDNA5/FRT/TO | This study | transfected construct (human) |
| Plasmid for transfected construct (human) | pNASP-EGFP-TEV_HDR-donor | pBlueScript II KS (+) | This study | transfected construct (human) |
| Plasmid for transfected construct (human) | pX461-NASP- sgRNA2-down | pX461-PSPCas9N(BB)–2A-GFP | This study | transfected construct (human) |
| Plasmid for transfected construct (human) | pX461-NASP- sgRNA2-up | pX461-PSPCas9N(BB)–2A-GFP | This study | transfected construct (human) |
| Plasmid for transfected construct (human) | pASF1b-Spot-mCherry-3C_HDR-donor | pBlueScript II KS (+) | This study | transfected construct (human) |
| Plasmid for transfected construct (human) | pX461-ASF1B- sgRNA2-down | pX461-PSPCas9N(BB)–2A-GFP | This study | transfected construct (human) |
| Plasmid for transfected construct (human) | pX461-ASF1B- sgRNA2-up | pX461-PSPCas9N(BB)–2A-GFP | This study | transfected construct (human) |
| Plasmid for transformation (human) | pGST-HRV 3Ccs-Imp5 iso1 | pGEX-6P1 | This study | Bacterial expression construct (human) |
| Plasmid for transformation (human) | pHis-TEVcs-Ran | pETMCN6His | This study | Bacterial expression construct (human) |
| antibody | Anti-ASF1A (C6E10), Rabbit monoclonal | Cell Signaling Technology | C6E10 | WB (1:1000) |
| antibody | Anti-ASF1B, Rabbit monoclonal | Cell Signaling Technology | C70E2 | WB (1:1000) |
| antibody | Anti-HAT1, Rabbit monoclonal | Abcam | ab194296 | WB (1:1000) |
| antibody | Anti-Histone H3, Rabbit polyclonal, IgG | Cell Signaling Technology | #9715 | WB (1:1000) |
| antibody | Anti-Histone H4, Rabbit polyclonal | Abcam | ab7311 | WB (1:500) |
| antibody | Anti-Histone H4 k12Ac, Rabbit polyclonal | Millipore (Merck) | #07–595 | WB (1:1000) |
| antibody | Anti-Histone H4 k5Ac, Rabbit polyclonal | Millipore (Merck) | #07–327 | WB (1:2000-1:5000) |
| antibody | Anti-Importin4, Rabbit monoclonal [EPR13660-27] | Abcam | ab181037 | WB (1:10000) |
| antibody | Anti-Karyopherin beta 3 (IPO5), Mouse polyclonal | Abcam | ab88695 | WB (1:500) |
| antibody | Anti-NASP, rabbit polyclonal | Home-made | NA | WB (1:20000) |
| antibody | Anti-mCherry, Rabbit polyclonal | Abcam | ab167453 | WB (1:5000) |
| antibody | Anti-RbAp46/48, Rabbit - monoclonal (IgG) | Cell Signaling Technology | (D4F8) #9067 | WB (1:1000) |
| antibody | Anti-UBR7, Rabbit polyclonal | Abcam | ab241371 | WB (1:1000) |
| antibody | GFP (B-2) HRP, Mouse - monoclonal (clone B-2), IgG2a | Santa Cruz | sc-9996 HRP | WB (1:1000 to 1:5000) |
| antibody | Goat Anti-Mouse HRP, Goat polyclonal, IgG | Abcam | ab205719 | WB (1:5000) |
| antibody | Anti-Rabbit, HRP- linked antibody, Goat polyclonal, IgG | Cell Signaling Technology | 7074 S | WB (1:10000 to 1:20000) |
| antibody | Goat Anti-Rabbit Alexa 568, Goat polyclonal, IgG | Abcam | ab175471 | WB (1:1000) |
| sequence- based reagent | XhoI_IPO5_F | This paper | PCR primers | aaaaaaCTCGAGcaA TGGCGGCGGCCGC |
| sequence- based reagent | KpnI_IPO5_R | This paper | PCR primers | GGTGGTggtaccTCAC GCAGAGTTCAGGAGCTC |
| sequence- based reagent | IPO5_pGEX_F | This paper | PCR primers | ctgttccaggggcccctggg atccGCAATGGC GGCGGCtGCG |
| sequence- based reagent | IPO5_pGEX_R | This paper | PCR primers | gtcagtcagtcacgatgcggccgc TCACGCAGA GTTCAGGAGC |
| sequence- based reagent | Kozak5p_F | This paper | PCR primers | TGAACCGTCAG ATCCGCTAGC |
| sequence- based reagent | OMP25_IRES_R | This paper | PCR primers | CGGTAGCGCTAC AGCTGTTTGCGATAGCG |
| sequence- based reagent | OMP25_IRES_F | This paper | PCR primers | TCGCAAACAGCTG TAGCGCTACCGGACTCAG |
| sequence- based reagent | IRES_FKBP_R | This paper | PCR primers | TCCACCTGCACCAT GGTTGTGGCCATAT |
| sequence- based reagent | FKBP_IRES_F | This paper | PCR primers | ATGGCCACAACCA TGGTGCAGGTGGAAACC |
| sequence- based reagent | FKBP_FRT_R | This paper | PCR primers | TGTGGGAGGTTTC TAGCTGCCCGGCGC |
| sequence- based reagent | FRT_AI_F | This paper | PCR primers | CCGGGCAGCTAGA AACCTCCCAC ACCTCCCCCT |
| sequence- based reagent | Kozak_H3.1_R | This paper | PCR primers | GATCTGACGG TTCACTAAAC |
| sequence- based reagent | APEX2_gBLOCK | Alice Ting lab, Lam et al., 2015 | G block (double strand DNA fragment) | Sequence taken from Addgene pcDNA3 APEX2-NES (#49386) |
| sequence- based reagent | NASP_HDR_ upstream_F | This paper | PCR primers | AGCTACTCGCCCT GAACATGCA GAGCAGCACTG |
| sequence- based reagent | NASP_HDR_ upstream_R | This paper | PCR primers | CGTTCCCCTGAGG TGGCGAACCAGCGAACG |
| sequence- based reagent | GFPforNASP_HDR_F | This paper | PCR primers | TTCGCCACCTCAG GGGAACGATGGT GAGCAAGGGCGAGGA |
| sequence- based reagent | GFPforNASP_HDR_R | This paper | PCR primers | GCTGTGGACTCCAT GGCCATATGGCCC TGGAAGTAAAGGT |
| sequence-based reagent | NASP_HDR_downstream_F | This paper | PCR primers | ATGGCCATGGAGT CCACAGCCACTGCCGC |
| sequence-based reagent | NASP_HDR_downstream_R | This paper | PCR primers | TTATATTCCCGGGT TATCCAGGGGTTC TACCAGAGGCACACG |
| sequence-based reagent | NASP_pair1_upstream_F | This paper | DNA oligomer for dsDNA (guide RNA) | CACCGCCATGG CCATCGTTCCCCTG |
| sequence-based reagent | NASP_pair1_upstream_R | This paper | DNA oligomer for dsDNA (guide RNA) | AAACCAGGGGAA CGATGGCCATGGC |
| sequence-based reagent | NASP_pair1_downstream_F | This paper | DNA oligomer for dsDNA (guide RNA) | CACCGAGCCAC TGCCGCCGTCGCCG |
| sequence-based reagent | NASP_pair1_downstream_R | This paper | DNA oligomer for dsDNA (guide RNA) | AAACCGGCGACG GCGGCAGTGGCTC |
| sequence-based reagent | ASF1B_UP_R | This paper | PCR primers | GGCCATCGCC TCGCCTCGCC |
| sequence-based reagent | ASF1B_UP_F | This paper | PCR primers | AATCACTTCGG GTGCGAGCACC |
| sequence-based reagent | Spot-tag_ mCherry_3 C_R | This paper | PCR primers | GCACCGACACC TTGGCCATGGGCC CCTGGAACAGAAC TTCCAGGAGTCC GGACTTGTACAGCT |
| sequence-based reagent | Spot-tag_ mCherry_3 C_F | This paper | PCR primers | GAGGCGAGGCGat ggccccggatcgcgtgcg cgcggtgagccattggag cagcGTGAGCAAGG GCGAGGAGGA |
| sequence-based reagent | ASF1B_DOWN_R | This paper | PCR primers | GGAAAATGGGAAG GGGCTGGATATTGG |
| sequence-based reagent | ASF1B_DOWN_F | This paper | PCR primers | ATGGCCAAGG TGTCGGTGC |
| sequence-based reagent | ASF1B_sgRNA_UP_F | This paper | DNA oligomer for dsDNA (guide RNA) | CACCGTCGCCTC GCCGCGCCGCAGC |
| sequence-based reagent | ASF1B_sgRNA_UP_R | This paper | DNA oligomer for dsDNA (guide RNA) | AAACGCTGCGGC GCGGCGAGGCGAC |
| sequence- based reagent | ASF1B_sgRNA_Down_F | This paper | DNA oligomer for dsDNA (guide RNA) | CACCGCAAGGTG TCGGTGCTGAACG |
| sequence- based reagent | ASF1B_sgRNA_Down_R | This paper | DNA oligomer for dsDNA (guide RNA) | AAACCGTTCAGC ACCGACACCTTGC |
| peptide, recombinant protein | Pierce High Capacity Streptavidin Agarose | Thermo Fisher | Cat. #: 20357 | |
| peptide, recombinant protein | GFP-trap agarose beads | ProteinTech (Chromoteck) | GTA | |
| chemical compound, drug | Biotin-phenol | Iris Biotech | LS-3500 | (Final concentration 500 µM) |
| chemical compound, drug | FugeneHD | Promega | E2311 | |
| chemical compound, drug | Rapamycin | ALFA (AESAR) | J62473.MC | (Final concentration 200 nM) |
| software, algorithm | R | R | Open Source | For graph plotting and statistical analysis |
| other | Hoechst 33342 stain | NEB | 4082 S | (1 µg/mL) |
Additional files
-
Transparent reporting form
- https://cdn.elifesciences.org/articles/81755/elife-81755-transrepform1-v2.pdf
-
Source data 1
Uncropped source images for gels and western blots.
- https://cdn.elifesciences.org/articles/81755/elife-81755-data1-v2.docx
Download links
A two-part list of links to download the article, or parts of the article, in various formats.
Downloads (link to download the article as PDF)
Open citations (links to open the citations from this article in various online reference manager services)
Cite this article (links to download the citations from this article in formats compatible with various reference manager tools)
A specific role for importin-5 and NASP in the import and nuclear hand-off of monomeric H3
eLife 11:e81755.
https://doi.org/10.7554/eLife.81755


