Structure-guided isoform identification for the human transcriptome
- Department of Biomedical Engineering, Johns Hopkins School of Medicine and Whiting School of Engineering, United States
- Center for Computational Biology, Johns Hopkins University, United States
- School of Biological Sciences, Seoul National University, Republic of Korea
- Artificial Intelligence Institute, Seoul National University, Republic of Korea
- Department of Computer Science, Johns Hopkins University, United States
- Institute of Molecular Biology and Genetics, Seoul National University, Republic of Korea
- Department of Biostatistics, Johns Hopkins University, United States
Figures
Figure 1
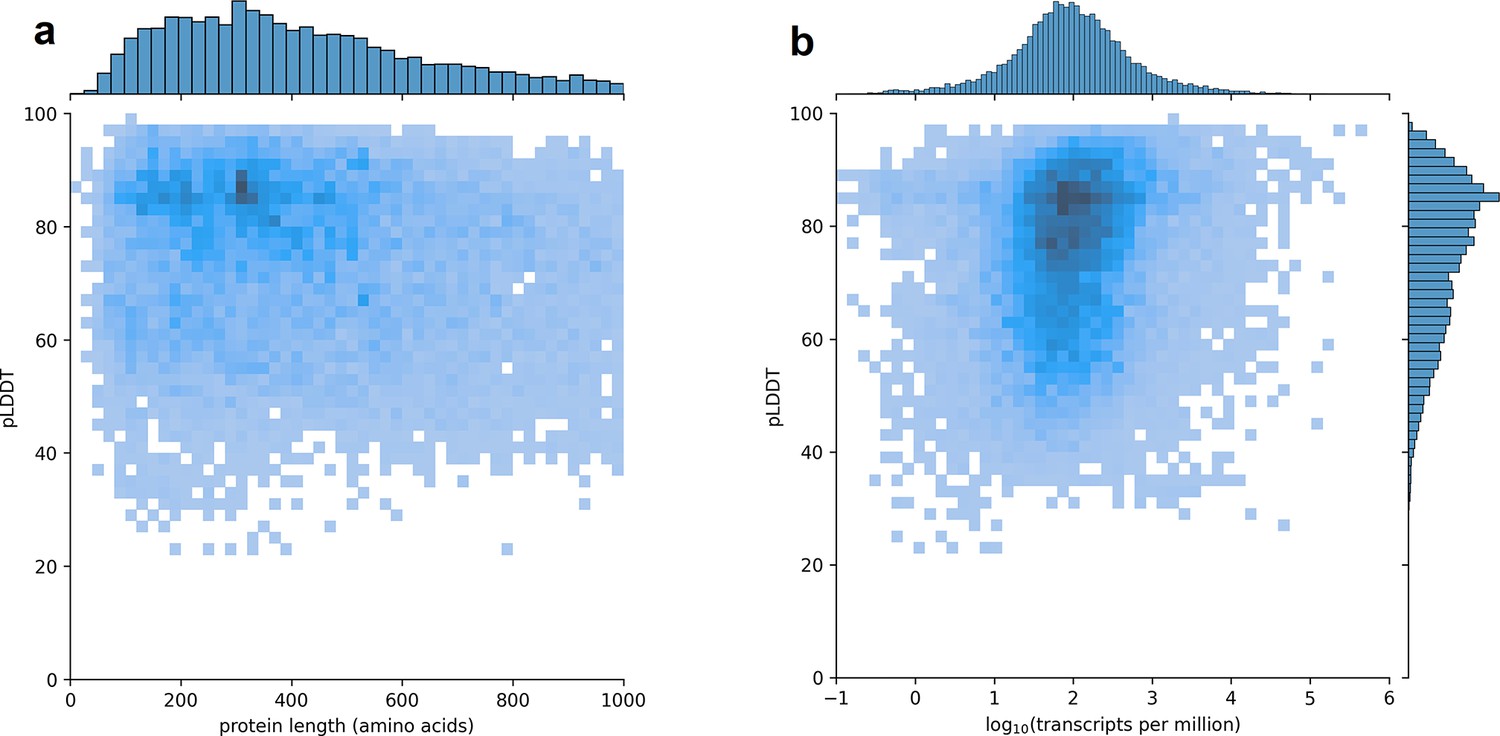
Predicted local distance difference test (pLDDT) distribution across the human transcriptome.
Two-dimensional joint histograms comparing pLDDT to protein amino acid length (a) and expression (b) measured in transcripts per million (TPM). For each protein-coding gene, only the isoform found in the highest number of Genotype-Tissue Expression (GTEx) samples is plotted. No strong trend is visible in the relationship between pLDDT and either protein length (a) or transcript expression (b).
Figure 2
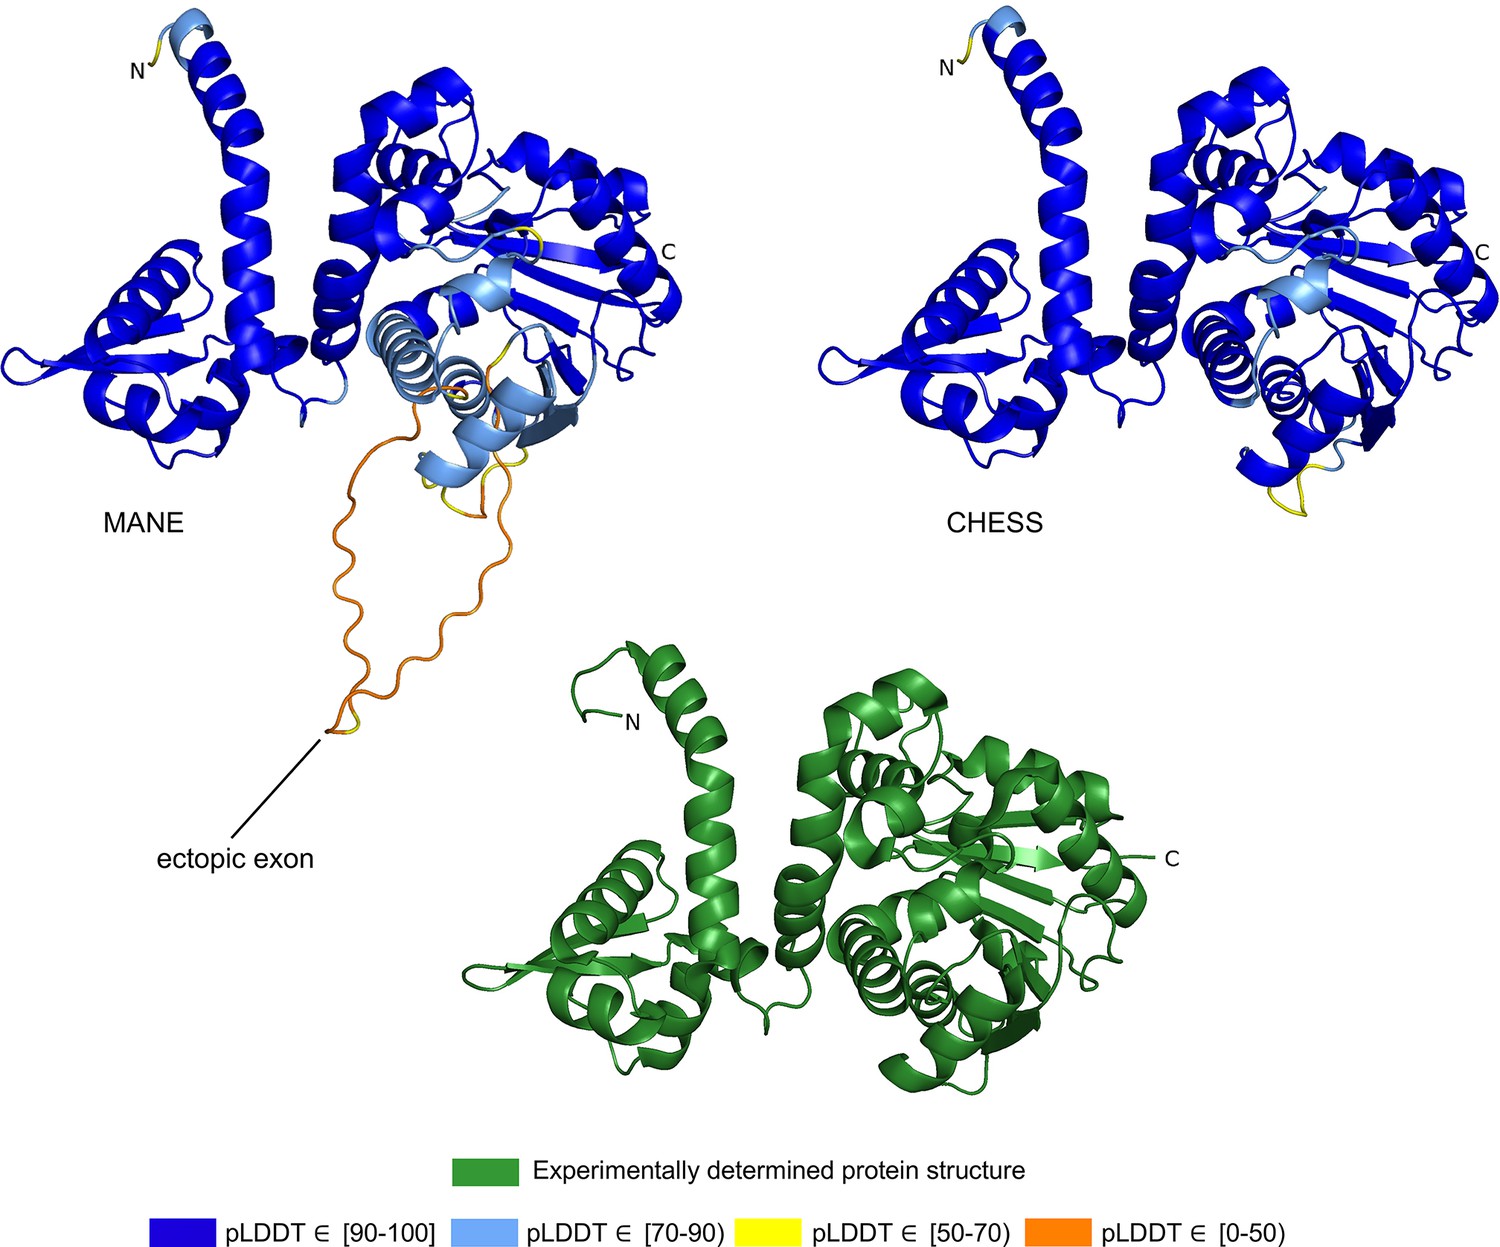
Acetylserotonin O-methyltransferase (ASMT) isoform comparison.
Comparison of predicted structures of ASMT, showing the 373aa isoform from Matched Annotation from NCBI and EMBL-EBI (MANE) (CHS.57426.2, RefSeq NM_001171038.2, GENCODE ENST00000381241.9) on the left, and a 345aa alternate isoform from Comprehensive Human Expressed SequenceS (CHESS) (CHS.57426.4, GENCODE ENST00000381229.9) on the right. The CHESS 345aa isoform closely matches the experimentally determined X-ray crystal structure of the biologically active protein (Botros et al., 2013), shown at the bottom.
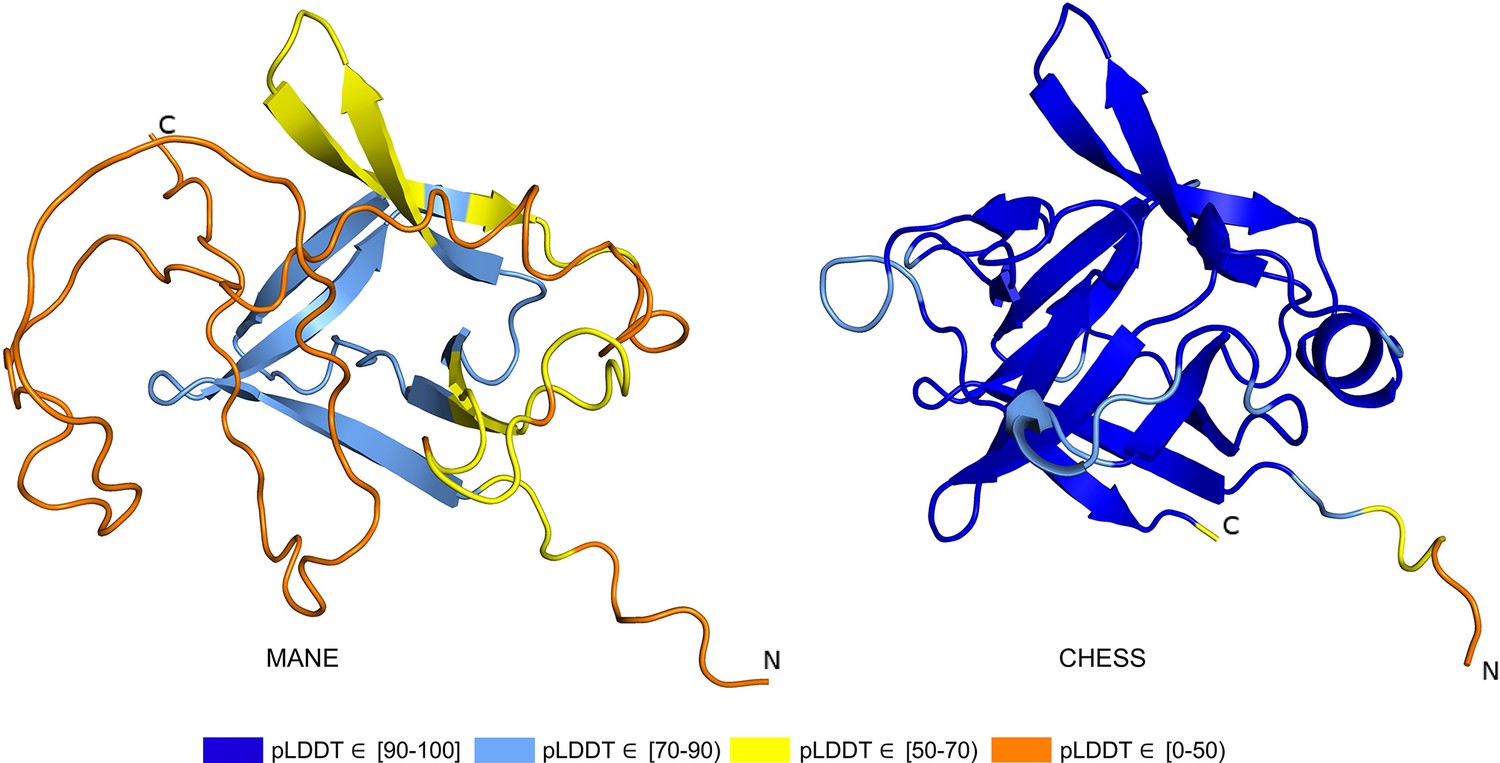
Figure 3
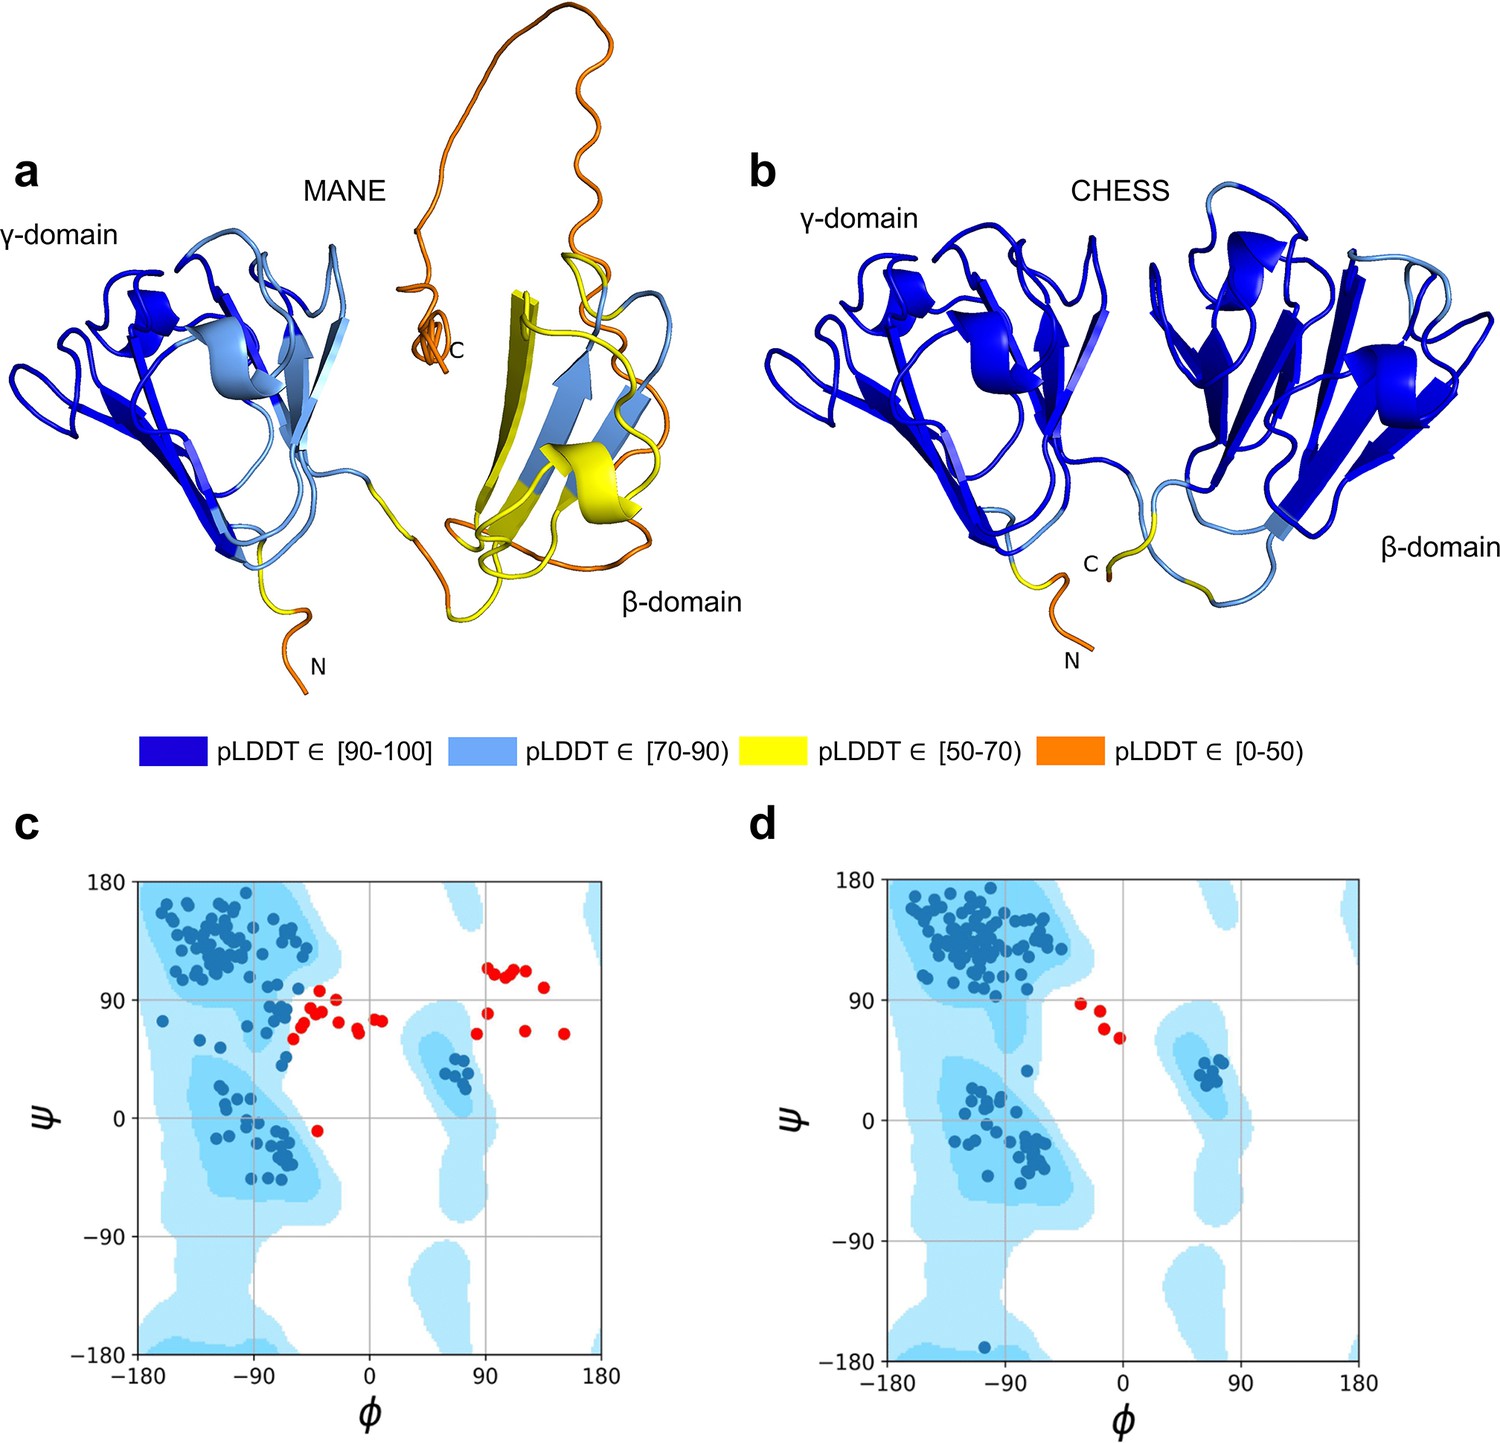
CRYGN isoform comparison.
(a) Predicted protein structure for the Matched Annotation from NCBI and EMBL-EBI (MANE) isoform (CHS.52273.5, RefSeq NM_144727.3, GENCODE ENST00000337323.3) of gamma-N crystallin (CRYGN), colored by predicted local distance difference test (pLDDT) score. (b) Predicted protein structure for a CRYGN alternate isoform (CHS.52273.9, GENCODE ENST00000644350.1). (c) Ramachandran plot for the MANE (CRYGN) isoform. Dark blue areas represent ‘favored’ regions while light blue represent ‘allowed’ regions (Lovell et al., 2003). The 32 red dots represent amino acid residues with secondary structures that fall outside the allowed regions. (d) Ramachandran plot for the alternate CRYGN isoform with 4 red dots falling in disallowed regions, compared to 32 disallowed in MANE. All residues associated with the 4 red dots in the alternate isoform are shared with the MANE isoform in the poorly folded N-terminal region.
Figure 4
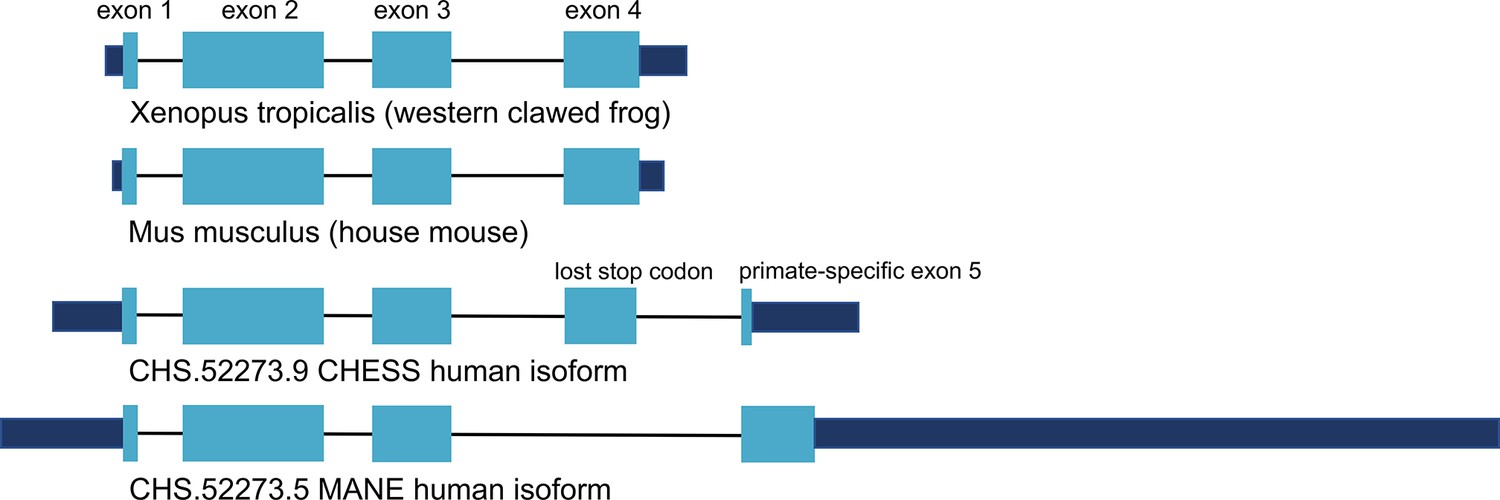
CRYGN intron-exon structure.
Comparison of gamma-N crystallin (CRYGN) transcript structures in frog, mouse, and human. Exons 1, 2, and 3 are highly conserved across all species. Exon 4 is missing from the poorly folding Matched Annotation from NCBI and EMBL-EBI (MANE) isoform, while exon 5 shows no homology to any species outside of primates. The loss of a stop codon in human exon 4 appears to be balanced by the inclusion of a short novel exon that adds only four amino acids to the final protein. Coding portions of exons are shown with thicker rectangles in teal. Intron lengths are reduced proportionately for the purpose of display.
Figure 5
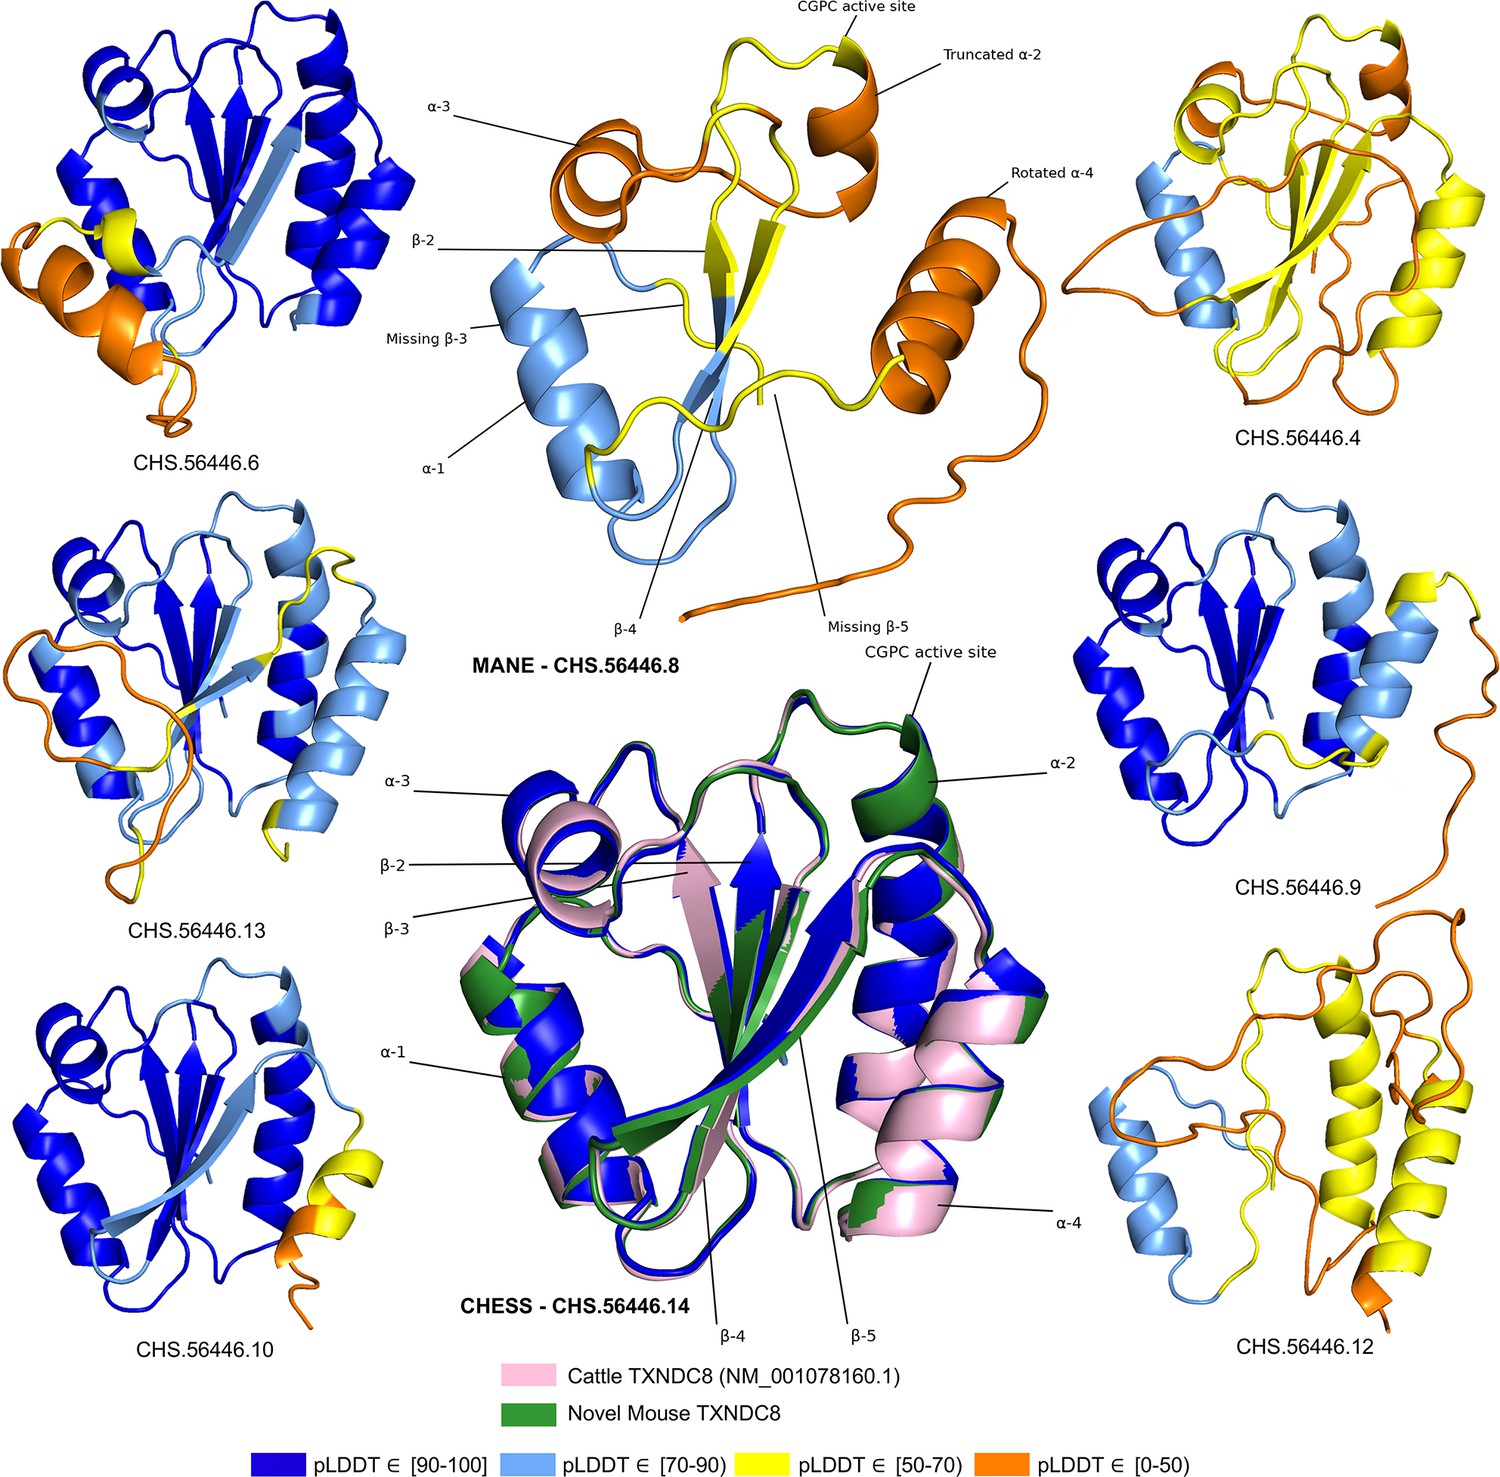
TXNDC8 isoform comparison.
Predicted protein structures for seven distinct human isoforms of thioredoxin domain-containing protein 8 (TXNDC8), as well as the primary cattle transcript and a novel mouse transcript. Alternate human isoforms 4, 9, and 12 (right side of figure) lack multiple canonical thioredoxin structures and thus appear non-functional. Several canonical protein motifs are missing or altered in the predicted structure of the Matched Annotation from NCBI and EMBL-EBI (MANE) transcript (top center). In contrast, the alternate human transcript 14 matches cattle and mouse to within 0.8 Å. Human transcript CHS.56446.14 is colored solid dark blue because every amino acid residue scores a predicted local distance difference test (pLDDT) above 90.
Figure 6
IL36B isoform comparison.
Comparison of predicted structures for interleukin 36 beta (IL36B) for the Matched Annotation from NCBI and EMBL-EBI (MANE) isoform (CHS.30565.1, RefSeq NM_014438.5, GENCODE ENST00000259213.9) and an alternate isoform from Comprehensive Human Expressed SequenceS (CHESS) and RefSeq (CHS.30565.4, RefSeq XM_011510962.1). The highly conserved protein sequence of the alternate human isoform achieves a very high predicted local distance difference test (pLDDT) score of 93.0, versus the MANE isoform’s much lower pLDDT of 50.2.
Figure 7
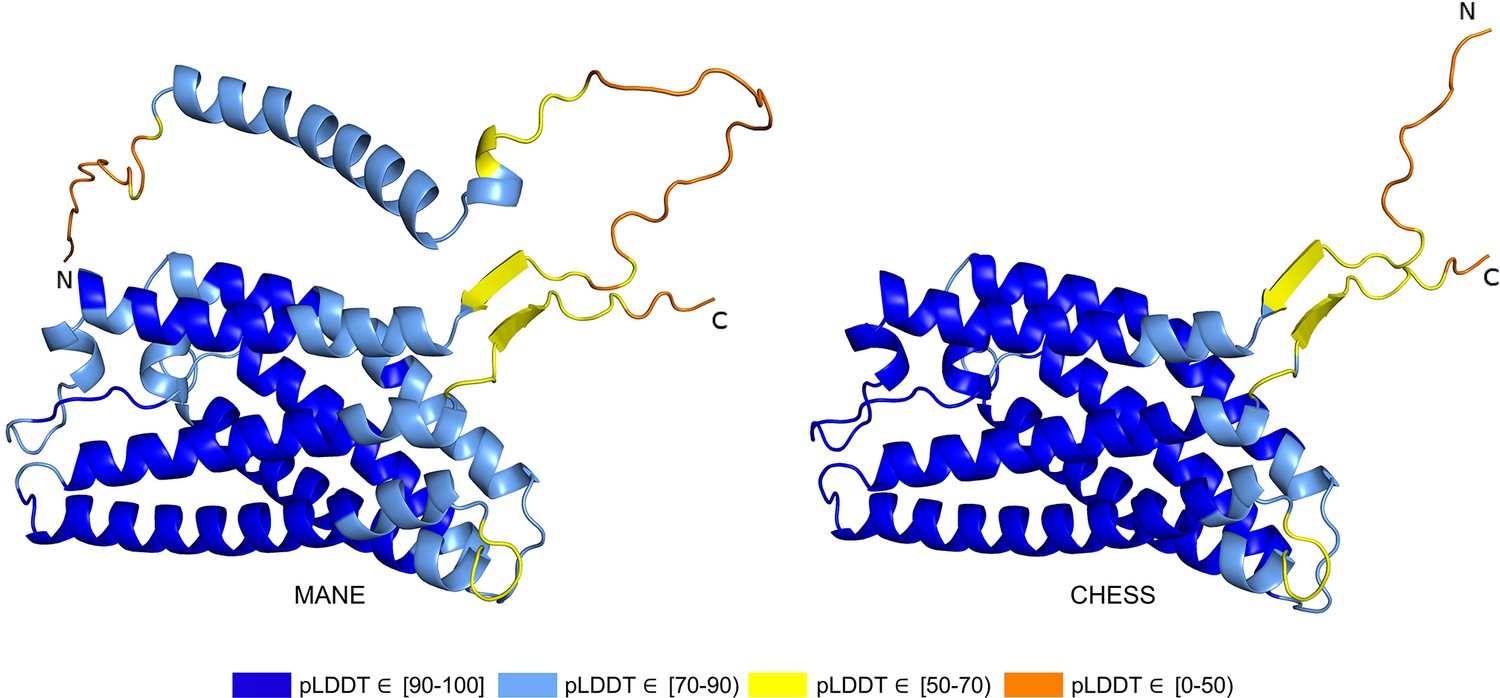
PGAP2 isoform comparison.
Comparison of the structure of the Matched Annotation from NCBI and EMBL-EBI (MANE) isoform (CHS.7860.58, RefSeq NM_014489.4, GENCODE ENST00000278243.9) versus the highest scoring alternate isoform (CHS.7860.59, RefSeq NM_001256240.2, GENCODE ENST00000463452.6) for PGAP2. Of 33 distinct annotated protein isoforms of PGAP2, the one with the highest predicted local distance difference test (pLDDT) represents the biologically active version (Hansen et al., 2013; Krawitz et al., 2013) of PGAP2 in humans.
Figure 8
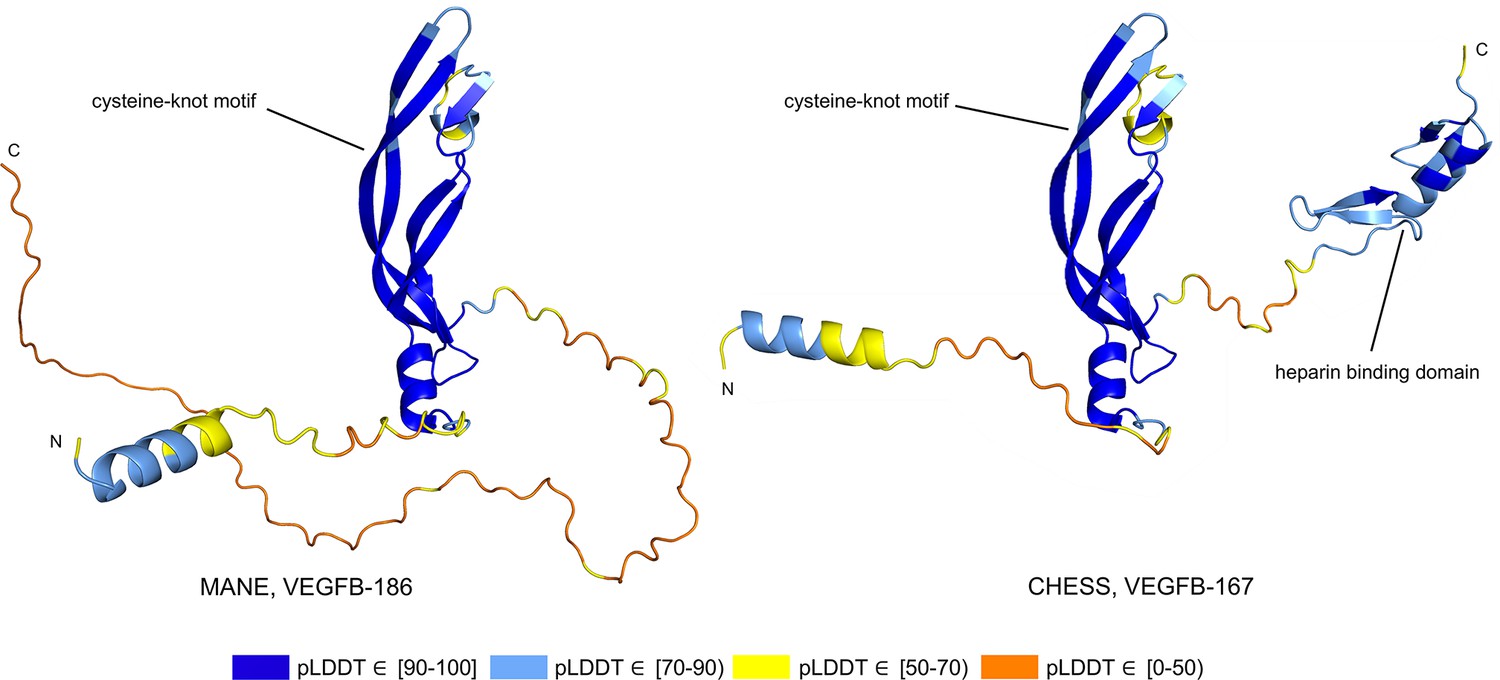
Vascular endothelial growth factor B (VEGFB) isoform comparison.
VEGFB isoforms VEGFB-186 (a) and VEGFB-167 (b). The inclusion of a heparin binding domain in VEGFB-167 results in sequestration to the cell surface while VEGFB-186 remains freely soluble. Relying solely on predicted local distance difference test (pLDDT) comparisons in this case would be misleading, as both isoforms represent well-understood functional protein products.
Figure 9
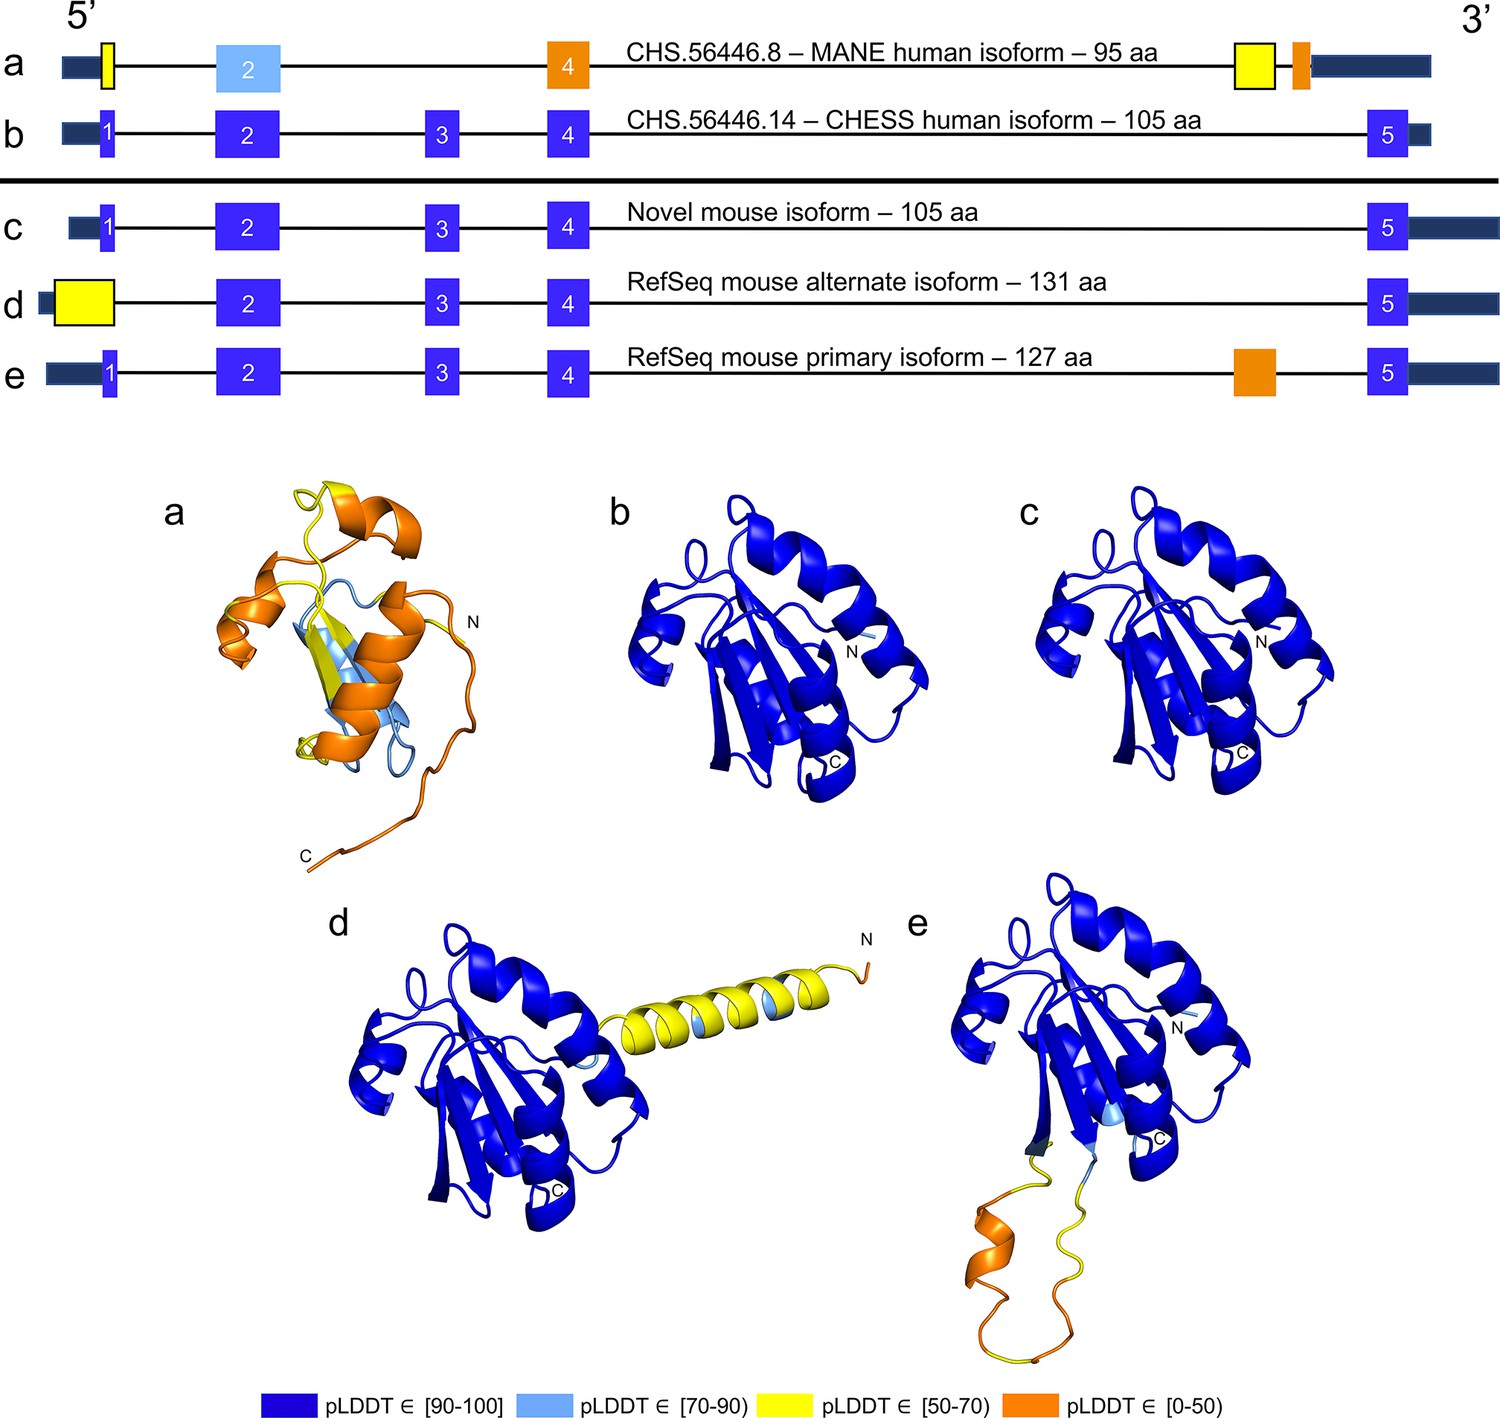
TXNDC8 human and mouse comparison.
Intron-exon and predicted protein structure for TXNDC8 in human (a and b) and mouse (c, d, and e). Exons are colored according to their average predicted local distance difference test (pLDDT) score. The highest-scoring isoforms in both human (b) and mouse (c) share conserved intron-exon structure and nearly identical predicted protein structure.
Videos
Video 1
CRYGN comparison.
A three-dimensional (3D) animation comparing the predicted protein structure of the Matched Annotation from NCBI and EMBL-EBI (MANE) isoform (CHS.52273.5, RefSeq NM_144727.3, GENCODE ENST00000337323.3) of gamma-N crystallin (CRYGN) versus the predicted protein structure for the highest-scoring CRYGN alternate isoform (CHS.52273.9, GENCODE ENST00000644350.1).
Additional files
-
Supplementary file 1
All isoform summary.
Folding scores from ColabFold for each transcript from a preliminary new build of the Comprehensive Human Expressed SequenceS (CHESS) database that contained a protein-coding sequence (CDS) that was under 1000aa in length. For transcripts already contained in the released CHESS v3.0 database, the identifier from that database is provided. If the transcript maps to a known gene locus X but is a novel isoform, it is shown with the identifier CHS.X.altY. If a transcript occurs at a novel locus X, the identifier is hypothetical.X.Y, where Y identifies the isoform number. Additional columns show the gene name, the RefSeq ID (release 110), the GENCODE ID (release 40), the predicted local distance difference test (pLDDT) (folding) score, and a flag indicating whether all intron boundaries (for multi-exon genes) are conserved in the mouse genome.
- https://cdn.elifesciences.org/articles/82556/elife-82556-supp1-v3.csv
-
Supplementary file 2
Matched Annotation from NCBI and EMBL-EBI (MANE) comparison summary.
Folding scores and additional data for all Comprehensive Human Expressed SequenceS (CHESS) transcripts that match genes in the MANE v1.0 dataset, limited to protein sequences under 1000aa in length. Transcripts must overlap the annotated CDS of the MANE transcript to be included. Columns include: CHESS_ID_isoform, the CHESS identifier of the alternate isoform transcript; CHESS_ID_MANE, the CHESS identifier of the MANE transcript at the same locus; gene, the gene name; aa_length_isoform, the amino acid length of the alternate isoform’s CDS; aa_length_MANE, the amino acid length of the MANE transcript’s CDS; length_ratio, the ratio of the alternate isoform length to the MANE isoform length; pLDDT_isoform, the predicted folding score of the alternate isoform; pLDDT_MANE, the predicted folding score of the MANE isoform; pLDDT_ratio, the ratio of the alternate isoform folding score to the MANE isoform folding score; GTEx_samples_observed_isoform, the total number of GTEx samples where the alternate isoform was observed at least once; GTEx_samples_observed_MANE, the total number of GTEx samples where the MANE isoform was observed at least once; GTEx_top_tissue_name_isoform, the name of the tissue in which the alternate isoform was observed in the highest number of samples; GTEx_top_tissue_name_MANE, the name of the tissue in which the MANE isoform was observed in the highest number of samples; GTEx_top_tissue_TPM_isoform, the average TPM of the alternate isoform in the named tissue; GTEx_top_tissue_TPM_MANE, the observed transcripts per million (TPM) of the MANE isoform in the named tissue; introns_conserved_in_mouse_isoform, an indicator of whether introns are conserved between the alternate human isoform and any annotated isoform in the GRCm38 mouse reference genome; introns_conserved_in_mouse_MANE, an indicator of whether introns are conserved between the MANE human isoform and any annotated isoform in the GRCm38 mouse reference genome.
- https://cdn.elifesciences.org/articles/82556/elife-82556-supp2-v3.csv
-
Supplementary file 3
Matched Annotation from NCBI and EMBL-EBI (MANE) comparison summary, filtered subset.
A filtered set of Comprehensive Human Expressed SequenceS (CHESS) transcripts compared to MANE according to the criteria detailed in the ‘Filtering MANE comparisons’ section of the Materials and methods. Uses the same column names as Supplementary file 2.
- https://cdn.elifesciences.org/articles/82556/elife-82556-supp3-v3.csv
-
MDAR checklist
- https://cdn.elifesciences.org/articles/82556/elife-82556-mdarchecklist1-v3.pdf
Download links
A two-part list of links to download the article, or parts of the article, in various formats.
Downloads (link to download the article as PDF)
Open citations (links to open the citations from this article in various online reference manager services)
Cite this article (links to download the citations from this article in formats compatible with various reference manager tools)
Structure-guided isoform identification for the human transcriptome
eLife 11:e82556.
https://doi.org/10.7554/eLife.82556


